



Riverine ecosystems are fundamental to both ecological integrity and human well-being, providing essential services such as habitat for aquatic life, water for consumption, and support for agriculture and industry. Several practical ways to identify riverine ecosystems include quantifying chemical, physical, and bacteriological properties [1] and classifying the quality into a water quality index (WQI) or water quality aptitude (WQA) [2] to assess the potential for water use. Recognising the critical link between river flow and ecosystem health, the concept of Environmental Flow (EF) has emerged as a cornerstone of sustainable water resource management [3]. One example of water resource management is the presence of a dam or reservoir in a river. In that context, the dam’s presence significantly altered flow duration, flood frequency, and magnitude [4]. Especially in Southeast Asia, the development of water resource management, such as irrigation and hydropower dams, deforestation, land degradation, mining, climate change, river flow diversion, and other activities, has led to the alteration of environmental flows [5]. As a consequence of water resources development, past work will have impacts on system rehabilitations, compensation costs and future mitigation of new water resources developments.
Environmental flow is defined as the quantity, timing, and quality of water flows required to sustain freshwater and estuarine ecosystems, and the human well-being that depends on them. Prioritising policies that account for the importance of environmental flows will improve water security by ensuring the target volume of water required to meet water needs, including environmental flows, is met [7]. Thus, the policy framework will encourage better resource analysis in more appropriate water allocation management, especially during low-flow water conditions [8], thereby facilitating the formulation of relevant national policies [9]. The presence of policies is vital for maintaining optimal environmental flow by ensuring the river’s continuous availability of its native organisms while also regulating pollution and sedimentation levels. In this regard, the critical link between flow rates and water quality has been established, with sufficient discharge necessary to regulate pollutant concentrations [10] and determine the overall water availability footprint [11]. Furthermore, the development of EF methodologies has evolved from desktop hydrological assessments in data-scarce regions [12] and comprehensive reviews of low-flow hydrology [13] to broad global surveys that categorise hundreds of assessment techniques [14]. The use of multi-criteria decision analysis frameworks offers a systematic approach for prioritising diverse EF components, providing support for complex hydrological decision-making [15].
Implementing EF faces two primary challenges, particularly in developing countries. Firstly, regulated rivers, such as those controlled by a dam, exhibit highly disrupted natural flow regimes. Growns [16] demonstrated that such regulations significantly alter macroinvertebrate assemblages, while Lopez-Moreno et al. [17] highlighted how reservoir management creates artificial storage regimens. Furthermore, Pennock et al. [18] correlated these flow alterations directly with declining fish populations. In Indonesia, initial regulatory efforts utilised simple hydrological indices such as the Q95 flow rate [19]. While these hydrological approaches are commonly used in a tropical region context [20], the other approach defines maintenance flows without directly accounting for ecological processes [21] or species-specific biological needs [22].
Secondly, advanced, ecological-rich assessment methods require extensive, species-specific microhabitat data. The foundational work on the In-Stream Flow Incremental Methodology (IFIM) by Bovee et al. [23] established the necessity for detailed hydraulic-biological integration. More recently, Hansen et al. [24] emphasised the importance of evolving these models for novel riverscapes. The complexity and cost of these methods have created a critical need for more streamlined, data-efficient techniques that deliver reliable results with limited data availability, particularly when urgent conservation actions are needed. In this context, Forcelini et al. [25] highlight the nuances of microhabitat selection, while Wegscheider et al. [26] advocate for combining expert opinion with hydrodynamic modelling to improve management efficiency.
Addressing these gaps requires a paradigm shift toward integrated, data-efficient methodologies. Recent research emphasises two critical components. The first is a species-centred habitat approach that addresses data scarcity by adapting frameworks such as IFIM [27]. Instead of relying on full Habitat Suitability Index curves, these methods can leverage generalised databases of fish swimming performance to establish velocity thresholds [28]. This approach offers a scientifically grounded foundation for linking hydraulic simulations to habitat suitability [21]. The second, equally crucial component is the integration of water quality [29], [30]. The ecological health of riverine systems is intricately linked to both the magnitude and the quality of flows [31]. Yet, flow assessment and water quality evaluation often remain separate, representing a critical gap in holistic ecosystem-based river management [32].
This study utilises the Citarum River in West Java, Indonesia, as a critical case study to test the integrated approach. As the longest river in West Java, the Citarum is harnessed by a cascade of three large multi-purpose dams, Saguling, Cirata, and Jatiluhur [33], which regulate its flow for essential benefits, including hydropower and irrigation [34]. The operation of the cascade system, particularly the multi-objective optimisation for hydroelectric exploitation, has been a key research topic [35]. The river section downstream of the Cirata Dam exemplifies a regulated river where outflow patterns are highly influenced by hydropower operations [36]. Consequently, the river faces several serious problems, including severe pollution from industrial and domestic waste, habitat degradation, and sedimentation [37]. Addressing these complex conditions requires the attention of various stakeholders, including government agencies, local communities, industries, and non-governmental organisations, prompting the government to issue strategic regulations for its rehabilitation [38]. Therefore, evaluating the existing Q95 maintenance flow against comprehensive ecological criteria is crucial for informed water management and the long-term health of the river.
The objectives of this research are: 1) To evaluate the performance of the existing maintenance flow rate (Q95) based on integrated habitat suitability and water quality criteria in the Citarum River downstream of the Cirata Dam; 2) To compare the hydrological approach (e.g. Q95) with the proposed integrated hydraulic-habitat-water quality approach to determine the most appropriate EF assessment strategy for regulated river conditions; 3) To formulate an integrated environmental flow rate recommendation that supports the sustainability of the aquatic ecosystem while considering both flow quantity and water quality dynamics.
The significance of this study lies in proposing and testing a novel, integrated environmental flow (EF) assessment framework specifically designed for data-scarce, highly regulated river systems like the Citarum River cascade. This dual-faceted methodology advances the state of the art by combining an adapted hydraulic-habitat simulation (utilising species-specific fish swimming performance data) with a statistical water-quality assessment. This integration provides greater ecological realism than conventional hydrological methods (e.g., the Q95 method). The reported work’s impact is the formulation of a practical, scientifically rigorous EF recommendation that addresses both flow quantity and water quality dynamics, enabling water resource managers to make more sustainable decisions for the long-term health of aquatic ecosystems in critical hydropower-regulated rivers.
Despite significant advances in Environmental Flow Science, a persistent gap remains in the development of ecologically meaningful EF assessment methods for highly regulated, data-scarce river systems, particularly in tropical regions. Existing approaches are still dominated by hydrology-based indices (e.g., fixed percentile flows), which implicitly assume stationary flow-ecology relationships and neglect the compounded effects of hydraulic habitat alteration and deteriorating water quality downstream of reservoirs. While process-based and habitat simulation models have been widely applied in data-rich temperate rivers, their transferability to regulated tropical rivers is constrained by limited biological data and complex operational controls. This study addresses this gap by proposing an integrated environmental flow assessment framework that couples adapted hydraulic-habitat simulations, informed by species-specific fish swimming performance, with statistical water-quality constraints. By testing this framework in a representative reservoir-regulated river cascade, the study advances EF methodology beyond flow-quantity paradigms and provides a transferable, ecologically grounded approach for sustainable river management under hydropower regulation.
The principal advantage of the proposed environmental flow assessment framework lies in its high adaptability to regulated, data-scarce river systems. By integrating hydraulic-habitat simulations based on generic fish swimming performance traits with statistically derived water quality constraints, the method reduces dependence on long-term ecological datasets while retaining ecological relevance. This modular structure allows the framework to be adjusted to different river types, species assemblages, and management objectives, making it transferable beyond the specific case study. Moreover, the approach explicitly accounts for operational flow regulation and water quality degradation, factors often overlooked by conventional hydrology-based methods. However, the method also has limitations. Its accuracy depends on the representativeness of selected hydraulic indicators and proxy biological traits, which may oversimplify complex ecological responses. In addition, the approach requires hydraulic modelling and water quality data of sufficient resolution, which may limit its straightforward application in systems with extremely sparse monitoring. Despite these constraints, the framework offers a pragmatic balance between scientific rigour and practical applicability, particularly in regions where traditional ecohydrological methods are either infeasible or ecologically inadequate.
This research utilises a comprehensive set of datasets to support hydrological analysis, hydraulic modelling, habitat suitability analysis, and water quality assessment for environmental flow assessment in the downstream reach of the Cirata Dam. An overview of all datasets is provided in Table 1. Daily discharge data from 1996 to 2022 were obtained from the Research Institute for Water Resources Development under the Ministry of Public Works and Housing, and used to characterise the long-term flow regime and derive low-flow statistics relevant to current river management practices in Indonesia [39]. Topographic data were derived from an eight-metre resolution Digital Elevation Model (DEM) provided by the Geospatial Information Agency of Indonesia. These data were supplemented with field-surveyed river cross-sections at three monitoring stations to improve the representation of channel geometry for hydraulic modelling.
Dataset parameters
Parameter |
Type of data |
Source |
|---|---|---|
Cirata outflow |
Daily discharge data from Cirata Hydropower Outlet (1996‒2022) |
Research Institute for Water Resources Development Agency or Research and Development, Ministry of Public Works |
Topography |
Digital Elevation Model (DEM) |
Geospatial Information Agency (BIG) of Indonesia |
Fish population |
Species, morphology, characteristics |
Interview data and [40] |
Water quality |
Monthly water quality data from Cirata Hydropower Outlet (2014‒2022) |
PJT II (Perum Jasa Tirta II) company |
Discharge observation data |
Velocity and depth of river flow |
Observed data |
Fish population information, including species composition and basic morphological characteristics, was collected through interviews with local fishers and community members, supplemented by local studies [40]. Target indicator species were identified, and their swimming performance parameters were obtained from the Fish Swimming Performance Database [28] to support habitat suitability simulation. Water quality data from 2014 to 2022, obtained from the company Perum Jasa Tirta II, provide additional insight into habitat conditions by tracking critical parameters such as dissolved oxygen, temperature, and turbidity. Furthermore, discharge observation data, including field measurements of velocity and depth, were collected specifically during the survey campaign to calibrate and validate hydraulic simulations, ensuring accurate assessments of flow-habitat interactions in the study area.
This study employed an integrated, species-centred assessment framework tailored for regulated and data-scarce rivers. The methodology was designed to link hydrological variability, hydraulic modelling, adapted habitat suitability assessment, and water quality evaluation.
The overarching goal is to determine an environmental flow magnitude that optimally balances the physical habitat requirements of indicator fish species with the need to maintain river water quality standards. The analytical steps are structured to maximise ecological realism despite data limitations, specifically by linking hydraulic parameters (velocity and depth) with ecological criteria (a fish swimming performance database) and statistically modelling the flow-quality relationship. The following sub-sections detail the specific analyses, moving from the baseline hydrological characterisation to the final integrated environmental flow recommendation.
Hydrological index methodologies were applied to characterise the flow regime and identify a set of discharge scenarios relevant to subsequent hydraulic and ecological determination. These methods utilise daily outflow data from the Cirata Dam (1996‒2022) to understand the long-term variability and critical low-flow thresholds under the regulated river conditions. Two complementary analyses were conducted: the Flow Duration Curve (FDC) method to describe long-term flow variability and the Low Flow Index method to identify critical discharge threshold under regulated river conditions.
The FDC is a graphical representation of the statistical relationship between streamflow magnitude and its exceedance probabilities over a specified period. This analysis was conducted using daily outflow data from Cirata Dam, which were sorted and analysed using the Weibull plotting position to estimate exceedance probabilities [41].
where m is the sorted data rank, and N is the total length of the data series. Key discharge indices were extracted from the FDC to represent maintenance flows currently utilised in Indonesia and potential environmental flow thresholds. The selected flows were Q97.5, Q95 (representing the existing regulatory maintenance flow), and Q90. These indices form the potential flow scenarios for the hydraulic modelling phase.
Low Flow Frequency (LFF) analysis was performed to identify the ecologically critical low-flow discharges that represent baseflow conditions during prolonged dry periods, ensuring a robust evaluation of habitat sustainability. This analysis focused on the annual minimum 7-day average discharge (Q7), given its established relevance for baseflow conditions that sustain aquatic habitats [13], [42]. Both the Gumbel minimum and Weibull minimum distributions were evaluated to estimate low-flow quantiles for return periods of 2, 5, and 10 years (7Q2, 7Q5, and 7Q10). These low-flow quantiles serve as additional, extreme low-flow scenarios for hydraulic and ecological testing.
The final set of discharge scenarios, encompassing the FDC-derived indices (Q90, Q95, and Q97.5) and the LFF-derived quantiles (7Q2, 7Q5, and 7Q10), was used collectively as input for the hydraulic modelling to evaluate the corresponding habitat suitability and water quality criteria. The lowest average discharge of 7 consecutive days from 1996 to 2022 has a sample mean and standard deviation that are assumed to be good estimates for E[Z] and σ [Z],respectively, are 80.93 m3/s and 22.02 m3/s. Solutions to the system formed give α = 17.18 and β = 90.84. With these results and γ = ‒1.1396, by making the return periods 10, 5, and 2 years, the estimated values of the 7Q10, 7Q5, and 7Q2 Gumbelmin models are z (T = 10) = 52.19 m3/s, z(T = 5) = 62.08 m3/s, and z(T = 2) = 84.55 m3/s. From the same E[Z] and σ[Z], it follows that CVz = 0.272. Furthermore, α = 4.13, A(α) = 0.91, and β = 89.11. Finally, with these results and by making return periods 10, 5, and 2 years, the values of the 7Q10, 7Q5, and 7Q2 with the Weibullmin model are z(T = 10) = 51.69 m3/s, z(T = 5) = 61.99 m3/s, and z(T = 2) = 81.55 m3/s.
Hydraulic modelling for flow analysis was conducted using the HEC-RAS software (version 6.3.1). This model is used to estimate flow parameters such as flow velocity and flow depth based on different discharge scenarios. In this study, the simulation uses a one-dimensional (1D) steady-flow approach, assuming constant conditions over time, to analyse flow conditions over a specific period. It is used when flow changes are considered insignificant during the analysed period. Thus, the simulation results are simpler and focus on a more stable flow distribution. The model domain was constructed using the Digital Elevation Model (DEM), supplemented by field-surveyed cross-sections at the three monitoring points (STA 1100, 3450, 5200) to ensure accurate river bathymetry.
The model setup for hydraulic simulation includes the definition of both upstream and downstream boundary conditions. The upstream boundary condition is represented by fixed discharge scenarios (Q90, Q95, Q97.5, 7Q2, 7Q5, and 7Q10) obtained from the hydrological analysis results. Meanwhile, the downstream boundary condition is defined using the Normal Depth method, calculated based on the average bed slope of the modelled river reach. This approach assumes that the flow at the downstream end is uniform and unaffected by the dam’s backwater influence.
In the context of steady, gradually varied flow
and the momentum equation is expressed as
where x is the space coordinate along the channel axis, h is the depth, Vx is the flow velocity in the x direction, g is the acceleration due to gravity, Sf the frictional slope, and S0 is the bed slope.
The phenomenon of critical flow is indicated by the water surface elevation (WSE) being very close to or aligned with the critical depth line. This condition indicates that the Froude number (Fr) approaches one, which signifies a transition between subcritical and supercritical flow.
Recognising that the bed slope
Among these, the first term, which reflects the velocity head gradient, becomes dominant as the flow approaches a critical condition. At this point, the flow velocity increases significantly relative to the flow depth, causing the Froude number to approach unity (Fr = 1). Thus, the velocity term serves as the key indicator in identifying and characterising critical flow transitions within the hydraulic model. Hence, this phenomenon of critical flow often occurs in channels with a high gradient [43] to [45].
The Manning’s roughness coefficient (n) is the critical parameter influencing flow velocity and depth. The initial values of n were estimated based on channel characteristics (e.g., riverbed material and vegetation) [46]. The final value was determined by calibration, comparing simulated velocity and depth profiles with field-measurement data collected at the three monitoring points (STA 1100, 3450, and 5200) during a specific measured discharge.
The calibration procedure involved iteratively adjusting Manning’s n until the simulation results matched the measured values. The performance of the calibration was quantitatively evaluated using statistical metrics, specifically the Root Mean Square Error (RMSE) and the Coefficient of Determination (R2), calculated as:
where Si is the simulated value, Oi is the observed value, Ō is the mean observed value, and N is the number of observations. A final set of Manning’s n values was adopted when the resulting RMSE was below 0.1 and the R2 was above 0.85, indicating an acceptable fit for the subsequent habitat simulation.
The In-stream Flow Incremental Methodology (IFIM) is a widely recognised framework used to assess the relationship between stream flows and aquatic habitats. Developed in the late 1970s, IFIM integrates hydraulic engineering models with empirical habitat data to evaluate how changes in water flow affect the availability and quality of habitats for aquatic organisms, particularly fish [23], [47]. Habitat suitability criteria are used to represent microhabitat requirements in IFIM. Given the limitation of empirically derived Habitat Suitability Criteria (HSC) for local fish populations in the Citarum River, this study adopted an adapted, species-centred approach to derive the critical hydraulic criteria (velocity and depth).
The principles of the Fish Swimming Performance Database were utilised to determine the optimal flow parameters for habitat simulation [28]. This method links hydraulic variables (e.g., flow velocity) directly to a fish’s physiological capabilities, specifically endurance and swimming speed.
Based on local ecological knowledge and interview data [40], Cyprinus carpio, Hampala macrolepidota, Oreochromis niloticus, and Hemibagrus nemurus were selected as the key indicator species for the downstream Citarum River reach. This species represents an economically important group in the area. The criteria for flow velocity (V) and water depth (D) were derived by linking the indicator species’ morphological data to the generalised principles of the Fish Swimming Performance Database [28]. After introducing the dimensionless variables defined as follows:
the equation relating velocity, swimming distance, and fish length to translate physiological limits into hydraulic thresholds assumes the form:
where: X* denotes dimensionless swimming speed, X ‒ swimming distance [m], V* ‒ dimensionless water velocity, V ‒ water velocity [m/s], l ‒ fish length [m]; M and a are coefficients derived from dimensionless speed vs. time regression, see Table 2.
Grouped data dimensionless swim distance equations and prediction interval coefficients derived from fatigue regressions [28]
95% Prediction interval |
75% Prediction interval |
|||||||||
|---|---|---|---|---|---|---|---|---|---|---|
Group |
X vs. V co-efficients |
Upper boundary |
Lower boundary |
Upper boundary |
Lower boundary |
|||||
M |
a |
M |
a |
M |
a |
M |
a |
M |
A |
|
Catfish & sunfish |
3.89 |
‒3.95 |
31.67 |
‒3.95 |
0.48 |
‒3.96 |
13.32 |
‒3.95 |
1.14 |
‒3.96 |
Eel |
5.98 |
‒1.72 |
25.02 |
‒1.72 |
1.43 |
‒1.72 |
13.85 |
‒1.72 |
2.58 |
‒1.72 |
Herring |
59.34 |
‒1.49 |
102.93 |
‒1.49 |
34.24 |
‒1.49 |
81.97 |
‒1.49 |
42.97 |
‒1.49 |
Salmon & walleye |
26.92 |
‒2.99 |
374.99 |
‒2.99 |
1.93 |
‒2.99 |
126.33 |
‒2.99 |
5.74 |
‒2.99 |
Sturgeon |
0.01 |
‒6.67 |
0.06 |
‒6.67 |
0.001 |
‒6.67 |
0.02 |
‒6.67 |
0.002 |
‒6.67 |
Pike (derived) |
8.51 |
‒2.04 |
33.16 |
‒2.04 |
2.19 |
‒2.04 |
18.84 |
‒2.04 |
3.85 |
‒2.04 |
The HSCV was established by calculating the predicted maximum velocity that the indicator fish can maintain. The upper velocity threshold was defined by the velocity corresponding to the 50% percentile limit of the sustained swimming performance derived from the equations. Any cell in the hydraulic model with a velocity exceeding this threshold was assigned a habitat suitability index of 0 (Unsuitable), while velocities equal to or below this threshold were assigned 1 (Suitable). This approach minimises energy expenditure during daily activities while simplifying the assessment for data-scarce conditions. The HSCD was based on the minimum requirements for the indicator species’ morphology. The minimum depth threshold was set at 0.5 m. Cells with depths below this minimum were assigned HSCD = 0, and cells above were assigned HSCD = 1.
The simulated velocity and depth outputs were combined using the minimum rule to determine, for each cell, the final composite habitat suitability index HSCcomposite = min(HSCV, HSCD). The Weighted Usable Area (WUA) was then calculated as the total wetted surface area where the HSCcomposite equals 1 (Suitable). This method effectively determines the total available habitat area that simultaneously meets the minimum velocity (50% sustained swimming) and depth requirements for the indicator species. The flow scenario that yields the maximum WUA (HSCHabitat) is identified as the hydraulically optimal flow and serves as one of the primary inputs for the final integrated EF recommendation.
Before determining the swimming speed of fish species, the fish populations in the Cirata downstream were grouped according to [28]. For fish species not included in the reference list, the grouping process involved adjusting the taxonomy of relevant species to align with that of the listed fish group. Fish species classifications are summarised in Table 3.
Fish population groups and classification
Name |
Order |
Family |
Group |
Min. size [cm] |
Max. size [cm] |
|
|---|---|---|---|---|---|---|
Local |
Scientific |
|||||
Mas |
Cyprinus carpio |
Cypriniformes |
Cyprinidae |
Salmon & walleye |
25 |
36 |
Hampal |
Hampala macrolepidota |
12 |
40 |
|||
Nila |
Oreochromis niloticus |
Perciformes |
Cichlidae |
4 |
60 |
|
Tagih |
Hemibagrus nemurus |
Siluriformes |
Bagridae |
Catfish |
38 |
38 |
The other essential component of the integrated environmental flow framework is the water quality assessment, which addresses the pollution constraints prevalent in the Citarum River. The determination of water quality status at each point is carried out using the STORET method, in accordance with the Decree of the Minister of Environment of the Republic of Indonesia Number 115 of 2003 concerning Guidelines for Determining Water Quality Status [48]. Furthermore, the quality standard reference, as outlined in Government Regulation Number 22 of 2021 Class II, is used to categorise water based on its suitability for specific purposes. These purposes include infrastructure/facilities, water recreation, freshwater fish farming, livestock, agriculture irrigation, and other similar uses that require water of a comparable quality [49]. Critical parameters analysed include Dissolved Oxygen (DO), Biological Oxygen Demand (BOD), Chemical Oxygen Demand (COD), and Total Suspended Solids (TSS). This assessment establishes the current environmental condition and provides the quality standard that the minimum environmental flow must satisfy. The method for determining water quality status uses the rating system from the US EPA (Environmental Protection Agency), which classifies water quality into four classes.
Several studies have employed statistical methods such as Pearson’s correlation coefficient to analyse the relationship between water discharge and water quality parameters. For instance, a study reported significant correlations among various physico-chemical parameters, including dissolved oxygen (DO), biological oxygen demand (BOD), and total dissolved solids (TDS) with changes in water discharge levels [50]. Furthermore, flow variability has been shown to significantly affect water quality, particularly during seasonal changes, leading to higher concentrations of suspended solids and nutrients due to erosion and runoff [31], [32]. This established relationship justifies the use of empirical modelling to determine the minimum flow required to maintain water quality standards.
To determine the minimum flow required to maintain water quality above the regulatory standard, a statistical modelling approach, such as Pearson’s Correlation Coefficient (r) was employed to quantify the strength and direction of the relationship between the historical annual discharge data (Q) and corresponding water quality index status (WQIS) data of 2014‒2022.
Due to the non-linear nature of the dilution mechanism (where pollutant concentration decreases as discharge increases), Simple Non-Linear Regression was performed. After testing several common functions, the logarithmic function was selected as the final model due to its highest coefficient of determination (R2), which ensures the best statistical fit for the observed data:
where WQIS is the predicted pollutant Water Quality Index Status, Q is the discharge [m3/s], ln(Q) is the natural logarithm of discharge, β0 and β1 are the regression coefficients, and ? is the error term.
Using the validated logarithmic regression equation, the required minimum quality flow (QQuality) was calculated by setting the predicted concentration (Cpollutant) equal to the regulatory standard defined in Government Regulation No. 22 of 2021 Class II, and then solving the equation for Q. The resulting QQuality value represents the minimum flow required to maintain water quality standards through dilution.
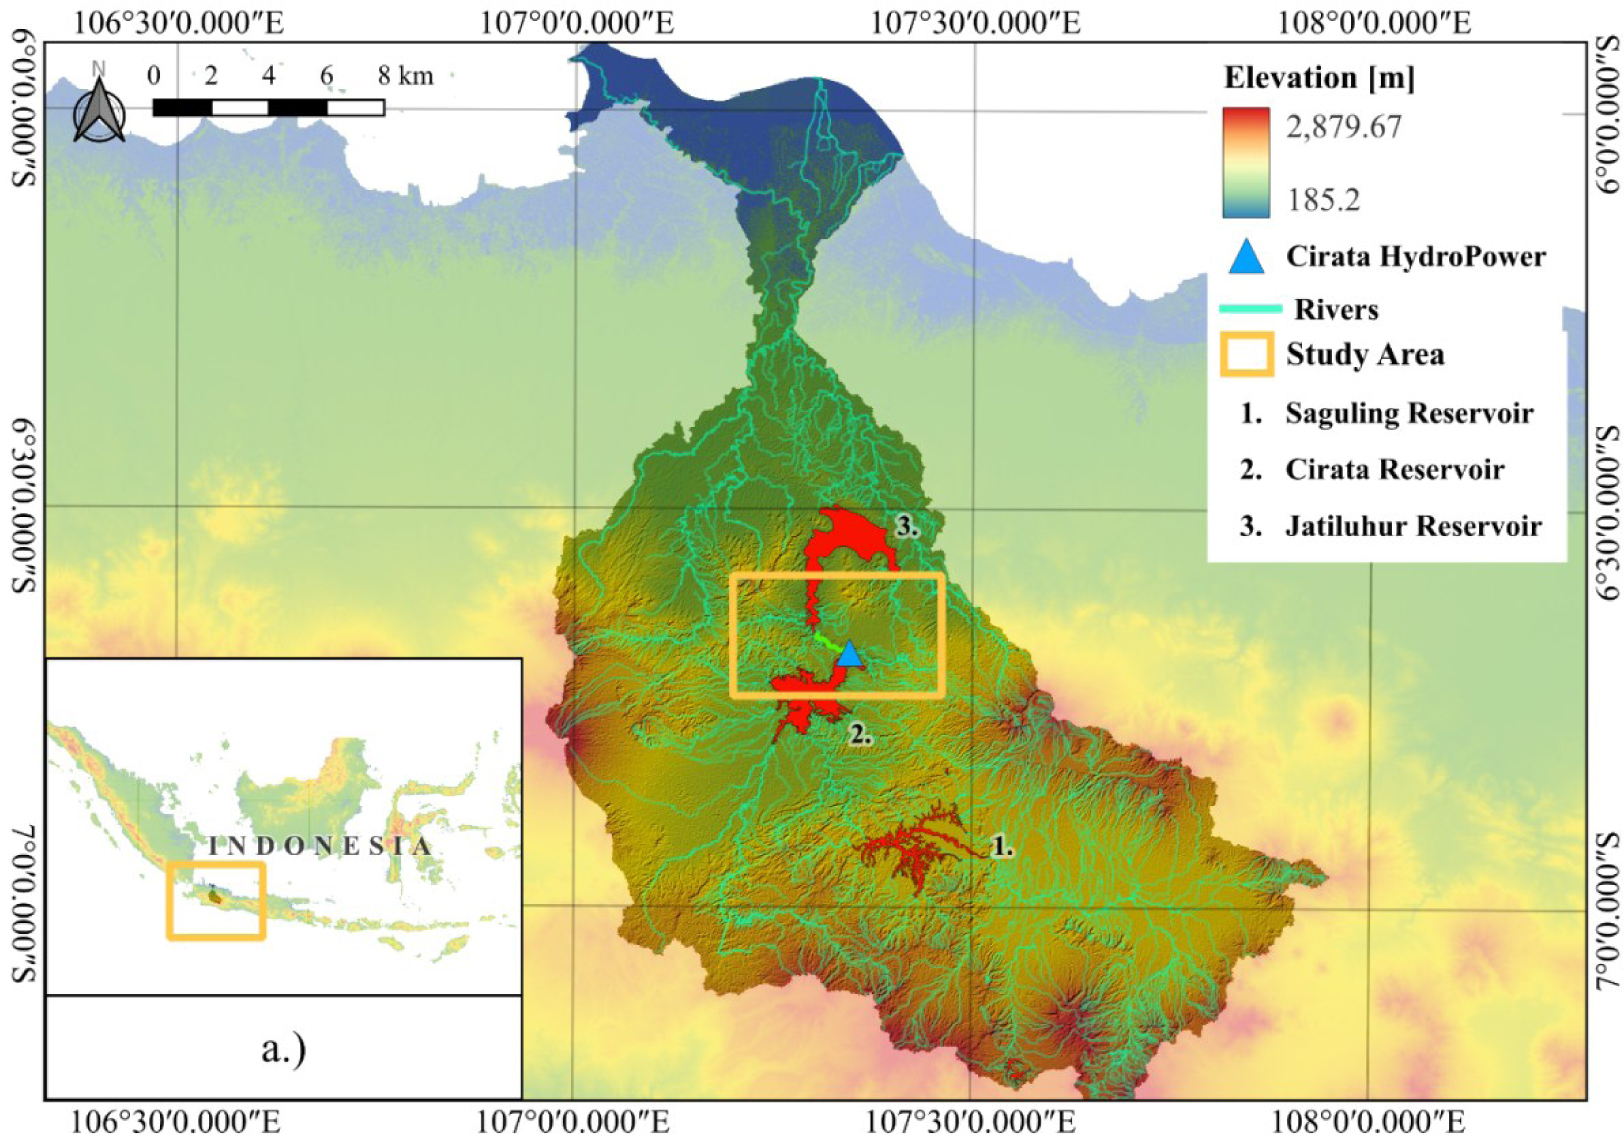
The Cirata reach forms part of the Citarum River cascade system in West Java, Indonesia, which consists of the Saguling, Cirata, and Jatiluhur reservoirs [35], [51]. The Cirata Dam serves as the intermediate reservoir, receiving inflows from both natural tributaries and the regulated outflows of the upstream Saguling Dam, and subsequently releasing water toward the Jatiluhur Reservoir. This configuration makes the flow regime downstream of the Cirata Dam highly regulated, primarily influenced by hydropower generation and irrigation demands, as shown in Figure 1.
Citarum watershed map showing the Saguling-Cirata-Jatiluhur cascade system
Measurement points STA 1100, STA 3450, and STA 5200 in the downstream study reach
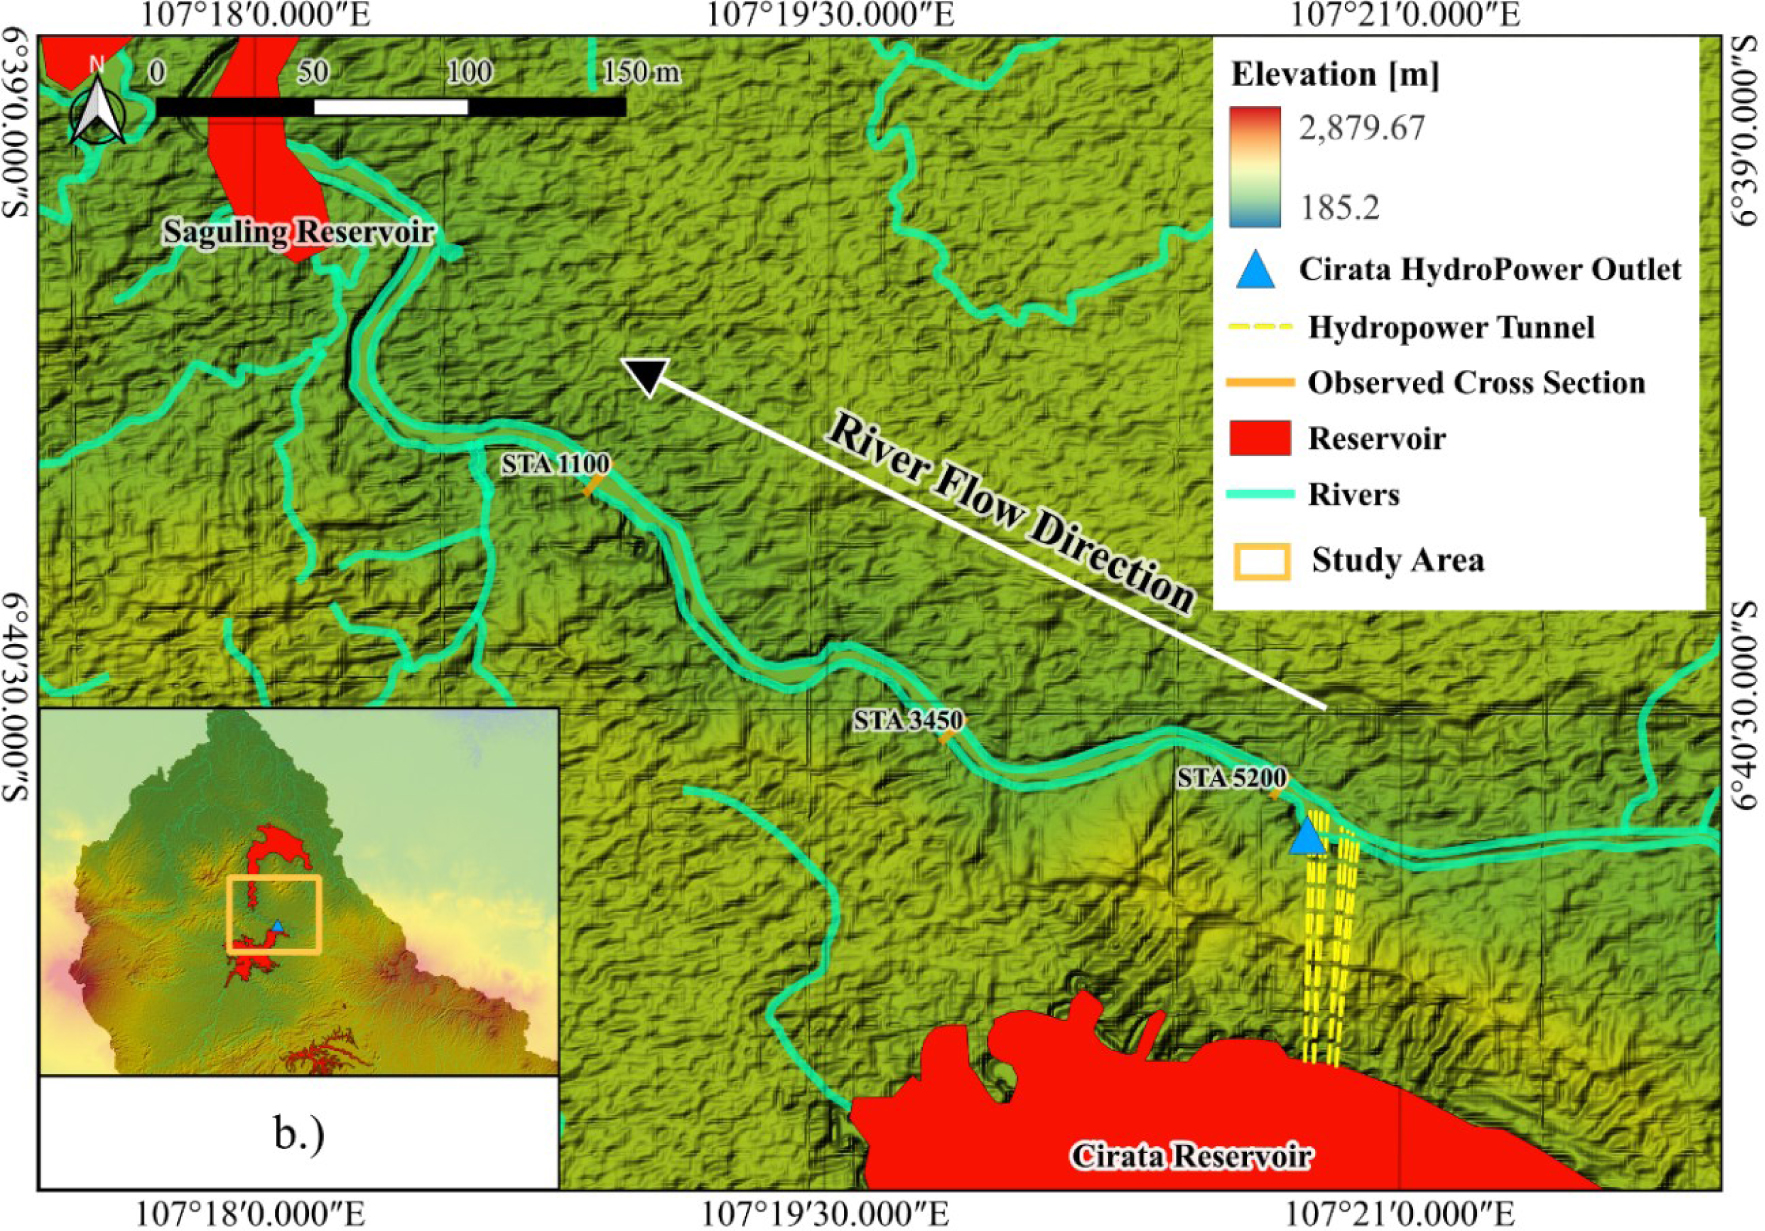
The watershed draining into the Cirata Reservoir covers an area of approximately 1,500 km2, with an average annual rainfall ranging from 1,500 to 3,000 mm/year and a mean discharge of around 165.01 to 194.19 m3/s at the dam outlet. The study reach is a 2.6‒3 km section immediately downstream of the Cirata Dam outflow. Measurements were conducted at three monitoring points along the downstream reach of the Cirata Dam(Figure 2), namely STA 1100, STA 3450, and STA 5200, to record flow velocity and water depth. Instantaneous discharge measurements were used to validate Manning’s roughness coefficient and to obtain representative cross-sectional profiles for hydraulic modelling.
Flow Duration Curve of Cirata Dam outflow
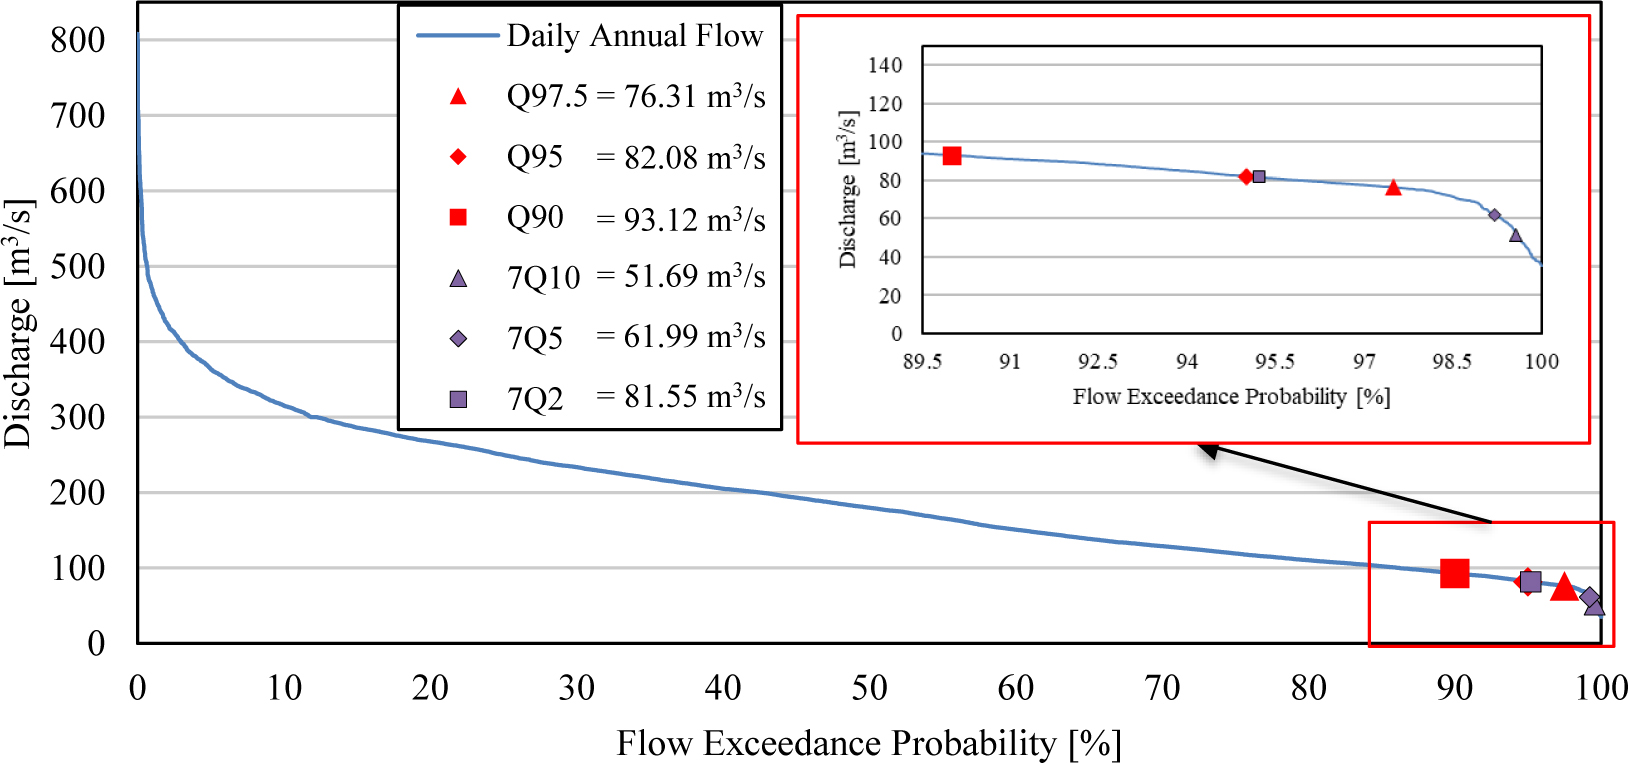
The flow regime of the Cirata Dam was characterised using the Flow Duration Curve (FDC) and Low Flow Frequency analyses. The discharge results from the Flow Duration Curve and Low Flow Frequency calculations differ. The results are visualised in Figure 3 and summarised in Table 4.
Model discharge scenarios
Model Discharge [m3/s] |
||||||||
|---|---|---|---|---|---|---|---|---|
Flow Duration Curve |
Low Flow Index |
|||||||
Gumbel minima |
Weibull minima |
|||||||
Q97.5 |
Q95 |
Q90 |
7Q10 |
7Q5 |
7Q2 |
7Q10 |
7Q5 |
7Q2 |
76.31 |
82.08 |
93.12 |
52.19 |
65.08 |
84.55 |
51.69 |
61.99 |
81.55 |
These discharge scenarios will be entered as flow data into the HEC-RAS software for modelling the river’s hydraulic flow, and thereafter, habitat simulations will be conducted to determine the suitability of the hydraulic flow depth and velocity parameters against the life requirements of each species.
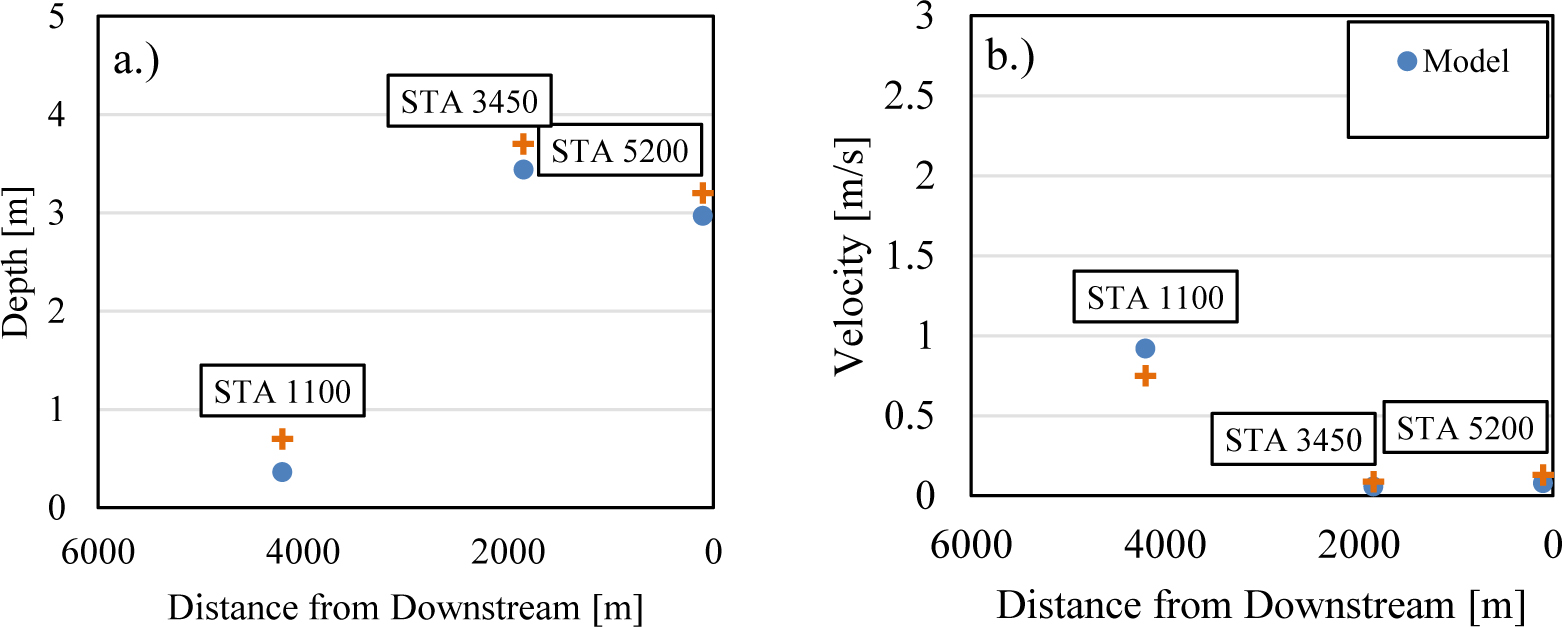
The hydraulic modelling results in Figure 4 demonstrate successful calibration with Manning's value (n) of 0.037. The validation of this modelling result was carried out by comparing field test data with software prediction results, showing a high level of accuracy (depth: R2 = 0.973, RMSE = 0.479; velocity: R2 = 0.981, RMSE = 0.052).
Calibration data for the model and observation: depth (a), velocity (b)
River longitudinal section with water surface elevation profile
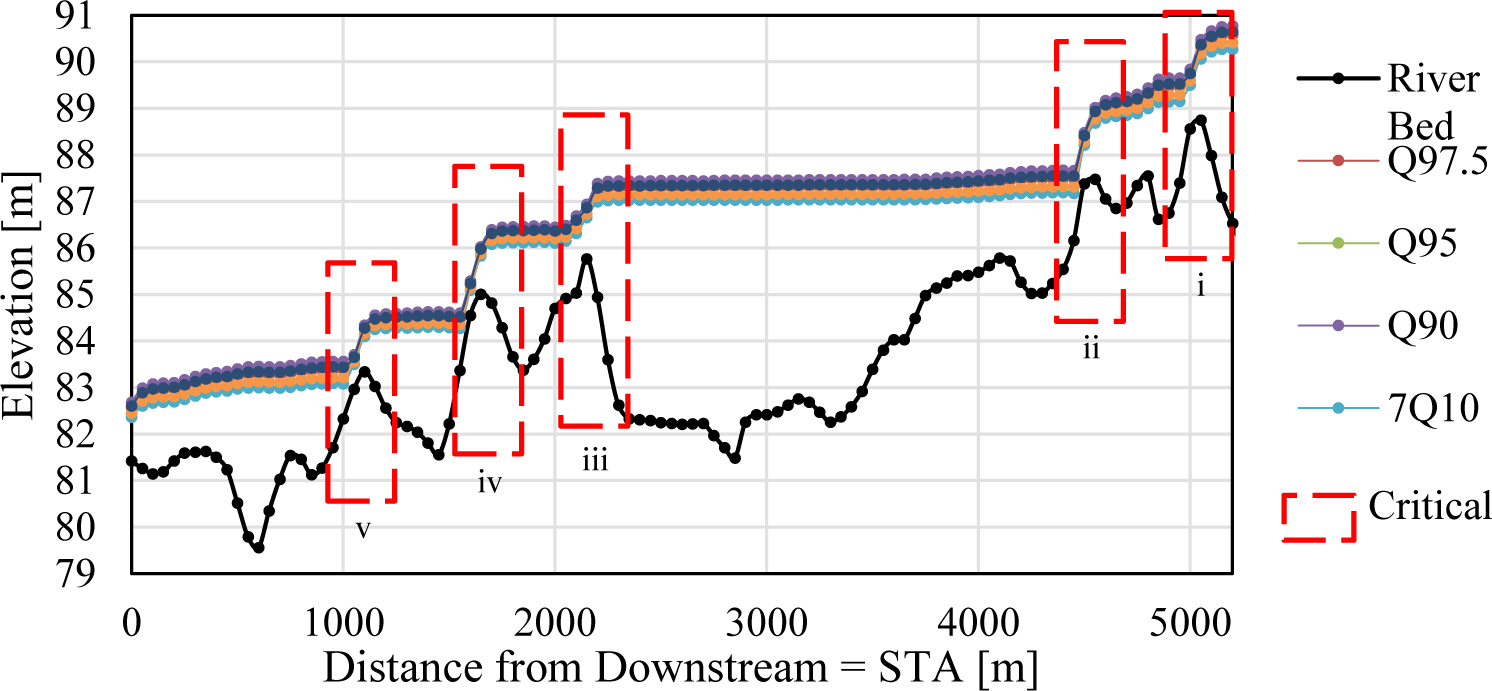
Furthermore, hydraulic modelling is carried out for each discharge scenario calculated in the hydrological analysis for the steady flow model. Figure 5 shows the hydraulic modelling results, which indicate the flow pattern formed is consistent with the topographic characteristics and the configuration of the analysed channel. Figure 5 also shows the highly variable riverbed morphology (dashed black line), with significant elevation changes. This morphological variation directly causes irregularities in water flow along the channel, with consequences for the sustainability of fish habitat.
This section discusses the results of habitat parameter calculations from the perspective of habitat suitability for the fish species Cyprinus carpio, Hampala macrolepidota, Oreochromis niloticus, and Hemibagrus nemurus. Starting with the analysis of flow velocity and depth requirements, it continues with the identification of hydraulic conditions that may pose risks to fish habitats, and the estimation of usable area percentages across habitat parameters and fish species.
Table 5 summarises the results of the calculation of flow velocity and depth parameter requirements for each of the fish species under consideration.
Results of calculating velocity and depth parameter requirements for each fish species
Name |
Group |
Velocity passage estimate [m/s] |
Min. depth estimate [m] |
|||||
|---|---|---|---|---|---|---|---|---|
Local |
Scientific |
2.5% |
12.50% |
50% |
87.50% |
97.50% |
||
Mas |
Cyprinus carpio |
Salmon & walleye |
3.90 |
2.71 |
1.62 |
0.97 |
0.67 |
0.50 |
Hampal |
Hampala macrolepidota |
3.42 |
2.38 |
1.42 |
0.85 |
0.59 |
0.50 |
|
Nila |
Oreochromis niloticus |
4.06 |
2.83 |
1.69 |
1.01 |
0.70 |
0.75 |
|
Tagih |
Hemibagrus nemurus |
Catfish |
2.02 |
1.63 |
1.19 |
0.87 |
0.70 |
0.50 |
After determining the parameter requirements for fish species, the matching process has been carried out between the hydraulic modelling results and the species’ parameter requirements. A 50 per cent estimate was chosen as the upper limit of fish speed, considering that the result of the velocity passage estimation calculation represents the limit of the fish’s ability to swim in the current.
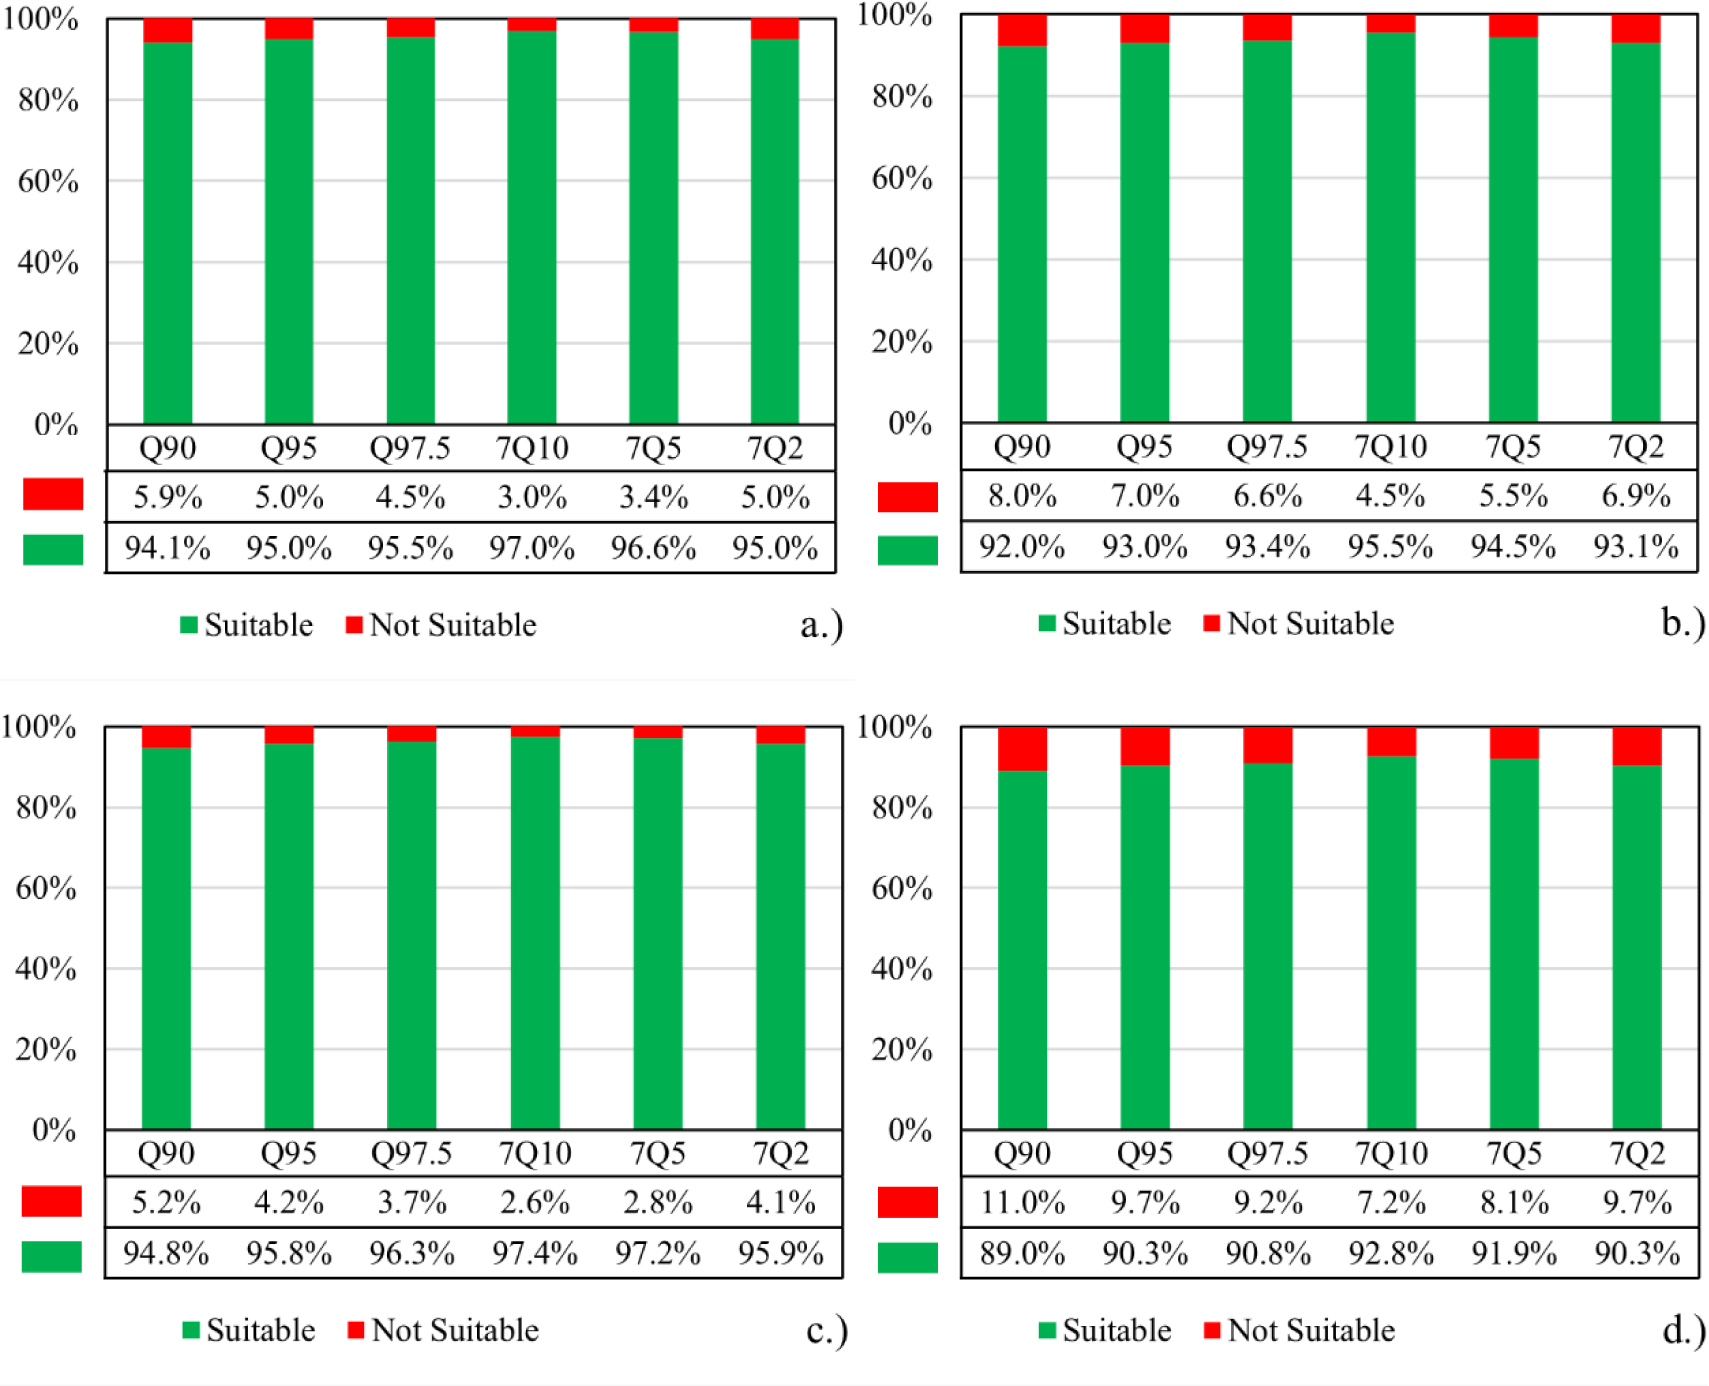
Weighted Usable Area (WUA) analysis is conducted by matching the results of river flow hydraulic modelling with the living requirements parameters of each fish species. The results are visualised in Figure 6 and Figure 7. According to the data for each species, shown in Figure 6, the percentage of discharge-area parameters indicates that higher discharge can lead to fewer fish due to higher flow depth. On the other hand, in Figure 7, where Oreochromis niloticus is considered separately from the species group Cyprinus carpio, Hampala macrolepidota, and Hemibagrus nemurus, the data indicate that higher discharge results in fewer fish due to higher flow velocities.
Weighted velocity usable area percentage for Cyprinus carpio (a), Hampala macrolepidota (b), Oreochromis niloticus (c), and Hemibagrus nemurus (d)
Weighted depth usable area percentage for Cyprinus carpio, Hampala macrolepidota, and Hemibagrus nemurus (a), and Oreochromis niloticus (b)
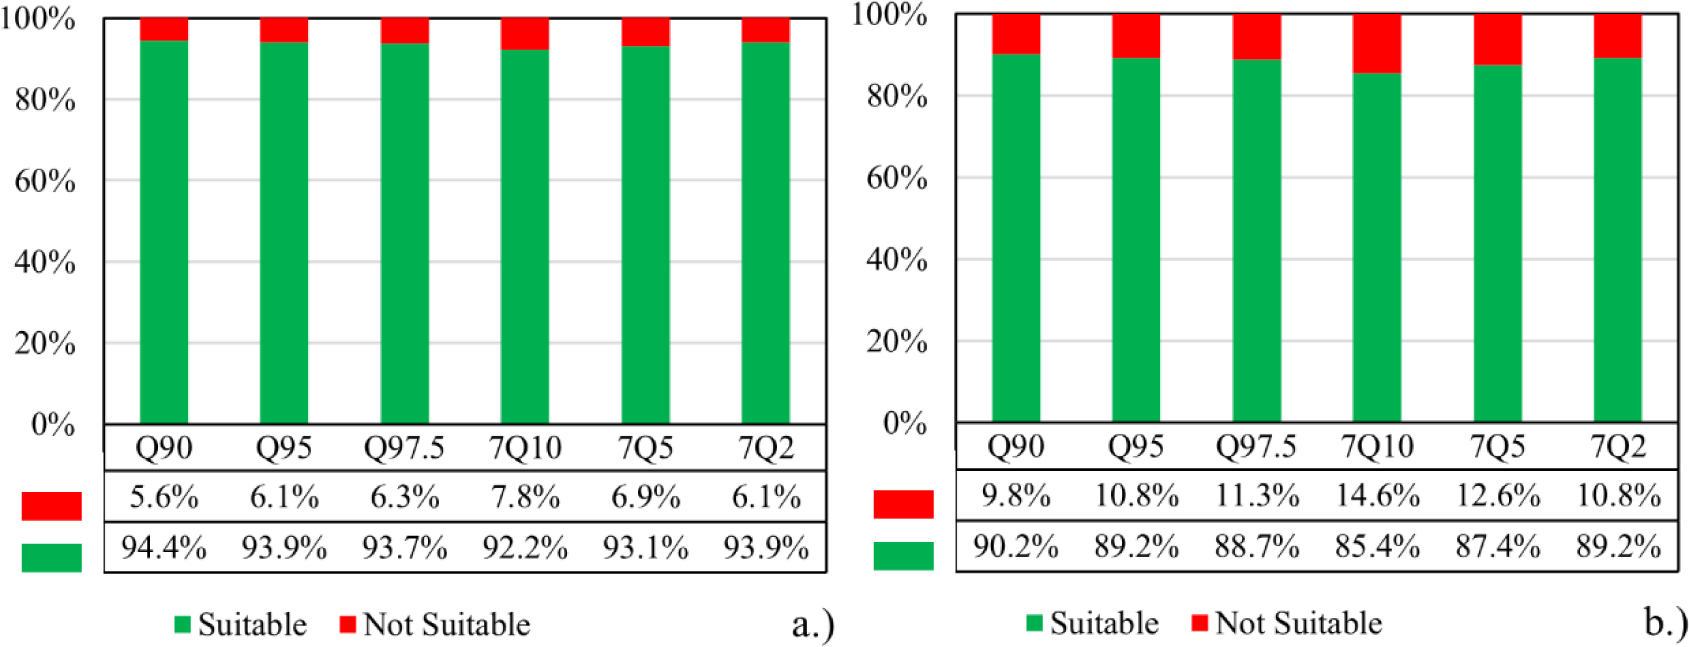
Figure 8 presents the hydraulic modelling results showing the relationship between flow velocity and water depth across multiple cross sections for each simulated discharge scenario. The figure aims to evaluate whether the hydraulic conditions at each modelled discharge meet the habitat requirements for fish species. In comparison to Figure 6 and Figure 7, which provide only the percentage of living fish species for each modelled discharge, Figure 8 offers a more detailed perspective by directly comparing hydraulic parameters relevant to fish habitat sustainability.
Model Discharge comparison with depth and velocity limit for Cyprinus carpio (a), Hampala macrolepidota (b), Oreochromis niloticus (c), and Hemibagrus nemurus (d)
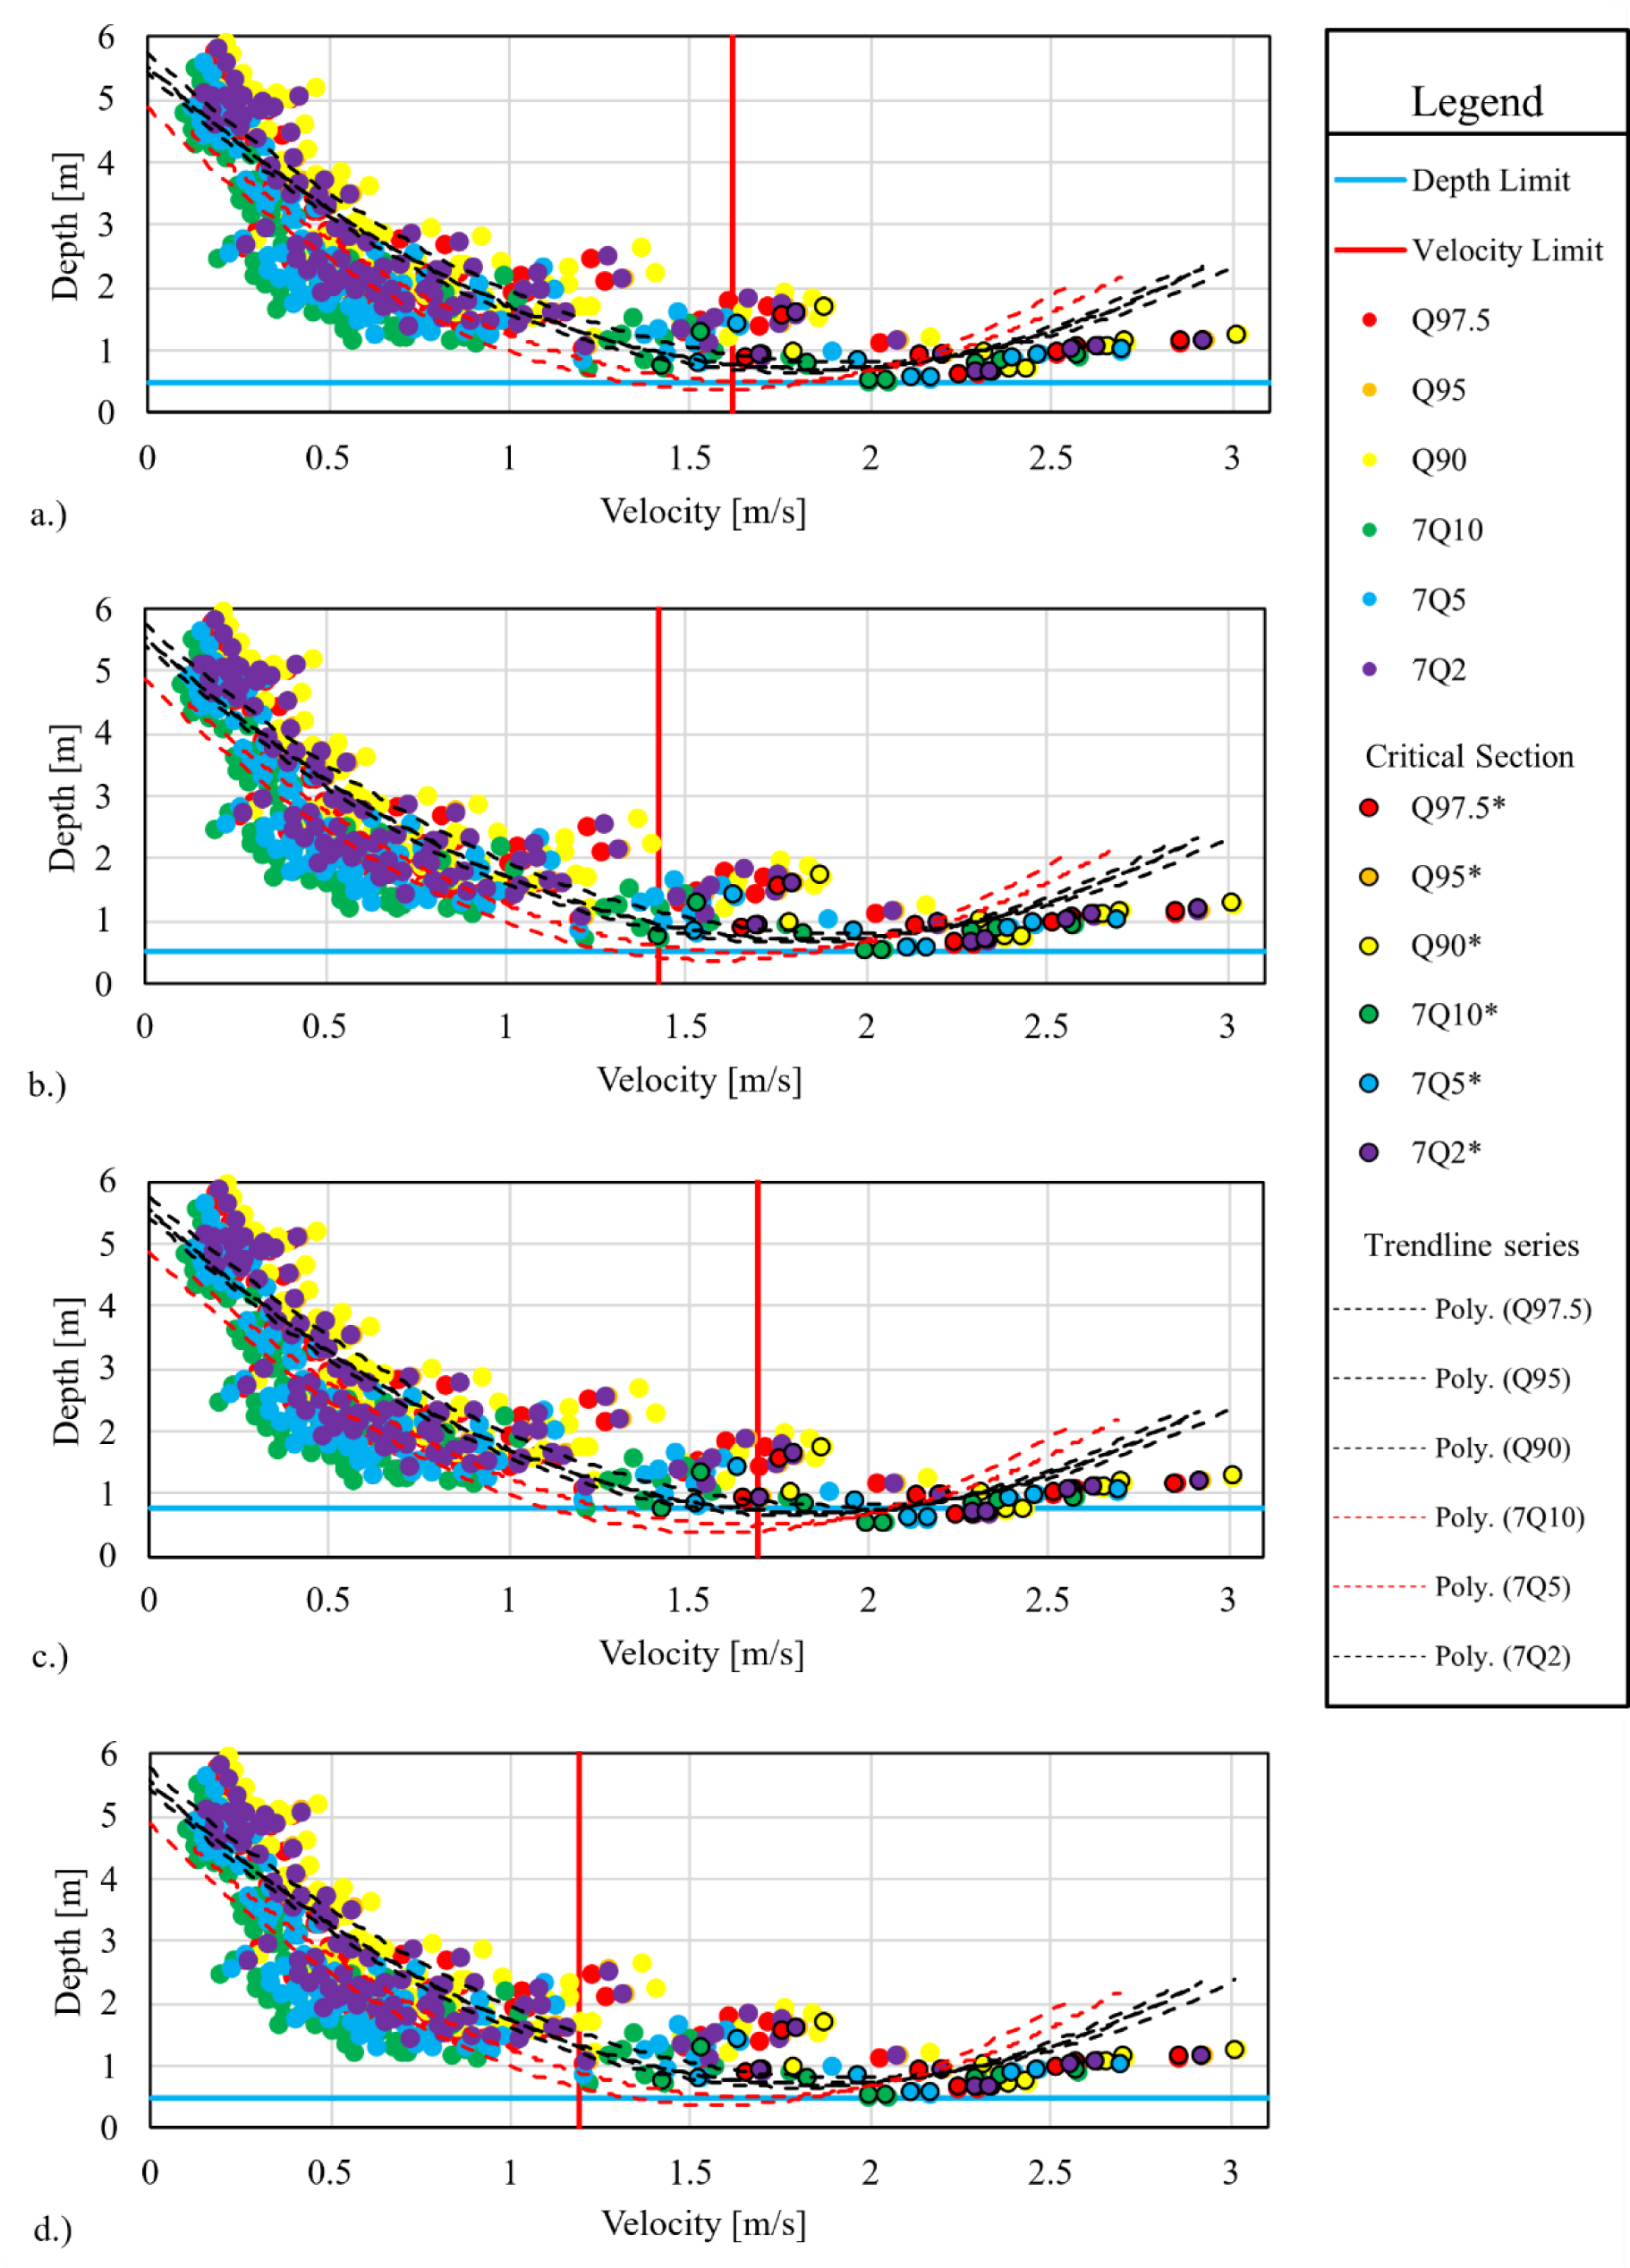
Figure 8 serves as a fundamental reference for identifying hydraulic conditions that may pose risks to fish habitats. Data points located to the center of the velocity limit and above the depth limit represent suitable hydraulic conditions for fish habitat. The dashed trendlines represent second-degree polynomial fits for each discharge scenario, demonstrating a consistent velocity-depth relationship across river reaches at higher discharges. It generally shifts data points toward higher velocity and depth parameter regimes. These hydraulic stress zones are further examined spatially in Figure 9 and Figure 10, which identify the geographic locations that meet the habitat requirements based on the depth and velocity criteria established in this analysis. These figures complement the analysis shown in Figure 8 by highlighting critical sections, indicated by red stripe boxes labelled i‒v, that result from velocity or depth limitations across multiple discharge scenarios.
Weighted velocity usable area map for Cyprinus carpio (a), Hampala macrolepidota (b), Oreochromis niloticus (c), and Hemibagrus nemurus (d)
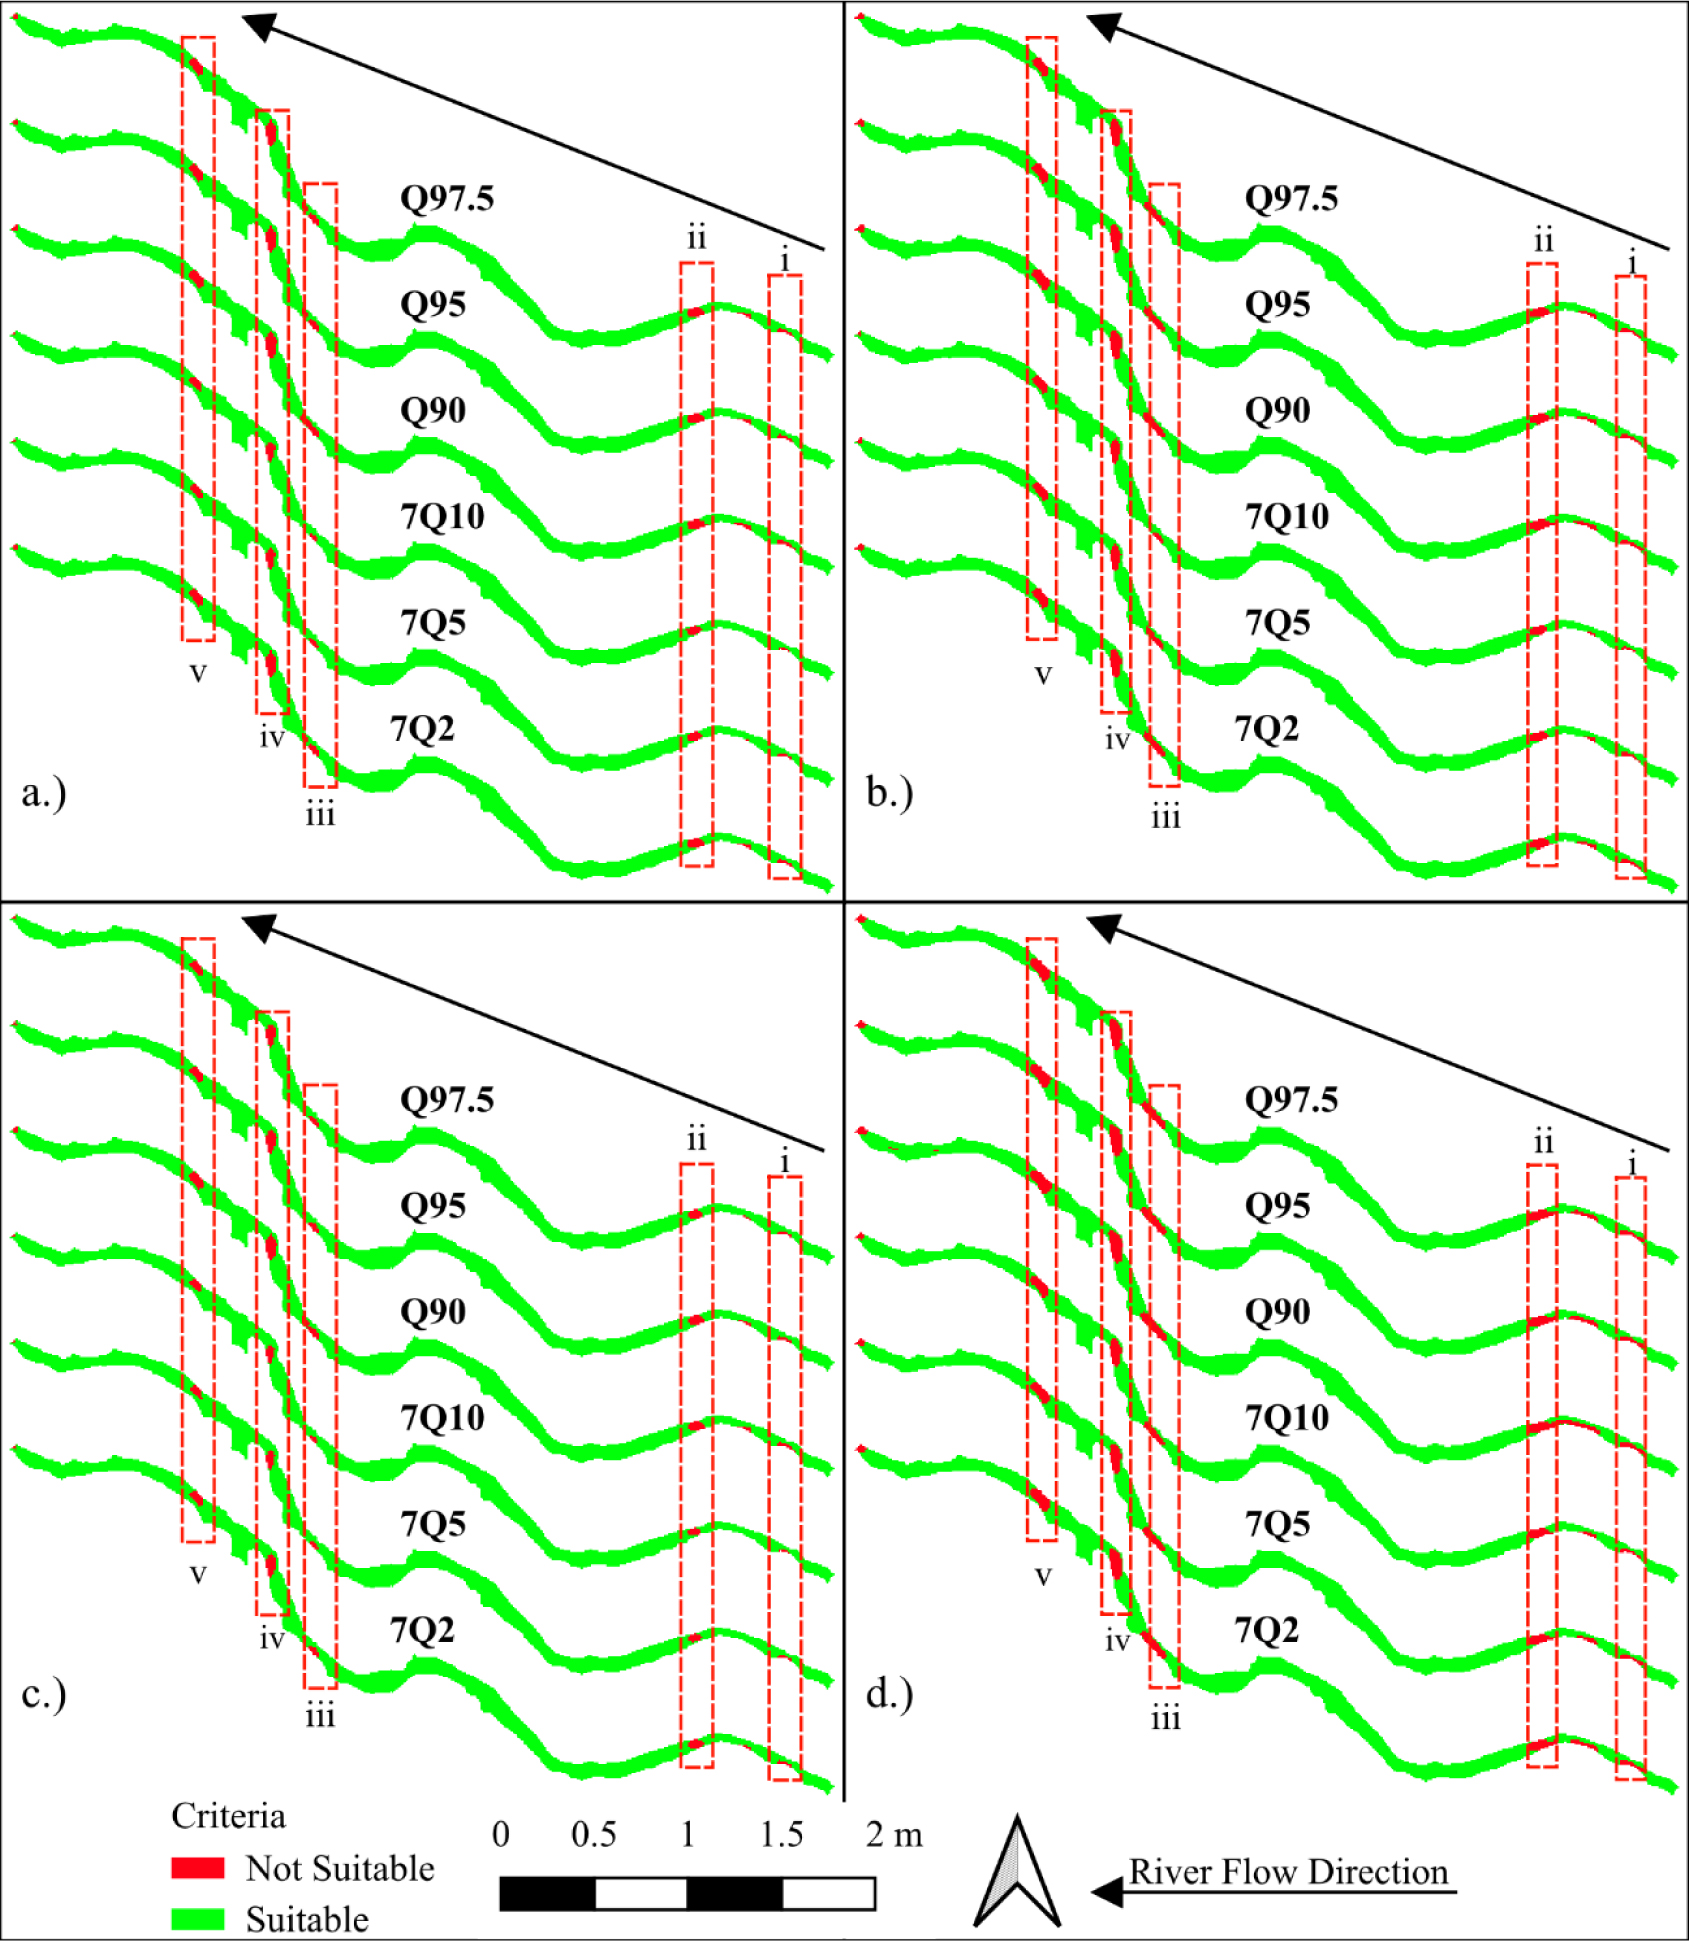
Figure 9 visualises the spatial distribution of velocity-based habitat suitability for different discharge scenarios. It shows that among the critical sections, indicated by red stripe boxes, those labelled ii and iv exhibit the most extensive velocity constraints, particularly at higher discharges. For each fish species, velocity limitations affect 3‒11% of the reach across discharge scenarios, with the most severe constraints occurring at Q90 discharge.
Weighted depth usable area map for Cyprinus carpio, Hampala macrolepidota, and Hemibagrus nemurus (a), and Oreochromis niloticus (b)
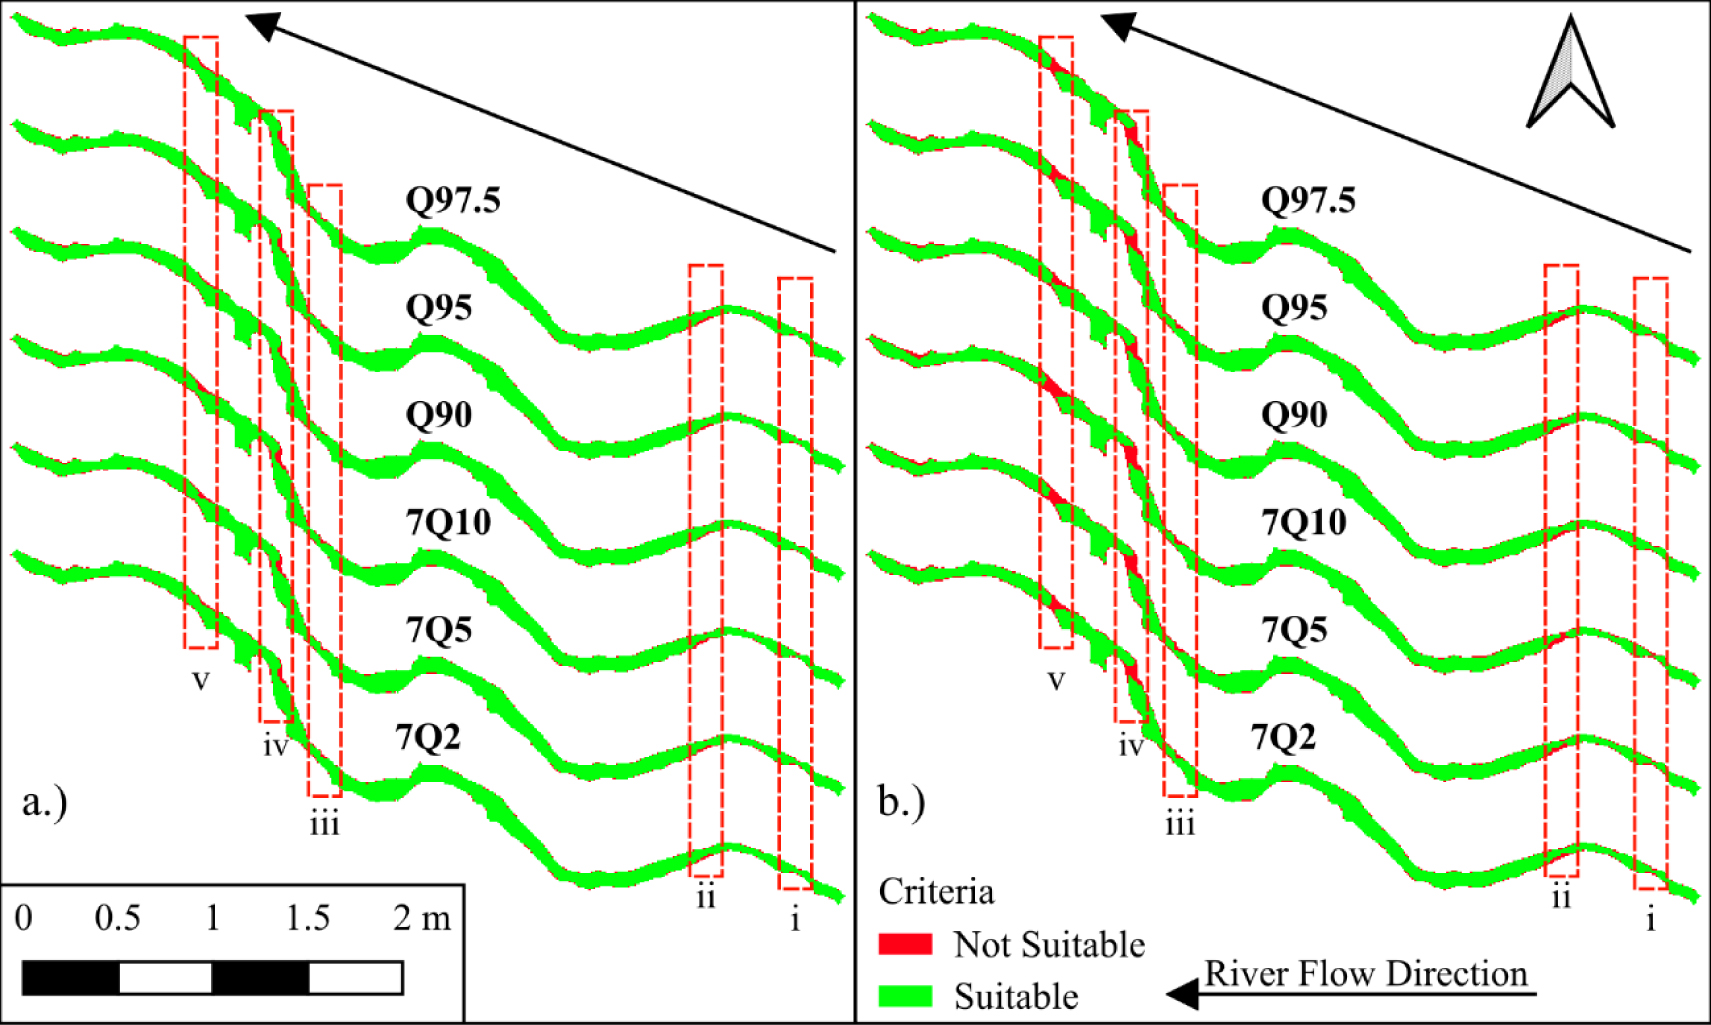
Figure 10 shows the spatial representation of the habitat simulation results based on flow depth. Green areas indicate zones where the depth supports fish habitat requirements, while red areas represent zones where the depth is insufficient. At Q90 discharge, approximately 90‒94% of the studied river-reach area provides suitable depth conditions. However, the depth suitability percentage decreases to 85‒92% at 7Q10 discharge.
Table 6 presents the annual water quality status and mean discharge data from 2014 to 2022. Water quality status, assessed using the STORET method, ranges from 16 (moderate pollution) to 34 (heavy pollution), while annual discharge varies from 80.69 to 291.49 m3/s.
Annual water quality and discharge data
Year |
Water quality status |
Discharge [m3/s] |
|---|---|---|
2014 |
18 |
219.82 |
2015 |
18 |
161.65 |
2016 |
18 |
291.49 |
2017 |
16 |
245.29 |
2018 |
20 |
170.69 |
2019 |
18 |
170.93 |
2020 |
32 |
88.00 |
2021 |
34 |
80.69 |
2022 |
20 |
111.5 |
Water quality status and mean annual flow rate
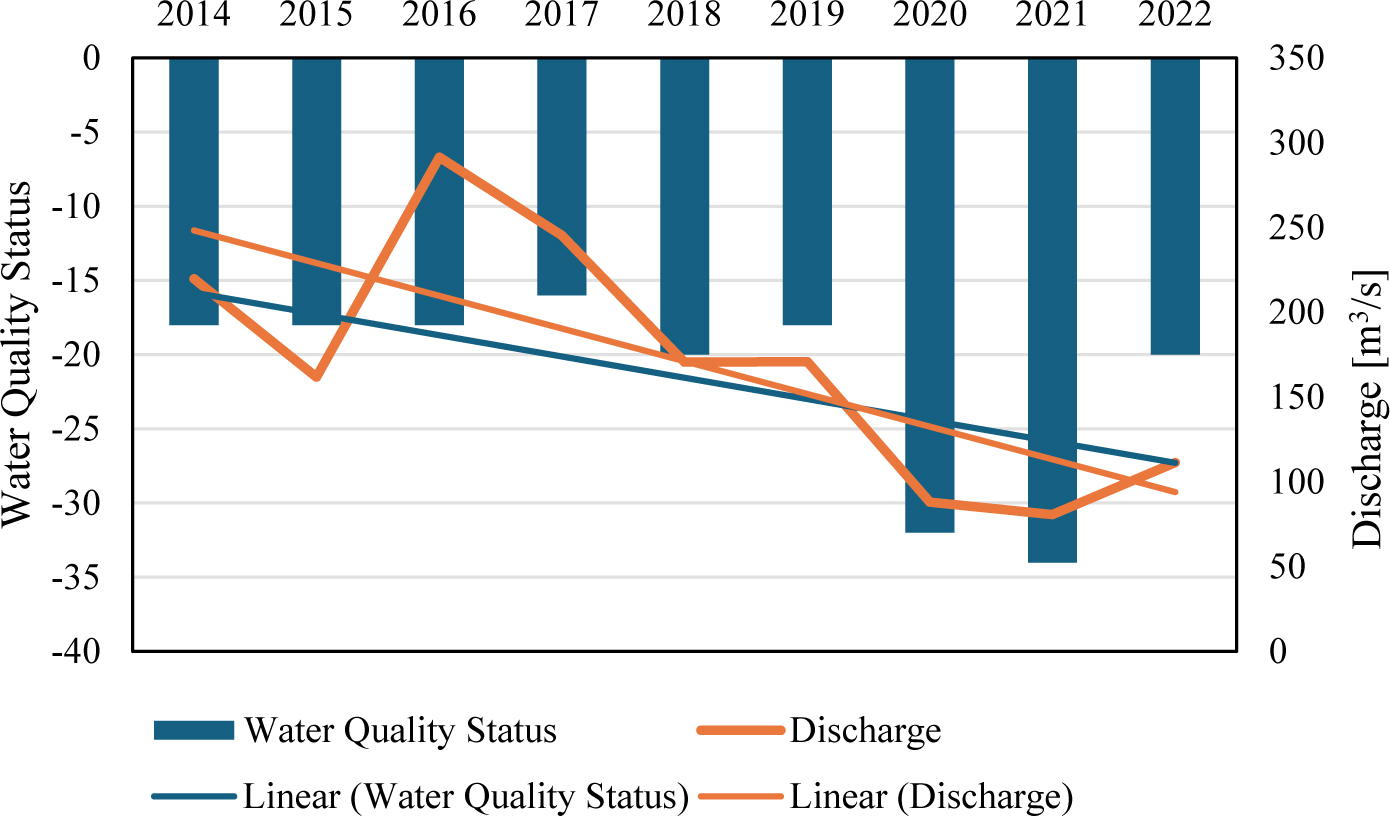
Figure 11 shows the temporal variation of water quality status and mean annual discharge from 2014 to 2022. This pattern is observable across multiple years: higher annual discharge is associated with improved water quality. The data reveal concurrent declines in both parameters in 2020‒2021, with discharge decreasing to 80.69‒88.00 m3/s and water quality status deteriorating to 32‒34 (heavy pollution). Subsequent recovery is observed in 2022, with improved discharge (111.50 m3/s) and water quality status (20, moderate pollution), supporting the dilution principle: the more water released into the river, the more diluted the pollutant concentrations become.
The regression analysis was conducted to derive a predictive model that estimates the discharge required to achieve a targeted water quality status, to further quantify the relationship observed in Figure 11. Specifically, the aim was to determine the discharge rate that would result in a water quality index of zero, classified as “very good” based on the STORET method. The resulting logarithmic regression is presented in Figure 12.
Correlation between water quality and discharge with a logarithmic trendline equation
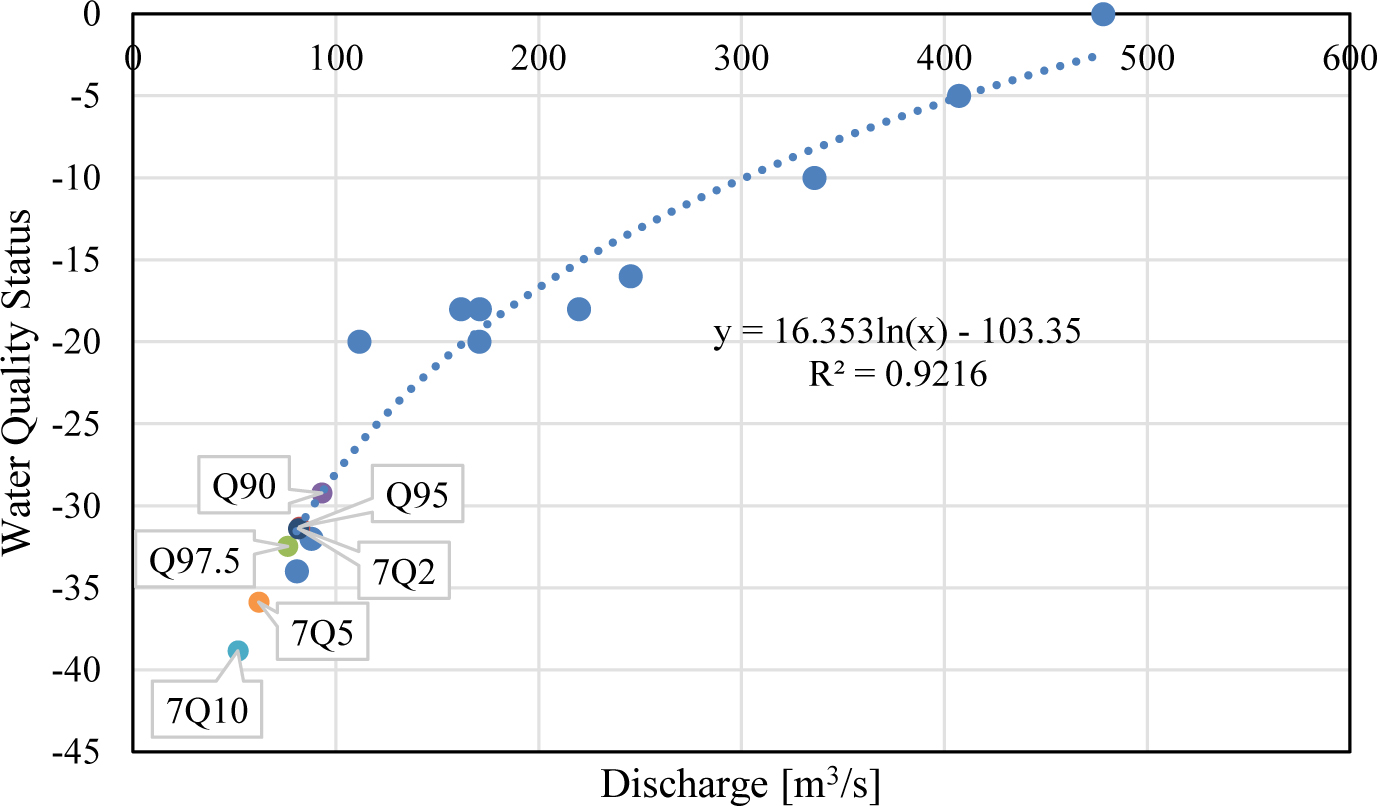
Figure 12 illustrates the correlation between water quality status and discharge using a logarithmic regression model. The regression analysis demonstrates a strong statistical relationship between discharge and water quality status (R2 = 0.9216 ). However, the discharge required for ‘very good’ water quality (556.17 m3/s) represents an exceedance probability of less than 0.5% based on historical flow records.
Addressing the challenges of EF assessment in regulated, data-scarce tropical rivers remains a critical research frontier. Most conventional EF methods are either too data-intensive (e.g., PHABSIM) or too simple (e.g., hydrological methods) to capture the ecological complexity driven by both water quantity and quality. The framework proposed herein, which integrates species-centred hydraulic-habitat modelling, flow-water quality regression, and an adaptive hydrological approach, offers a novel, multi-dimensional solution to this gap. This integrated approach fundamentally shifts the assessment from a single-focus analysis (e.g., only quantity) to a comprehensive ecological and physico-chemical evaluation, ensuring EF recommendations are based on the most limiting ecological factor.
The applicability of this framework is demonstrated through its ability to select the most contextually relevant hydrological scenarios for regulated systems. Our analysis compared flow duration curve (FDC) methods, such as Q90 and Q95, with low-flow indices, such as 7Q10. In determining the LFF method, Weibull Minima was chosen because it yielded lower values than Gumbel Minima, thus serving as the most conservative and extreme representation of the minimum water requirement for environmental flow. In a river segment downstream of a large dam, such as the Citarum, flow availability is primarily determined by reservoir releases and management decisions rather than natural drought extremes. Consequently, the Q90 method proves more relevant for establishing a reliable maintenance flow because it focuses on the availability of discharge over time, reflecting conditions under which flow is consistently managed. Conversely, relying solely on extreme indicators like 7Q10, which represent less frequent and extreme conditions, provides limited ecological and regulatory utility in a heavily regulated system, underscoring the necessity of an adaptive hydrological approach within the framework tailored to managed rivers.
The determination of the final EF regime is rooted in the principle of the most restrictive limiting factor, which holds that the overall ecological integrity of a river is constrained by the parameter that requires the highest flow. This principle necessitates integrating the two critical flow components derived from our framework: hydraulic-habitat flow (QHabitat) and water quality flow (QQuality). In this study, the QHabitat derived from species-specific suitability curves indicated an optimal flow of 93.12 m3/s to maximise available habitat for target species. Simultaneously, the QQuality analysis, based on the regression between discharge and water quality status, required a mean annual flow of 556.17 m3/s to achieve a “very good” status index (WQIS = 0).
A direct comparison reveals a significant conflict: the flow required for ideal water quality (556.17 m3/s) is an order of magnitude higher than optimal habitat flow (93.12 m3/s). More critically, the QQuality requirement corresponds to an annual exceedance probability of less than 0.5%, making it hydrologically unrealistic and unsustainable under normal river management conditions. Therefore, while water quality remains a serious ecological concern, the EF recommendation cannot be driven solely by the dilution flow requirement. Instead, the final EF must be determined by the most stringent QHabitat that is simultaneously hydrologically reliable. Based on the adaptive hydrological analysis, the flow rate of Q90 = 93.12 m3/s was selected as the final, reliable EF recommendation, which represents a necessary eco-hydraulic trade-off. This flow rate is sufficient to maintain 94.1% of the optimal habitat area (i.e., ecological function) while remaining within a discharge level that is consistently available in a hydropower system. Furthermore, this choice aligns with Indonesian regulation (PP No. 38/2011), which mandates a minimum flow with Q95 for maintenance. By selecting Q90, the EF provides a buffer above the mandated minimum, offering better ecological security. This integrated determination highlights that when non-flow sources drive one ecological constraint (water quality), the EF recommendation primarily serves to maintain the physical-habitat integrity and river self-purification capacity, while pollution must be addressed through complementary watershed management policies.
Although the EF regime is established based on realistic flow availability, its effectiveness is severely limited by local flow dynamics and river morphology. Analysis shows that unsuitable habitat conditions in specific river segments are closely linked to flow characteristics, particularly the Gradually Varied Flow (GVF) phenomenon. Changes in riverbed morphology, such as narrowing, widening, and variations in slope (illustrated in Figure 4), act as hydraulic controls creating GVF conditions.
According to GVF theory, an increase in riverbed slope results in a significant decrease in water depth. This decrease in depth directly reduces habitat suitability for aquatic species, as water depth falls below the ecological threshold required for essential activities (such as foraging and shelter). Furthermore, the assumption of relatively constant discharge in areas experiencing a decrease in wetted cross-sectional area A (due to shallow depth) will lead to an increase in flow velocity (based on the principle of continuity Q = A × V). This increase in velocity, particularly at low flows such as Q97.5 or 7Q10, can exceed the species’ biological tolerance thresholds, making it the second limiting factor.
This finding emphasises that a comprehensive determination of EF cannot rely solely on bulk discharge values; it must also consider the spatial distribution of flow characteristics (depth and velocity), which are directly influenced by local morphology. Failure to account for these species-specific hydraulic-habitat constraints can lead to EF recommendations that are theoretically adequate but ecologically ineffective in critical sections.
The second constraint limiting the effectiveness of EF is the condition of water quality, which necessitates interventions beyond flow management. Regression analysis shows that, although there is a strong statistical correlation between discharge and water quality status (R2 = 0.9216), an increase in discharge alone is not sufficient to consistently ensure good water quality status.
As concluded in the section Water Quality Modelling, the discharge required to achieve “very good” water quality status, approximately 556 m3/s, is hydrologically unrealistic. These findings strongly indicate that the dominant factor influencing the decline in water quality downstream of the Cirata Dam is not hydrological factors, but rather non-flow pollution sources such as domestic waste, aquaculture waste, and other anthropogenic activities in the watershed.
Consequently, the role of environmental flow in the context of water quality has shifted from a controlling variable to a supporting factor. Maintaining a minimum flow rate is crucial to prevent further degradation due to pollutant accumulation and to support the river’s self-purification capacity. However, for a substantial improvement in water status, EF recommendations must be complemented by complementary watershed governance policies that directly address and control the main sources of pollution.
The findings highlight a crucial paradigm shift required in the management of regulated tropical rivers: ecological sustainability demands more than simply meeting a minimum flow requirement. The proposed framework demonstrates that maintaining ecological integrity, particularly in systems facing multi-dimensional pressures, necessitates integrated, multi-disciplinary frameworks that simultaneously address hydrological, physical-habitat, and water-quality needs. In general, this approach offers a transferable template for river basins in other tropical regions, particularly those regulated by hydropower infrastructure and facing similar data constraints, to adopt faster, species-based, and ecologically relevant EF assessment.
The main policy implications of this research centre on the need to bridge the gap between water quantity and water quality policies. The established EF decision, specifying the flow Q90 = 93.12 m3/s, is effective in maintaining the integrity of the physical habitat and supporting the river’s self-purification capacity (as discussed in the section The Logic of Integration from Determining the Final Environmental Flow). However, this effectiveness is severely limited by the dominance of non-flow source pollutants. Therefore, environmental flow policies must be strengthened by complementary watershed management policies that actively target and control upstream sources of domestic pollution, aquaculture, and industry.
Although the proposed framework provides a robust solution for data-limited conditions, certain limitations must be acknowledged as future research directions. First, this framework can be improved by incorporating ecologically relevant short-term flow fluctuation analysis, which may be missed by FDC analysis based on monthly or annual averages. Second, future research should verify the modelling assumptions (e.g., fish swimming parameters) with actual field data to improve the representation of river system heterogeneity. Strengthening this aspect will increase the framework’s robustness, ensuring that water management policies are context-sensitive and adaptive, thereby achieving sustainable environmental governance.
This study successfully developed and applied a novel, integrated Environmental Flow Assessment framework for regulated and data-scarce tropical rivers by systematically combining species-centred hydraulic-habitat criteria and discharge-water quality analysis. The integrated approach demonstrated that establishing an EF regime, i.e., the selected Q90 flow discharge, is highly effective in maintaining physical-habitat suitability for target fish species, even at lower discharge rates, provided local constraints such as Gradually Varied Flow (GVF) are acknowledged. However, the most critical finding is the empirical evidence that the river’s ecological health is ultimately limited by non-flow pollutant sources, which demand flow rates for dilution that are hydrologically unsustainable. This research study highlights key contributions and emphasises that environmental flow policies in regulated river systems must be closely linked to complementary watershed management policies to ensure ecological function, thus providing information for future sustainable watershed planning globally.
This research was funded by a research grant from the Ministry of Education, Culture, Research and Technology [grant numbers 036/E5/PG.02.00.PL/2024 and 298/IT1.B07.1/SPP-LPPM/VI/2024]. The authors are grateful to the Water Resource Engineering Research Group, Faculty of Civil and Environmental Engineering, Bandung Institute of Technology, BBWS Citarum and Jasa Tirta II for providing the primary observation data.
- , Analysis of Citarum River pollution indicator using chemical, physical, and bacteriological methods, AIP Conf. Proc., 2018
- ,
Water quality evaluation system to assess the status and the suitability of the Citarum River water to different uses ,Environ. Monit. Assess. , Vol. 168 (1-4), :669-6842010, https://doi.org/10.1007/s10661-009-1142-z - , , Flow: The Essentials of Environmental Flows, 2003
- ,
Environmental flow in the context of dams and development with special reference to the Damodar Valley Project, India: a review ,Sustain. Water Resour. Manag. , Vol. 8 (3), :622022, https://doi.org/10.1007/s40899-022-00646-9 - ,
The assessment of environmental flow status in Southeast Asian rivers: a review ,J. Clean. Prod. , Vol. 295 , 2021, https://doi.org/10.1016/j.jclepro.2021.126411 - , , Environmental Flows: Concepts and Methods, 2003
- ,
Effects of an outflow regime adoption of the São Francisco River reservoir system to meet water demands for multiple uses ,RBRH , Vol. 25 , 2020, https://doi.org/10.1590/2318-0331.252020190110 - ,
Environmental water requirements: a demand management perspective ,Water Environ. J. , Vol. 17 (1), :19-222003, https://doi.org/10.1111/j.1747-6593.2003.tb00425.x - ,
Hydrology-based assessment of environmental flows: an example from Nepal ,Hydrol. Sci. J. , Vol. 51 (2), :207-2222006, https://doi.org/10.1623/hysj.51.2.207 - ,
Dependence of selected water quality parameters on flow rates in river profiles in the Czech Republic ,J. Sustain. Dev. Energy Water Environ. Syst. , Vol. 4 (2), :127-1402016, https://doi.org/10.13044/j.sdewes.2016.04.0011 - ,
Water availability footprint addressing water quality ,J. Sustain. Dev. Energy Water Environ. Syst. , Vol. 7 (1), :72-862019, https://doi.org/10.13044/j.sdewes.d6.0223 - ,
Hydrological methods for environmental flow assessment ,Int. J. Environ. Sci. Technol. , Vol. 9 (3), :549-5582012, https://doi.org/10.1007/s13762-012-0062-6 - ,
Low flow hydrology: a review ,J. Hydrol. , Vol. 240 (3-4), :147-1862001, https://doi.org/10.1016/S0022-1694(00)00340-1 - ,
Global perspective on environmental flow assessment ,River Res. Appl. , Vol. 19 (5-6), :397-4412003, https://doi.org/10.1002/rra.736 - ,
MCDA framework for hydrological decision support ,Ecol. Indic. , Vol. 93 , :470-4802018, https://doi.org/10.1016/j.ecolind.2018.04.057 - ,
Environmental flow regime and ecological recovery of regulated rivers ,Restor. Ecol. , Vol. 24 (3), :406-4142016, https://doi.org/10.1111/rec.12330 - ,
Reservoir management in Spanish Pyrenees ,Environ. Manage. , Vol. 34 (4), :508-5152004, https://doi.org/10.1007/s00267-003-0249-1 - ,
Environmental flow failure and fish population decline ,Freshw. Biol. , Vol. 67 (9), :1631-16432022, https://doi.org/10.1111/fwb.13966 - ,
Environmental flow in Upper Citarum River basin ,TOCIEJ , Vol. 16 (1), 2022, https://doi.org/10.2174/18741495-v16-e221006-2022-2 - ,
Environmental flow in tropical karst catchment ,Results Eng. , Vol. 25 , 2025, https://doi.org/10.1016/j.rineng.2025.104549 - ,
Fish habitat requirements in ecological flow estimation ,Ecohydrology , Vol. 13 (4), 2020, https://doi.org/10.1002/eco.2204 - ,
Habitat evaluation for endangered fish species ,J. Ecohydraulics , Vol. 4 (2), :147-1572019, https://doi.org/10.1080/24705357.2019.1614886 - Stream habitat analysis using IFIM USGS Rep., 1998
- ,
Fish habitat models for riverscapes ,BioScience , Vol. 74 (9), :624-6392024, https://doi.org/10.1093/biosci/biae081 - ,
Microhabitat selection by macroinvertebrates ,J. Ecohydraulics , Vol. 7 (1), :28-412022, https://doi.org/10.1080/24705357.2020.1858724 - ,
Fish Habitat Modelling in Large Rivers ,J. Ecohydraulics , Vol. 9 (1), :68-862024, https://doi.org/10.1080/24705357.2021.1938251 - ,
A Mixed Optimal Control Approach for Upstream Fish Migration ,J. Sustain. Dev. Energy Water Environ. Syst. , Vol. 7 (1), :101-1212019, https://doi.org/10.13044/j.sdewes.d6.0221 - Fish Swimming Performance Database and Analyses DFO Can. Sci. Advis. Sec. Res. Doc., 2016
- ,
Impact of Climate Change on Environmental Flow Component ,J. Ecohydraulics , Vol. 4 (2), :88-1052019, https://doi.org/10.1080/24705357.2019.1663713 - ,
Ecohydraulic-Based Expert System for Environmental Flow Management ,J. Hydroinform , Vol. 23 (6), :1343-13672021, https://doi.org/10.2166/hydro.2021.112 - ,
Seasonal Changes in Water Quality of a Tropical Reservoir ,J. Chem. , Vol. 2017 , 2017, https://doi.org/10.1155/2017/8153246 - ,
Raindrop Size and Flow Depth Control Sediment Sorting ,Water Resour. Res. , Vol. 54 (12), :9978-99952018, https://doi.org/10.1029/2018WR022786 - Jasa Tirta II Public Corporation, Water Quality Management for the Citarum River Basin Indonesia, 2002
- , Integrated Water Resources Management in Citarum River Basin, Proc. World Water Congr., 2005
- ,
Multi-Objective Optimization of Hydroelectric Exploitation in Citarum Cascade Reservoirs ,GEOMATE , Vol. 23 (95), 2022, https://doi.org/10.21660/2022.95.3360 - , Impact of Climate Change on Reservoir Operation in Citarum River, ICOLD Symp., 2021
- ,
Cirata Reservoir Lifetime Prediction ,GEOMATE J. , Vol. 18 (65), :41-482020, https://doi.org/10.21660/2019.64.18023 - , Republic of Indonesia, Presidential Regulation No. 15 of 2018 on Citarum River Pollution Control, 2018
- , Republic of Indonesia, Government Regulation No. 38 of 2011 on Rivers, 2011
- ,
Identification of Fish Species in Cirata Reservoir ,BL , Vol. 2 (2), :150-1632015, https://doi.org/10.31849/bl.v2i2.325 - ,
Methodology to Estimate Flow Duration Curves ,Hydrol. Earth Syst. Sci. , Vol. 24 (4), :2043-20602020, https://doi.org/10.5194/hess-24-2043-2020 - , , Fundamentals of Statistical Hydrology, 2017
- , Practical Aspects of Computational River Hydraulics, Pitman, 1980
- , , Open-Channel Hydraulics, 1985
- , , Open Channel Hydraulics, 3rd ed., 2021
- , , Open-Channel Hydraulics, 1959
- Hydraulic Simulation in Instream Flow Studies USFWS, 1978
- , Republic of Indonesia, Ministerial Decree No. 115 of 2003 on Water Quality Status, 2003
- , Republic of Indonesia, Government Regulation No. 22 of 2021 on Environmental Protection and Management, 2021
- ,
Assessment of Water Quality Parameters of Kushiyara River ,Int. J. Sci. Res. , Vol. 6 (12), :1264-12702017, https://doi.org/10.21275/30111701 - ,
The Effect of Sand Trap on Sedimentation Distribution of Cirata Dam to Maintain the Reservoir Age of Use ,GEOMATE Journal , Vol. 27 (124), :57-67, https://doi.org/10.21660/2024.124.4662