



Human activities and industries, whether concentrated in urban centres or dispersed across rural areas, have significantly altered the environment [1]. In this context, the environment is defined as the set of physical and chemical elements, together with natural and social ecosystems, within which human beings are embedded both individually and collectively [2]. These interactions occur through dynamic processes that seek to reconcile the development of human activities with the preservation of natural resources and the maintenance of essential environmental characteristics, in compliance with established environmental quality standards [3].
However, when such interactions exceed the adaptive capacity of natural systems, they generate localised disturbances that trigger nonlinear responses and threshold effects, leading to abrupt changes in ecosystem structure and function. These thresholds, often referred to as tipping points, mark critical transitions beyond which recovery becomes difficult or even impossible without significant external intervention. As a result, environmental impacts propagate across spatial and temporal scales, ultimately contributing to global environmental change [4]. This cross-scale propagation is reinforced by feedback mechanisms that couple human and natural systems [5]. For instance, land-use change, such as deforestation, alters land surface albedo, evapotranspiration, and carbon storage, which, in turn, influence atmospheric circulation and climate patterns [6]. These climatic shifts can further intensify land degradation, biodiversity loss, and water scarcity, creating reinforcing loops that amplify the initial disturbance [7]. In this sense, global environmental change emerges as both a collection of isolated processes and a network of interdependent dynamics, where changes in one subsystem cascade into others [8]. Acting cumulatively and systemically, global environmental change affects the Earth as an integrated system. Processes such as climate change, alterations in atmospheric chemistry and biogeochemical cycles, changes in land use and land cover, global chemical pollution, and disruptions of the hydrological cycle exert widespread impacts on the global ecosystem, effects that are already observable even in the most remote regions of the planet [9].
Agricultural practices, livestock production, economic development, and urban expansion directly alter natural systems by modifying key biological and geographical attributes, including vegetation cover, fauna, soil permeability, surface absorptivity, and albedo [10]. These activities also influence local and regional climatic conditions and the physical and chemical properties of atmospheric air, soils, and water resources, thereby affecting processes such as surface runoff, river dynamics, and groundwater recharge. Among the environmental challenges associated with these anthropogenic pressures, the most pronounced in urban environments include the reduction of green spaces driven by civil construction and widespread soil sealing, which disrupts the natural functioning of the hydrological cycle and contributes to a range of urban environmental problems [11].
Anthropogenic pressures and urbanisation substantially affect urban hydrological processes, particularly the circulation and distribution of water. The removal of vegetated areas and the widespread sealing of natural surfaces significantly reduce key components of the hydrological cycle (namely interception, evaporation, transpiration, and infiltration) relative to total precipitation. These processes play a critical role in retaining rainfall and attenuating surface runoff, thereby mitigating the frequency and magnitude of floods and inundation events [12]. As these regulatory mechanisms are progressively weakened in urban environments, stormwater management has emerged as an urgent challenge for cities. The increasing dominance of impervious surfaces, such as roads and buildings, limits rainfall retention and increases volumes and velocities of surface runoff. In response to this imbalance, the incorporation of green infrastructure has gained prominence as a strategy to offset excessive urban densification and soil sealing [13]. According to Rola et al. [14], green areas and nature-based interventions aim to transform buildings and urban spaces into functional biotopes in an economically and ecologically optimised manner, thereby enhancing atmospheric circulation and improving urban microclimatic conditions when interconnected through green corridors.
By recovering the principles of greening built-up areas and aligning with the Agenda 21 guidelines, it seeks to mitigate the impacts of urban development, scientifically address environmental demands, and redirect cities toward sustainable development, thereby achieving greater integration among urban space, citizens, and nature.
According to Mora-Melià et al. [15], green roofs constitute an effective strategy for urban flood mitigation by promoting the temporary retention and delayed release of rainfall. This function is achieved through their role as compensatory techniques in urban drainage systems, whereby precipitation volumes are attenuated by vegetated covers that enable surface storage, water uptake by vegetation, and retention within the substrate. Green roofs reduce surface runoff and consequently decrease the volume of water conveyed to urban drainage networks by retaining a portion of incident rainfall [16], [17]. In addition to stormwater regulation, the retained water may be treated and reused for non-potable purposes, such as toilet flushing, surface cleaning, and landscape irrigation, thereby improving urban water efficiency and alleviating pressure on conventional water supply systems [18].
Consequently, this mechanism can influence the catchment's hydrological balance by acting as a temporary storage system that retains part of the incoming precipitation. Storage occurs both on vegetative surfaces (interception) and within the substrate layer, where water is held before being gradually released through drainage or returned to the atmosphere via evapotranspiration [19]. As a result, interception tends to attenuate seasonal flow variability, delaying runoff responses and reducing flood peak magnitudes [20]. This temporal redistribution is particularly relevant in urban environments, where impervious surfaces typically generate rapid runoff and exacerbate peak discharges [21]. Within the context of green roofs, there was a need to explore the influence of plant interception and evapotranspiration to better understand their benefits as a compensatory urban drainage technique.
It is known that at the event scale, evaporation losses from rainfall intercepted by the canopy are a few millimetres, which is often not much compared to other water balance stocks [22]. Nevertheless, at the yearly scale, the number of times that the canopy is filled by rainfall and then depleted can be so large that the interception flux may become an important fraction of rainfall [23]. These processes become even more complex due to interactions among vegetation characteristics, substrate properties, and climatic conditions. Plant interception capacity varies with leaf area index, canopy structure, and rainfall intensity [24], while evapotranspiration rates depend on solar radiation, wind speed, air temperature, and soil moisture availability [25]. These factors control the system's antecedent moisture condition, which is a key determinant of its retention capacity during subsequent rainfall events. Therefore, green roofs behave as dynamic hydrological components whose performance evolves over time [26]. For this reason, there is a clear need to further investigate the relative contributions of plant interception and evapotranspiration in green roof systems, particularly under different seasonal and climatic scenarios. A better understanding of these processes can improve the parameterisation of hydrological models and support the design of more efficient green roof configurations. Ultimately, such insights reinforce the role of green roofs as a compensatory urban drainage technique, capable not only of reducing runoff volumes but also of mitigating peak flows and enhancing the resilience of urban water management systems.
Flooding and inundation are considered complex urban phenomena with cascading impacts across infrastructure, public health, and socio-economic systems [27]. They disrupt urban mobility, causing traffic chaos and rendering some areas inaccessible, where floods can paralyse entire transport networks, including public transit systems, emergency response routes, and supply chains [28]. They lead to financial economic consequences, such as damage to vehicles and residences. Flood events can interrupt commercial activities, reduce workforce productivity, and impose significant recovery costs on both households and municipalities [29]. Besides, they pose risks to the population, as many people are injured while walking through flooded streets, which also contributes to the transmission of waterborne diseases [30]. Another serious problem caused by flooding is slope failure and landslides, which represent a high risk of structural collapse and burial of dwellings, leaving many people homeless and, depending on the severity of the events, potentially resulting in fatalities [31].
To restore environmental balance and mitigate problems affecting the hydrological cycle, green roofs have emerged as a viable solution. In addition to their ability to retain storm water and thus reduce peak runoff directed to storm water drainage systems, green roofs provide several other benefits, such as mitigating urban heat islands, providing acoustic insulation, increasing biodiversity, and improving air quality.
Within the context of green roofs, there is a need to continue investigating certain aspects, particularly the influence of vegetation interception and evapotranspiration, to improve understanding of their effectiveness as a compensatory urban drainage technique. Climatic conditions and differences in green roof configuration, i.e., substrate type and depth, as well as plant species selection, drive this variation in performance [32]. Evapotranspiration is influenced by substrate characteristics, depth and species selection [25], [33], [34].
Vegetation interception is a key variable controlling hydrological and geo-environmental processes, such as erosion, landslides, and floods, and is essential for modelling infiltration, percolation, and runoff [35]. However, field measurements are time-consuming and highly variable, making rainfall simulators a reliable alternative [36]. Mendes et al. [37] applied this approach to Paspalum notatum (bahiagrass) and a tropical soil, obtaining an average interception of 5.1 mm under a 15° slope, rainfall intensity of 86 mm h−1, and duration of 60 minutes.
Similarly, rainfall interception has also been investigated at the urban scale. At the COSMO experimental site, located in the northern Kanto Plain, Japan (39°04′N, 139°07′E), interception was analysed from the perspective of water and energy balance under a temperate climate with a rainy season in June–July and a dry winter. According to Nakayoshi et al. [38], interception was estimated as the residual between measured rainfall and runoff over a five-month period, with an average value of 6% of gross rainfall, which is lower than typical values observed in forests.
The objective of this study is to analyse interception of vegetation and evapotranspiration through experimental tests conducted at the prototype of green roof located in the Experimental Centre of Environmental Sanitation (CESA) of the Federal University of Rio de Janeiro (UFRJ). Considering the wide range of variables involved, this study focuses on analysing the total volume of water retained by the green roof, with emphasis on retention through plant interception in bromeliad tanks and losses due to evapotranspiration. The relevance of these processes to precipitation retention is discussed to improve the efficiency of green roofs as a compensatory technique in urban drainage systems and to understand their hydrological functioning better.
Despite the well-documented benefits of green roofs, their implementation also presents relevant limitations that must be acknowledged. Structural constraints of existing buildings may limit the adoption of green roofs, as not all constructions are designed to support the additional load imposed by the system layers and retained water [39]. Furthermore, the presence of vegetation capable of storing water could create favourable conditions for mosquito proliferation if adequate maintenance and drainage are not ensured [40]. Additional challenges include higher installation and maintenance costs, the need for specialised design, and potential operational issues related to waterproofing and long-term performance [41]. Recognising these constraints is essential for a realistic assessment of the applicability of green roofs in urban environments.
The hydrological cycle is a global phenomenon of closed circulation of water between the Earth's surface and the atmosphere, driven by solar energy, gravity and Earth's rotation. The exchange between the Earth's surface and the atmosphere occurs in two directions.
In the atmosphere-surface sense, where the flow of water occurs in any physical state, the most significant being the precipitation of rain and snow. Through the movement of air masses, the main mechanism of water transfer from the atmosphere to the surface is precipitation [42].
When precipitation reaches the ground, some infiltrates the soil, some flows over the surface, and some is evaporated, either directly or through transpiration [43]. When precipitation falls on soil covered by vegetation, a portion of the precipitated volume is intercepted by leaves and stems, where it is temporarily stored and later evaporates. When the vegetation's water storage capacity is exceeded, or wind action reprecipitates intercepted water onto the soil, the intercepted water may be reprecipitated. Interception is a phenomenon that occurs with both rainfall and snowfall [37].
Interception is the retention of precipitation above the ground surface. Interception may occur through vegetation or other obstructions to runoff. The retained volume returns to the atmosphere through evaporation. This process affects the watershed water balance by functioning as a reservoir that temporarily stores a portion of precipitation. The overall tendency of interception is to reduce discharge variability throughout the year, delaying and attenuating flood peaks [44].
According to Tucci and Beltrame [45], interception is the difference between total precipitation and the portion that crosses the vegetation and drains through the trunks and leaf edges of the trees. The intensity, duration and volume of precipitation influence the interception process, with the largest portion occurring at the beginning of precipitation. Therefore, a longer rainfall duration implies a longer period with lower interception rates. Similarly, heavier rains tend to have a smaller proportion of total precipitation intercepted, since they hinder retention of water in the foliage and more quickly "saturate" the vegetation's storage capacity [46].
Of the total precipitation reaching the ground, a portion infiltrates into the soil, another fraction flows as surface runoff, and the remainder returns to the atmosphere through evaporation, either directly from surfaces or indirectly via transpiration [47]. In some regions, this evaporation can be so significant that all precipitation is vapourised. At any time and place where water circulates on Earth's surface, whether on continents or oceans, evaporation into the atmosphere occurs, a phenomenon that closes the hydrological cycle. Vegetation characteristics, such as leaf density (the number of leaves per unit area, representing the extent of vegetation cover), determine the effective interception area. The size and shape of the leaves also influence the vegetation's ability to store water, as well as the arrangement of the trunks, which facilitate or impede the flow through them [48].
The equations for interception estimation are usually used only for large vegetation, analysing the portion of precipitation that crosses the vegetation and the portion that flows through the trunks. In this research, due to the size of bromeliads, it is not possible to estimate the interception through these plots. Therefore, in this work, an empirical method for calculating plant interception will be adopted. Evapotranspiration is the sum of evaporation and transpiration and depends on solar radiation, air vapour stresses and winds [43]. It runs when liquid water is converted to water vapour and transferred to the atmosphere. This process occurs when liquid water is transformed into water vapour and released into the atmosphere. It occurs naturally only when energy is supplied to the system, originating from solar radiation, atmospheric sources, or both, and is governed by the rate of energy transfer associated with the flux of water vapour from the Earth's surface. This transfer occurs through molecular and turbulent diffusion. Therefore, the evapotranspiration process of natural surfaces can be simulated physically using models that describe the effects of molecular and turbulent diffusion resistances on the energy distribution of the sun or the atmosphere [37].
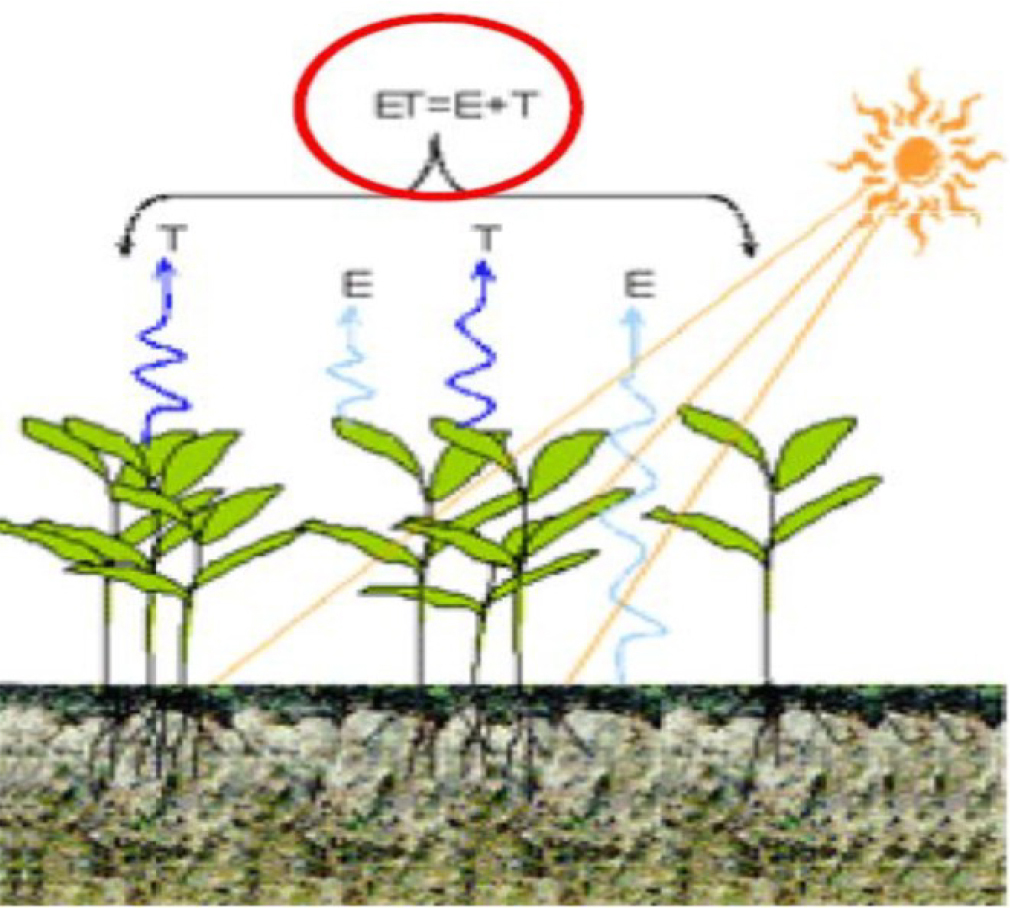
Also, according to Tucci and Beltrame [45], quantitative information on these processes, which constitute an important phase of the hydrological cycle, is used to solve problems involving water management. However, this information, obtained through direct measurements across different locations and weather conditions, is not available in sufficient quantity. Thus, estimates based on physical principles and mainly empirical equations are used as an alternative to fill this gap. Evapotranspiration is the loss of water from the soil and from plants through evaporation and transpiration. It is important for the basin's overall water balance. Figure 1 shows a scheme of the evapotranspiration process.
In the present work, the reference evapotranspiration estimate will be calculated using the Penman-Monteith FAO equation (PM FAO 56), which is a standardised version of the original Penman-Monteith equation developed by the Food and Agriculture Organisation of the United Nations (FAO). The required data are air temperature, relative humidity, solar radiation and wind speed [50], and the formula is shown in eq. (1):
where: ETo denotes reference evapotranspiration [mm d-1], Rn − radiation balance at the surface of the culture [MJ m-2d-1], G − heat flux density of soil [MJ m-2d-1], T − air temperature at 2 m height [°C], u2 − wind speed at 2 m height [m s−1], es − saturation vapour pressure [kPa], ea − partial vapour pressure [kPa], ∆ − slope of saturation vapour pressure curve [kPa °C−1], y − psychrometric coefficient [kPa °C−1].
The assumption of a constant evapotranspiration rate throughout the day was adopted as a modelling simplification due to data availability constraints and the measurement temporal resolution. Given the study's scope and focus on cumulative water balance and retention performance over daily and longer timescales, short-term diurnal variability in evapotranspiration was considered to have a limited influence on the overall results. This approach is commonly applied in green roof and urban hydrology studies when detailed micrometeorological data are unavailable and provides a reasonable approximation for comparative and exploratory analyses.
A series of experimental tests was carried out at the Experimental Centre for Environmental Sanitation of the Federal University of Rio de Janeiro, where a prototype green roof composed of bromeliads was installed. To carry out the experimental tests, in addition to the green roof, two other pieces of equipment were fundamental: the rain simulator and the rain box. At each test, by sampling, some bromeliads were selected to measure the volume of water in their tanks. After carrying out the tests, the data are analysed and, with the help of mathematical and statistical tools, the results are presented for evaluation.
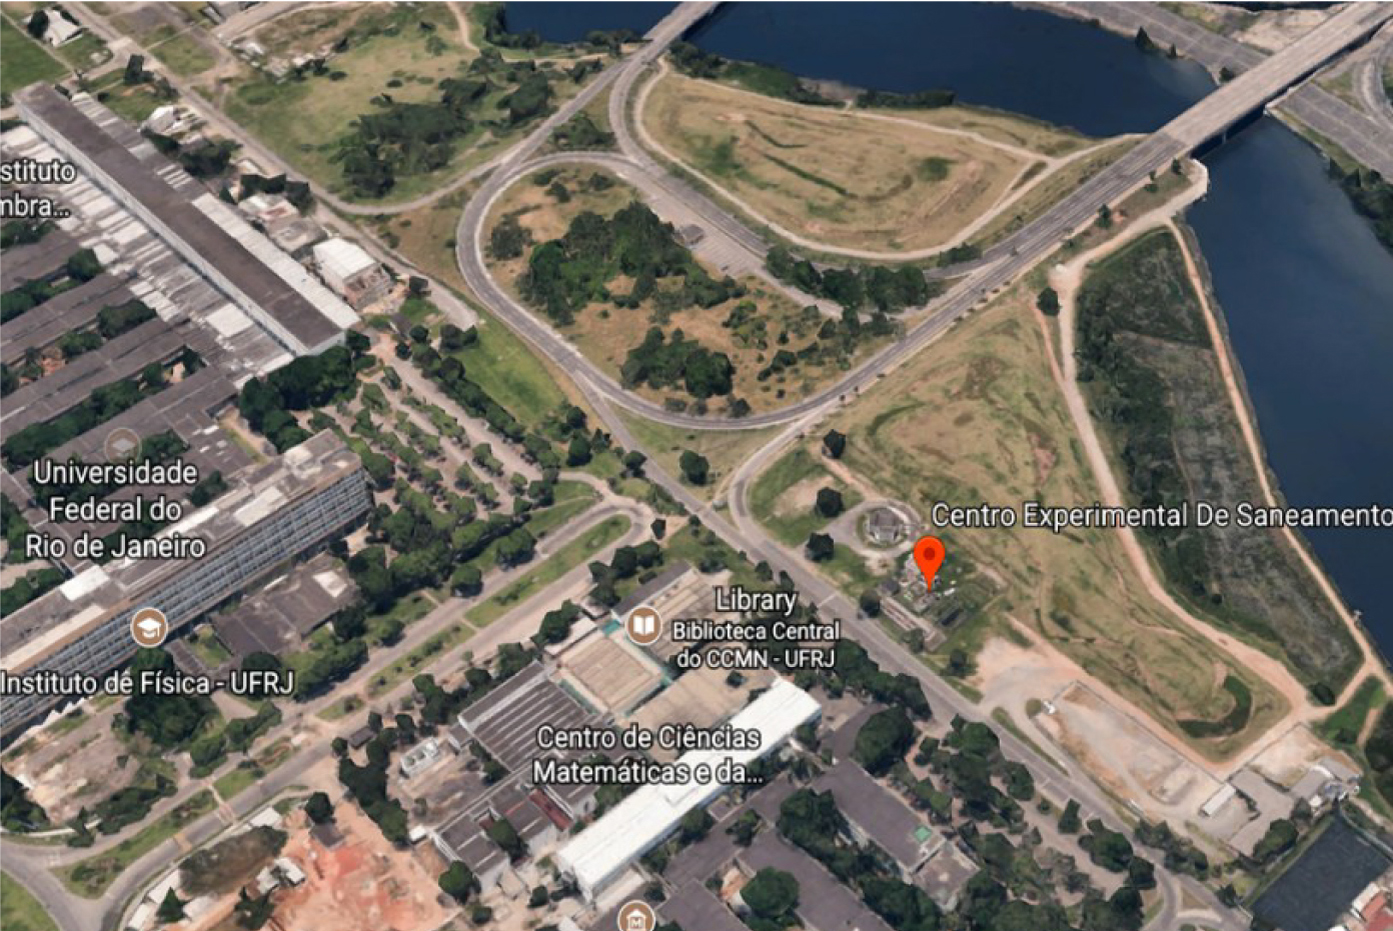
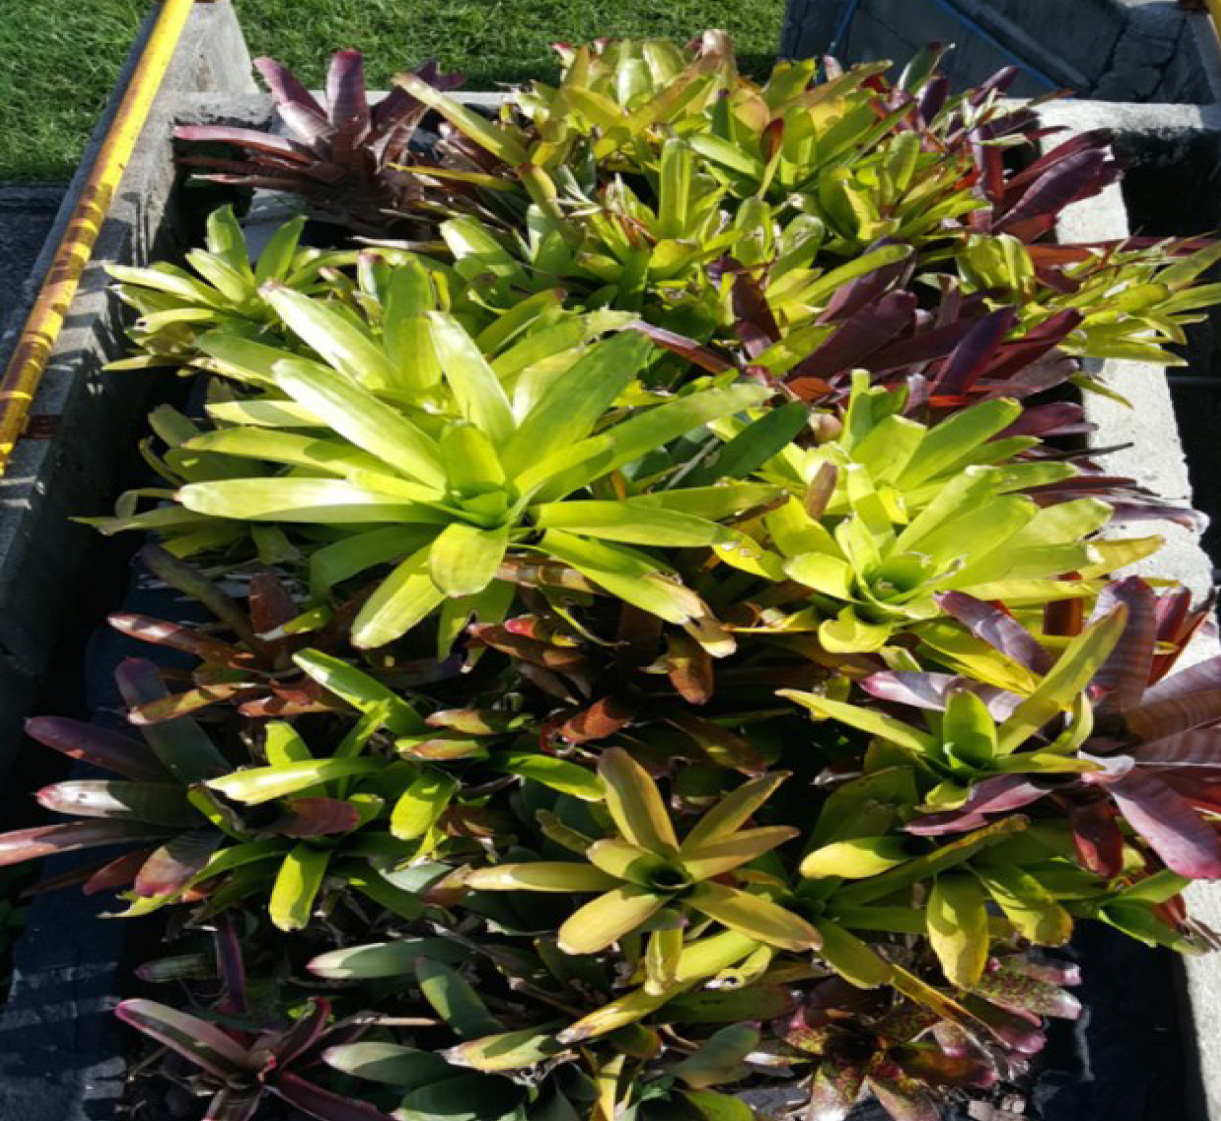
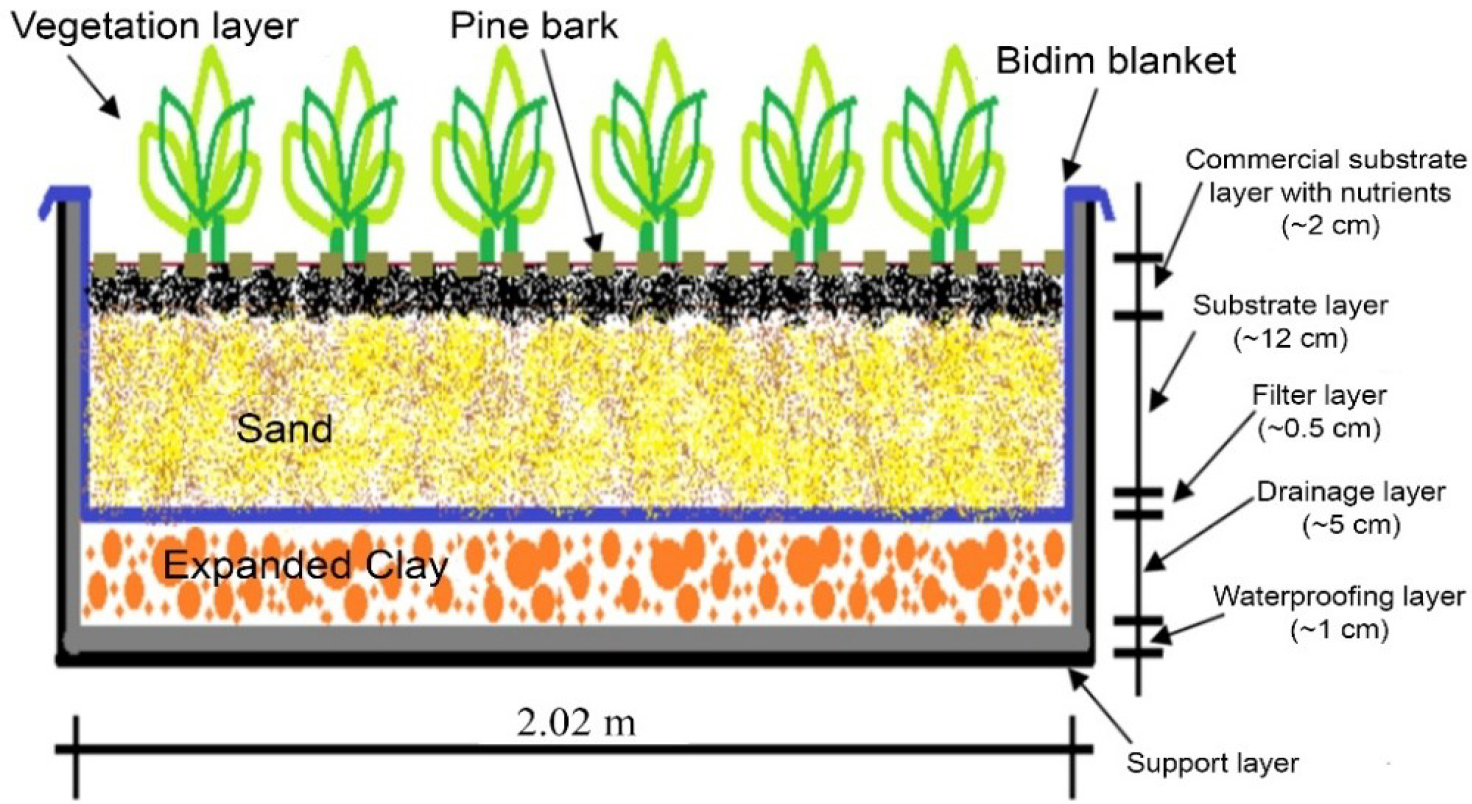
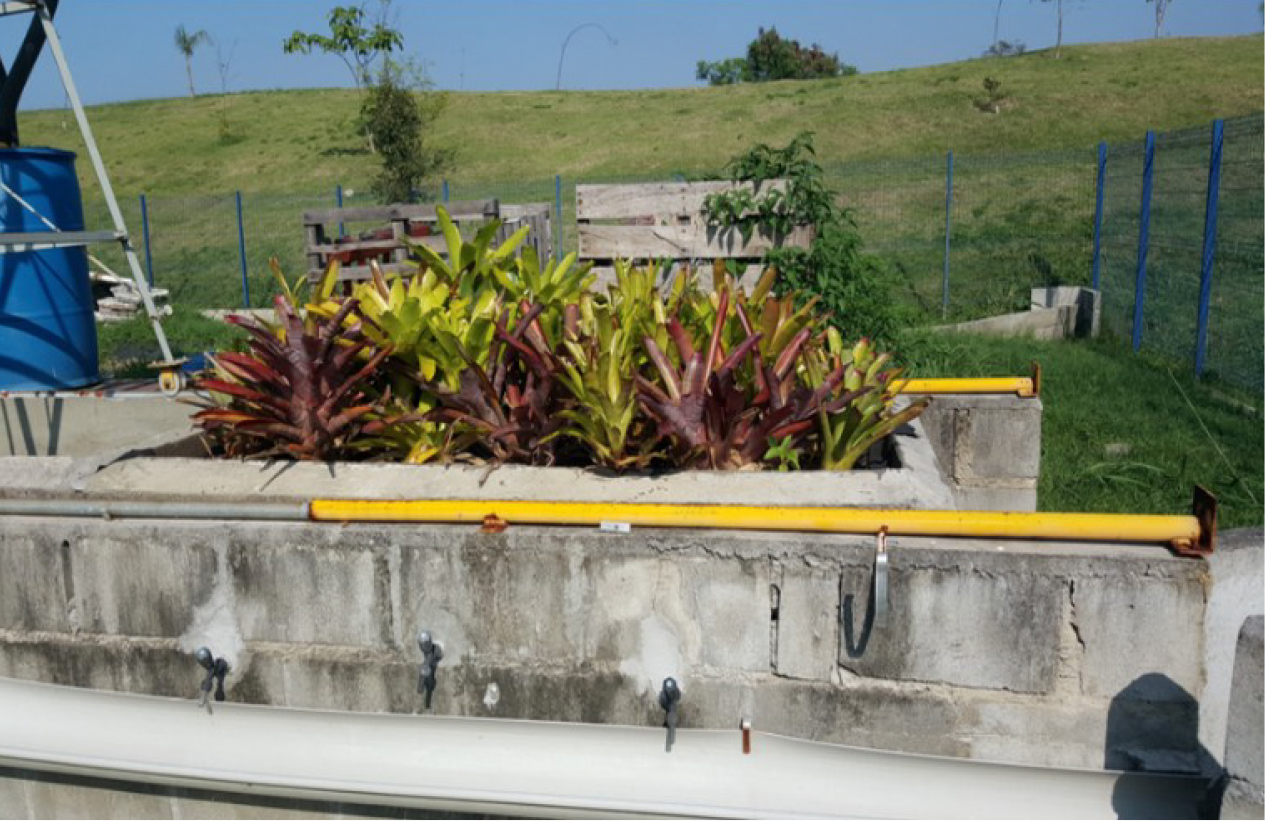
The prototype green roof was built at the Experimental Centre for Environmental Sanitation (CESA), located at the Federal University of Rio de Janeiro, University City, in the city of Rio de Janeiro, as shown in Figure 2. The green roof configuration consisted of the following layers: waterproofing layer, draining layer, filtering layer, substrate layer, organic matter layer, substrate protection layer and vegetation layer. The plant layer is composed of Neoregelia cruenta bromeliads, as shown in Figure 3. The layers and their thicknesses can be seen in Figure 4.
Within the Retained Volume (RV) of water by the system, only the volume corresponding to the interception by the bromeliads' vegetation (VVeg. int.) and the volume lost through evapotranspiration (VEvapot.) will be analysed. The water retained in the internal layers of the system (VInt.), such as in the substrate, both at its surface layer and throughout its entire thickness, as well as the volume retained by the drainage layer through the expanded clay, will not be analysed in the present study. Eq. (2) represents the components that make up the retained volume:
The Rain Gauge Box is a device developed by the Polytechnic School of the Federal University of Rio de Janeiro (UFRJ). The University filed a patent application for this equipment with the Brazilian National Institute of Industrial Property (INPI) under application number BR2020120286942. The inventor of this device is Professor Theophilo Benedicto Ottoni Filho, from the Department of Water Resources and Environmental Engineering at the Polytechnic School of UFRJ [52].
The equipment was designed to measure the main hydrological processes associated with rainfall, such as total precipitation, infiltration, and surface runoff, as well as to assess the erosion index associated with precipitation events. The Rain Gauge Box is a compact device, built from galvanised steel, measuring 1.00 × 0.90 × 0.70 m, consisting of a main body and a lid [52].
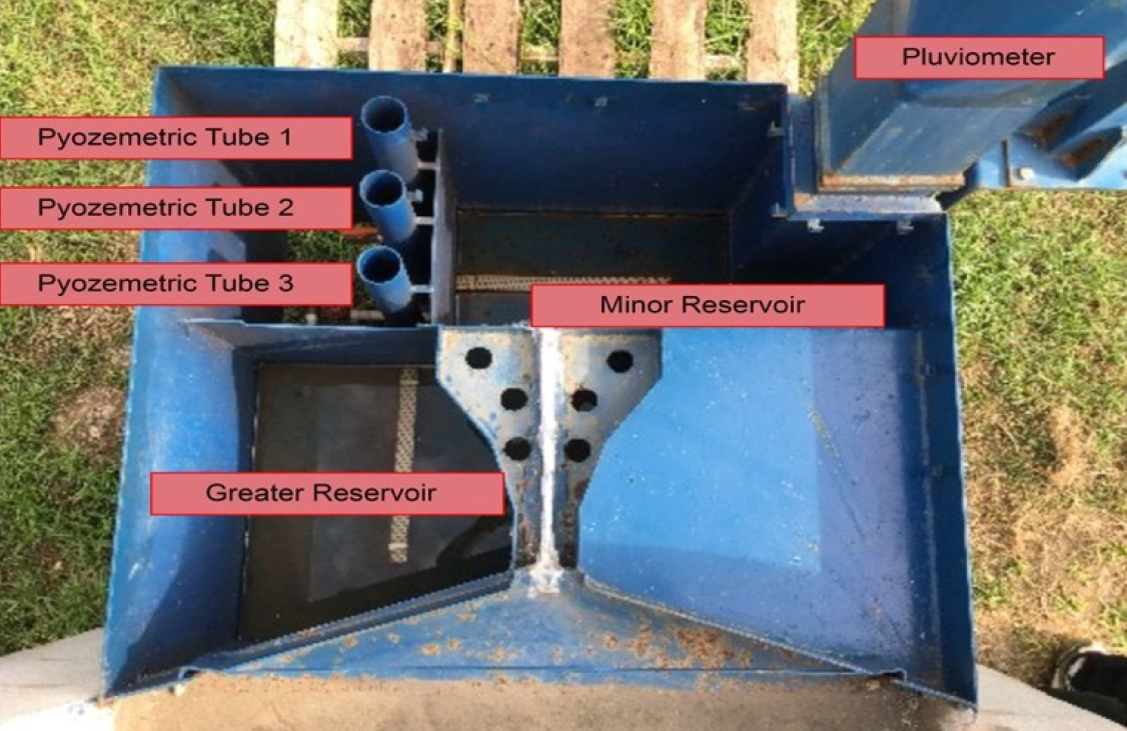
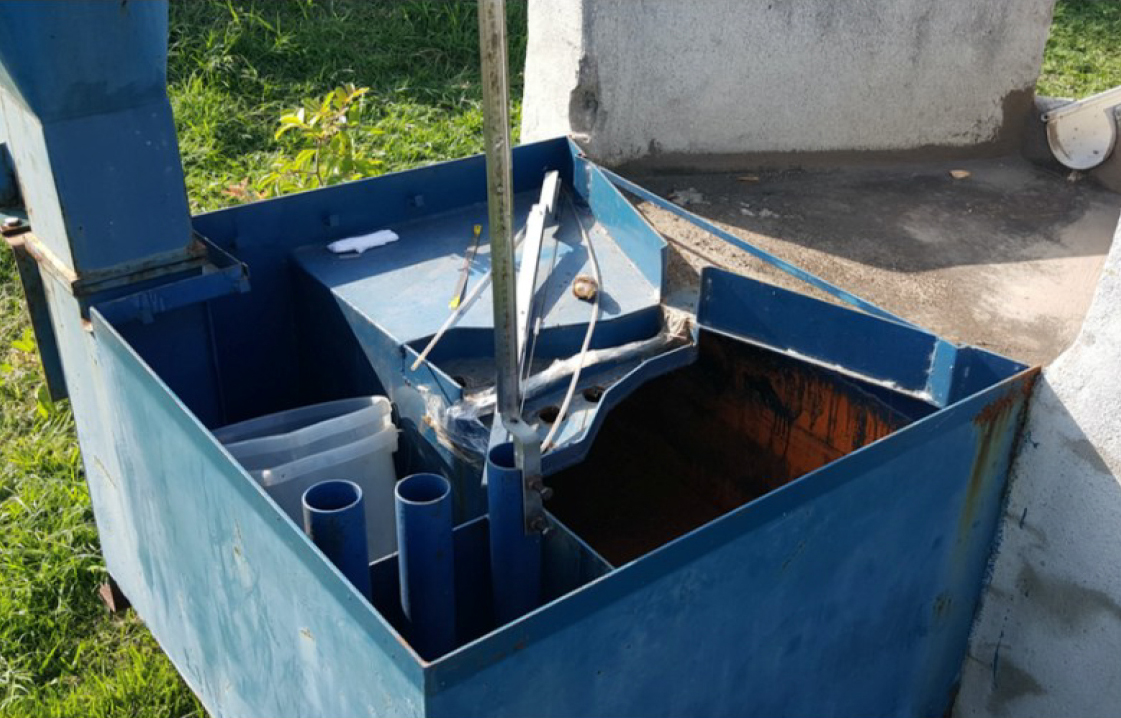
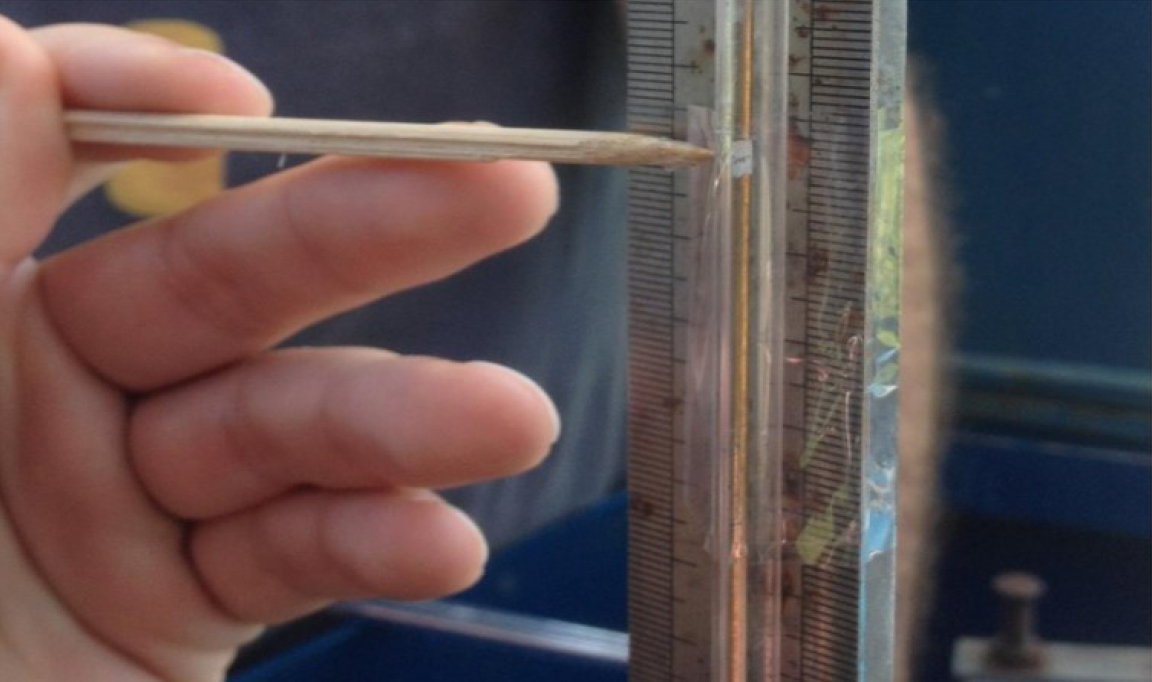
The pluviometer box has three compartments capable of storing water: the pluviometer, the larger reservoir, and the smaller reservoir. Each compartment is connected to a piezometric tube. Piezometric tube 1 is connected to the pluviometer, tube 2 to the smaller reservoir, and tube 3 to the larger reservoir (Figure 5). For the experiments conducted with the green roof, only the larger reservoir, with an area of 5,400 cm², and piezometric tube 3, with a cross-sectional area of 25.52 cm², were used. The reservoir water level is measured manually. A graduated ruler was fixed to the reservoir, and along its entire length, a small acrylic tube was glued, through which a metal rod moves. One end of the rod is free, while the other is attached to a small Styrofoam ball that floats according to the water level in the reservoir. The measurement is taken based on a mark on the metal rod. Figure 6 shows the rain gauge box with the installed measuring device, and Figure 7 presents a detailed view of the measuring device.
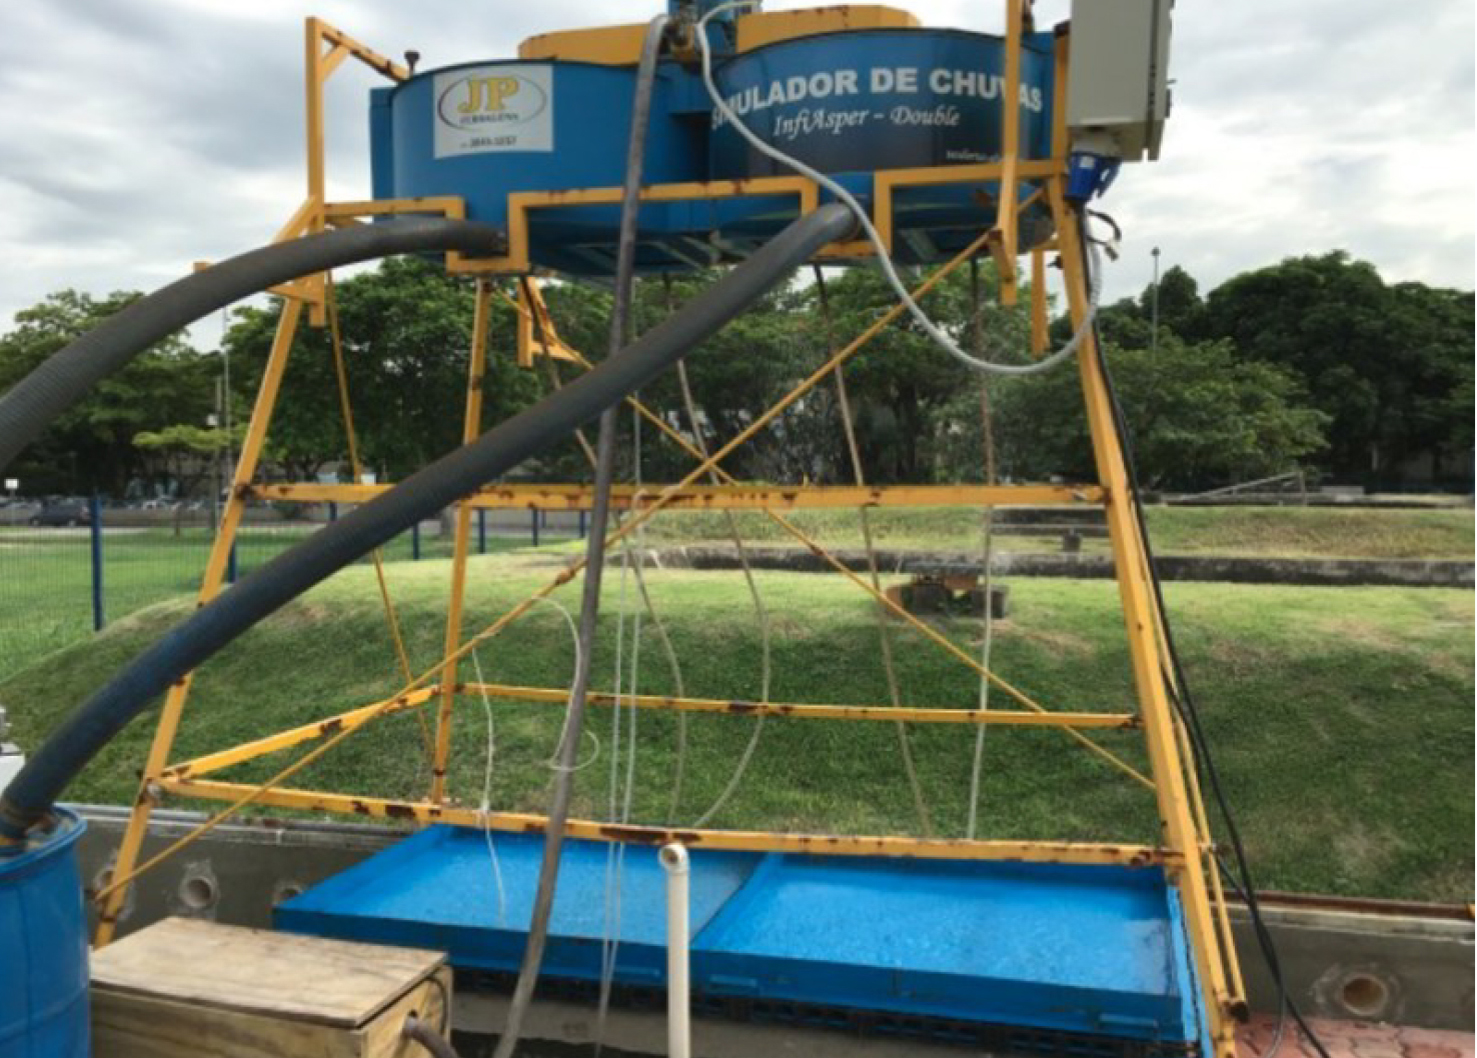
The rain simulator consists of a galvanised steel structure with casters at the base, allowing it to move on the rails on the experimental bench. At the top, there are two water interceptors with an adjustable shutter at the bottom; by adjusting the shutters' openings, one can control the intensity of rainfall. The rain simulator includes a reservoir with a capacity of 200 L, two return hoses connecting the interceptors to the reservoir, and a pump (Figure 8).
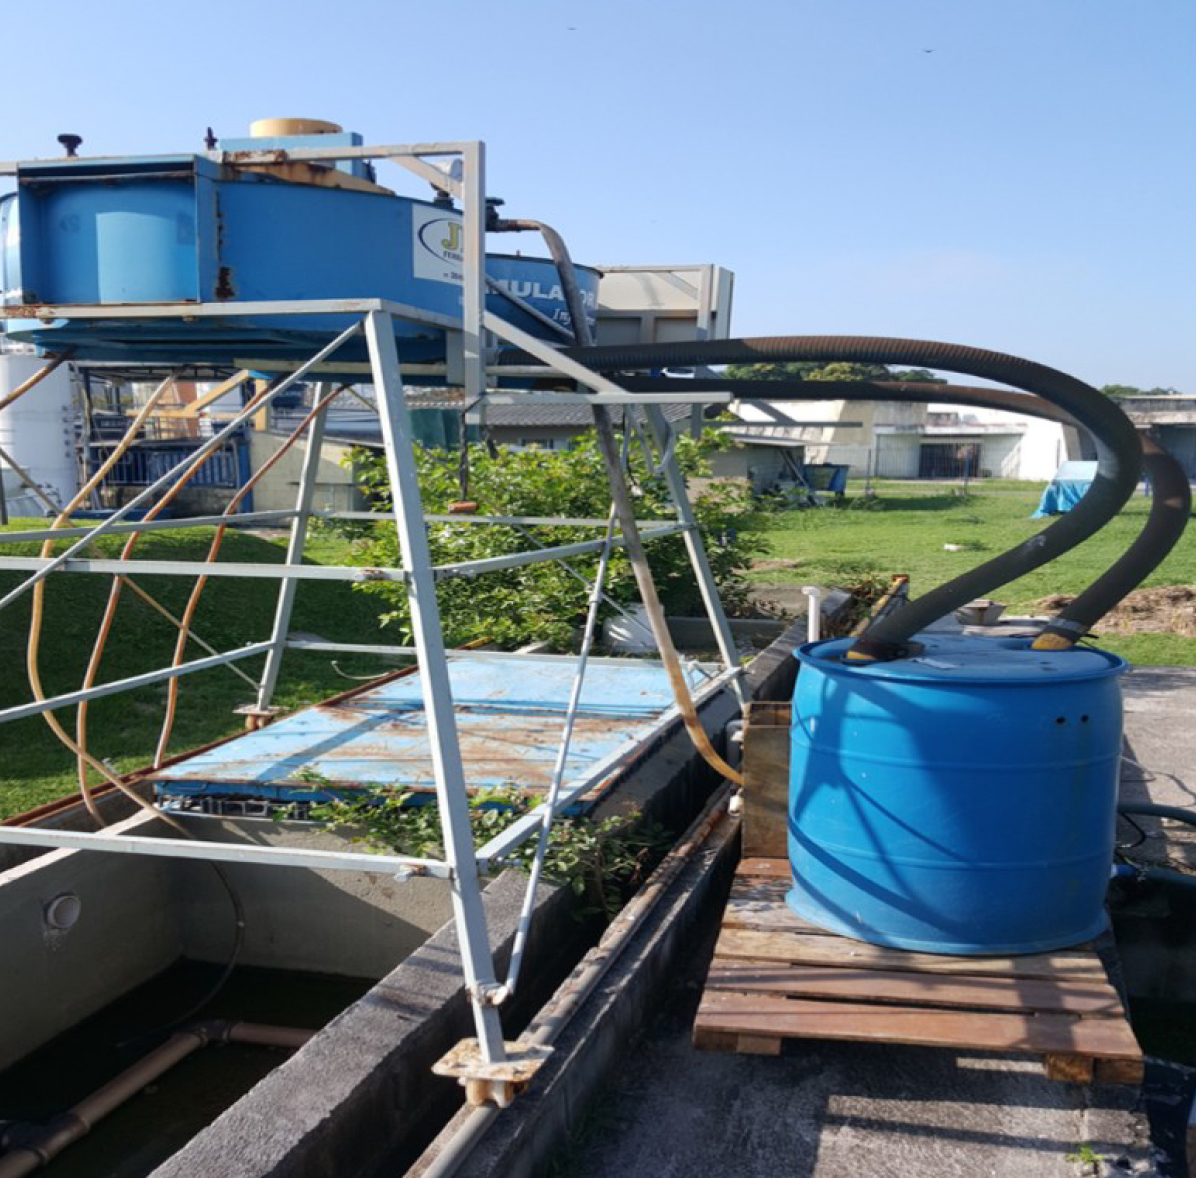
When the system is switched on, the pump conveys water from the reservoir to the water interceptors, which, through the rotation of the shutters, discharge the water through their small openings, thereby simulating rainfall. Excess water returns from the interceptors to the reservoir through return hoses. It is recommended that the water level in the reservoir be kept constant; therefore, throughout the experiment, the reservoir is continuously supplied by a hose connected to the water mains. The pump pressure must also be maintained constant to minimise variations in rainfall intensity.
All the tests carried out followed the steps: measurement of the initial volume of water in the bromeliads, measurement of the initial rain intensity (before the test), simulation of the rain on the green roof, measurement of the water drained by the roof in the rain box, measurement of the final rainfall intensity (after the test) and measurement of the final volume of water in the bromeliads.
Volume of plant interception. Within the volume of water retained by the system, only the volume corresponding to the interception by the bromeliad vegetation and the volume lost through evapotranspiration will be analysed. The water retained in the internal layers of the system, including the surface substrate and the entire depth, is not analysed in the present study. Similarly, the volume retained by the expanded clay drainage layer, which exhibits retention capacity and is described in detail by Garrido Neto [52], is not considered. Eq. (2), introduced in the preceding section, represents the components that make up the retained volume.
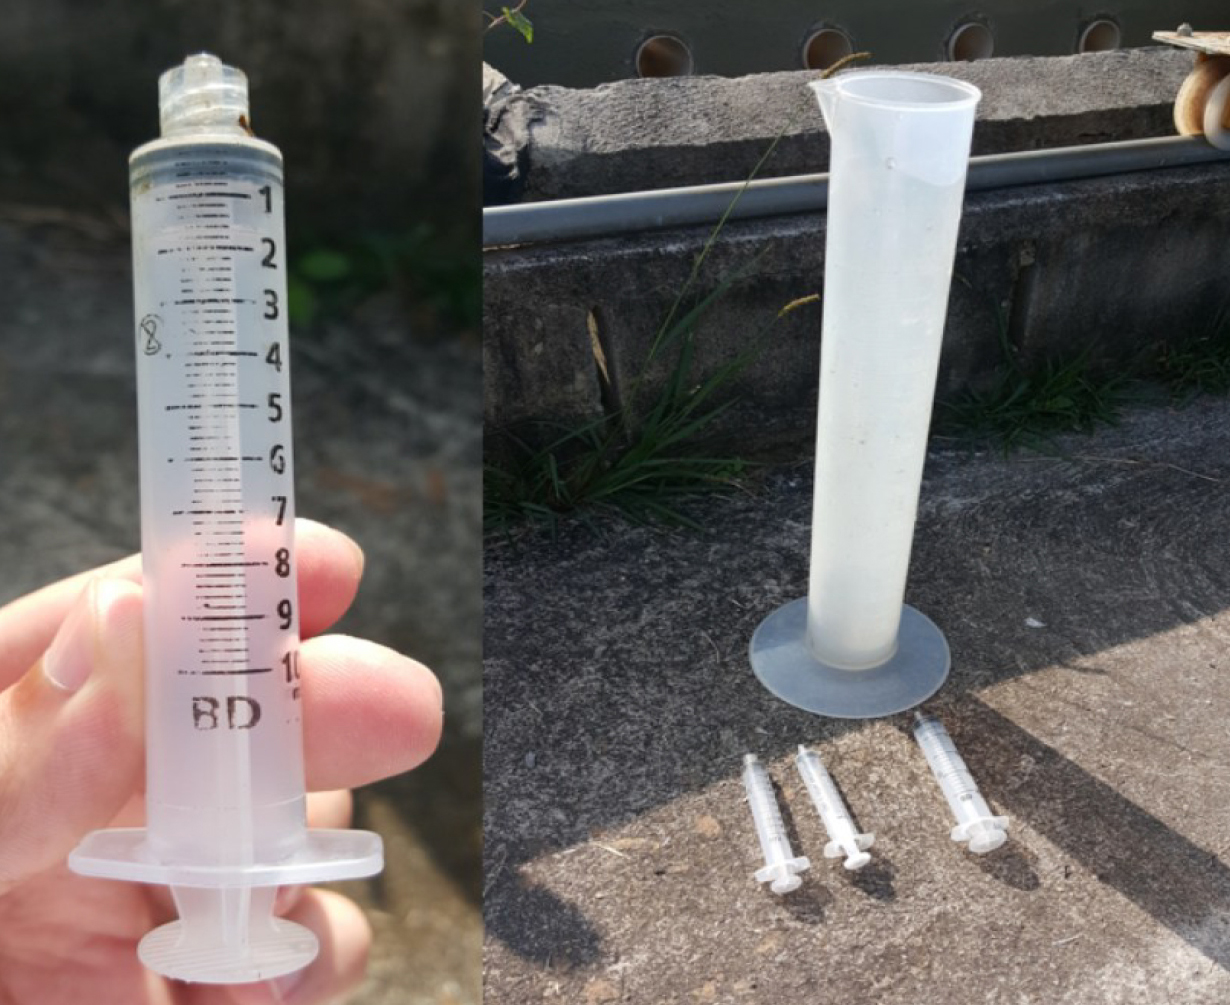
The initial and final volumes of water inside the bromeliads were measured using a plastic syringe and a graduated cup. It was a bothersome task due to the large number of bromeliads on the roof and the difficulty of removing their water without damaging or removing them from the ground. Therefore, bromeliads for each test were selected, seeking a range of sizes and characteristics to approximate the global configuration observed on the green roof.
Before each test, water was drawn from the bromeliad tanks by suction using a syringe and collected in the measuring cup until no more water could be drawn. The volume was recorded, and the removed water was returned to the interior of the respective bromeliad. After applying controlled rainfall on the roof, a new measurement was made on the same bromeliads previously chosen, allowing the volume stored by the bromeliads during the test, that is, plant interception, to be calculated. It should be noted that the measured volumes do not necessarily represent the total storage volume of the bromeliads, since in some cases, small amounts of water were still left in the bromeliads that could not be removed with the syringe; however, since a difference in volumes was analysed, this issue does not influence the final result. Still, it is possible that small-volume variations were caused by the methodology used for water withdrawal and by the syringe's inability to withdraw all the water. Figure 9 shows the syringe and measuring cylinder used in the measurement. The syringe used for the measurements had a total capacity of 10 mL and a 1 mL scale, while the graduated cylinder had a total capacity of 1000 mL and a 10 mL scale.
Rainfall intensity is calculated using the following equipment: two metal collecting plates with a total area of 1.8 m², a graduated bucket, and a graduated cylinder. The collecting plates are positioned beneath the rainfall simulator, at the same location where the green roof will be installed. A rainfall event with a duration of 6 minutes is then initiated. After this period, the simulator is turned off, and the water accumulated on each plate is transferred to the bucket for volume measurement. For greater accuracy, a graduated cylinder is used.
The volumes of water collected on the two plates are then summed, and rainfall intensity is calculated using eq. (3). This procedure is carried out both before and after the experiment. Due to possible variations in rainfall intensity during the test, the rainfall intensity value adopted is the average of the initial and final rainfall intensities:
where: RI denotes rainfall intensity [mm/h], Twv − total water volume [L], Tap − total area of the panels [m2], Rd − rain duration [h]. With the previously specified parameter values, the above equation can be replaced by eq. (4):
Figure 10 illustrates the simulation of rainfall over the collector plates. The test results are presented in Table 1.
| Test No. | Date | Duration [h] | Initial RI [mm/h] | Final RI [mm/h] | Adopted RI [mm/h] |
|---|---|---|---|---|---|
| 1 | 20/06/2023 | 0.5 | 141.9 | 153.6 | 147.8 |
| 2 | 27/06/2023 | 0.5 | 136.6 | 148.3 | 142.5 |
| 3 | 04/07/2023 | 0.5 | 146.1 | 150.0 | 148.0 |
| 4 | 11/07/2023 | 0.5 | 150.0 | 134.6 | 142.3 |
| 5 | 25/07/2023 | 1.5 | 97.2 | 111.8 | 104.5 |
After calculating the initial rainfall intensity, the simulator is moved to the green roof to begin the test itself. Once the simulator is in position, rainfall is initiated, and the starting time and the initial water level in the rain gauge box are recorded. The simulator remains in operation for the predetermined test duration. After some time, the water percolates through the roof layers until it reaches the drains. When the first trickle of water exits the drains and reaches the gutter, the time must be recorded as it corresponds to the elapsed time from the start of rainfall to discharge into the drainage system.
The next step is to record the time it takes for the water to travel the entire length of the gutter and drip into the rain gauge box. From that moment on, the water level inside the box is read every 60 seconds and recorded on the field data sheet. Even after rainfall ends, measurements must continue. They should stop only when the same water level is observed in five consecutive readings, indicating that the water volume has stabilised and the test has therefore concluded.
The total volume of water precipitated by the simulator can be obtained by multiplying the rainfall intensity, the green roof area (1.78 m²), and the rainfall duration, as shown in eq. (5):
where: PV denotes precipitated volume [L], RI − rainfall intensity [mm/h], Ra − roof surface area [m2], and Rd − rain duration [h]. The volume of water drained into the pluviometer box can be calculated from the variation in the water level inside the box, since the box has known dimensions, as previously stated. Thus, the drained water volume can be expressed by eq. (6):
where: Twv denotes total water volume [L], Areserv − area of the larger reservoir (5400 cm²), Apiezo − area of piezometer 3 (25.52 cm²), Hfinal − final reading of the water level in the rain gauge box [cm], and Hinitial − initial reading of the water level in the rain gauge box [cm].
Figure 11 illustrates the drains that convey water from the roof to the rain gauge box through the gutter.
A total of five tests were conducted in June and July 2023, with rainfall starting at approximately 11:00 a.m. The first four tests were performed with a rainfall intensity in the range of 150 mm/h and a duration of 30 minutes. The final test, to approximate the conditions used by Garrido Neto [52], had an intensity set to 100 mm/h and a duration of 1 hour and 30 minutes. One factor that directly influences the experimental results is the natural rainfall regime, since the green roof is exposed to weather conditions. To determine the rainfall volume before each test, precipitation data from the São Cristóvão Station were obtained from the Alerta Rio platform. Additionally, data from the Rio de Janeiro, Forte de Copacabana Station were collected from the National Institute of Meteorology (INMET) database. The values obtained for the São Cristóvão Station are presented in Table 1, and those for the Forte de Copacabana Station − in Table 3.
| Test No. | Date | Number of previous days without rain | Cumulative rainfall in the previous 24 h [mm] | Cumulative rainfall in the previous 96 h [mm] |
|---|---|---|---|---|
| 1 | 20/06/2023 | 0 | 4.2 | 4.2 |
| 2 | 27/06/2023 | 3 | 0 | 4.0 |
| 3 | 04/07/2023 | 0 | 0.4 | 10.6 |
| 4 | 11/07/2023 | 7 | 0 | 0 |
| 5 | 25/07/2023 | 6 | 0 | 0 |
| Test No. | Date | Number of previous days without rain | Cumulative rainfall in the previous 24 h [mm] | Cumulative rainfall in the previous 96 h [mm] |
|---|---|---|---|---|
| 1 | 20/06/2023 | 0 | 6.0 | 6.0 |
| 2 | 27/06/2023 | 3 | 0.0 | 6.6 |
| 3 | 04/07/2023 | 0 | 0.8 | 22.4 |
| 4 | 11/07/2023 | 7 | 0.0 | 0.0 |
| 5 | 25/07/2023 | 6 | 0.0 | 0.0 |
Considering the green roof as a closed system, that is, with no water loss, since the walls and base of the roof are waterproofed, all the water applied by the simulator is either retained within the system (VPrec.) or drained into the Rainwater Collection Box (VCP). The retained volume (RV) is calculated using eq. (7):
The total volume of water precipitated by the simulator was calculated using eq. (5). The volume of water drained into the rain box was calculated from the change in level inside the box, since the box has known dimensions. The volumes of water retained in the tests are presented in Table 4. The volume of water intercepted by the roof was calculated for some bromeliads, whose characteristics are described in Table 5. The volumes of water withdrawn before and after the test are shown in Table 6 and Table 7, respectively. The differences between the two, i.e. the volumes actually accumulated during the tests, are shown in Table 8.
| Date | Rainfall intensity [mm/h] | Precipitated volume [L] | Drained volume for rain gauge box [L] | Retained volume [L] |
|---|---|---|---|---|
| 20/06/2023 | 147.8 | 131.54 | 26.59 | 104.95 |
| 27/06/2023 | 142.5 | 126.83 | 17.90 | 108.93 |
| 04/07/2023 | 148.0 | 131.72 | 23.87 | 107.85 |
| 11/07/2023 | 142.3 | 126.65 | 22.79 | 103.86 |
| 25/07/2023 | 104.5 | 279.02 | 81.65 | 197.37 |
| Reference | Size | Height [cm] | Leaf diameter [cm] | Cup diameter [cm] |
|---|---|---|---|---|
| 1 | Medium | 30 | 28 | 4.0 |
| 2 | Medium | 28 | 27 | 5.0 |
| 3 | Small | 20 | 23 | 4.5 |
| 4 | Small | 14 | 18 | 4.0 |
| 5 | Large | 44 | 39 | 6.5 |
| 6 | Large | 38 | 33 | 5.5 |
| 7 | Medium | 28 | 33 | 6.0 |
| 8 | Large | 36 | 33 | 7.0 |
| 9 | Large | 35 | 32 | 6.0 |
| 10 | Large | 54 | 30 | 6.0 |
| Volume before rain [mL] | |||||
|---|---|---|---|---|---|
| Reference | 20/06/2023 | 27/06/2023 | 04/07/2023 | 11/07/2023 | 25/07/2023 |
| 1 | 60 | 20 | 45 | 15 | 20 |
| 2 | 95 | 90 | 150 | 70 | 30 |
| 3 | 20 | 15 | 15 | - | - |
| 4 | 12 | 13 | 12 | - | - |
| 5 | 50 | 40 | - | - | - |
| 6 | 30 | 38 | - | - | - |
| 7 | - | 150 | 130 | 70 | 25 |
| 8 | - | 110 | 75 | 5 | 15 |
| 9 | - | - | 70 | 10 | 30 |
| 10 | - | - | - | 30 | 15 |
| Volume after rain [mL] | |||||
|---|---|---|---|---|---|
| Reference | 20/06/2023 | 27/06/2023 | 04/07/2023 | 11/07/2023 | 25/07/2023 |
| 1 | 110 | 110 | 100 | 115 | 110 |
| 2 | 250 | 250 | 265 | 200 | 280 |
| 3 | 60 | 50 | 55 | - | - |
| 4 | 30 | 30 | 30 | - | - |
| 5 | 140 | 130 | - | - | - |
| 6 | 90 | 75 | - | - | - |
| 7 | - | 215 | 230 | 220 | 190 |
| 8 | - | 220 | 250 | 220 | 240 |
| 9 | - | - | 110 | 105 | 100 |
| 10 | - | - | - | 100 | 100 |
| Cumulative volume [mL] | |||||
|---|---|---|---|---|---|
| Reference | 20/06/2023 | 27/06/2023 | 04/07/2023 | 11/07/2023 | 25/07/2023 |
| 1 | 50 | 90 | 55 | 100 | 90 |
| 2 | 155 | 160 | 115 | 130 | 250 |
| 3 | 40 | 35 | 40 | - | - |
| 4 | 18 | 17 | 18 | - | - |
| 5 | 90 | 90 | - | - | - |
| 6 | 60 | 37 | - | - | - |
| 7 | - | 65 | 100 | 150 | 165 |
| 8 | - | 110 | 175 | 215 | 225 |
| 9 | - | - | 40 | 95 | 70 |
| 10 | - | - | - | 70 | 85 |
To calculate the total volume intercepted by the roof, the Student's t-distribution was used to estimate a confidence interval for the average volume of water that each bromeliad can accumulate. The Student's t-distribution is a continuous probability distribution primarily used in statistical inference when the sample size is small, and the population variance is unknown.
For the application of the method, the following parameters are required: the number of sample elements, the sample mean, the sample standard deviation, the degrees of freedom (sample size minus one), and the choice of confidence level, which in this case was set to 90%. Given the confidence level and degrees of freedom, the Student's t-distribution table is used to obtain the coefficient. The confidence interval is determined by its lower and upper limits according to formula (8):
where: m denotes the sample mean, s − sample standard deviation, t − critical value from Student's t-distribution corresponding to the selected confidence level and degrees of freedom, and n − number of sample elements.
A 90% confidence level was adopted for the Student's t-distribution due to the limited sample size and the exploratory nature of the analysis, aiming to increase sensitivity in detecting statistically significant differences while maintaining an acceptable level of statistical rigour. Therefore, the average volume intercepted by each bromeliad will be within the above range, with 90% confidence. To calculate the total intercepted by the entire green roof, simply multiply the values of the interval by the number of bromeliads on the roof (58). The values found for each assay are presented in Table 9.
| Test date | 20/06/2023 | 27/06/2023 | 04/07/2023 | 11/07/2023 | 25/07/2023 |
|---|---|---|---|---|---|
| Sample size n | 6 | 8 | 7 | 6 | 6 |
| Degrees of freedom n − 1 | 5 | 7 | 6 | 5 | 5 |
| Confidence level | 90% | 90% | 90% | 90% | 90% |
| Average m | 68.83 | 75.50 | 77.57 | 126.67 | 147.50 |
| Standard deviation s | 48.42 | 46.91 | 55.19 | 51.54 | 77.51 |
| t-Student coefficient t | 2.02 | 1.89 | 1.94 | 2.02 | 2.02 |
| Lower range | 29.00 | 44.08 | 37.03 | 84.27 | 83.74 |
| Upper range | 108.66 | 109.92 | 118.11 | 169.07 | 211.26 |
| Population size | 58 | 58 | 58 | 58 | 58 |
| Min. volume of population [mL] | 168.23 | 2556.40 | 2148.01 | 4887.40 | 4856.85 |
| Median volume of population [mL] | 3992.33 | 4379.00 | 4499.14 | 7346.67 | 8555.00 |
| Max. volume of population [mL] | 6302.44 | 6201.60 | 6850.28 | 9805.94 | 12253.15 |
The input data for the Penman-Monteith FAO equation (PM FAO 56) previously presented were obtained from the National Institute of Meteorology (INMET) database. To improve accuracy, data from two meteorological stations, Rio de Janeiro, Forte de Copacabana and Rio de Janeiro, Vila Militar, were taken, and the reference evapotranspiration value was calculated as the average of both stations. For the purpose of calculation, evapotranspiration is considered to occur on a permanent basis, and its daily value is divided equally over the entire period of one day. Therefore, the evapotranspiration rate corresponding to half an hour will be 48° part of the daily rate, and the volume of evapotranspired water will be calculated by the product of the evapotranspiration rate and the roof area. Table 10 shows the values found.
| Test date | Duration [h] | Forte de Copacabana Station | Vila Militar Station | Station average | Volume of water [mL] |
|---|---|---|---|---|---|
| ETo [mm/d] | ETo [mm/d] | ETo [mm/d] | |||
| 20/06/2023 | 0.5 | 1.89 | 1.82 | 1.86 | 68.79 |
| 27/06/2023 | 0.5 | 2.42 | 2.14 | 2.28 | 84.55 |
| 04/07/2023 | 0.5 | 2.01 | 2.04 | 2.03 | 75.09 |
| 11/07/2023 | 0.5 | 2.40 | 2.28 | 2.34 | 86.78 |
| 25/07/2023 | 1.5 | 2.79 | 2.65 | 2.72 | 302.60 |
To analyse the contribution of plant interception and evapotranspiration in water retention by the green roof, Table 11 shows the percentages that each volume represents of the total precipitation. From the results of each test, an average percentage value of the volume of plant interception and the volume of evapotranspiration can be obtained, both as a function of the precipitated volume and as a function of the retained volume. These values are shown in Table 12.
| Test | 20/06/2023 | 27/06/2023 | 04/07/2023 | 11/07/2023 | 25/07/2023 | |
|---|---|---|---|---|---|---|
| Plant interception volume | Minimum | 1.28% | 2.02% | 1.63% | 3.86% | 2.74% |
| Medium | 3.04% | 3.45% | 3.42% | 5.80% | 3.07% | |
| Maximum | 4.79% | 4.89% | 5.20% | 7.74% | 4.39% | |
| Evapotranspiration volume | 0.05% | 0.07% | 0.06% | 0.07% | 0.11% | |
| Average of tests | Percentage of precipitated volume | Percentage of volume retained | |
|---|---|---|---|
| Plant interception volume | Minimum | 2.31% | 2.90% |
| Medium | 3.76% | 4.68% | |
| Maximum | 5.40% | 6.74% | |
| Evapotranspiration volume | 0.07% | 0.09% | |
It can be observed that the volume of water in the tank of the same bromeliad, after the rain, did not vary significantly from one test to another, unlike the volume measured before the rain. This behaviour can be attributed to the fact that, after rainfall events, bromeliads tend to be close to their maximum interception capacity. Before rainfall, however, the stored water volume varies according to factors such as air temperature, relative humidity, natural rainfall patterns, initial substrate moisture, and drainage conditions, leading the same bromeliad to exhibit substantially different volumes across experiments.
The value of the contribution of plant interception will be adopted as the mean value of the confidence limit, 3.76% of the precipitated volume and 4.68% of the retained volume. The evapotranspiration volume represents only 0.07% of the precipitated volume and 0.09% of the retained volume. Plant interception plays an important role in precipitation retention, accounting for 5.4% and reaching almost 8% if the upper limit of the confidence interval in Table 12 is considered.
From the results obtained, it is evident that evapotranspiration's contribution to retention during a rain event is practically negligible, accounting for only 0.07% of the precipitated volume and reaching a maximum of 0.11% in the last test. Although evapotranspiration contributes minimally at short temporal scales, its cumulative effect becomes substantial over longer periods, playing a significant role in the overall water balance.
A systematic comparison between this study's results and those reported in the literature reveals strong agreement on the role of vegetation interception in green roof hydrology. The average interception observed in this study (3.76% of the precipitated volume, reaching up to 5.40% and nearly 8% considering the upper confidence interval) is consistent with values reported by Mendes et al. [37], who found interception capacities on the order of a few millimeters under controlled rainfall conditions, and by Nakayoshi et al. [38], who reported interception values of approximately 6% at the urban scale. This similarity suggests that, despite differences in vegetation type, climatic conditions, and experimental setups, interception tends to represent a relatively small but consistent fraction of total precipitation. In contrast, evapotranspiration contributed negligibly at the event scale in the present study (approximately 0.07%), consistent with previous findings that evaporation losses during short rainfall events are limited but may become significant when evaluated over longer temporal scales. Overall, this comparison reinforces the reliability of the experimental approach and highlights that the hydrological behaviour observed in bromeliad-based green roofs is coherent with broader patterns reported in the literature.
The greatest contribution to water retention in the green roof comes from its inner layers. The main reason may be the high water absorption capacity of expanded clay, which is around 10% over 24 hours, according to Cinexpan [55]. The green roof prototype turns out to exhibit an internal storage effect, driven by hydraulic control of the drainage layer's outflow during rain events of greater intensity. Thus, water begins to accumulate in the inner layers of the green cover and can saturate the drainage (expansive clay) and substrate layers (sand and organic soil).
The growth of the global population has intensified urbanisation and related problems, such as flooding, which causes significant social, economic, and infrastructural impacts. As a mitigation strategy, green roofs have been proposed as a compensatory solution for urban drainage. They reduce peak flows by absorbing rainfall and gradually releasing it, while also providing additional benefits such as mitigating urban heat islands, reducing noise, and increasing biodiversity.
This study presents experimental tests on a green roof prototype and the associated instrumentation. The results show effective stormwater retention, with plant interception within the range reported in the literature. Evapotranspiration values were also consistent with previous studies, although their contribution to short-term retention was relatively low.
The results of this study are consistent with the literature, confirming the importance of vegetation interception in stormwater retention processes. The observed contribution of plant interception was approximately 5% of the precipitated volume. Although evapotranspiration contributed negligibly in the short term, the findings reinforce that vegetation interception plays an important, albeit secondary, role compared to the storage capacity of the system layers. Overall, the agreement between experimental and bibliographic results supports the reliability of the adopted methodology and highlights the importance of considering both structural and vegetative components in the hydrological performance of green roofs.
The results indicate that more than 90% of the retained water volume is associated not with evapotranspiration or plant interception, but with storage within the system's internal layers, particularly the substrate and the expanded clay drainage layer. This finding highlights the dominant role of the green roof's physical structure in stormwater retention and suggests that design parameters related to substrate depth and drainage composition exert a greater influence on water retention performance than vegetation-related processes, especially at short temporal scales.
Future research should expand the analysis of plant interception to different species and further investigate the water retention capacity of green roof layers, such as the expanded clay drainage layer, under natural meteorological conditions. Monitoring both individual rainfall events and longer periods (e.g., weekly or biweekly) would enable evaluation under realistic rainfall variability and provide a more comprehensive understanding of interception, evapotranspiration, and storage processes. Additionally, future work should include direct comparisons with previously published studies to better contextualise the results, identify trends, and assess system performance under different conditions, thereby strengthening the overall analysis.
The authors would like to acknowledge the support of Conselho Nacional de Desenvolvimento Científico e Tecnológico (CNPq 302618/2026-0), Fundação Carlos Chagas Filho de Amparo à Pesquisa do Estado do Rio de Janeiro (FAPERJ E-26/210.569/2025 (305234)), and the Grant PID2024-155409OB-C21 funded by MICIU/AEI/10.13039/501100011033/FEDER, EU, which helped in the development of this research.
- ,
Permeable Concrete Based on Construction and Demolition Waste Aggregates Used in Permeable Paving Slabs ,J. Sustain. Dev. Energy, Water Environ. Syst. , Vol. 13 (2), 2025, https://doi.org/10.13044/j.sdewes.d13.0581 - ,
Macrosystems ecology: A new engine and frontier in contemporary ecosystem science ,Geogr. Sustain. , Vol. 6 , 2025, https://doi.org/10.1016/j.geosus.2025.100334 - ,
The urban hierarchy and agglomeration effects influence the response of NPP to climate change and human activities ,Glob. Ecol. Conserv. , Vol. 51 , 2024, https://doi.org/10.1016/j.gecco.2024.e02904 - , Adaptive capacity in ecosystems, Resilience in Complex Socio-ecological Systems, 2019
- ,
Cross-platform information propagation under environmental feedback with psychological and behavioral control dynamics ,Appl. Math. Comput. , Vol. 523 , 2026, https://doi.org/10.1016/j.amc.2026.130020 - ,
Global effects of different types of land use and land cover changes on near-surface air temperature ,Agric. For. Meteorol. , Vol. 327 , 2022, https://doi.org/10.1016/j.agrformet.2022.109232 - ,
Biodiversity-Climate-Society Nexus assessment through Participatory System Dynamics Model. The case study of Amazon forest-based value chain ,Sci. Total Environ. , Vol. 991 , 2025, https://doi.org/10.1016/j.scitotenv.2025.179893 - ,
Economic development and climate change: Achieving a sustainable balance ,Clean. Eng. Technol. , Vol. 26 , 2025, https://doi.org/10.1016/j.clet.2025.100939 - ,
Anthropogenic Land Use and Land Cover ChangesA Review on Its Environmental Consequences and Climate Change ,J. Indian Soc. Remote Sens. , Vol. 50 (8), :1615-16402022, https://doi.org/10.1007/s12524-022-01569-w - ,
Impacts of changes in land use and land cover on atmospheric chemistry and air quality over the 21st century ,Atmos. Chem. Phys. , Vol. 12 (3), :1597-16092012, https://doi.org/10.5194/acp-12-1597-2012 - ,
Urban green space, public health, and environmental justice: The challenge of making cities just green enough, ,Landsc. Urban Plan. , Vol. 125 , :234-2442014, https://doi.org/10.1016/j.landurbplan.2014.01.017 - ,
Floods in future climates: a review ,J. Flood Risk Manag. , Vol. 5 , :336-3652012, https://doi.org/10.1111/j.1753-318X.2012.01150.x - ,
Urban Stormwater Governance: The Need for a Paradigm Shift ,Environ. Manage. , Vol. 57 , :1112-11242016, https://doi.org/10.1007/s00267-016-0667-5 - ,
Naturação, água e o futuro das cidades no contexto das mudanças ambientais globais (in Portuguese, Nature, water and the future of cities in the context of global environmental changes) ,Congresso Brasileiro de Arquitetos (in Portuguese, Brazilian Congress of Architects) , Vol. 1 , :1-82003 - ,
Viability of Green Roofs as a Flood Mitigation Element in the Central Region of Chile ,Sustain. , Vol. 10 , 2018, https://doi.org/10.3390/su10041130 - ,
The combined performance of green roof and rainwater harvesting: retention capacity and water saving ,Blue-Green Syst. , Vol. 7 (1), :238-2572025, https://doi.org/10.2166/bgs.2025.041 - ,
Modelling runoff reduction through implementation of green and grey roofs in urban catchments using PCSWMM ,Urban Water J. , Vol. 17 (9), :813-8262020, https://doi.org/10.1080/1573062X.2020.1828500 - ,
Assessment of Rainwater Treatment Using Sand and Gravel Filtration and Chlorine Disinfection for Non-Potable Domestic Reuse ,Buildings , Vol. 15 , 2025, https://doi.org/10.3390/buildings15203759 - ,
Impact of native vegetation and soil moisture dynamics on evapotranspiration in green roof systems ,Sci. Total Environ. , Vol. 952 , 2024, https://doi.org/10.1016/j.scitotenv.2024.175747 - ,
Modelling of green roof hydrological performance for urban drainage applications ,J. Hydrol. , Vol. 519 , :3237-32482014, https://doi.org/10.1016/j.jhydrol.2014.10.030 - ,
A bibliometric analysis and overview of the effectiveness of Nature-based Solutions in catchment scale flood mitigation ,Nature-Based Solut. , Vol. 7 , 2025, https://doi.org/10.1016/j.nbsj.2025.100235 - ,
Simplified Interception/Evaporation Model ,Hydrology , Vol. 8 , 2021, https://doi.org/10.3390/hydrology8030099 - ,
Measuring interception loss and canopy storage in dryland vegetation: a brief review and evaluation of available research strategies ,Hydrol. Process. , Vol. 14 (4), :669-6782000, https://doi.org/10.1002/(SICI)1099-1085(200003)14:4<669::AID-HYP965>3.0.CO;2-I - ,
Analysis of canopy interception characteristics and influencing factors in typical artificial forest in the Loess Plateau semi-arid region ,J. Environ. Manage. , Vol. 370 (3), 2024, https://doi.org/10.1016/j.jenvman.2024.122455 - ,
The Evapotranspiration Characteristics and Evaporative Cooling Effects of Different Vegetation Types on an Intensive Green Roof: Dynamic Performance Under Different Weather Conditions ,Sustain. , Vol. 16 , 2024, https://doi.org/10.3390/su162410812 - ,
Stormwater retention capacity of blue-green roofs with various configurations: Observational data and modelling ,J. Hydrol. , Vol. 645 , 2024, https://doi.org/10.1016/j.jhydrol.2024.132092 - ,
Urban Flood Resilience: A comprehensive review of assessment methods, tools, and techniques to manage disaster ,Prog. Disaster Sci. , Vol. 20 , 2023, https://doi.org/10.1016/j.pdisas.2023.100299 - ,
Neighborhood-scale assessment of urban flood impacts on transportation network resilience: A case study of Mavişehir, Izmir ,Int. J. Disaster Risk Reduct. , Vol. 132 , 2026, https://doi.org/10.1016/j.ijdrr.2025.105970 - ,
Enhancing resilience: Understanding the impact of flood hazard and vulnerability on business interruption and losses ,Water Resour. Econ. , Vol. 46 , 2024, https://doi.org/10.1016/j.wre.2024.100244 - ,
Flooded Cities ,Am. Econ. J. Appl. Econ , Vol. 12 , :35-662020, https://doi.org/10.1257/app.20170066 - ,
The origins of SWOT analysis ,Long Range Plann. , Vol. 56 (3), 2023, https://doi.org/10.1016/j.lrp.2023.102304 - ,
Living at the edge: Varying substrate depth on green roofs affects the microclimate and plant establishment ,Urban For. Urban Green. , Vol. 114 , 2025, https://doi.org/10.1016/j.ufug.2025.129175 - ,
Water-retention additives increase plant available water in green roof substrates ,Ecol. Eng. , Vol. 52 , :112-1182013, https://doi.org/10.1016/j.ecoleng.2012.12.098 - ,
Drought-avoiding plants with low water use can achieve high rainfall retention without jeopardising survival on green roofs ,Sci. Total Environ. , Vol. 603–604 , :340-3512017, https://doi.org/10.1016/j.scitotenv.2017.06.061 - ,
Vegetation hydrology and slope interaction under variable infiltration: a state-of-the-art review ,J. Infrastruct. Preserv. Resil. , Vol. 6 , 2025, https://doi.org/10.1186/s43065-025-00152-0 - ,
A review of the characteristics of rainfall simulators in soil erosion research studies ,MethodsX , Vol. 12 , 2024, https://doi.org/10.1016/j.mex.2023.102506 - ,
Evaluation of Rainfall Interception by Vegetation Using a Rainfall Simulator ,Sustain. , Vol. 13 , 2021, https://doi.org/10.3390/su13095082 - ,
Experimental study on rainfall interception over an outdoor urban-scale model ,Water Resour. Res. , Vol. 45 (4), 2009, https://doi.org/10.1029/2008WR007069 - ,
Key Barriers and Feasibility of Implementing Green Roofs on Buildings in Malaysia ,Buildings , Vol. 13 , 2023, https://doi.org/10.3390/buildings13092233 - ,
Urban-microclimate effect on vector mosquito abundance of tropical green roofs ,Build. Environ. , Vol. 112 , :63-762017, https://doi.org/10.1016/j.buildenv.2016.11.028 - ,
An assessment model of benefits, opportunities, costs, and risks of green roof installation: A multi criteria decision making approach ,J. Clean. Prod. , Vol. 238 , 2019, https://doi.org/10.1016/j.jclepro.2019.117956 - ,
Satellite Remote Sensing of Precipitation and the Terrestrial Water Cycle in a Changing Climate ,Remote Sens. , Vol. 11 , 2019, https://doi.org/10.3390/rs11192301 - , , Hidrologia básica, 1976
- ,
Estimating Changes in Peak Flow and Associated Reductions in Flooding Resulting from Implementing Natural Infrastructure in the Neuse River Basin, North Carolina, USA ,Water , Vol. 14 , 2022, https://doi.org/10.3390/w14091479 - , , Evaporação e evapotranspiração, 2009
- ,
Water Retention Capacity of Leaf Litter According to Field Lysimetry ,Forests , Vol. 14 , 2023, https://doi.org/10.3390/f14030478 - ,
Effects of rainfall intensity, underlying surface and slope gradient on soil infiltration under simulated rainfall experiments ,Catena , Vol. 104 , :93-1022013, https://doi.org/10.1016/j.catena.2012.10.013 - ,
Leaf area index and normalized difference vegetation index as predictors of canopy characteristics and light interception by riparian species on the Lower Colorado River ,Agric. For. Meteorol. , Vol. 125 , :1-172004, https://doi.org/10.1016/j.agrformet.2004.03.008 - , Importância da Evapotranspiração para a agricultura irrigada (in Portuguese, Importance of Evapotranspiration for Irrigated Agriculture), ÁREA DE HIDRÁULICA E IRRIGAÇÃO DA UNESP (in Portuguese, Hydraulics and Irrigation Department), 2013
- ,
Estimativa da Evapotranspiração de Referência (Eto Padrão FAO), Para Minas Gerais, na Ausência de Alguns Dados Climáticos (in Portuguese, Estimation of Reference Evapotranspiration (FAO Standard ETo) for Minas Gerais under Conditions of Missing Climatic Data) ,J. Brazilian Assoc. Agric. Eng. , Vol. 35 , :39-502015, https://doi.org/10.1590/1809-4430-Eng.Agric.v35n1p39-50/2015 - , centro experimental de saneamento ufrj
- , Telhados Verdes como Técnica Compensatória em Drenagem Urbana na Cidade do Rio de Janeiro: Estudo Experimental e Avaliação de sua Adoção na Bacia do Rio Joana a partir do Uso de Modelagem Matemática, Universidade Federal do Rio de Janeiro, 2016
- , Rain forecast today! / Previsão de Chuva HOJE!
- , Análises Meteorológicas / Weather Analysis
- , Cinexpan Argila Expandida, 2026