


The construction industry appears to be responsible for the consumption of huge amounts of water. Particularly, the ready-mixed concrete plants, besides from the necessary water used for the production of concrete (a typical value of water/cement ratio is 0.5), consume a substantially greater amount of water, than that used for concrete production, for washing out truck mixer drums at the end of each shift. It is estimated that approximately 1500 l of water are used for washing out one truck daily [1]. Apart from that, the water discharged from the trucks is characterized as hazardous for disposal from European (Environmental Agency’s Special Waste Regulations) [1] and U.S. (EPA) legislation [2], since it has a pH value over 11.5. Recent studies demonstrated promising results regarding the reuse of ready-mixed concrete wastewater in several ratios with fresh water for concrete production [3], [4].
The originality of this study is that it suggests sludge water being used without any dilution with fresh water or any treatment. The results displayed below demonstrate that sludge water, when used for the production of cement mortars, can achieve better compressive strength compared to fresh water. Additionally, if prior water treatment has taken place to ensure the compliance of the water with national regulations, there is a possibility of even better results.
Moreover, dry sludge can be used as a cement or sand filler for concrete production. The fact that this material has this natural fineness, instead of being a hazardous waste, helps utilizing it as a fine by-product replacing very commonly used limestone cement fillers. This would help preserving natural resources, saving energy (grinding is a very energy intensive process) and recycling wastes.
The physical and chemical properties of the above materials have been examined in previous studies [5], [6] and the results showed that:
i) Sludge water occurring directly from the ready-mixed concrete truck washout has chemical properties allowing it to be used as concrete mixing water according to EN [7] and ASTM [8] standards but it does not comply with the Hellenic Standard [9]
ii) Sludge, found in the bottom of the water settling tanks, contains approximately 70% water. The chemical analysis of its dry mass showed that it mainly consists of calcite (CaCO3) and portlantite (Ca(OH)2). It is also worth noting that its residue from a 90 pm sieve is only 0.8%.
The experimental part can be divided into two different sections; the first section focuses on the influence of the sludge water to the properties of the cement mortars, including the different treatments that took place in all water samples. Meanwhile the second one deals with the role of sludge both in its wet and dry status as a filler ingredient in the cement mortar composition.
It is obvious from Table 1 that the goal of all treatment was to achieve four pH values (12.5, 10, 7 and 5) with two different means of acidification; HCl(aq) which increases the chloride content of the sample and HNO3 that does not influence the chloride content at all. Additionally, half of the samples went through filtration to decrease their content in solids, but since not all solids were dispersed, that number could not reach zero. It is also worth mentioning that as the acidification proceeds the mass of total solids increases, since Cl- and NO3- respectively remain dissolved in the water sample, adding up to the total solids content. Nevertheless, the total solids content of the water samples that have not been through filtration is significantly higher from the ones that have been filtered (e.g. the total solids content of water sample 1.4 is ~12000 ppm when that of water sample 3.4 is more than three times less: ~3700 ppm).
Chemical analysis of water samples and coding
| Water sample code | Filtration | Mean of acidification | pH value | Total solids content (ppm) | Chloride content (ppm) | |
|---|---|---|---|---|---|---|
| Series 1 | 1.1 | No | - | 12.5 | ~9000 | <100 |
| 1.2 | No | HCl | 10 | ~10500 | ~1500 | |
| 1.3 | No | HCl | 7 | ~11000 | ~2000 | |
| 1.4 | No | HCl | 5 | ~12000 | ~3000 | |
| Series 2 | 2.1 | No | - | 12.5 | ~9000 | <100 |
| 2.2 | No | HNO3 | 10 | ~11000 | <100 | |
| 2.3 | No | HNO3 | 7 | ~12000 | <100 | |
| 2.4 | No | HNO3 | 5 | ~13000 | <100 | |
| Series 3 | 3.1 | Yes | - | 12.5 | <800 | <100 |
| 3.2 | Yes | HCl | 10 | ~2200 | ~1500 | |
| 3.3 | Yes | HCl | 7 | ~2700 | ~2000 | |
| 3.4 | Yes | HCl | 5 | ~3700 | ~3000 | |
| Series 4 | 4.1 | Yes | - | 12.5 | <800 | <100 |
| 4.2 | Yes | HNO3 | 10 | ~2000 | <100 | |
| 4.3 | Yes | HNO3 | 7 | ~3000 | <100 | |
| 4.4 | Yes | HNO3 | 5 | ~4000 | <100 | |
Test results of cement mortars with sludge water
| Water sample used | Spread (cm) | 2 days | 7 days | 28 days | |||
|---|---|---|---|---|---|---|---|
| Flexural strength (MPa) | Compressive strength (MPa) | Flexural strength (MPa) | Compressive strength (MPa) | Flexural strength (MPa) | Compressive strength (MPa) | ||
| Ref | 16.7 | 5.71 | 34.75 | 6.61 | 43.75 | 8.52 | 52.85 |
| 1.1 | 16.0 | 6.07 | 39.15 | 7.02 | 45.90 | 6.23 | 53.75 |
| 1.2 | 15.9 | 6.83 | 39.45 | 7.06 | 47.50 | 6.43 | 57.15 |
| 1.3 | 15.7 | 6.05 | 40.05 | 6.38 | 49.30 | 8.04 | 57.75 |
| 1.4 | 15.8 | 5.87 | 39.35 | 6.56 | 48.90 | 6.97 | 57.05 |
| 2.1 | 17.0 | 5.30 | 38.95 | 6.71 | 45.65 | 6.23 | 53.75 |
| 2.2 | 16.5 | 5.66 | 36.30 | 6.59 | 43.60 | 5.38 | 53.40 |
| 2.3 | 16.1 | 6.38 | 37.55 | 6.86 | 47.15 | 7.86 | 55.25 |
| 2.4 | 16.4 | 5.76 | 35.35 | 7.15 | 42.95 | 8.60 | 50.15 |
| 3.1 | 16.5 | 5.72 | 36.00 | 7.22 | 44.65 | 6.97 | 53.05 |
| 3.2 | 16.4 | 5.62 | 37.95 | 6.28 | 48.05 | 6.57 | 57.6 |
| 3.3 | 16.2 | 5.73 | 41.70 | 7.00 | 47.15 | 7.15 | 57.40 |
| 3.4 | 17.1 | 6.20 | 37.70 | 7.26 | 44.15 | 6.37 | 53.95 |
| 4.1 | 16.5 | 5.72 | 36.00 | 7.22 | 44.65 | 6.97 | 53.05 |
| 4.2 | 16.6 | 5.53 | 33.25 | 7.08 | 42.45 | 5.41 | 53.55 |
| 4.3 | 16.6 | 5.95 | 35.70 | 7.64 | 44.35 | 8.69 | 53.20 |
| 4.4 | 16.8 | 5.04 | 34.25 | 6.61 | 39.50 | 7.23 | 46.50 |
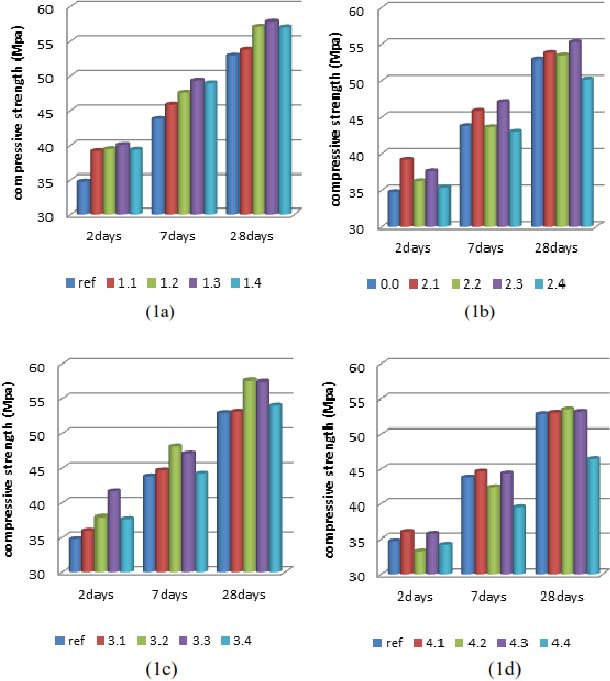
For better comprehension of the results presented in Table 2, the data is given schematically in Figures 1 and 2 with different approaches.
Compressive strengths of cement mortars for the ages of 2, 7 and 28 days grouped by series of water samples
Compressive strengths of cement mortars for different pH values grouped by ages of mortars
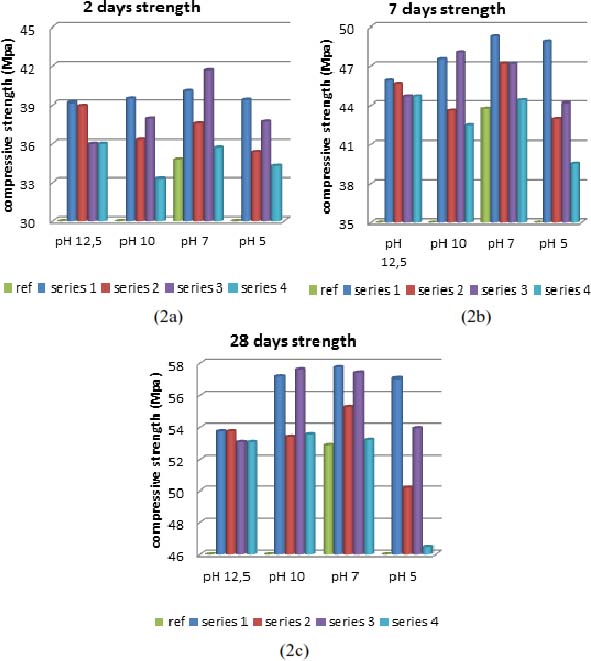
Figure 1 shows how the acidification process influences the behaviour of water samples mixed in the cement mortars as they are aging. It is obvious that in same series, while a specific pH value seems to overtake at the age of 2 days, another one dominates when the mortar specimen is of 28 days of age. Moreover, in any case, another pH value is desired, depending on the treatment (the mean of acidification and the presence or absence of solids).
An alternative perspective is given by Figure 2 which compares compressive strengths affected from the four pH values occurred from different ways of treatment without focusing on the aging progress. The necessity of these charts lies in the fact that they identify which treatment gives the optimum results, by demonstrating the most suitable acid and revealing whether a large quantity of solids is helpful for the properties of the mortar produced. It is also indicated that the reference mortar appears in every chart of Figure 2 only in the position of pH 7, since this is the pH value of fresh water.
Sludge is obtained from the bottom of the settling or recycling waste water tanks, depending on the concrete plant. While the water settles, all the solids start to precipitate forming a sludge which eventually takes over the tank. When this sludge gets removed it is often disposed in a field where, drying out, forms an agglomerated material. This material is very easily de-agglomerated due to the fact that it is formed by dispersed or dissolved particles included in the wash water, simply drying out.
The tests that took place concerning sludge were separated into two categories:
i) Sludge, without any treatment (containing approximately 70% water), was added to the mortars’ mixing water (fresh water) and in this way it substituted mostly part of the sand in the mortar mixture and a very smaller part of cement.
ii) De-agglomerated dry sludge was used in the mortar mix, replacing small quantities of cement; exactly in the way limestone cement fillers are used.
Coding and properties of “wet” sludge water samples
| Water sample code | pH value | Total solids content (g/L) | Quantity of wet sludge add to 1L of water (g) |
|---|---|---|---|
| ws0 | 7.5 | <1 | - |
| ws10 | 12.5 | ~10 | 33 |
| ws50 | 12.5 | ~50 | 165 |
| ws100 | 12.5 | ~100 | 333 |
| ws150 | 12.5 | ~150 | 495 |
The water samples produced were used to produce cement mortars in the same ratios described in paragraph cement mortars concerning sludge water (540 g cement, 1156.5 g limestone sand and 270 g water). The testing results are shown in Table 4.
Test results of cement mortars with wet sludge
| Water sample used | Spread (cm) | 2 days | 7 days | 28 days | |||
|---|---|---|---|---|---|---|---|
| Flexural strength (MPa) | Compressive strength (MPa) | Flexural strength (MPa) | Compressive strength (MPa) | Flexural strength (MPa) | Compressive strength (MPa) | ||
| ws0 | 16.7 | 5.71 | 34.75 | 6.61 | 43.75 | 8.52 | 52.85 |
| ws10 | 16.0 | 6.07 | 39.15 | 7.02 | 45.90 | 6.23 | 53.75 |
| ws50 | 15.1 | 6.30 | 39.05 | 7.44 | 48.45 | 8.05 | 56.35 |
| ws100 | 14.4 | 6.71 | 38.35 | 7.07 | 45.45 | 8.18 | 54.55 |
| ws150 | 13.9 | 5.82 | 38.40 | 7.96 | 47.00 | 8.06 | 53.70 |
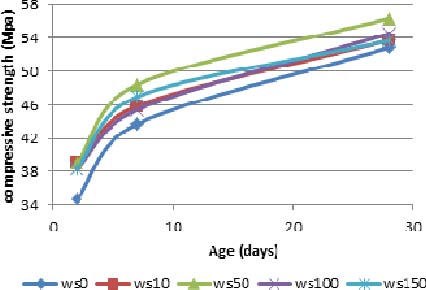
Figure 3 demonstrates the trend of the resulting compressive strengths, depending on the quantity of wet sludge contained in the water samples and their age. It is obvious that the presence of wet sludge in the mixing water has a positive effect on the compressive strength of the mortars. The optimum percentage appears to be that of water sample ws50 (sludge water containing 50 g/L of total solids), as it is very easily concluded from Figure 3. Nevertheless all water samples with wet sludge have a better behaviour than fresh water concerning their strength development but they are inferior in their workability as expected.
Compressive strength of mortars containing wet sludge
Mix design for cement mortars using dry sludge as cement filler
| Cement mortar code | Cement (g) | Sand (g) | Sludge (g) | Water (g) | w/cm | % replacement of cement |
|---|---|---|---|---|---|---|
| ds0 | 540 | 1156.5 | 0 | 270 | 0.5 | 0.00 |
| ds10 | 530 | 1156.5 | 10 | 270 | 0.5 | 1.89 |
| ds20 | 520 | 1156.5 | 20 | 270 | 0.5 | 3.85 |
| ds30 | 510 | 1156.5 | 30 | 270 | 0.5 | 5.88 |
| ds40 | 500 | 1156.5 | 40 | 270 | 0.5 | 8.00 |
As it appears in Table 5, the sole difference between the cement mortars described above is their ratio in cement and sludge. The abbreviation w/cm stands for water to cementitious material ratio which, as sludge should be considered a cementitious material due to its origin and characteristics, remains constant. Table 6 presents the test results of the mortars composed as described previously.
Test results of mortars containing dry sludge
| a/a | Spread (cm) | 2 days | 7 days | 28 days | |||
|---|---|---|---|---|---|---|---|
| Flexural strength (MPa) | Compressive strength (MPa) | Flexural strength (MPa) | Compressive strength (MPa) | Flexural strength (MPa) | Compressive strength (MPa) | ||
| ds0 | 17.1 | 6.01 | 32.13 | 6.82 | 43.05 | 7.86 | 47.83 |
| ds10 | 16.6 | 5.93 | 34.00 | 6.91 | 44.23 | 7.21 | 50.23 |
| ds20 | 15.4 | 5.86 | 31.15 | 6.92 | 39.75 | 6.99 | 46.83 |
| ds30 | 14.9 | 5.64 | 32.55 | 6.46 | 40.23 | 8.01 | 48.33 |
| ds40 | 14.5 | 5.08 | 31.03 | 6.27 | 39.20 | 7.18 | 45.05 |
Similarly to previous subsections, Figure 4 follows, which shows schematically the results of compressive strengths.
Compressive strength of mortars containing dry sludge
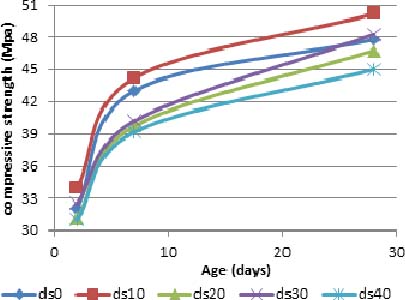
The superiority of mortar ds10 is apparent in the above graph, confirming that dry sludge has the exact behaviour with ordinary limestone cement fillers which in small cement replacement ratios can cause a slight improvement in the compressive strength of mortars. Other replacement ratios also give very good results but the deterioration they cause to the spread values cannot be ignored.
Initially, the most important result is that, besides water sample 4.2 in early ages and 4.4 in all ages, all water samples when used as mixing water for the production of mortars, exceeded in all ages the compressive strengths reached by the reference mortar, which was produced with the exact same proportions but with fresh water used as mortar mixing water. This is a very promising result which proves the original purpose of this study; that sludge water can be used as concrete mixing water without any dilution or treatment. This first observation is also supported by the values of spread which is measured as an indicator of workability. All cement mortars produced in this series of experiments showed spread values of 16.4 cm ± 0.7 cm (a deviation of 4% which could also be attributed to human error).
Another major result is that the mean of acidification, meaning the acid chosen to reduce the pH value of sludge water, plays a very important role to the mortar’s behaviour. It is clear from Figure 2 that water samples acidified with HCl demonstrated much better results. Specifically, in case of water samples 1.3, 3.2 and 3.3 a 9% rise of 28 days compressive strength was noticed in comparison with the reference mortar, where water sample 3.3 showed a surprising 20% rise for the 2 days compressive strength. This result was partially expected due to the increase of chloride ions that is achieved when hydrochloric acid is added in the water sample. Chloride ions are very well known for their ability to accelerate the strength development of cement [12], since CaCl2 was a common accelerator in the past.
Total solids content seems to affect significantly compressive strength as well and it will be discussed in the wet sludge subsection. However, additional conclusions could be drawn from this series of experiments as well. Since chloride content influences strength development greatly, it would be safer to focus on series 2 and 4 of the water samples due to the fact that nitric ions are relatively inert in a cement mix. It is obvious from Figure 2 that series 2 (which contain a larger amount of total solids) has a significant advantage towards series 4. The same outcome derives when comparing samples 1.1 and 2.1 with 3.1 and 4.1. All these samples have a pH value of 12.5 and their only difference is their content in solids. It is clear that the total solids content, meaning the amount of sludge existing in the water gives an advantage of even more than 3 MPa in compressive strength in the age of 2 days.
On the other hand, a high pH value does not seem to affect the performance of mortars. Based on Figure 1, it does not appear that any of the values 12.5, 10 or 7 would be absolutely desirable. In the case of series 1 and 3, pH values 10 and 7 have better results due to the addition of chloride ions, but in the other two series there is no optimum value for pH. Contrariwise, pH value 5 should be avoided, especially in the case of water sample 4.4, where there is no additional positive impact from total solids content or chloride ions.
Concluding this subsection, this study does not cover the financial aspects of this issue. Clearly, it would be cheaper not to treat the sludge water since it causes an improvement of the mortar’s properties as it is. However, several countries (including Greece) have strict regulations concerning concrete mixing water that require pH reduction. In this case HCl addition is a cheaper solution which also increases the compressive strength.
The conclusions derived from this study are noted below, divided into subcategories as previously mentioned.
The majority of the water samples produced, but most importantly the sludge water sample without any treatment (1.1 and 2.1), when used in mixing water, demonstrated an improvement over fresh water concerning the mortars’ strength development without hindering their workability.
If acidification is required due to local legislation, hydrochloric acid should be preferred, since chloride ions react as accelerators giving even better results.
A relatively high concentration in total solids is tolerated if not desired, as it enhances the strength without affecting the workability.
The alkali characteristics of the sludge water do not influence the mortars properties and the original pH value of sludge water directly from the truck drum which is approximately 12.5 does not require any reduction.
When untreated sludge is used, without any removal of its free water content, and added to mortar mixing water it can cause an improvement of compressive strength, but when it exceeds a certain concentration it leads to loss of workability.
Dry de-agglomerated sludge, when used as a cement replacer, can cause a slight improvement in the mortar’s compressive strength, when used in a 2% cement replacement ratio, due to the filler effect. In bigger replacement ratios it leads to a slight decrease of compressive strength but causes a significant drop in workability.
- ,
Waste management issues for the UK ready-mixed concrete industry ,Resources Conservation & Recycling , Vol. 32 , :321-3312001, https://doi.org/10.1016/S0921-3449(01)00069-6, pp - ,
Admixtures for recycling of waste concrete ,Cement and Concrete Composites , Vol. 20 , :221-2291998, https://doi.org/10.1016/S0958-9465(97)00066-8, pp - ,
Effect of sludge water from ready-mixed concrete plant on properties and durability of concrete ,Cement & Concrete Composites , Vol. 28 , :441-4502006, https://doi.org/10.1016/j.cemconcomp.2006.01.001, pp - ,
Use of ready-mixed concrete plant sludge water in concrete containing an additive or admixture ,Journal of Environmental Management , Vol. 90 , :1901-1908, https://doi.org/10.1016/j.jenvman.2009.01.008, ppPMid:19231063 - ,
“Physical and Chemical Properties of Waste Water from Ready-mixed Concrete Plants” ,5th Dubrovnik Conference on Sustainable Development of Energy, Water and Environment Systems , 2642009, pp - ,
“Reuse of waste water from ready-mixed concrete plants” ,Management of Environmental Quality: An International Journal , Vol. volume 22 (issue 1), :7-172011, Special Issue: 5th Dubrovnik Conference on Sustainable Development of Energy, Water and Environment Systems, pp - ,
Mixing water for concrete - Specification for sampling, testing and assessing the suitability of water, including water recovered from processes in the concrete industry, as mixing water for concrete , 2002, EN 1008 - ,
Standard Specification for Mixing Water Used in the Production of Hydraulic Cement Concrete ,American Society for Testing and Materials , 2006 - ,
Water for Mixing and Curing of Concrete , 1979 - ,
Methods of test for mortar for masonry - Part 3: Determination of consistence of fresh mortar (by flow table) , 1999 - ,
Methods of test for mortar for masonry - Part 11: Determination of flexural and compressive strength of hardened mortar, European Committee for Standardization (CEN) , 1999 - ,
Properties of Concrete , 1999