


There have been high specific emissions of CO2 from coal-fired power plants. Coal-fired power generation accounts for 54.1% of total installed capacity as on 31.03.2011 in India [1]. Most coal-fired power plants generate electricity in a lower thermal efficiency than commercialized coal-fired power plants in developed countries. Furthermore, Indian domestic coal tends to have high ash content (30 - 50%) and low fuel value (18,840.6 kJ/kg, as against the international average with 25,120.8 kJ/kg) [2]. Electricity demand is projected to increase substantially in response to a large increase in economic, population and electrification ratio [3]. High dependent on coal-fired plants is considered as a threat of climate change. Ghosh (2010) states that moving away from coal till 2030 is not viable solution given the time taken for new technologies to be researched and made commercially [4]. Although one of the effective ways to reduce CO2 emissions is an increase in the efficiency of thermal power stations in India, the country faces technological and financial constraints.
The Clean Development Mechanism (CDM) is an economic regime which has two aims, assisting Annex 1 countries in achieving their emission reduction targets and encouraging developing countries to achieve sustainable development. The scheme enables developing countries to overcome the constraints and shorten time for commercialization. Coal-fired power generation for CDM projects have a large potential with substantial coal resources in India. However, investment on CDM is small due to a low CO2 price.
Energy-related CDM projects also reduce air pollutants and resulting impacts on human health, which is known as co-benefits. In this way, the energy-related CDM projects contribute to sustainable development in developing countries. Aunan et al. (2004) discuss that measures related clean coal technology and energy efficiency are considered eligible under CDM in part because of the substantial local co-benefits [5]. An awareness of the expected co-benefits will motivate developing countries to participate in international agreements on climate change since effects of co-benefits is likely to be strong in the case of developing countries [6]. In this regard, Vennemo et al. (2006) assess the extent of the environmental co-benefits that would arise if and when China exploits its potential for CDM from various studies [7]. However, such sustainable benefits are not monetized in the carbon market. It is expected that monetizing sustainable development raises the economic value of CDM and motivates investors toward CDM.
While different modelling methodologies like accounting, optimization, macroeconomic, general equilibrium simulation and system dynamics simulation have been developed and extensively used for analysis of different kinds of energy–economy– environment policy and planning concerns in industrially advanced countries, they are inadequate for analysing a large number of policy concerns of developing countries [8]. Furthermore, most of the models which evaluate climate change actions do not include the full range of environmental effects [9]. Some studies examine co-benefits using a MARKAL model in the power sector [10]-[12]. Although these studies discuss the future possibility of the implementation of the CDM through the obtained results from CO2 prices, they do not examine the effects of CDM projects.
This study evaluates co-benefits of ten coal-fired power generation CDM projects which are currently under registration and validation with a power generation mix linear programming (LP) model in India’s power sector quantitatively. Optimized power generation mix is evaluated to clarify the impacts of the CDM projects using scenario analyses which enable us to examine additionality. The installed locations of CDM projects are specified. Therefore, unlike other studies of India such as [14]-[16], the power generation mix is examined in each grid. The changes of CO2, SOx and NOx emissions are calculated to investigate the effects of the co-benefits of the CDM projects.
The CDM has been an important catalyst of low-carbon investment in developing countries [16]. The CDM was specified by Article 12 of Kyoto Protocol in 2003 in which developed countries obtain credits through the projects in developing countries to meet their reduction targets. Developed countries reduce GHG emissions with low investment cost since reduction costs of GHG emissions in developing countries are normally smaller than those in developed countries. Developing countries accelerate environmental technology transfer and financial assist from developed countries. Thus, the CDM aims to achieve both cost-effective reduction of GHG emissions in developed countries and sustainable development in developing countries.
According to Marrakesh accords, CDM projects are additional to the baseline and defined as additionality. The baseline indicates GHG emissions without CDM projects and the difference between emissions of the baseline and those of CDM projects is regarded as a credit of emissions reduction. Energy projects generate small amounts of Certified Emissions Reductions (CERs) comparing with other types of projects because CO2 gas impacts less on global warming potential than the other GHGs while they contribute to sustainable development in developing countries. Investors refrain from entering the offset market due to the poor visibility [16]. Olsen (2007) reviews the research literatures on how the CDM contributes to sustainable development and argues that as sustainable development benefits are not monetized in the carbon market, the CDM does not significantly contribute to sustainable development in developing countries [17].
To counter the weaknesses mentioned above, we suggest that addressing co-benefits quantitatively leads energy projects more competitiveness and favourable to invest in terms of sustainable development of developing countries, which results in a larger decrease of energy-related CO2 emissions at a lower CO2 price. Energy-related CDM projects are associated with a decrease of air pollutants. Human health impacts are the largest benefits from the decrease of the air pollutants. Sutter (2007) introduces the air quality and change of air pollutants emission relative to baseline as sustainable development criteria and respective indicators of environmental development [18]. Olsen and Fenhann (2008) develop a taxonomy to measure sustainable benefits and assess the sustainability of 296 CDM projects and show that energy efficiency projects highly contribute to improved air quality [19]. Alexeew et al. (2010) apply the multi-criteria approach to 40 projects in India and assess the sustainability development benefits [20]. They state the limitation of the study that these analyses collect data from Project Design Document (PDD) and the project’s contribution to sustainable development tends to be favourable since the PDDs are designed and written by the project developers themselves. The decrease of the air pollutants from the baseline benefits developing countries and should be included into CDM as effects of co-benefits quantitatively.
The inclusion of the co-benefits into CDM will encourage investors to invest in the energy-related CDM projects. The benefits only considering climate change effects are underestimated under the current CDM regime. Alexeew et al. (2010) propose a CER discounting scheme to solve the dilemma between sustainable development and GHG reductions [20]. This is based on the idea that a net atmospheric benefit should be provided to CER prices. Including the monetary value of the air pollutants to CDM enhances the marginal abatement costs of energy-related CDM projects. This warrants investors to invest at a lower CER price which induces the higher abatement of CO2 emissions and air pollutants. As a result, the inclusion of the co-benefits contributes to decrease of energy-related CO2 emissions at a global level and sustainable development at a local level.
This paper analyses India’s power mix by using an LP model to assess co-benefits from energy-related CDM projects. The model optimizes long terms of a region or a country of electricity structure in multilevel. The power generation system of the base year is given to represent the base year. Efficiencies, costs, availability, capacity factors and constraints of the power generation technology are specified. The reference energy system is the structural backbone of the model. The objective function is to minimize a system cost with satisfying future final power demand given exogenously. The system costs consist of investment costs, fixed operation and maintenance (O&M) costs, and variable O&M costs. Moreover, the costs of the primary energy consumption are added for fossil fuel-fired power generation.
The objective function is expressed as an equation (1):
A variety of constraints are supplied to make the solution more realistic. The constraints include resource availability, installed period, and plant life of power generation technologies. Other constraints can be added in accordance with the intention of the study such as an environmental constraint.
The structure of the model is shown in Figure 1.
The structure of power generation mix LP model
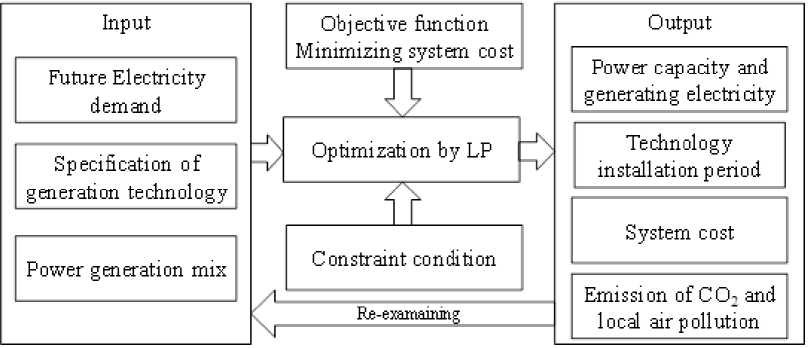
The model outputs optimized power capacities and generating electricity; technology installation period, and system costs. The model is suitable for a quantitative assessment of energy technology under various scenarios of technological and political assumptions. Scenarios are developed in accordance with the energy and environmental policies and the assumption of the technological innovation. The model is re-examined and the difference of the results among scenarios is regarded as impacts invoked by technological innovation or policy. This enables national and regional policy makers to understand the interplay of the power generation system, the system costs, and the policies by comparing the scenarios. In addition, the model calculates consequent global and local emissions.
The base year is 2006 and the terminal year is 2031. These twenty-five years are divided into five periods consisted of five years. The discount rate of 9% is considered referring from [21]. We cover only the centralized power sector due to limited data availability. Current capacity decreases with actual lifetime, and no constraint is set on investment money used to meet increased electricity demand in the future. The commercial and transmission and distribution (T&D) losses have a large impact on electricity generation in India. These amount to 20% for the base year and the progressive decrease is assumed to reflect an improvement of the transmission loss [14]. The commercial and T&D losses reach 14% in 2031.
Specifications of power generation technologies have important impacts on power mix in the future. Table 1 shows the specification of power generation technologies determined based on [13], [15], [21].
Specifications of power generation technologies
| Technology | Efficiency (%) | Investment cost (US$/kW) | Fixed O&M cost (US$/kW) | Variable O&M cost (US$/kWh) | |
|---|---|---|---|---|---|
| NEWNE | SOUTH | ||||
| CSUB | 30.9 | 34.4 | 1,073 | 12.876 | 0.017 |
| CSC | 37.7 | 37.7 | 1,155 | 13.860 | 0.018 |
| CUSC | 44.0 | 44.0 | 1,386 | 16.632 | 0.022 |
| Lignite | 26.6 | 26.7 | 1,085 | 13.020 | 0.017 |
| NGOC | 28.9 | 433 | 10.392 | 0.019 | |
| NGCC | 45.2 | 43.0 | 868 | 20.832 | 0.038 |
| ANGCC | 60.0 | 60.0 | 1,003 | 24.072 | 0.044 |
| Oil | 51.2 | 42.0 | 315 | 11.025 | 0.021 |
| Nuclear | 21.4 | 21.4 | 1,627 | 16.270 | 0.002 |
| Small hydro | 2,441 | 85.435 | 0.732 | ||
| Large hydro | 1,085 | 47.740 | 0.732 | ||
| Wind | 1,031 | 29.899 | 0 | ||
| Pumped storage | 759 | 33.396 | 0.732 | ||
The efficiencies of the existing plants are calculated from actual data for two grids, integrated Northern, Eastern, Western, and North-Eastern regional grids (NEWNE) and Southern grid. Advanced thermal plants and renewable energy are included as power generation technologies in addition to existing technologies. For coal-fired power generation, existing plants are based on sub-critical steam pressure systems (CSUB) whose thermal efficiency is 30.9% in the NEWNE grid and 34.4% in the Southern grid in 2006. Two types of advanced thermal plants are considered, coal supercritical (CSC) and coal ultra-supercritical (CUSC). CSC and CUSC generate electricity in higher pressure and temperature and can attain 37% and 44% efficiencies respectively. For gas-fired power generation, advanced natural gas combined cycle (ANGCC) is adapted in this analysis. ANGCC introduces a class of turbines that is more advanced than what is used in existing natural gas combined cycle (NGCC). Although IGCC and CCS are advanced thermal power plants, these technologies are not competitive without emission constraints. Thus, they are not taken into account in this study.
In addition, DeSOx and DeNOx technologies equipped to fossil fuel-fired power generation for the purpose of the mitigation of SOx and NOx emissions are specified. Flue gas desulfurization (FGD), low NOx burner (LNB), and selective catalytic reduction (SCR) are taken into account in this study and their specifications are shown in Table 2.
Specifications of DeSOx and DeNOx technologies
| Investment cost (US$/kW) | Variable O&M cost ($/kWh) | Efficiency loss (%) | Removal rate (%) | |
| FGD | 63.5 | 0.00338 | 5 | 80 |
| LNB | 7.61 | 0 | 0 | 30/40 |
| SCR | 63.5 | 0.00021 | 0.5 | 47/40 |
The left side of the removal rate of the LNB and the SCR corresponds to coal- and oil-fired power generations and the right side corresponds to gas-fired power generations. The assumption of the FGD is based on [22], [23] and the assumptions related to the LNB and the SCR are determined through taking the technological level of the FGD into account. These technologies are installed on both the existing plants and the newly installed plants.
Energy sources of power generations are greatly dependent on fuel prices. The domestic fuel prices in the base year of 2006 are derived from [13] for gas and [24] for coal and lignite. The escalations of the fuel prices are derived from assumptions about the international prices of fossil fuels [25]. The energy prices in the time horizon are shown in Table 3.
Fuel prices in the time horizon
| Unit | 2006 | 2011 | 2016 | 2021 | 2026 | 2031 | |
|---|---|---|---|---|---|---|---|
| Coal | T | 20.2 | 23.4 | 20.4 | 22.9 | 23.5 | 24.0 |
| Lignite | T | 17.6 | 20.4 | 17.9 | 20.0 | 20.5 | 21.0 |
| Gas | 1000 m3 | 0.17 | 0.20 | 0.20 | 0.23 | 0.25 | 0.26 |
| Oil | T | 4.86 | 6.01 | 5.79 | 6.58 | 7.07 | 7.57 |
Increase rates of fossil fuels are settled between 2011 and 2016 reflecting a large increase through 2009 with the gas prices and the oil prices. The prices rise steadily after 2016 in response to expected higher demand and lower resource availability. Thus, the oil and the gas prices rise relatively larger than the coal prices.
Nuclear power generation and renewable energy play important roles in decreasing CO2 emissions and air pollutants. However, these technologies have social and resource constraints. Upper bound of the capacity installations are given to reflect the constraints. Table 4 shows the upper bound imposed on the model for nuclear power generation and renewable energy.
Upper bound of nuclear power generation and renewable energy (10 MW)
| 2006 | 2011 | 2016 | 2021 | 2026 | 2031 | ||
|---|---|---|---|---|---|---|---|
| Nuclear | NEWNE | 310 | 346 | 841 | 1,336 | 1,586 | 1,836 |
| SOUTH | 115 | 132 | 398 | 664 | 914 | 1,164 | |
| Small hydro | NEWNE | 60 | 1,536 | 3,017 | 4,499 | 5,981 | 5,981 |
| SOUTH | 30 | 219 | 413 | 607 | 801 | 801 | |
| Large hydro | NEWNE | 2,500 | 4,884 | 7,139 | 9,824 | 12,645 | 12,645 |
| SOUTH | 950 | 1,277 | 1,261 | 1,676 | 2,225 | 2,225 | |
| Wind | NEWNE | 269 | 2,136 | 2,136 | 2,136 | 2,136 | 2,136 |
| SOUTH | 446 | 2,720 | 2,720 | 2,720 | 2,720 | 2,720 |
The upper bound of nuclear power generation is applied based on national electricity plan [21]. The resource constraint of renewable energy corresponds with the technological potential for wind and hydroelectric power. The potential of hydroelectric power and wind power is derived from [26] and [27] respectively.
Electricity demand is the principal driver of electricity generation and thus CO2 emissions and air pollutants from the power sector. Electrical demand has been growing in India and is expected to rise significantly in the future. In 1990, the total electricity demand was 212 TWh and had increased to 567 TWh in 2007. The demand growth is a result of strong economic growth and greater accessibility to electricity grids during the period. This increase is expected to persist in medium and long terms. The future electricity demand is determined based on the projection of [3]. The projection is based on an econometric model which considers social and economic changes to examine future Asian energy demand. The model also contains a shift of end-use technologies. The annual electricity growth rates are 5.8% from 2007 to 2020, 5.7% from 2020 to 2030, and 5.5% from 2030 to 2035. The growth rates are assumed to be identical among each grid.
Local air pollution attributable to SOx and NOx emissions and climate change attributable to CO2 are considered in this study. Marginal environmental damage costs of the emissions are required to make the emissions comparable.
There are few studies related to marginal environmental damage costs of the emissions in India due to limited available data, while a number of estimations are found in developed countries (for example [28]). They are set 549 USD per SOx ton and 450 USD per NOx ton derived from [29] which estimates marginal damage costs of Mumbai applying a rapid damage assessment model. The major damage from the air pollutants is human health effects. The monetary value of CO2 emissions is assumed as 12.7 USD per ton from the actual CER price [16] in correspondence with the objective of this study. It is assumed that the offset market reflects the marginal damage costs of CO2 emissions.
A scenario analysis enables us to assess impacts under different policies. We develop two scenarios, a BAU scenario and a CDM scenario. The BAU scenario assumes no changes in policies. The scenario is intended as a baseline to assess the additionality of CDM projects. Although energy-related CDM projects intend to reduce CO2 emissions, some of the projects contribute to decrease air pollutants. The CDM scenario takes into account of the ten CDM projects of the coal-fired plants in India that are under registration and validation. These ten projects are aggregated in this study to examine the difference of CO2 emissions and air pollutants caused by these. To examine the additionality of the projects, the installed capacity and the power generation of nuclear power generation and renewable energy are fixed from the BAU scenario. The 10 CDM projects are referred from [30] and [31]. The name, the start year of operation, and the installed capacity depicted in PDD are listed in Table 5.
Coal-fired power generation CDM projects which are in registration and validation
| Project | Start year | Installed capacity (MW) |
|---|---|---|
| Energy efficient power generation in Tirora, India | 2011 | 1,320 |
| Greenhouse Gas Emission Reductions Through Super Critical Technology - Sasan Power Ltd. | 2011 | 3,960 |
| Mitigation of GHG emissions through power generation at high efficiency | 2011 | 1,980 |
| Greenhouse Gas Emission Reductions through Super-critical Technology - Coastal Andhra Power Ltd. | 2011 | 3,960 |
| Grid connected energy efficient power generation in Jhajjar, Haryana | 2012 | 1,320 |
| Grid Connected Power Generation through Supercritical technology | 2012 | 1,320 |
| Grid connected super-critical technology based power generation in Tirora, India | 2013 | 1,980 |
| Energy efficient power generation by GCEPL | 2013 | 1,370 |
| Greenhouse Gas Emission Reductions Through Super Critical Technology - Jharkhand Integrated Power Ltd. | 2014 | 3,960 |
| Energy Efficient Power Generation by Talwandi Sabo Power Limited | 2014 | 1,980 |
| Energy Efficient Power Generation by Nabha Power Limited | 2014 | 1,400 |
There are ten PDDs related to coal-fired power generation CDM projects under registration and validation in India’s power sector by May 2011. The operation starts after the validation and the start year of the operation ranges from 2011 to 2014. All projects shown in Table 5 cover CSC and there exist no projects of CUSC, IGCC, and CCS in India. The projected CSC plants have higher thermal efficiency than the expected thermal efficiency in India shown in Table 1. Once higher thermal efficiency of advanced thermal plants is in place, India learns the generation technology and starts to commercialize. Thus, the thermal efficiency level of the plants will disseminate to all plants of India in response to the technology transfer induced by the CDM projects. It is assumed that the thermal efficiency of the CSC increases to 40% after the first introduction of CSC in 2011 in the CDM scenario. In addition, CSC installed through CDM projects must be up to date, which indicates that they equip DeSOx and DeNOx technologies. However, there is no incentive to reduce SOx and NOx emissions from power generation in India currently. Thus, this study assumes that DeSOx and DeNOx technologies do not spill over to other coal-fired power plants.
The electricity generation of India up to 2031 is estimated by an LP model. Changes in the electricity generations of India’s power sector induced by the coal-fired power generation CDM projects which are under registration and validation are identified. The consequent environmental effects of SOx, NOx, and CO2 emissions are assessed in order to identify the effects of the co-benefits invoked by the CDM projects.
Total power generation increases from 663 TWh to 2517 TWh. Coal-fired generation has been dominant through the objective term and accounts for 90% of total power generation after 2011. CSC starts to expand since 2011 as a base load power plant owing to a higher efficiency than CSUB and reaches 41.5% of total power generation in 2031. CSUB steadily increases as a peak load power plant with a low investment cost. CSUB increases substantially to satisfy increased peak load in 2031 and reaches 49.9% of total generation in 2031. CUSC is not installed until 2031 since coal price is relatively cheap in India. Although hydro requires no fuel, the low availability and the high O&M cost prevent hydro to expand and be only used in the base year. Nuclear power and wind power increase electricity generation but reach only 5.5% and 1.9% of total power generation in 2031 respectively. Figure 2 shows power generations for two scenarios.
Power generations for two scenarios
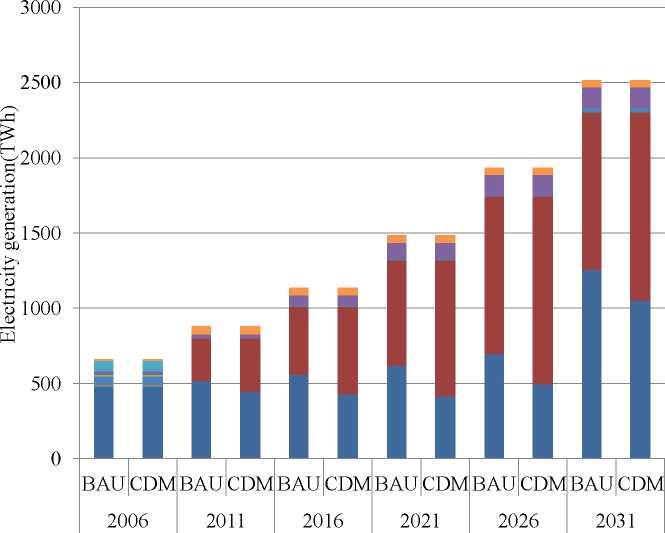
When CSC is introduced through the CDM projects which are currently under registration and validation, the share of the generation type varies from the BAU scenario through the objective years. Since the power generation of nuclear power generation and renewable energy are fixed to examine the additionality of the CDM projects, their share of total generation remains unchanged from the BAU scenario. CSUB falls in substitution for CSC in 2011 and 2016. CSC expands after the CDM with improved thermal efficiency invoked by the CDM projects and substitutes for CSUB after terminating CSC as CDM projects. CSC reaches 49.8% of total power generation while CSUB falls to 41.6%.
CO2 emissions increase monotonically in the BAU scenario and reach 2,384 Mt CO2 four times as the base year in 2,031. CO2 emissions reach 2,305 Mt CO2 in the CDM scenario and decrease 79 Mt CO2 as compared to the BAU scenario at the end of the time horizon. CDM contributes to reduce CO2 emissions in the longer term than in the term when CDM is implemented. CO2 emissions in the CDM scenario are 36 Mt CO2 lower than in the BAU scenario in 2016 when most of the CDM projects are implemented due to installation of CSC in substitution of CSUB. Higher reduction can be achieved after the implementation associated with increase of higher thermal efficiency of CSC. CO2 emissions fall to 1,227 Mt CO2 through the objective period. Figure 3 shows CO2 emissions for two scenarios.
CO2 emissions for two scenarios
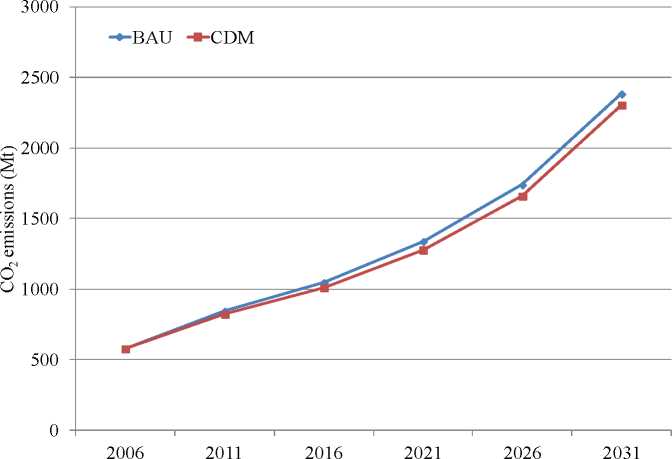
CO2 emissions increase monotonically in the BAU scenario and reach 2,384 Mt CO2 four times as the base year in 2,031. CO2 emissions reach 2,305 Mt CO2 in the CDM scenario and decrease 79 Mt CO2 as compared to the BAU scenario at the end of the time horizon. CDM contributes to reduce CO2 emissions in the longer term than in the term when CDM is implemented. CO2 emissions in the CDM scenario are 36 Mt CO2 lower than in the BAU scenario in 2016 when most of the CDM projects are implemented due to installation of CSC in substitution of CSUB. Higher reduction can be achieved after the implementation associated with increase of higher thermal efficiency of CSC. CO2 emissions fall to 1,227 Mt CO2 through the objective period.
Figure 4 shows SOx and NOx emissions for two scenarios.
SOx and NOx emissions for two scenarios
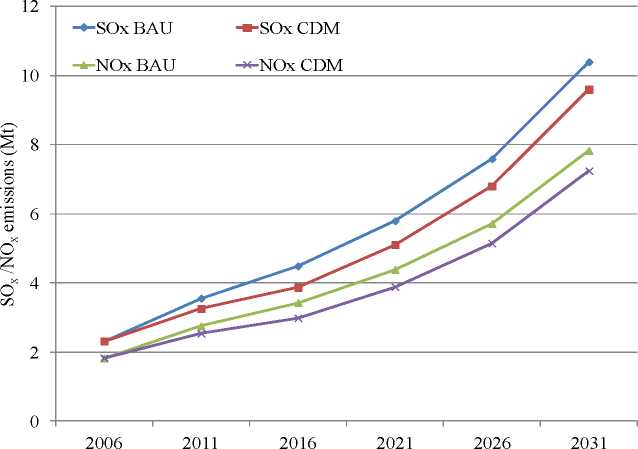
SOx and NOx emissions rise during the whole time horizon in both scenarios. The increase of the generation from CSUB and CSC raises SOx and NOx emissions. In the BAU scenario, SOx emissions increase from 2.3 Mt SOx to 10.4 Mt SOx and NOx emissions from 1.8 Mt NOx to 7.8 Mt NOx. In the CDM scenario, the SOx and NOx emissions decline 14.4 Mt SOx and 10.4 Mt NOx from the BAU scenario through the objective period. This indicates that the ten coal-fired generations CDM projects which are currently under registration and validation in India’s power sector achieve co-benefits. The SOx and NOx emissions decrease in 2011 with a higher efficiency of installed CSC through the CDM projects. In addition, this decrease is associated with the introduction of CSC from the CDM projects which are assumed to equip DeSOx and DeNOx technologies. If energy-related CDM projects include co-benefits, investors of fossil fuel-fired power generation will increase investment with DeSOx and DeNOx technologies which contribute to sustainable development in host countries.
SOx and NOx emissions rise during the whole time horizon in both scenarios. The increase of the generation from CSUB and CSC raises SOx and NOx emissions. In the BAU scenario, SOx emissions increase from 2.3 Mt SOx to 10.4 Mt SOx and NOx emissions from 1.8 Mt NOx to 7.8 Mt NOx. In the CDM scenario, the SOx and NOx emissions decline 14.4 Mt SOx and 10.4 Mt NOx from the BAU scenario through the objective period. This indicates that the ten coal-fired generations CDM projects which are currently under registration and validation in India’s power sector achieve co-benefits. The SOx and NOx emissions decrease in 2011 with a higher efficiency of installed CSC through the CDM projects. In addition, this decrease is associated with the introduction of CSC from the CDM projects which are assumed to equip DeSOx and DeNOx technologies. If energy-related CDM projects include co-benefits, investors of fossil fuel-fired power generation will increase investment with DeSOx and DeNOx technologies which contribute to sustainable development in host countries.
Table 6 shows emission reduction benefits of the CDM projects in 2031.
Emission reduction benefits in the CDM scenario in 2031 (M$US/year)
| CO2 reduction | SOx reduction | NOx reduction | Total |
|---|---|---|---|
| 1,008 | 437 | 266 | 1,711 |
The benefits are split into each emission to identify the contribution of each emission. The emissions reductions from the BAU scenario are shown as Figure 3 and Figure 4. The resulting benefits from all the emissions indicate that the CDM projects listed in Table 5 have more beneficial to developing countries than currently considered. The benefits from the reduction of the air pollutants should be addressed in addition to CERs. Thus, the benefit from the aggregated projects should be raised 1.7 times higher than CERs in 2031. The benefits from CO2 reduction account for 59% of total benefits. If the benefits from reduction of air pollutants are included into CDM, contribution to sustainable development will be visible and investors will increase their investment on energy-related CDM projects at a lower CER price. This benefits developing countries to achieve sustainable development and also investors from developed countries to meet their reduction target cost-effectively.
It is estimated that CO2 emissions in India increase with a strong growth of electricity demand in the future. CDM is one of the solutions to decrease CO2 emissions in developing countries. However, energy-related CDM does not progress recently owing to low CER prices although they have important environmental benefits at both local level and global level. We examined the co-benefits of CDM projects of coal-fired generations which are currently under registration and validation with a power generation mix LP model in India’s power sector quantitatively. We found two remarkable results in this study.
First, this is proved by the estimation that co-benefits are invoked by the ten coal-fired generations CDM projects which are currently in registration and validation in India’s power sector. In the CDM scenario, SOx and NOx emissions decrease by 0.8 Mt SOx and 0.6 Mt NOx at the end of time horizon from the BAU scenario in addition to CO2 emissions. Addressing co-benefits invoked by energy-related CDM projects raises motivations of host countries toward the CDM projects. Consequently, large CO2 emissions decreases will be attained through higher amount of CDM projects.
Second, reduction benefits increase with an inclusion of reduction benefits of the air pollutants invoked by the CDM projects. This warrants 1.7 times higher benefit than CERs which attracts investors to offset markets. While the reduction benefits from the air pollutants accounts for 41% of total reduction benefits in the case of the aggregated CDM projects taken in this study, this is due to the fact that the DeSOx and the DeNOx technologies are not transferred from the CDM. When India considers decreasing SOx and NOx technologies, the CDM projects are considered contributing to higher reduction of the air pollutants since India will learn DeSOx and DeNOx technologies from the CDM projects. Thus, this is identified that taking co-benefits into account benefits both of developed countries and developing countries.
However, environmental damage costs from GHG emissions and air pollutants are estimated with different value method and might affect the findings. CO2 emission reduction benefits vary widely due to a complexity of climate change impacts. CO2 price is determined in the emission market and there is a large uncertainty in the future. Marginal damage costs of SOx and NOx emissions are estimated by value of life year lost which basically assigns a willingness-to-pay (WTP) to the risk of reducing life expectancy. Even though they still inherit uncertainty, marginal damage costs are determined and will not change largely in the future. Thus, the weight of reduction benefits of each emission changes accordingly. When CO2 prices are low, the weight of reduction benefits of marginal damage costs of air pollutants becomes larger. Thus, it is identified that the inclusion of the co-benefits accelerates the utilization of CDM projects by both investors and host countries particularly when CO2 prices are low.
C - the system cost
crft - the capital recovery factor in t per installed capacity
fgt - the fuel costs for the technology g in t per power generation
g - the technology
invg - the investment cost for the technology g per installed capacity
r - the discount rate
t - the number of years
vg - the variable O&M cost for technology g per power generation.
Xgt - the newly installed capacity for the technology g in t
Yt - the power generation in t for the technology g
εgt - the efficiency for the technology g in t
This research was supported by the Environment Research and Technology Development Fund (E-1001) of the Ministry of the Environment, Japan.
- ,
Ministry of Power, Government of India website , , http://www.powermin.nic.in [Accessed: 15-Apr-2013] - ,
A Low–Carbon, Technology–Driven Strategy for India’s Energy Security ,Current Science , Vol. Vol. 94pp (No.4), :440-4412008 - ,
Asia/world Energy Outlook 2009 – The Role of Technology towards the Resolution of Energy & Environmental Issues in Asia – Japan , 2009 - ,
Status of Thermal Power Generation in India - Perspectives on Capacity, Generation and Carbon Dioxide Emissions ,Energy Policy , Vol. Vol.38 , :6886-68992010, https://doi.org/10.1016/j.enpol.2010.07.004, pp - ,
Co-benefits of Climate Policy—Lessons Learned from a Study in Shanxi, China ,Energy Policy , Vol. Vol.32 , :567-5812004, https://doi.org/10.1016/S0301-4215(03)00156-3, pp - ,
Climate Policy and Ancillary Benefits: A Survey and Integration into the Modelling of International Negotiations on Climate Change ,Ecological Economics , Vol. Vol. 68 , :210-2202008, https://doi.org/10.1016/j.ecolecon.2008.02.020, pp - ,
Domestic Environmental Benefits of China’s Energy-related CDM potential ,Climatic Change , Vol. Vol.75 (No.1), :215-2392006, https://doi.org/10.1007/s10584-006-1834-0, pp - ,
Energy policy modelling: agenda for developing countries ,Energy Policy , Vol. Vol.30 , :97-1062002, https://doi.org/10.1016/S0301-4215(01)00062-3, pp - ,
Implications of Incorporating Air-quality Co-benefits into Climate Change Policymaking ,Environ Res Lett , Vol. Vol.5 , :0140072010, https://doi.org/10.1088/1748-9326/5/1/014007 - ,
Co-benefits of CO2 emission reduction in a developing country ,Energy Policy , Vol. Vol.38 , :2586-25972010, https://doi.org/10.1016/j.enpol.2010.01.003, pp - ,
The future choice of technologies and co-benefits of CO2 emission reduction in Bangladesh power sector ,Energy , Vol. Vol.35 , :4902-49092010, https://doi.org/10.1016/j.energy.2010.08.037, pp - ,
Co-benefits of a carbon tax in Nepal ,Mitigation and Adaptation Strategies for Global Change , Vol. Vol.17 , :77-1012012, https://doi.org/10.1007/s11027-011-9310-1, pp - ,
National Energy Map for India Technology Vision 2030 ,PSA/2006/3 , 2006, https://doi.org/10.1007/s11027-011-9310-1 - ,
Assessment of Demand for Natural Gas from the Electricity Sector in India ,Energy Policy , Vol. Vol.37 , :3520-35342009, https://doi.org/10.1016/j.enpol.2009.03.067, pp - ,
Allocation of Energy Resources for Power Generation in India: Business as Usual and Energy Efficiency ,Energy Policy , Vol. Vol.38 (No.2), :1059-10662010, https://doi.org/10.1016/j.enpol.2009.10.058, pp - ,
, State and Trends of the Carbon Market 2010 , 2010 - ,
The Clean Development Mechanism’s Contribution to Sustainable Development: A Review of the Literature ,Climatic Change , Vol. Vol.84 (No.1), :59-732007, https://doi.org/10.1007/s10584-007-9267-y, pp - ,
Does the Current Clean Development Mechanism (CDM) Deliver Its Sustainable Development Claim? An Analysis of Officially Registered CDM Projects ,Climatic Change , Vol. Vol.84 , :75-902007, https://doi.org/10.1007/s10584-007-9269-9, pp - ,
Sustainable Development Benefits of Clean Development Mechanism Projects: A New Methodology for Sustainability Assessment Based on Text Analysis of the Project Design Documents Submitted for Validation ,Energy Policy , Vol. Vol.36 , :2819-28302008, https://doi.org/10.1016/j.enpol.2008.02.039, pp - ,
An Analysis of the Relationship between the Additionality of CDM Projects and their Contribution to Sustainable Development ,International Environmental Agreements: Politics, Law and Economics , Vol. Vol.10 , :233-2482010, https://doi.org/10.1007/s10784-010-9121-y, pp - ,
National Electricity Plan (Volume-I) , 2004 - ,
, Environmental Issues in the Power Sector: Long-term Impacts and Policy Options for Karnataka , 2004 - ,
, Environmental Issues in the Power Sector: Long-term Impacts and Policy Options for Rajasthan , 2004 - ,
, Coal Supply and Demand Trends in India –Role of Coal and its Future– Japan , 2006 - ,
, World Energy Outlook 2009 , 2009 - ,
, Hydropower Development in India: A Sector Assessment , 2007 - ,
Ministry of New and Renewable Energy , , http://www.mnre.gov.in/ [Accessed: 15-Apr-2013] - ,
Eco2data , , http://eco2data.com/ [Accessed: 15-Apr-2013] - ,
High-efficiency Coal Fired Thermal Power Plants and CDM ,Energy and Resources , Vol. Vol.31 (No.6), :325-3292010, ppin Japanese - ,
External Costs of Energy - Do the Answers Match the Questions? Looking Back at 10 Years of ExternE ,Energy Policy , Vol. Vol.30 , :839-8482002, https://doi.org/10.1016/S0301-4215(01)00140-9, pp - ,
, Environmental Costs of Fossil Fuels: A Rapid Assessment Method with Application to Six Cities , 2000