


The cogeneration (or Combined Heat and Power - CHP) is based on the simultaneous generation of electricity and heat in a single process. In case it also produces cooling energy, by using absorption chillers, it is called trigeneration (Combined Cooling, Heat and Power - CCHP). The investment for CHP plant has an economic return of a few years, when most of the heat is produced with an operative-cycle of more than 4000-5000 annual work-hours [1]. However, in many building applications CHP is often unprofitable due to lack of demand for heat during the summer season. In such cases CCHP can be decisive for the economic success of the project. Trigeneration is the most efficient system for combined and simultaneous production of electricity, heat and cooling from a single energy source, despite significant complexity of the plant. In general it is composed of a “traditional” cogeneration device combined with an absorber (a refrigeration unit fed by thermal energy), for the production of useful cooling energy [2]. That energy can be used for air conditioning in building sector or for industrial processes. Compared to CHP systems, trigeneration can fully exploit the potential of combined production of electricity and thermal energy in summer time, when there is no need for heating. Trigeneration offers significant energy savings, (around 40%) in comparison with the traditional (separate) production of electricity, heat and cooling [3]. These savings have a positive impact, including the peak demand control on the electric grid (for instance the growing diffusion of air conditioning systems during the summer). The advantage of trigeneration can be affected by the difficulty to foresee the real need of simultaneous demand of electricity and thermal energy (heat and cooling). This uncertainty introduces some variables in the design phase that significantly influence the cost-benefit analysis, in particular construction costs (referring to the CCHP system size), management and maintenance fee, primary energy prices, gains of electricity sold back to the grid, incentives and tax reduction [4].
Therefore, the purpose of this research is to implement an evaluation model of projects that, starting from an energy audit of the user consumption profile, will develop all possible scenarios for technical and financial solution in order to highlight the best configuration for the stakeholders (investors and users) who benefit from the CCHP project.
The calculation model developed in the research provides an energy and economic analysis of the operation of trigeneration systems natural gas feed (or renewable sources) through the creation and development of sub-models for the definition of the consumption curves for the users, from data collected by means of an energy audit platform.
The first step of the model is the application of the typical process of "energy certification" of the user, with the aim to acquire in a standardized way the characteristics of the building energy need (both thermal and electric). In fact, the energy audit process of buildings used for the "energy certification" is a systematic set of survey, collection and analysis of parameters for the consumption and the facilities operating conditions evaluation.
In the second step, the model estimates the energy consumption profile for heating and cooling, also giving a basic sizing of HVAC systems through the evaluation of the heat load of the building in critical conditions. Similarly, the survey data of electric installations are used to define the power load curves in order to estimate energy consumption for lighting, and power for other electric appliances. It seems clear, therefore, that the load curves (both thermal and electric) are based on an energy survey that must follow “official procedure” (like the energy certification one) and it has to be carefully planned in order to give a complete energy profile of the user.
The final result of model process is the creation of thermal and electric hourly-load curve of users and depending on the current season.
At present, there are three modelling simulations depending upon the seasons (summer, winter, and spring/autumn), while the operating hours can be freely varied (the default value is 12 hours from 8 a.m. to 8 p.m.) [5].
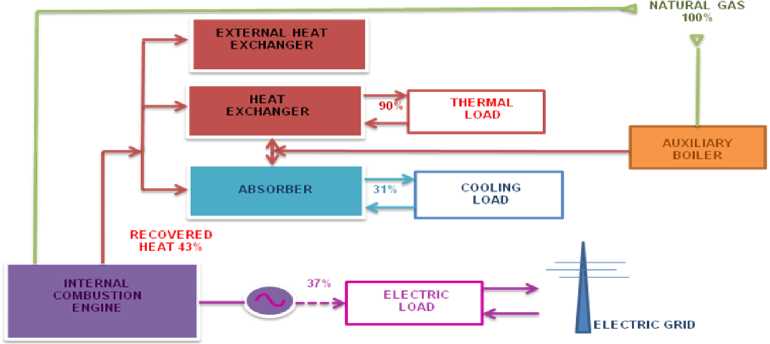
The simulation model refers to a trigeneration plant based on conventional CCHP scheme (Figure 1), consisting of an internal combustion engine fuelled with natural gas or vegetable oil, a power generator, a heat recovery generator (capable of producing hot water from the waste heat of the engine), an absorber powered by the engine exhaust gas (for the cooling load demand) and an auxiliary boiler fuelled by natural gas integration to cover peak-demand of heat or cooling (feeding the absorption chiller). The system is also provided with an external heat exchanger, in order to ensure a stable operation when the user requires low values of thermal energy [6].
Trigeneration system scheme and percentage of energy involved
The simulation is independent of the type of absorption system, (ammonia or lithium bromide, single or double stage) and of the working conditions (temperature of the fluid). The basic parameters of the system such as power, COP, and therefore power consumption is sufficient for the creation of consumption profiles during periods of its operation.
Regarding the dimensioning of the parameters of the whole system, some of them are freely adjustable such as the sizing of the cogenerator thermal power, the heat recovery rate and the absorber COP related to the product chosen. Consequently, other parameters like the cogeneration electric power obtained as a ratio of the thermal power, the gas consumption, etc. are directly fixed to prevent sizing inconsistencies.
The objective is to ensure adequate freedom in designing the system and then simulating multiple scenarios, while maintaining high correspondence with existing systems on the market [7].
The initial audit process allows users to build an energy model that, in fact, consists of hourly power consumption curves for each energy use (heating, cooling, lighting and other services).
Then the model gives a preliminary choice of a set of the most appropriate trigeneration systems, showing the main parameters: thermal power and cooling capacity, performance, etc.
The choice of the CCHP system working curve can be "pre-set" (fixed curve) or "tracking" (following the user consumption). This variable is particularly important and in the case of the second option, it gives an operation optimized according to the real user consumption [8].
The first step of evaluation allows the construction of a second set of curves of heating supply, power production and cooling capacity from the trigenerator.
By superimposition of these curves with the absorption curves mentioned above, it is possible to evaluate the system operation scenarios, to quantify the self -consumption of energy, the surplus of power production (sold back to the grid), and the need of integrating auxiliary boilers or auxiliary heat exchangers for cooling.
The assessment of energy saving in the model is essentially carried out through the evaluation of the benchmark between the current situation of consumption, both electrical and thermal, and the CCHP system operation (in the best operation hypothesis).
The research aims at the technical and economic evaluation of cogeneration solutions financed through a TPF mechanism. Therefore, once the CCHP peak power of the plant has been fixed, the calculation model optimizes the economic gain obtainable from the sale of electricity. So, the optimum sizing is generally obtained referring to the heat load, leaving aside the evaluation of the auto-consumption of the electric energy. The surplus can however be sold to the network and highly incentivized through some financial mechanisms, analysed later in the paper [9].
Depending on the choice, the system proposes an evaluation of the power production. Excluding the case where all the energy produced is used entirely to cover the self-consumption, the first analysis assesses the percentage of non-coverage needs that will buy directly from the grid with prices varying according to model input data. In the next step the opposite situation is evaluated when the power surplus is directly sold back to the grid through a contract of “Ritiro Dedicato” (Dedicated Withdrawal - DW).
The value of electricity sold to the electric grid is presented with different features depending on the regime chosen by the plant managers. Here are the options available, depending on the plant size and plant configuration.
White Certificates: the incentive scheme known as "White Certificates System" (Energy Efficiency Certificates - TEE in Italy) has been operated since 2005. It is a market-based mechanism of the bonds to be paid by distributors of electricity and natural gas, issued pursuant to the achievement of energy efficiency target with energy end users. In addition to mandatory parties, other energy market actors (e.g. Energy Services Companies – ESCos) can access the TEE system and manage them as a business in case of energy saving measures on an adequate scale.
Green Certificates - GC: the power producers from Renewable Energy Sources (RES), owners of qualified RES plants, may access the Green Certificates system as a form of incentive of the power production from RES. In Italy, as required by law 244/07, the power production from RES or retrofitting of power plants operating from April 1st, 1999 to December 31st, 2007, is considered renewable generation for the first twelve years of operation.
All-Inclusive Tariff - AIT: in Italy, the Ministerial Decree of 18 December 2008 has introduced a new incentive mechanism for power production from RES as an alternative to the Green Certificates system for the small plants with a power not exceeding 1 MW (0.2 MW for wind energy) in operation after December 31st, 2007. This system consists of a simplified tariff regime for the power sold to the grid with a unique fixed price. The all-inclusive tariff depends on the energy source, and is fixed for a period of 15 years. This fee excludes any other remuneration for electricity sold to the network (including DW) [10].
The research was focused mainly on economic evaluation of energy saving projects concerning the feasibility of installation of trigeneration plants.
The economic analysis, in addition to the estimation of direct profitability of projects, is also extended to the issues concerning the project financing and proposed a TPF actor such as an ESCo. The ESCos in fact are the typical companies that operate as a tool in the energy efficiency market, assuming the business risks and ensuring the achievement of savings to the customer.
The contract tool in the ESCo is in general an Energy Performance Contract (EPC), which guarantees to the customer the foreseen energy savings results.
In this research, the characteristics of the most used EPC have been analysed, both in terms of remuneration of the ESCo and energy and economic benefits by the client-side.
The EPC is a contract which obliges "the supplier" (usually an ESCo) to fulfil by its own funds or funds of others a series of integrated services and interventions aimed at upgrading and improving energy efficiency of a system owned by another (the beneficiary). The contract also fixes an amount of energy savings (previously identified in the feasibility analysis phase) obtained as a result of the energy consumption optimizing measure identified in the contract for the system. In relation to risk-sharing, to cover the financing and the remuneration of the ESCo, the energy performance activities may lead to the following types of EPC:
First out”
The ESCo provides the capital project (also using other third-party funding). The energy savings achieved are entirely used to repay the loan of the intervention and to reward the activities of the ESCo. The contract usually lasts for about 3-5 years. At maturity the savings should be entirely in favour of the customer who takes ownership of the facilities and the completed works.
Shared Savings”
The “Shared Savings” is similar to the “First Out” scheme, but the parties shall agree on the allocation of savings income in the first year. The contracts have a duration of 5-10 years in view of the fact that only a portion of the savings contributes to the recovery of the initial investment. During the execution of the contract, the ownership of the plants and works is retained by the ESCo and the contractual deadline moves to the customer.
Guaranteed Savings”
In this kind of contract, the financing is provided by a third party different from the ESCo and the customer provides financial guarantees. The ESCo takes on an organizational role to ensure a high level of performance under which the compensation is received by the customer. The contract lasts about 4-8 years. According to this formula, therefore, the ESCo is committed primarily to ensure that savings are not inferior to an agreed minimum, established on the basis of the feasibility study.
First in”
In “First in” contract, a certain reduction of energy costs incurred in previous year’s historic intervention is guaranteed to the user. The cost savings achieved as a result of the intervention made by ESCo - responsible for the plant, which will retain ownership and management until the conclusion of the contract - is in the responsibility of the ESCo for the entire contract period, in way to determine the number of years necessary for ESCo to cover the investment and to achieve more profit for the company, according to forecasts of energy saving project.
Chauffage”
In the “Chauffage” contract, the customer entrusts the management of their facilities to the ESCo, which provides the energy expenditure for the duration of the contract, upon the payment of a fee equal to the energy bill that the customer paid before the entry into force of the contract, less an agreed discount. In essence, with the Chauffage (asset ownership) a sort of outsourcing is put in place, namely operation where the customer entrusts the conduct of an activity (carried out independently in the past) to a third party.
Table 1 summarizes the contractual arrangements described, showing the duration of the contract, appliances, management and funds obtained and the percentage of savings for the client during the contract period.
EPC contractual options and share of financial risks
| Contract Duration | Plant management | Financial guarantees | Client saving | |
|---|---|---|---|---|
| First out | 8 years | ESCo | ESCo | 0% |
| Shared savings | 10 years | ESCo | ESCo | 5% |
| Guaranteed savings | 8 years | ESCo | Customer | 15% |
| First in | 9 years | ESCo | ESCo | 3% |
| Chauffage | 15 years | ESCo | ESCo | 12% |
The model validation was performed on a user of the large retail sector (shopping centre) located in the central part of Italy. The case study has a general interest because of the plants and building structures analysed represent the typical elements of the large retail sector and the results can be easily applied to other users of the sector.
The shopping centre has two levels with a total area of 24,430 m2 with 1 hypermarket, 58 shops of various sizes and 6 restaurants. The building has a very simple concrete structure, the windows are double glazed and the ceiling of the common areas is covered by pyramid-shaped windows that provide natural day-light.
The HVAC system consists of electric heat pumps placed at the top of the building. Table 2 gives an example of the data collected during the audit phase with regard to heat pumps data.
Heat pumps installed, data and performances
| N. | Thermal Power [kWt] | Cooling Power [kWt] | COP | EER | Total Electric Power (winter) [kWe] | Total Electric Power (summer) [kWe] |
|---|---|---|---|---|---|---|
| 6 | 218.14 | 191.86 | 3.17 | 3.14 | 412.88 | 366.61 |
| 3 | 84.72 | 74.42 | 3.48 | 3 | 73.03 | 74.42 |
| 1 | 332.91 | 289.77 | 2.5 | 2.5 | 133.16 | 115.90 |
| 1 | 414.88 | 358.6 | 2.5 | 2.5 | 165.95 | 143.44 |
| 1 | 74.19 | 65.12 | 2.5 | 2.5 | 29.67 | 26.04 |
| 1 | 110.23 | 95.93 | 2.5 | 2.5 | 44.09 | 38.37 |
| 1 | 77.1 | 66.3 | 2.67 | 2.3 | 28.87 | 28.83 |
| 1 | 160.5 | 130.6 | 2.86 | 2.75 | 56.12 | 47.49 |
Once the audit of the thermal systems and building structures is performed, the model algorithm estimates the behaviour of thermal energy loads on the basis of preset cycles.
As a first validation of the model, some measurements were performed on the heat pumps at the primary circuits with the aim to extrapolate the time-curve of thermal power load. Figure 2 shows a comparison between the simulated curves and the measurement performed on the machines in winter.
Simulation and measurement of heat power (winter operation daily hours)
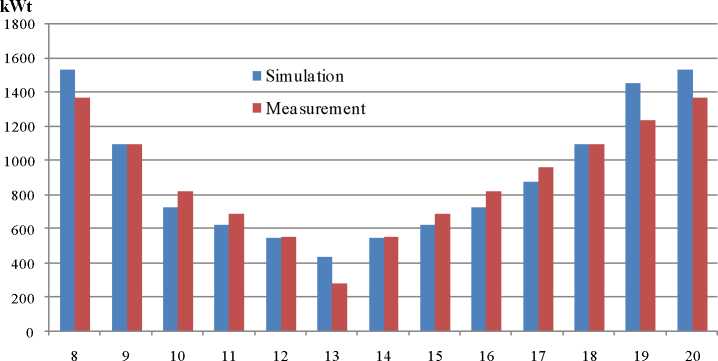
The results show an error rate in terms of thermal power output in the range 6÷9.5%. The error over an annual basis is in the order of 6.25%. So, the simulation model has a reliability of more than 93% and, therefore, it’s possible to set the “tracking” program (above described) for the model operation [11].
In addition to the basic parameters of a trigeneration plant (as discussed above), the model can also elaborate the input data as a consumption curve and verify the filling ratio between the consumption curves of the users and the supply curve of the trigenerator.
All the scenarios created require an assessment, because in the function that evaluates DW or AIT, the constraints vary in accordance with national regulations. Therefore the model indicates to the operator the possibility to change some values for each scenario.
As a result, it is possible that some optimized solutions present different production curves related to the choice of the regime of supply. For example, in the "DW with guaranteed minimum prices”, the system automatically limits the electric power system forcing up to 1 MWe, and the operator may choose an engine size lower than other cases. It also follows a lower heat output, with its reduced load charts.
For the regime of “DW” and “DW with guaranteed minimum prices”, a CCHP system with internal combustion engine powered by natural gas is chosen; for the other cases: “green certificates”, “all-inclusive tariff with traceable vegetable oils” and “all-inclusive tariff”, the engine is fed by vegetable oil.
Regarding the choice of vegetable oil, from a technological point of view, the soy is preferable because it is the only one that doesn’t introduce critical aspects in the system, it has a low content of phospholipids and low iodine value and thus cures less than others.
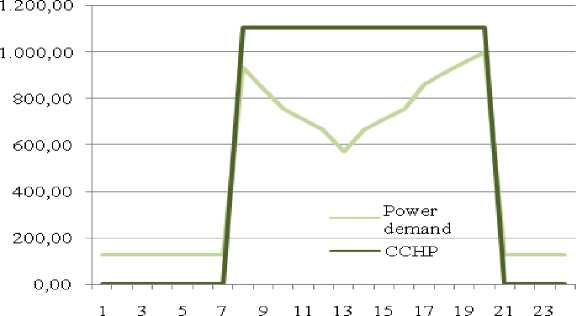
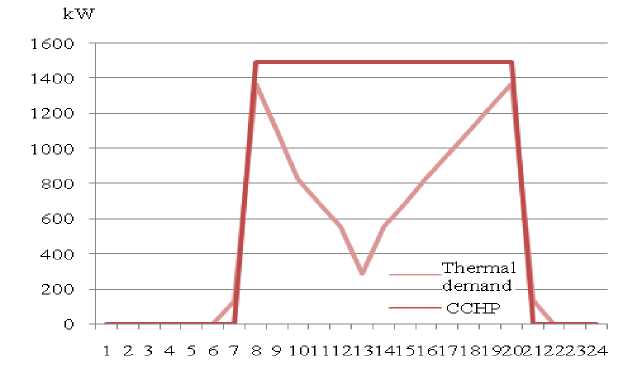
The model output consists of the CCHP power supply curve overlapping the consumption curve of the user for a fixed period (day, week, month, etc.). The Figures 3 and 4 show the daily curves in the winter time for a system operating in DW. The model can evaluate each scenario that combines different systems for electricity exchange with the grid, with all the eligible incentives and contractual options [12].
Electric curves overlapping (typical winter day)
Thermal curves overlapping (typical winter day)
The comparison of these scenarios considering the respective economic values, incentives, royalties from EPC contracts, financial rates, depreciation, etc., the model extrapolates the optimum scenario of the project from the ESCo-side and for the client-side for entire duration of the contract.
The model operates on a maximum time of 15 years, which is the duration of the typical plant warranty and the period in which the green certificates are guaranteed. This period of time is subdivided, depending on the chosen contract, into a part of ESCo-management and the remaining when the management is given directly to the customer.
Among the output data, there are the values of profit after tax and the corresponding tax (zero in case of negative profit) for all 15 years of expected life of the plant. Financial ratios are also calculated: NPV (Net Present Value), IRR (Internal Rate of Return), IP (Index of Profitability: an index that attempts to identify the relationship between the costs and benefits of a proposed project), and ADSCR (Average Debt Service Coverage Ratio: the ratio between operating cash flow and debt service during any one-year period).
Regarding the client-side, some data are shown: the purchase price for natural gas, the price trends of energy sold to the grid, the average price of electricity supply and the prices for “vegetable oil”; in the “tax exemption for methane purchase” area it is possible to calculate precisely the unit price of natural gas (€/Nm3); moreover, in the mask “MT Network Connection” the cost for the network connection (in Medium Voltage) is estimated; finally, in the “financial evaluation” mask, the pattern of Euribor rates of the last 10 years are recorded.
“During Contract Period” (DCP), assuming a normal percentage discount for the customer, it is obvious that the economic savings for a given type of contract remains constant regardless of the rate of energy transfer (Table 3).
Simulation results
| DW | DW mpg | GC | AIT | AIT tr | |
|---|---|---|---|---|---|
| First Out | 8 | 8 | 8 | 8 | 8 |
| Investment | € 1.307.235 | € 1.157.337 | € 1.718.700 | € 1.507.231 | € 1.507.231 |
| Discount for client | 0,00% | 0,00% | 0,00% | 0,00% | 0,00% |
| ESCo earning | € 967.002 | € 900.409 | € 301.254 | € 926.861 | € 3.482.141 |
| Client earning DCP | € 0,00 | € 0,00 | € 0,00 | € 0,00 | € 0,00 |
| Client earning ACP | € 1.852.679 | € 1.718.987 | € 1.237.564 | € 1.077.397 | € 4.353.397 |
| Shared Savings | 10 | 10 | 10 | 10 | 10 |
| Investment | € 1.307.235 | € 1.157.337 | € 1.718.700 | € 1.507.231 | € 1.507.231 |
| Discount for client | 5,00% | 5,00% | 5,00% | 5,00% | 5,00% |
| ESCo earning | € 1.208.572 | € 1.100.405 | € 278.452 | € 1.074.301 | € 4.268.401 |
| Client earning DCP | € 375.950 | € 375.950 | € 375.950 | € 375.950 | € 375.950 |
| Client earning ACP | € 1.331.663 | € 1.239.036 | € 797.014 | € 674.451 | € 3.014.451 |
| Guaranteed Savings | 8 | 8 | 8 | 8 | 8 |
| Investment | € 0,00 | € 0,00 | € 0,00 | € 0,00 | € 0,00 |
| Discount for client | 15,00% | 15,00% | 15,00% | 15,00% | 25,00% |
| ESCo earning | € 1.358.561 | € 1.178.601 | € 1.017.963 | € 1.469.674 | € 3.626.894 |
| Client earning DCP | € 874.856 | € 874.856 | € 874.856 | € 874.856 | € 1.458.093 |
| Client earning ACP | € 1.852.679 | € 1.718.987 | € 1.237.564 | € 1.077.397 | € 4.353.397 |
| First In | 9 | 9 | 9 | 9 | 9 |
| Investment | € 1.307.235 | € 1.157.337 | € 1.718.700 | € 1.507.231 | € 1.507.231 |
| Discount for client | 3,00% | 3,00% | 3,00% | 3,00% | 3,00% |
| ESCo earning | € 1.079.128 | € 991.563 | € 280.814 | € 998.571 | € 3.873.261 |
| Client earning DCP | € 199.897 | € 199.897 | € 199.897 | € 199.897 | € 199.897 |
| Client earning ACP | € 1.592.936 | € 1.480.048 | € 1.009.080 | € 866.948 | € 3.674.948 |
| Chauffage | 15 | 15 | 15 | 15 | 15 |
| Investment | € 1.307.235 | € 1.157.337 | € 1.718.700 | € 1.507.231 | € 1.507.231 |
| Discount for client | 12,57% | 12,57% | 15,19% | 12,57% | 12,57% |
| ESCo earning | € 1.684.181 | € 1.478.929 | -€ 333.858 | € 1.067.496 | € 5.858.646 |
| Client earning DCP | € 1.532.959 | € 1.532.959 | € 1.853.576 | € 1.532.959 | € 1.532.959 |
| Client earning ACP | € 0,00 | € 0,00 | € 0,00 | € 0,00 | € 0,00 |
| DCP = during the contract period - ACP = after contract period – DW = Dedicated Withdrawal - DW mpg = Dedicated Withdrawal with minimum prices guaranteed - GC = Green Certificates – AIT = all-inclusive tariff - AIT tr = all-inclusive tariff with traceable oils | |||||
Conversely, the choice of the tariff affects the savings in very different ways in the years “After Contract Period” (ACP), in the cases when the customer is able to manage the resources on his own.
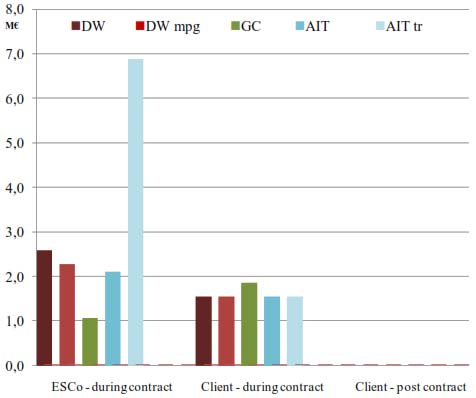
For most contracts, the ESCo guarantees a percentage of annual savings compared with historical energy costs (incurred up to the intervention). The “First Out” (Figure 5), as mentioned, is a contract whereby the ESCo receives all the savings of the customer during an agreed period (usually half the system useful life) and then the property and the management of the systems is left to the customer. In general, it shows how tariffs connected to the use of natural gas (dedicated withdrawal -with and -without minimum guaranteed prices) are among the most profitable.
“First out” contract
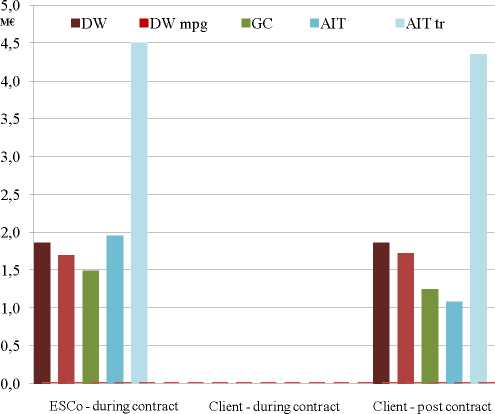
This phenomenon is justified by the high price of natural gas, despite the tax relief, that can reach levels that don’t allow a gain in extra production.
In practice, once the saving of consumption has been reached, because of incentives being rather low the profit appears not proportional to the costs of production. For this reason, the changing of the opening hours of the shopping centre to the option "7 a.m. – 9 p.m." interval, leads to a smaller profit than producing "8 a.m. – 8 p.m. hours" in all cases when the systems are gas-fed.
Similar results concern the Green Certificates, despite the scenario that considers the advantages in comparison with the “traditional” systems thanks to the price of raw materials (oil); the incentives do not cover the gap of the production costs per kWh and its sale to the grid.
To have a real benefit from the choice of Green Certificates, which are applied to users taken into consideration, it’s necessary to purchase the renewable source (vegetable oil) through “the short chain” (within 70 km from the point of use). In this case, the coefficient for the calculation of the certificates, as reported by the 2008 Budget (Table 2, Art. 2, paragraph 144), is 1.80 instead of the 1.30 with an annual income greater than 250,000.00 EUR. Only in this case, the choice of the Green Certificates would be effective as a real alternative solution, even if it is important to underline that in general it is difficult to vegetable oil by “the short chain”.
In this ambit, it is fundamental to underline the Decree 28/2011 ("Renewable Decree") that established a new system of incentives for renewable energy installations, operating since 1 January 2013; however the Decree protects the existing investments issuing the extension of Green Certificates System until 2016 (with a withdrawal price of 78% of the maximum reference).
The all-inclusive tariff with non-traceable oils does not appear to be an incentivizing mechanism better than the Green Certificates. This disadvantage is due to the low amount of incentive for the energy sold to the grid (18 c€/kWh). However, an “ethical” aspect can explain it better: this tariff is applied to systems fed by oils that cannot be tracked, or oils with unknown origin or oils with an extra-European origin and, therefore, not in accordance with political-commercial agreements for development of renewable sources (the supply of oil that is not-traceable involves negative environmental and energy effects due to the transport of this fuel, compared with the actual saving of resources due to its exploitation from facilities).
An optimal scenario, however, is the one regarding the all-inclusive tariff with traceable oils where it is possible to observe the maximum values of gain (or savings): the value higher than of 10 c€/kWh for the energy sold to the grid, compared to the tariff on non-traceable oils, makes the incentive the most competitive.
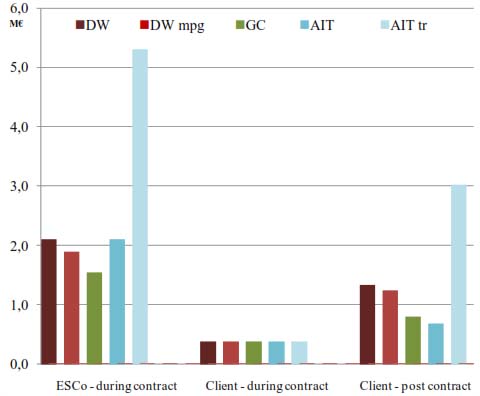
The “Shared Savings” and “First In” contracts (Figures 6 and 7), in economic terms, are almost identical (the “Shared Savings” shows a minimum extra-gain). In these cases, the above-described guidelines are valid for the benefit of using the configuration time standard "8 a.m. - 8 p.m." for all tariffs except for the all-inclusive tariff with traceable oils.
“Shared Saving” contract
“First in” contract
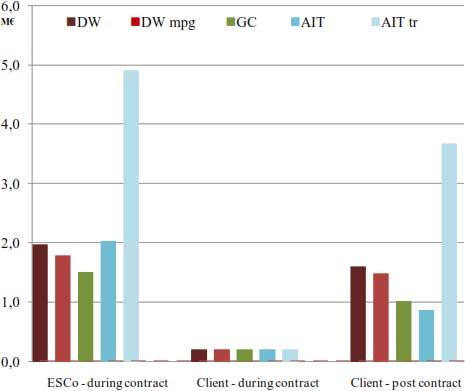
Other configurations (including the "7 a.m. - 9 p.m.") could bring to the ESCo greater gains closer to 250,000.00 EUR and a loss of approximately 100,000.00 EUR for the customer over the life of 15 years. However, it should be noted that this configuration provides an economic benefit for the customer during the contract years, when the ESCo provides global service.
The “Guaranteed Savings” contract (Figure 8), the only contract in which the ESCo does not assume the financial risk, shows the highest savings for the customer. It is also the only case in which the Green Certificates appear interesting in terms of profitability.
“Guaranteed Saving” contract
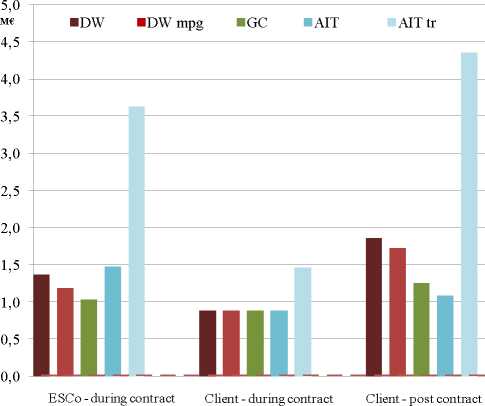
Only in the case of all-inclusive tariff with traceable oils, the client savings rise up to 25%. In all other cases the ESCo offer a maximum of 15% with the aim to obtain the same earnings when compared to the other contracts. Although it is one of the most profitable contracts, is not widely used because typically the client is not interested in risk analysis and management.
In the “Chauffage” contract (Figure 9) the ESCo manages the systems and the O&M procedures completely through outsourcing services. The results are interesting except for the incentive obtained from the Green Certificates for both the ESCo and the customer. Similar to the cases already examined, the configuration "8 a.m. - 8 p.m." is to be preferred for all cases except for the all-inclusive tariff with traceable oil.
“Chauffage” contract
The ESCo reaches the maximum absolute value in comparison with other contracts till the end of the fifteenth year, with a gain of more than 6M€, independently of any configuration of working hours.
In general, the ESCo could choose to increase the client annual savings by reducing its own income (still higher than other contracts), by offering a contract fee evaluated as the average between the values of the Chauffage and the Shared Savings (with the aim to encourage the customer to sign the contract). However, it has to be analysed also from a time-economic point of view: in previous kinds of contract, the ESCo profit was more than 4,000,000.00 EUR in 9 - 10 years; on the contrary, in the case of “mixed-contract” it cannot benefit from that gain, despite the ESCo commitment in a contract longer than the previous five years.
The study describes first a platform for energy audit and simulation of the consumption curves (heating, cooling and electrical) of a standard user in the Large Scale Retail sector. The research was focused on the evaluation of trigeneration systems analysed both as energy efficiency measures and in terms of economic and financial feasibility for TPF projects.
The results show interesting scenarios in which contractual options generally adopted by the ESCo, the contract period, the discount on the annual bill offered to the customer, the incentive mechanisms, etc. can lead to significant differences for the gains on the ESCo-side and client-side, also considering the obvious reduction in the consumption of energy sources used.
The model shows that the most lucrative contracts for both sides are the Shared Savings, Guaranteed Savings and the Chauffage.
Regarding the tariffs, the Green Certificates system does not appear as the most profitable. In the case of use of natural gas, the simple withdrawal is to be preferred to the withdrawal with guaranteed minimum prices. Finally, for the systems fed by renewable oil, the “all-inclusive tariff traceable” appears much better than the “not-traceable” one. For this resource, however, despite some recent laws, the oil-origin certification and the subsequent recognition of its traceability seems to be a problem that is very difficult to resolve, especially in the short term.
The analysis, developed in addition to the study of financial ratios, shows for these types of contract (“Shared Savings”, “Guaranteed Savings” and “Chauffage”) the highest values of the indices NPV, IRR and IP with the maximum value in the case of all-inclusive tariff with traceable oils.
Regarding the ESCo-customer agreements, the ESCo rarely offer contracts lasting more than 10 years, with the exception of “Chauffage” that stretches easily to 15. For this kind of contract, however, the ESCo prefer low-risk customers, directing their choice, then, to the local administrations.
However, it’s important to consider that such long-term forecasts involve complex strategies to minimize the effect of the numerous variables. In fact, every three years the withdrawal fees are updated, the price of Green Certificates and the White Certificates show strong historical fluctuations when measured on a three-year period, the validity period of sale of Green Certificates is limited and the price volatility of natural gas and oil, as well as price management, always appears as phenomena that are very difficult to predict.
ACP - After Contract Period
ADSCR - Average Debt Service Coverage Ratio
AIT tr - All-Inclusive Tariff traceable
AIT - All-Inclusive Tariff
CCHP - Combined Cooling Heat and Power
CHP - Combined Heat and Power
DCP - During Contract Period
DW - Dedicate Withdrawal
DW mpg - DW with minimum prices guaranteed
EPC - Energy Performance Contract
ESCo - Energy Services Company
GC - Green certificates
HVAC - Heating Ventilation and Air Conditioning
IP - Index of Profitability
IRR - Internal Rate of Return
MT - Medium Voltage
NPV - Net Present Value
RES - Renewable Energy Sources also known as White Certificates
TPF - Third-Party Financing
- ,
, La micro-cogenerazione a gas naturale , 2005, in Italian, Ed - ,
A methodology for sizing a trigeneration plant in mediterranean areas ,Applied Thermal Engineering , Vol. 23 (13), :1665-16802003, https://doi.org/10.1016/S1359-4311(03)00130-3, pp - ,
Analysis and optimization of CCHP systems based on energy, economical, and environmental considerations ,Energy and Buildings , Vol. 41 (10), :1099-11062009, https://doi.org/10.1016/j.enbuild.2009.05.014, pp - ,
Cogeneration Planning under Uncertainty. Part I: Multiple Time Frame Formulation ,Applied Energy , Vol. 88 , :1059-10672011, https://doi.org/10.1016/j.apenergy.2010.10.014, pp - ,
, Impianti di cogenerazione , 2007, in Italian - ,
Optimal design of CHCP plants in the civil sector by thermoeconomics ,Applied Energy , Vol. 84 (7), :729-7482007, https://doi.org/10.1016/j.apenergy.2007.01.005, pp - ,
An original multi-objective criterion for the design of small-scale polygeneration systems based on realistic operating conditions ,Applied thermal engineering , Vol. 28 (17), :2391-24042008, https://doi.org/10.1016/j.applthermaleng.2008.01.017, pp - ,
Performance analysis of CCHP and CHP systems operating following the thermal and electric load ,International Journal of Energy Research , Vol. 33 (9), :852-8642009, https://doi.org/10.1002/er.1526, pp - ,
Ricerca sistema elettrico ,ENEA Report RSE/2009/18 , 2009, in Italian - ,
Cogeneration: a regulatory framework toward growth ,Energy Policy , Vol. 33 (16), :2100-21112005, https://doi.org/10.1016/j.enpol.2004.04.007, pp - ,
Evaluation of CCHP systems performance based on operational cost, primary energy consumption, and carbon dioxide emission by utilizing an optimal operation scheme ,Applied Energy , Vol. 86 (12), :2540-25492009, https://doi.org/10.1016/j.apenergy.2009.04.012, pp - ,
From cogeneration to trigeneration: profitable alternatives in a competitive market ,IEEE Transactions on Energy Conversion , Vol. 28 (1), :265-2722006, https://doi.org/10.1109/TEC.2005.858089, pp