


Fossil energy carriers are currently the primary source of energy in the world, constituting ca. 80% of total energy supply [1]. The transportation sector is almost entirely dependent on fossil fuels and is responsible for ca. 20% of total CO2 emissions globally [2]. Due to decreasing reserves of fossil fuels and possible implications of climate change, an alternative source of energy is required for the transportation sector. One option to reduce the dependence on fossil fuels could be a shift to battery electric vehicles (BEVs) which do not only drive more efficiently than internal combustion engine (ICE) vehicles, but also the electricity required can come from various sources, including renewable ones such as solar, wind and hydro power.
However there are also certain limitations associated with BEVs such as their high initial cost, range anxiety and long charging durations [3]. The current cost of a lithium-ion battery for usage in a BEV is 500-650 US$/kWh [4]. By assuming an average consumption of 0.2 kWh/km a BEV with a range of 120 km requires 24 kWh battery which costs 12,000 US$. In terms of range, a typical BEV can travel ca. 160 km on fully charged battery whereas an ICE can travel ca. 500 km on a full tank [5]. One can charge a BEV with a battery size of 24 kWh in ca. 7 hours based upon a power output of 3.3 kW. In contrast to this an ICE vehicle can be refuelled in a few minutes thus making it is far more flexible.
There are possible alternative charging methods available to allow rapid charging, such as battery swapping, fast charging and inductive charging. Battery swapping can help to recharge the battery in just a few minutes by swapping the depleted battery with a fully charged battery. But it requires an extensive network of battery swapping stations and also standardization is required for batteries, vehicles and swapping technology [6]. With fast charging, meaning charging a vehicle with higher power, a battery of 24 kWh can be charged in less than 30 min with a power output of 60 kW. The cost of such fast charging station is expensive, according to [7] the total cost can lie between 65,000-70,000 US$ per charging station therefore it is not suitable for BEV users at home, but could be an option at public charging points. Inductive charging can be installed stationary as a substitute for plugs or along the roads [8], where a BEV can charge while driving. It is implemented by embedding inductive charging equipment below the road surface, where a vehicle driving over it can charge. Such inductive charging infrastructure along roads could act complementary to stationary charging at home and public places.
Since the cost of such infrastructure is relatively expensive, a methodology is required to understand the optimal location for electrified links and to investigate the impacts of this technology on BEV charging behaviours and battery size.
In this paper an electric vehicle (EV) simulation framework is used, which itself is based on an agent based transport simulation. Moreover, the extension of the framework by an inductive charging module is described, together with initial simulation results and analysis of BEV charging behaviour. The rest of the paper is organized as follows: The next section presents related work and basic knowledge in this field. In section methodology the inductive module, influencing parameters and assumptions are explained. Section simulations describe the simulation scenarios and results, which are discussed in the discussion and future work section along with some outlook about future work. The paper ends with a conclusion section.
Various researchers around the world are working on inductive charging technology. Only recent work with focus on inductive charging of electric vehicles is presented in this section. Due to the novelty of this technology only little literature is present at the moment.
The Korean Advance Institute of Science and Technology has developed and utilized shaped magnetic field in resonance to charge BEVs dynamically [9]. Furthermore, they implemented this technology for electric buses which are in operation at their university campus.
Kobayashi, et al. [10] developed and experimented with inductive charging technology with a micro electric bus. The bus has a route of 5.24 km and it requires 9 minutes of charging duration to complete its route. Thus, the microbus can continuously run on such a cycle, without stationary charging.
Mohrehkesh and Nadeem [11], who analyse different strategies for charging BEVs inductively during stoppage time at intersections. Jang, et al. [12] used a genetic algorithm to optimize inductive charging locations and battery size for battery electric buses on a circular route.
According to the best of the authors' knowledge, we are the first to simulate inductive charging using an agent based approach to evaluate the potential of this technology. In the following sections, we provide information on the traffic simulation and the electric vehicle simulation framework, on which our work is based upon. Thereafter a short description of inductive charging is given to provide background information regarding this technology.
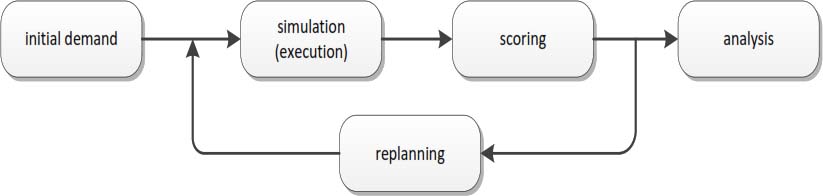
MATSim [13] is an agent-based travel demand simulation used to simulate large scale traffic scenarios (see Figure 1). In MATSim each agent has a set of plans for daily activities such as work, leisure, shopping and education. Each plan is executed and scored according to a utility function. Performing an activity increases utility whereas travelling gives negative utility. The goal of each agent in MATSim is to maximize its utility. When the plans of agents are executed in the micro-simulation, traffic is generated on a virtual network and thus may lead to congestion. In order to avoid congestion and improve utility, agents can change their plans after each iteration within a replanning step. Changes to the plan can be such as changing the route, travel mode, travel time, activity duration and location. Each agent maintains a set of plans, from which either an old plan is reselected for execution or a new plan is generated. As the set of plans is of limited size, the plan with the worst score is removed when creating a new plan. This corresponds to mutation, selection and survival of the fittest using a co-evolutionary algorithm [14]. Through this process the demand is optimized iteratively.
Building blocks of MATSim
where Utotal is the combined total utility for a given plan; n is number of activities; Uperf,i is the positive utility gained by performing an activity i, Ulate,i is the negative utility gained for late arrival at an activity i, Utravel,i is the negative utility gained for travelling during the trip i.
The positive utility gained while performing an activity is given as:
where tperf,i is the actual performed time period of an activity i, t*,i is the usual time period of an activity i, βperf is the marginal utility of an activity during its usual duration and it is same for all activities, as in equilibrium all activities at their usual time period need to have similar marginal utility. The scaling parameter t0,i is related to both the minimum time period and the importance of an activity.
The negative utility gained for late arrival at an activity is given as:
where βlate is the marginal utility for arriving late which is generally negative and tlate,i is the number of hours late at an activity i.
The negative utility for travelling is calculated as:
where βtr is the marginal utility for traveling which is also negative and ttr,i is the number of traveling hours consumed during trip i.
In our work, we used an EV simulation framework, which builds on top of MATSim [15]. This framework allows modelling a wide variety of scenarios for electric vehicle simulation, ranging from smart grid over vehicle to grid to model the effect of charging on power grids [19]-[21].
One of the reasons for choosing this framework is that it is open source and allows reusing modules implemented by other researchers. Also, its modular design facilities extension and customization. We skip a more detailed description of the framework here, as we will discuss it in the methodology chapter, how the inductive charging module was integrated into this framework.
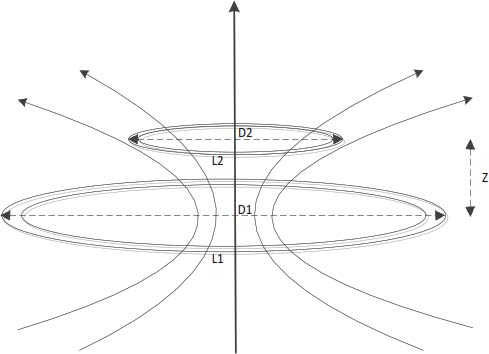
In this section more information regarding inductive power transmission is provided, which is required to build an inductive charging infrastructure along roads. A typical inductive power transmission between transmitter and receiver coil is shown in Figure 2. The transmitter coil L1 and receiver coil L2 form a system of magnetically coupled inductors. When the alternating current flows in the transmitter coil, a magnetic field is generated which induces a voltage in the receiver coil. This voltage can be used to power any electronic device or battery. The efficiency depends upon the distance between the coils Z and the relative size of the coils D2/D1 [22].
Typical arrangement of inductive power transfer system
When inductive technology is used for charging, the power flows via magnetic coupling between the power source unit generally buried under the ground surface and the receiver unit which is installed under the vehicle. If several power source units are present adjacent to each other, continuous power can be transferred to the receiver unit by simply moving it on top of power source units. This is called dynamic inductive charging, which is abbreviated as inductive charging in this paper. However, there are several design parameters which influence the inductive charging such as power, efficiency, vertical clearance, lateral displacement, electromagnetic field levels and economic viability [8], [23]. For practical reasons only certain values for these parameters are suitable, which are explained below.
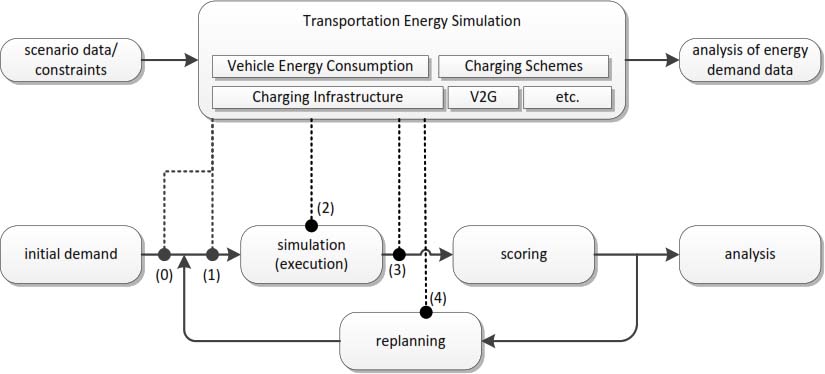
As mentioned in the background section, we have extended a framework for simulation of electric vehicle scenarios, in order to simulate inductive charging along roads. The Transportation Energy Simulation (TES) framework itself contains several interfaces and modules, to simulate a variety of scenarios. Figure 3 shows an overview of the framework, which uses the MATSim simulation. The framework plugs into the MATSim simulation framework at different points:
This is the point, where TES framework can perform one time initialization operations, such as defining at which parking/road charging infrastructure should be available (0);
This point is just before a new iteration in MATSim starts, but already part of the MATSim iteration loop. Here operations, which are part of the optimization, can take place, e.g. a policy change (1);
During execution of the MATSim simulation, TES simulates the energy consumption and charging of vehicles, according to the scenario setup (2);
After the execution of the micro-simulation in MATSim, the TES simulation produces output for further analysis and also updates the score, e.g. related to charging cost. As such the decisions related to electric mobility of an agent can influence other travel decisions of agents (3);
During replanning the plan of the agent can be adapted. For example, people having easier access to charging stations might prefer BEVs, while others might prefer plug-in hybrid electric vehicles (PHEVs) or switch to a different mode. Also the route can be chosen differently by different vehicles, e.g. lane reserved for BEV providing inductive charging (4).
Interfacing of MATSim with TES
For integration of the inductive charging module, the initialization of electrified roads is done at step (0). The charging of vehicles happens at point (2). The state of charge (SOC) of the electric vehicles is updated on a per link basis, as the MATSim traffic model does not support any dynamics or interaction of vehicles inside roads. This means, the SOC of the vehicles is updated after the vehicles have travelled along a road, considering both the energy consumption and energy charged. At the moment, for all vehicles only one type of power is available, which should change in future, see future work section.
At the time we conducted this work, only a limited set of energy consumption models were available for BEVs in TES. We contributed an energy consumption model of electric vehicles to the TES framework, which is adopted from the work of Faria, et al. [25] and is shown in Figure 4. This energy consumption model is based upon the specification of Nissan Leaf BEV. In TES the energy consumption model act as a lookup table which is composed of paired values of energy required at different speed levels.
Energy consumption model of BEV
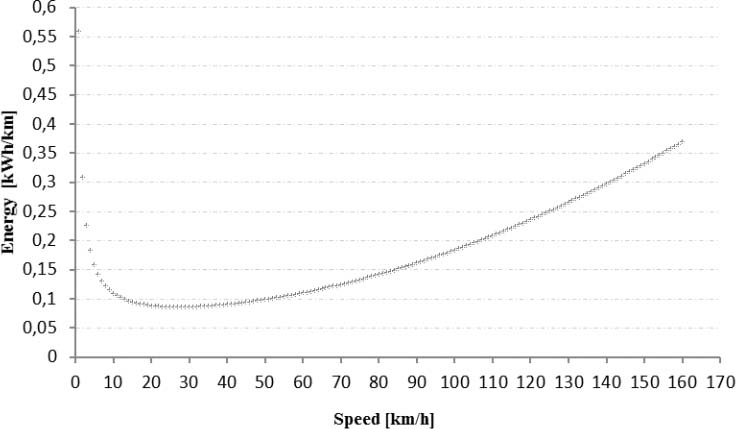
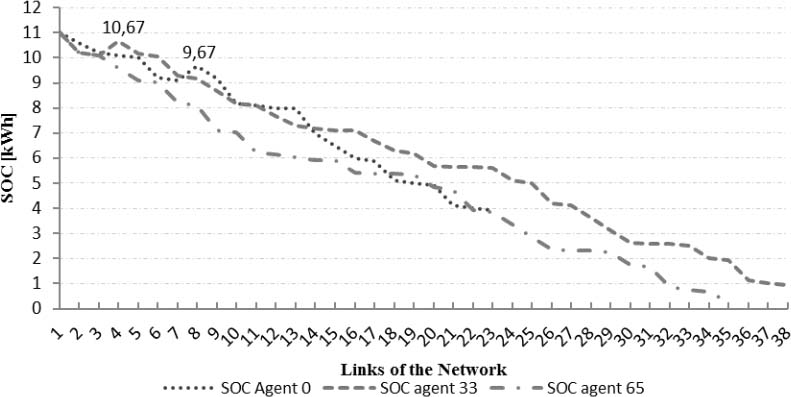
Figure 5 exemplifies how the SOCs of three agents develop as they drive on a road network where only ca. 2% of the roads are inductive charging enabled (power output of 10.65 kW and battery size of 11 kWh). One can observe that the SOC of two agents i.e. agent 0 at link 8 and agent 65 at link 4 has increased due to inductive charging. In contrast, agent 33 didn't find any inductive charging enabled links on its route therefore its SOC never increases.
Three selected agents with in the network their SOC
Inductive charging scenarios are tested by enabling only some links with inductive charging. Several parameters influence the charging, which are described in the following.
The charging power can influence inductive charging behaviour of BEVs. More power can be transferred inductively depending upon the power available at the links and vehicle receiver coil capabilities. As the surface at the bottom of BEVs is limited, the available power is also limited. A power of 15 kW is used which is based on empirical data of inductive charging for a sports utility vehicle (SUV) [23].
Also the length of the electric link plays an important role for inductive charging. The longer the link size, the higher the potential of inductive charging. However, the cost of these electrified roads is much higher than for normal roads therefore the length of these links should be considered during optimization or only parts of roads should be enabled for inductive charging, as discussed in the future work section.
Location of these electrified links is also an important parameter. In large networks it becomes more complicated to find suitable locations. One such location could be at the intersection (see [11]) or high traffic count links. Also congested links are good candidates, as the possibility to charge depends also on the time the BEV spends on such inductive charging links.
Related to this is the maximum allowed speed for driving on an electrified road, as it plays an important role on how much energy can be charged on a link. Lower speed links allow for more charging per meter, but on the other side they are less attractive due to longer travel time.
Abstract network and facility distribution
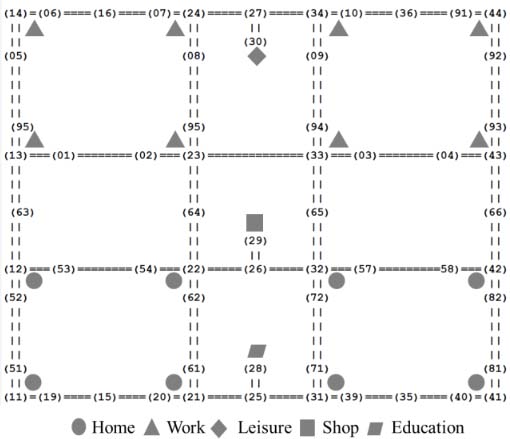
One example of an activity chain is h-w-l-h: an agent leaves home at 8:00 am in the morning for work. It drives the vehicle to its workplace and reaches it at 8:30 am. The agent works for 08:30 hours and then leaves its workplace at 05:00 pm and drives its vehicle to a leisure facility. It reaches the facility at 5:30 pm and does sports for 01:30 hours then it leaves the leisure facility at 7:00 pm and finally reached home at 8:25 pm. The activity chains of the other agents are accordingly.
Initially the simulation is run for 100 iterations and it is observed that it reaches its relaxed state after 45 to 50 iterations. A relax state is a state when all the agents optimize their daily plans and no further improvements is possible in their plans, without other agents changing their plan. Therefore the 50th iteration is used as an input for TES to analyse inductive charging. The main parameters that are varied during the first two simulation scenarios are electrification of the links and stepwise battery size reduction.
For instance, as shown in Figure 7 when the battery size is reduced from 12.5 kWh to 11.5 kWh, 10% of the agents were unable to perform their plans, with no electrified links. Later when ca. 2% of the network is electrified the number of agents who were unable to perform their plans drops from 10% to 2%. When the electrification is raised from ca. 2% to ca. 4%, all the agents are able to complete their plans.
Impact of electrification of the network on different battery sizes
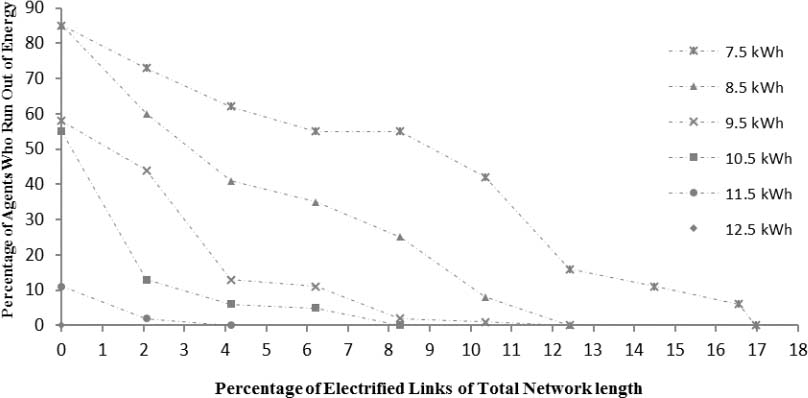
From the simulations it is clear that the size of the battery can be reduced significantly provided that certain percentage of the network links is electrified. The battery size can be reduced from 12.5 kWh to 7.5 kWh by electrifying 17% of the total network links and this reduction accounts for 40% of battery size reduction.
According to initial tests, 90% agents can be satisfied in case of 9.5 kWh battery by electrifying ca. 6% of the network links. This accounts for a battery size which is ca. 75% of its original size (12.5 kWh).
In the second experiment, the previous simulation is run again with same parameters except a slight variation in the network properties mainly for simulating congestion.
Impacts of congestion on SOC of three agents
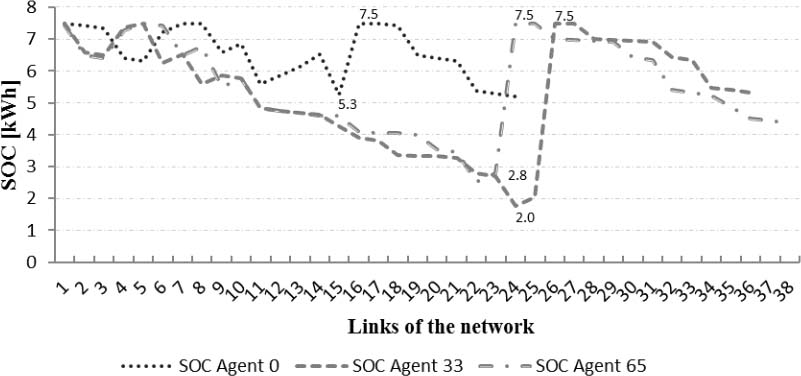
All of them reach 100% SOC due to congestion at these links which allows agents to charge longer. As depicted in the graph if agent 33 and agent 65 were not able to charge ca. 5 kWh at congested links both agents' SOC would drop to 0% before they could reach their final destinations. Moreover, the agents didn't choose to go through congested links rather due to change in network configuration they show such behaviour. One can conclude from these results that the inductive charging is ideal for only those sections of the networks which have high traffic counts and have low average speeds.
In third experiment, the main objective is to analyse inductive charging at intersections. Furthermore, plugin charging is also introduced in the experiment for relative comparison.
The best condition for a vehicle is by facing a green light whenever it arrives at an intersection which means 0 seconds of waiting time and the worst condition is by facing a red light whenever a vehicle arrives at an intersection. In case of red light the maximum waiting time is 60 seconds which is the combined time of other three phases. By taking average of both the best and the worst condition, an average waiting time for stopped vehicles at the intersection is calculated as 30 seconds.
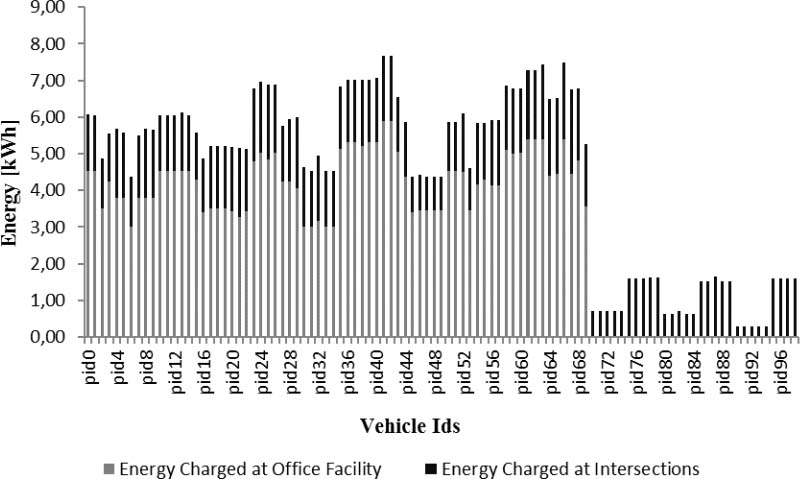
As shown in Figure 9, agents were able to charge as much as 2 kWh of energy by utilizing their stoppage time at intersections during their everyday activities. This amount of energy is equivalent to ca. 10 km of driving range extension (assuming 0.2 kWh/km). Some agents only charged their vehicles at intersections, as their plans do not contain any work activity where they could charge.
Comparison between energy charged at office facilities and at intersections
The work presented in this paper is initial work with regards to simulation of inductive charging of electric vehicles, which is based on the master thesis of the first author [27]. There are many limitations, which we would like to highlight and improve in future.
In this paper all vehicles had the same battery size, based on the energy requirement of the vehicle, which needed the most energy. In future, one could allow different vehicles to have different battery sizes according to their energy needs. Also at the time of this writing, only one type of charging power can be modelled. This is being extended at the moment, such that differences in charging capability of different vehicles can be accounted for, as described in [22].
In the current version of TES framework, regenerative braking is not modelled. Furthermore, the network used in this paper is two dimensional. In future, TES framework will be extended such that it supports kinetic energy recovery system (KERS) and also allows different energy consumption models for different gradients levels (uphill/downhill) for a more accurate calculation of energy consumption by BEVs. The heuristic for selecting the best road for incorporating inductive charging might also be adapted in future. Instead of using the road, with the highest traffic count, one might also consider the length and average travel time on the road.
Besides these improvements, also work on bigger more realistic scenarios is currently underway where inductive charging for the city of Berlin should be looked at. Also new applications of inductive charging scenarios are being considered: For example for bus based public transit systems one potential location to place an inductive charging system would be at dedicated bus lanes and/or bus stops. Moreover, it is much easier to implement such technology for public transport because the routes of the bus lines are fixed and the demand is known. In this work a cost-benefit analysis is missing, which seems essential to support policy makers and should be incorporated in future. In this case, one might also try out placing inductive charging systems only in certain areas of roads instead of the whole road, e.g. at intersections, where queuing happens.
In this paper, a relatively new charging approach (inductive charging) for BEVs is modelled and simulated successfully by implementing an inductive charging module a framework for electric vehicle simulation. The simulations help to model inductive charging with a detailed spatial and temporal resolution. Different scenarios suggest that inductive charging has a significant effect on battery size of BEVs and is capable of transferring a reasonable amount of energy to BEVs in a short period of time especially in case of charging at intersections and as such can support the overall charging infrastructure. In the test scenarios the battery size of BEV could be reduced up to 40% of its original size by electrifying around 20% of the total network. This technology can play a complementary role in mass penetration of BEVs.
Besides improving the model further, in future it would be interesting to apply such a model to more realistic scenarios. Such models have been developed for many cities across the globe including Singapore [28].
- ,
Key world Energy Statistics 2012 ,International Environment Agency , 2012 - ,
CO2 Emissions from Fuel Combustion Highlights ,International Energy Agency , 2012 - ,
Beyond Batteries: An Examination of the Benefits and Barriers to Plug-in Hybrid Electric Vehicles (PHEVs) and a Vehicle-to-grid (V2G) Transition ,Energy Policy , Vol. vol. 37 (no. 3), :1095-11032009, https://doi.org/10.1016/j.enpol.2008.10.005, pp - ,
Global EV Outlook: Understanding the Electric Vehicle Landscape to 2020 ,International Energy Agency , 2013 - ,
Advanced Vehicles and Fuel: Electric Vehicles , 2010, [Online]. Available: http://www.fueleconomy.gov/feg/evtech.shtml [Accessed: 14-Feb-2013] - ,
Fast Charging of EV Batteries - T at SYSLAB ,EDISON , 2012 - ,
Plug-In Electric Handbook: For Public Charging Station Hosts ,National Renewable Energy Laboratory , 2012 - ,
A Review on Inductive Charging for Electric Vehicles ,IEEE International Electric Machines & Drives Conference (IEMDC) , 2011 - ,
Application of Shaped Magnetic Field in Resonance (SMFIR) ,Technology to Future Urban Transportation , 2011 - ,
Development and Performance Evaluation of a Non-contact Rapid Charging Inductive Power Supply System for Electric Micro-bus ,Vehicle Power and Propulsion Conference (VPPC) , 2011 - ,
Toward a Wireless Charging for Battery Electric Vehicles at Traffic Intersections ,Intelligent Transportation Systems (ITSC) , 2011 - ,
Optimal Design of the Wireless Charging Electric Vehicle ,Electric Vehicle Conference (IEVC) , 2012 - ,
About Us , 2006, http://www.matsim.org/impressum [Accessed: 20-Oct-2012] - ,
Adaptation in Natural and Artificial Systems: An Introductory Analysis with Applications to Biology ,Control and Artificial Intelligence , 1992 - ,
A Structural Model of Peak-Period Congestion: A Traffic Bottleneck with Elastic Demand ,The American Economic Review , Vol. 83 (1), :161-1791993, pp - ,
Generating Complete All-day Activity Plans with Genetic Algorithms ,Transportation , Vol. 32 (4), :396-3972005, https://doi.org/10.1007/s11116-004-8287-y, pp - ,
Travel Demand Modelling for Multi-agent Transport Simulations: Algorithms and Systems ,PhD. Thesis , 2007 - ,
Adding Transit to an Agent-based Transportation Simulation: Concepts and Implementation ,PhD. Thesis , 2010 - ,
Integrating Power Systems, Transport Systems and Vehicle Technology for Electric Mobility Impact Analysis and Efficient Control ,IEEE Transactions on Smart Grid , Vol. vol. 3 (no. 2), :934-9492012, https://doi.org/10.1109/TSG.2012.2190628, pp - ,
Plug-in Hybrid Electric Vehicles and Smart Grids: Investigations Based on a Microsimulation ,Transportation Research Part C: Emerging Technologies , Vol. vol. 28 , :74-862013, https://doi.org/10.1016/j.trc.2012.10.011, pp - ,
Add-ing Electric Vehicle Modeling Capability to an Agent-based Transport Simulation ,Data Science and Simulation in Transportation Research , 282-3182014, Ineds.pp - ,
Wireless Power for Mobile Devices ,Telecommunications Energy Conference (INTELEC) , 2011 - ,
KAIST Wireless Electric Vehicles- OLEV ,Society of Automotive Engineers , 2011 - ,
Top 10 Tech Cars ,IEEE SPECTRUM , 45-502013, pp - ,
A Sustainability Assessment of Electric Vehicles as a Personal Mobility System ,Energy Conversion and Management , Vol. vol. 61 , :19-302012, https://doi.org/10.1016/j.enconman.2012.02.023, pp - ,
, Traffic Signal Timing Manual , 2008 - ,
Modelling Wireless Charging for Electric Vehicles in MATSim ,M.Sc. thesis , 2012 - ,
Estimating Dynamic Workplace Capacities Using Public Transport Smart Card Data and a Household Travel Survey ,17th International Conference of Hong Kong Society for Transportation Studies , 2012