Many technology options exist to reduce vehicle energy use, greenhouse gas (GHG) emissions, and fuel costs. Among these are engine efficiency improvements, hybridization, vehicle light weighting, and other options like reduction of aerodynamic drag, tire rolling resistance and drivetrain losses. All these technologies have different costs and influence energy use in different ways. An integrated framework on how to best implement those technologies is missing.
Optimization is an often applied method in automotive research. Most previous studies however have focused on optimal power management and powertrain component sizing to achieve minimal vehicle energy use or to reach minimal life cycle costs and GHG emissions [1]-[3]. In [4] it is analyzed how light weighting and power train efficiency technology can be optimally implemented to minimize vehicle lifetime costs. The study clearly shows the trade-off between investments in light weighting versus power train efficiency technology, however the methodology has some limitations that prevent it from being used for specific drivetrain technologies. These limitations have been overcome in [5], which considers the regeneration capability of electric drivetrains and secondary mass and cost effects due to compounding of component sizes. It also allows studying the sensitivity of the optimal solutions to component specific parameters such as battery energy density or battery specific cost.
Light weighting is a technology option currently pursued by the automotive industry to reduce vehicle energy consumption and meet regulatory emission standards. It refers to a replacement of conventional materials such as steel with materials of higher strength and/or stiffness per weight such as high-strength steel, aluminum, magnesium, or carbon fiber composite in order to reduce vehicle mass while keeping other consumer criteria constant. Recent examples include the Volkswagen Up and the BMW i3 using high-strength steel and carbon fibre, respectively.
Due to the different principles of energy conversion and storage the effects of light weighting on vehicle configuration and energy use are very different in conventional and electric drivetrains. In this paper the effects of light weighting on the mass and energy use of an internal combustion engine vehicles (ICEV) and battery electric vehicles (BEV) are compared. There are several interesting trade-offs related to the use of light weighting. Lightweight parts are in general more expensive to manufacture per unit of weight. However, a lighter vehicle uses less energy and requires a smaller powertrain and energy storage at constant range and performance, which in turn reduces vehicle costs. In this work the estimated cost of light weighting is compared against the reduced costs for the powertrain, energy storage, and vehicle operation. The optimal amounts of light weighting minimizing manufacturing and total costs of an ICEV and BEV are compared. Analytic solutions for the optimal degree of light weighting minimizing total costs are studied as a function of relevant parameters.
Previous studies have analyzed the impact of light weighting on vehicle energy consumption, cost, and life-cycle energy use [4]-[10]. This work extends these by combining vehicle simulation and cost assessment in an analytic method to compare the benefits of lightweight material use in conventional and electric powertrains. The modeling method allows analyzing the sensitivity of the optimal solutions in an unprecedented way.
In this paper first the methodology and data are introduced, and then the resulting effects of light weighting on conventional and electric vehicle mass and energy use are analyzed. Finally the analytic solutions for the optimal degree of light weighting minimizing total costs are analyzed as a function of relevant parameters.
An analytic vehicle simulation method is used to calculate gasoline ICEV and BEV energy use and mass [5]. In this approach driving cycle dependent coefficients are combined with vehicle resistance characteristics, i.e. the frontal area, aerodynamic drag, tire rolling resistance, and vehicle mass to calculate mechanical energy demand [11]. To convert vehicle mechanical energy demand for a certain driving cycle into vehicle energy use, driving cycle averaged power train efficiencies are calculated using Advisor, a numeric vehicle simulation software [12]. The calculation of vehicle energy demand and average operating point efficiencies is based on the New European Driving Cycle (NEDC), the standard driving cycle for emission certification in Europe. Several studies have shown that the fuel consumption as measured by vehicle manufacturers for the NEDC driving cycle is significantly lower than “real-world” consumption and that this discrepancy increased over time to about 20% in 2012 [13]. Reasons for this include among other things the increasing use of tolerances in the determination of road load, test temperatures, and transmission shifting schedules for type-approval, as well as the increasing market share of vehicles equipped with air conditioning systems [13]. These causes do not apply to the simulation presented in this work since the above factors are assumed to correspond to real driving conditions. If generally a more aggressive drive cycle than the NEDC is deemed appropriate, the results for energy use must be scaled accordingly. This would result in a higher share of fuel or electricity to total vehicle costs and accordingly a higher degree of light weighting being optimal. An analytic expression is used to evaluate vehicle mass and energy use as a function of primary mass reduction, vehicle configuration parameters such as vehicle range and performance, and technical parameters such as battery specific energy [5]. The used method allows keeping vehicle range and performance constant while reducing vehicle weight. The baseline vehicle configuration corresponds to a midsize passenger car (see Table 1).
Vehicle configuration
| ICEV | BEV | ||
|---|---|---|---|
| Frontal area, [m2] | 2.2 | ||
| Aerodynamic drag coefficient | 0.28 | ||
| Rolling resistance coefficient | 0.01 | ||
| Glider mass, [kg] | 1070 | 1005 | |
| P/m-ratio, [W/kg] | 70 | ||
| Range, [km] | 800 | 200/400 |
Vehicle mveh is calculated as the sum of power train mass mpt (engine system for the ICEV and electric motor including controller for the BEV), the energy storage mass mes (fuel tank including fuel for the ICEV and Li-ion battery for the BEV), glider mass mgl, (the glider represents all remaining vehicle parts, i.e. the body, chassis, interior, etc.) and additional material msup necessary for structural support of the powertrain and energy storage beyond the glider baseline (this is particularly relevant for structural support of the battery in a BEV):
The baseline glider is based on an inventory of the 2008 Mercedes Benz A-Class [14], [15]. The glider mass consists to 72% of steel and to 28% of other materials. It is assumed that light weighting is applied to the part consisting of steel (primarily used in the body, doors, and chassis). The part made of materials other than steel (mainly found in the vehicle interior, tires, powertrain fluids, etc.) is kept constant. The base glider mass is slightly higher for the ICEV than for the BEV due to additional mass for the transmission and exhaust system. Powertrain and energy storage mass and cost are calculated as the sum of a fixed amount and a fraction that scales linearly with power and energy storage capacity. Table 2 lists relevant component-specific mass and cost baseline assumptions. Note that these numbers represent the current technology status. Evaluation of light weighting effects for future scenarios is not analysed in this paper, however the sensitivity to important input parameters, in particular battery specific energy and cost, is analysed.
Manufacturing costs are calculated as the sum of powertrain, energy storage and glider cost. Glider cost Cgl is the sum of a fixed cost for the part that is not light weighted (corresponding to mgl,fix) and a variable cost that is dependent on the amount of weight reduction implemented (corresponding to mgl,var).
Glider specific fixed cost is SCgl,fix = 14.3 $/kg and variable baseline (without use of lightweight materials) cost is SCgl,var,0 = 5.7 $/kg. Both specific cost values are based on the mass and manufacturing cost breakdown for a midsize passenger car given in [16]. Specific cost scaling is based on a literature review of the manufacturing cost increase of lightweight materials relative to steel. In order to analytically minimize vehicle cost a continuous lightweight cost function is used. This concept is rather artificial as in practice discrete material options lead to discrete weight reduction potentials and costs. However for the purpose of this analysis, i.e. the comparison of the cost reduction effects of light weighting for different power train types, it is useful. Figure 1 shows the literature data [21]-[25] together with a fit for a quadratic polynomial with an asymptote at the assumed maximum amount of light weighting Δmgl,var,max which is assumed to be 80%.
Light weighting manufacturing cost increase relative to steel. Shown are literature data (circles) and a low, average, and high light weighting cost function
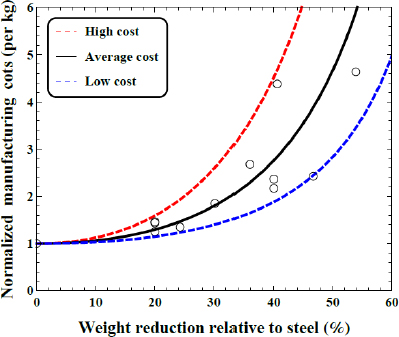
The “average cost” function in Figure 1 corresponds to a least squares fit which yields a = 5.5. It will be referred to as the baseline light weighting cost function in the following analysis. The data and fit shows the general trend that the more mass the lightweight material can substitute relative to steel, the more expensive it is to manufacture (per unit of weight). Reductions of up to 20-30% can be achieved at relatively low cost by substituting steel with high-strength steel. Higher reductions require materials with a higher amount of labour and energy input per kg of material, e.g. carbon fibre. Due to the spread and limited availability of data, two additional cost functions for a lower (a = 2.75) and a higher (a = 11) bound are defined.
To convert manufacturing costs to retail price, a mark up factor of 1.4 is used [16]. Total costs are calculated as the sum of vehicle purchase and lifetime energy costs. Maintenance and repair costs are assumed to be independent of light weighting and are therefore not considered. For simplicity no discounting, i.e. devaluation of future energy costs, is used. In the base case a lifetime of ten years, an annual driving distance of 15,000 km, a gasoline price of 2 $/L and an electricity charging cost of 0.35 $/kWh are assumed. Charging cost is based on an electricity price of 0.2 $/kWh, an energy based tax of 25 $/GJ, and 0.06 $/kWh charging station cost. For the BEV the total driving distance of 150,000 vehicle-kilometre (kmv) is limited by the lifetime of the battery. For the ICEV a second base case with 300,000 kmv is analysed.
The cost minimum is found by setting the partial derivative of manufacturing and total costs to zero and solving for the optimal degree of light weighting as a function of the parameters of interest. The explicit equations for the optimal degree of light weighting are not given as they are generally rather long, instead the results are shown graphically.
Figures 2a and 2b show total ICEV and BEV mass as a function of variable glider mass reduction. Even though the base glider mass is slightly higher for the ICEV than the BEV, total vehicle mass is higher for the BEV due to the additional mass of the battery. As the weight of the glider is reduced, the sizes of the powertrain and energy storage decrease if acceleration performance and range are kept constant. This effect is referred to as secondary weight reduction in the following. Figure 2c shows vehicle energy use for the NEDC as a function of variable glider mass reduction. Due to the lower powertrain efficiency and the lack of regeneration capability, the sensitivity of energy consumption to mass reduction is lower for the BEV than the ICEV. Note also that the sensitivity of energy consumption to mass reduction is generally higher in urban driving conditions, due to a higher share of kinetic energy (for acceleration) to total mechanical energy demand. This makes light weighting particularly useful in urban driving conditions, e.g. for urban delivery vehicles.
Vehicle mass (a, b) and energy consumption (c) for the ICEV and BEV (200 km range) as a function of variable glider mass reduction
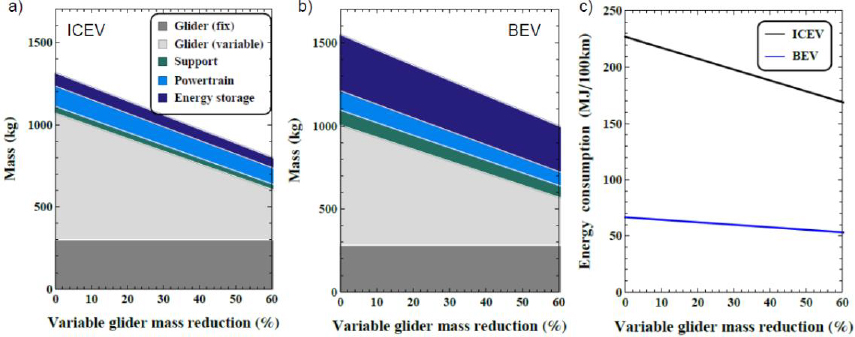
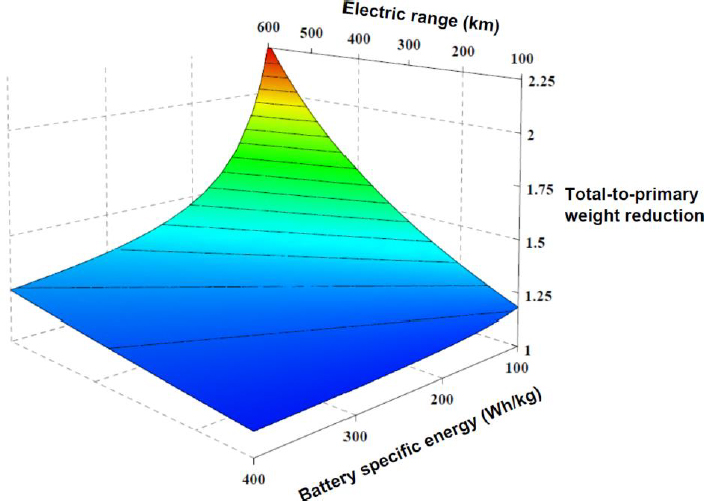
The secondary weight reduction effect is particularly relevant for the BEV due to the high mass and cost of the battery. It is reflected in the total-to-primary weight reduction, i.e. the ratio of total vehicle mass reduction (including secondary effects) to primary glider mass reduction, which equates in the baseline case to 126% for the BEV (at 200 km range) and 111% for the ICEV. Secondary weight reduction effects in a BEV are particularly dependent on the battery size and as such on vehicle range and battery specific energy. Figure 3 shows the total-to-primary vehicle weight reduction as a function of electric range and battery specific energy. It can be seen that secondary weight reduction is significant for current battery technology (ca. 100 Wh of usable energy per kg battery pack) at ranges above ca. 200 km. For future batteries reaching 300 Wh/kg secondary weight effects become significant only above ca. 600 km range.
Total-to-primary BEV weight reduction as a function of vehicle electric range and battery specific energy
Note that the assessment in this paper does only take into account secondary weight reduction effects within the powertrain, energy storage, and support structure but not within the glider itself, as for example investigated in [26]. In principal the method can be easily adapted to include this effect. If secondary weight reduction within the glider were included, total secondary effects would be higher and the results shown in the following slightly more positive towards the use of light weighting. However, the general conclusions regarding the relative benefits of light weighting in conventional and electric vehicles remain unchanged.
Figure 4a shows ICEV manufacturing cost as a function of variable glider mass reduction for the baseline lightweight cost function. Minimum manufacturing cost is reached at ca. 10% weight reduction. Figure 4b and 4c show the breakdown of ICEV total cost also as a function of variable glider mass reduction for the baseline lightweight cost function. It is apparent that the share of fuel costs to total costs is relatively high and dominates if no lightweight material is used. Due to the high share of fuel to total costs and the high sensitivity of fuel consumption to weight reduction, the difference between the optimal weight reductions minimizing manufacturing versus total costs is relatively large and increases further at higher driving distance. For 150,000 kmv (Figure 4b) minimum total cost is reached at 22% and for 300,000 kmv (Figure 4c) at 31% variable glider mass reduction.
Effect of light weighting on the manufacturing (a) and total costs 150,000 kmv (b); 300,000 kmv (c) for the ICEV. Black points indicate optimal levels of light weighting minimizing manufacturing and total costs
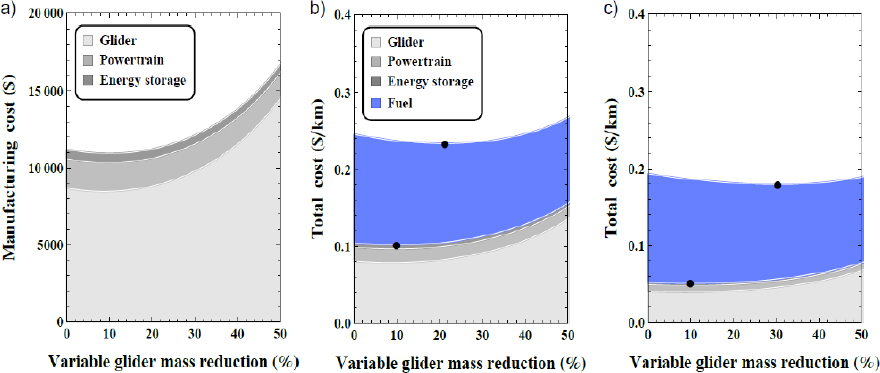
Figure 5a shows the sensitivity of the optimal weight reduction minimizing ICEV total cost relative to lifetime driving distance. The optimal degree of light weighting is very sensitive to the driving distance and the considered light weighting cost function. Figure 5b shows the corresponding total cost reduction. For the baseline lightweight cost function it is $1, $780 and $4,130 for 150,000 and 300,000 kmv, respectively.
Optimal weight reduction minimizing ICEV total cost as a function of lifetime driving distance for three lightweight cost functions (a); Corresponding total cost reduction (b)
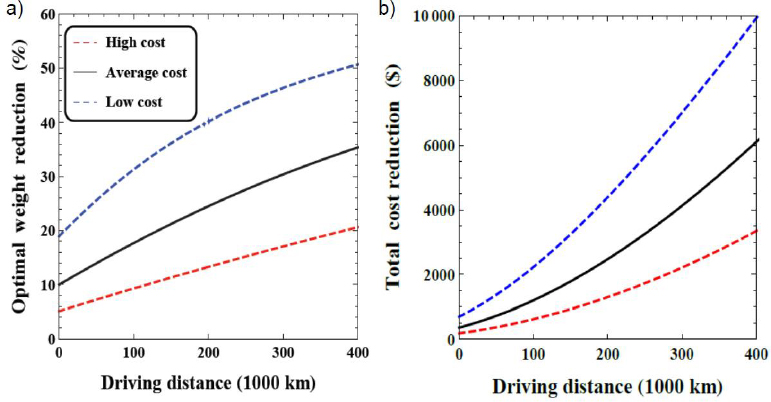
Figure 6a shows the optimal amount of light weighting minimizing total costs as a function of vehicle driving distance and fuel price. In this case the baseline light weighting cost function is assumed. The optimal use of light weighting is very sensitive to both parameters. Figure 6b shows the corresponding total cost reduction.
Optimal weight reduction (indicated in % in the legend) to minimize total cost of an ICEV as a function of fuel price and kmv (a); Corresponding total cost reduction (in $) (b)
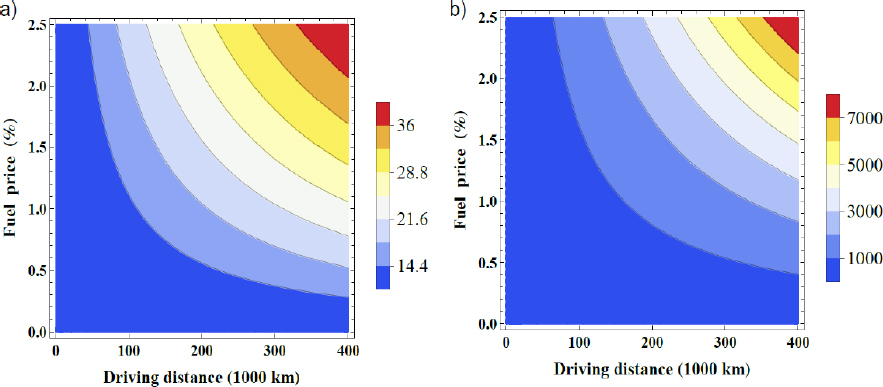
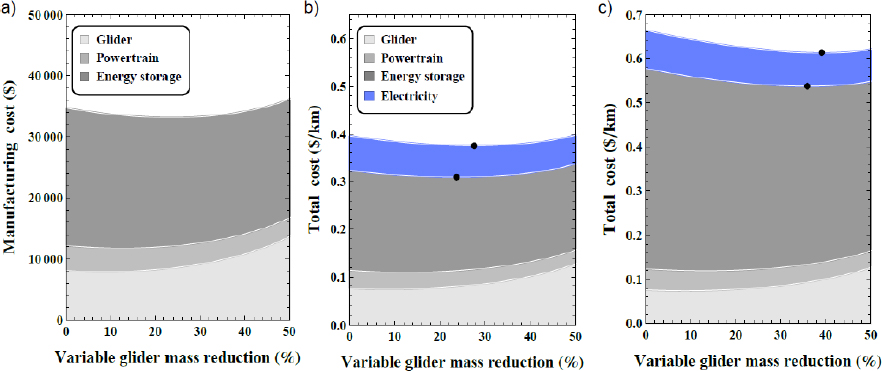
Figure 7a shows BEV manufacturing cost as a function of variable glider mass reduction. In this case the baseline lightweight cost function and battery costs according to Table 2 are assumed. Minimum manufacturing cost is reached at 24% weight reduction. The higher optimal use of light weighting in the manufacturing phase relative to the ICEV (24% vs. 10%) is due to the high cost of the battery. Reducing vehicle weight it can be downsized while maintaining the same driving range which reduces manufacturing costs and results in the higher optimal degree of light weighting relative to the ICEV. Figure 7b and 7c show total cost as a function of weight reduction for a BEV with a range of 200 km and 400 km, respectively. In this case the baseline charging cost of 0.35 $/kWh and a driving distance of 150,000 kmv are assumed. Minimal total cost is reached at 28% and 39% variable glider mass reduction for a BEV range of 200 km and 400 km, respectively. The small difference between the solutions minimizing manufacturing and total costs is due to the low share of electricity to total costs and the relatively low sensitivity of BEV energy consumption to weight reduction.
BEV manufacturing (a) and total costs (b, c) as a function of variable glider mass reduction. In b) the driving range is 200 km while in c) it is 400 km. Black points indicate optimal levels of light weighting minimizing manufacturing and total costs
Baseline specific mass and cost of vehicle components
| Unit | Mass | Unit | Cost | Source | |
|---|---|---|---|---|---|
| Gasoline engine | [kg] |
61 |
[$] |
1000 |
[8, 16] |
| Motor/controller | [kg] |
22 |
[$] |
500 |
[17, 18] |
| Gasoline tank | [kg] |
10 |
[$] |
300 |
[16] |
| Li-ion battery | [kg] |
30 |
[$] |
4000 |
[19, 20] |
The high sensitivity of the optimal degree of light weighting to BEV range is analyzed in Figure 8. Figure 8a shows the sensitivity of the optimal weight reduction minimizing BEV total costs for the three lightweight cost functions considered as a function of BEV range. Figure 8b shows the corresponding total cost reduction. For the baseline lightweight cost function it is $3,070 and $7,620 for a range of 200 and 400 km, respectively. Compared to the analysis shown in Figure 5 for the ICEV, the relation between total cost reduction and range at a given amount of light weighting is nonlinear for the BEV due to secondary scaling effects that occur for an increase in range as explained earlier.
Optimal weight reduction minimizing total cost of the BEV as a function of vehicle range for three lightweight cost functions (a); Corresponding total cost reduction (b)
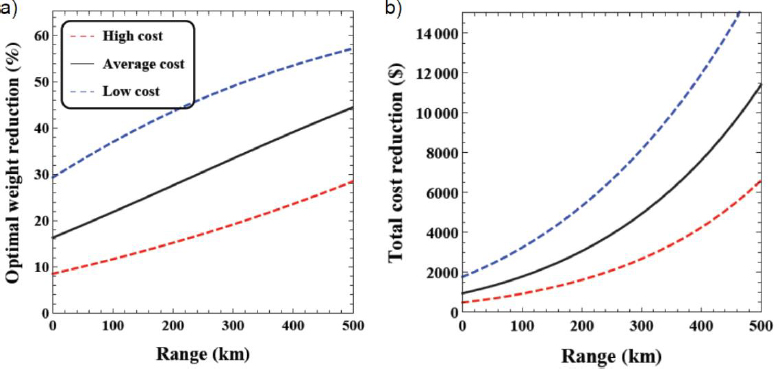
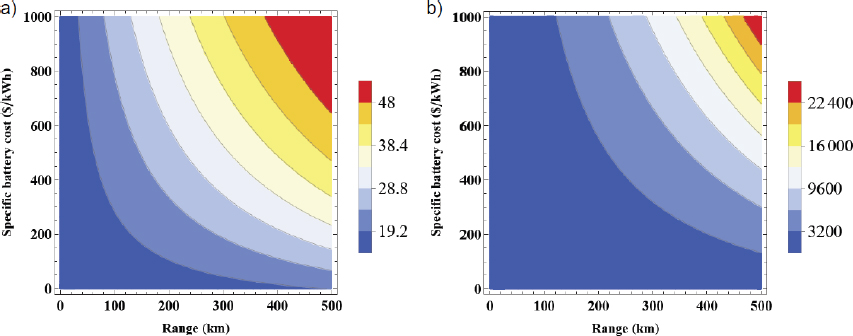
Figure 9a shows the optimal amount of light weighting to minimize total costs as a function of vehicle range and battery cost for the baseline lightweight cost function. Figure 9b shows the corresponding reduction in total cost. It is obvious that as battery specific mass and cost decrease, the incentive for light weighting decreases too due to lower associated battery cost and mass reduction potentials.
Optimal weight reduction (in %) minimizing BEV total cost as a function of specific battery cost and vehicle range (a); Corresponding total cost reduction (in $) (b)
In this paper an analytic optimization approach was applied to compare the effects of light weighting on the mass, energy use, manufacturing and total costs of a midsize gasoline ICEV and BEV. The method was further used to study the sensitivity of the optimal solutions minimizing total costs as a function of important input parameters.
The results show a strong secondary weight and cost saving potential for the BEV due to the high mass and cost of the battery, but a higher sensitivity of vehicle energy consumption to mass reduction for the ICEV due to the relatively low powertrain efficiency and lack of regeneration capability.
For current technology costs the optimal amount of light weighting minimizing manufacturing costs is found to be higher for the BEV (24%/36% at 200/400 km range) than the ICEV (10%) due to the high battery cost which can be reduced with the use of lightweight materials. The optimal amount of light weighting to minimize total cost is similar for the BEV (28% at 200 km range) and the ICEV (31% at 300,000 kmv). The difference between the optimal solutions minimizing manufacturing versus total costs is higher for the ICEV than the BEV due to the relatively low energy consumption and low share of electricity to total costs for the BEV.
Furthermore the sensitivity to several input parameters was investigated. The optimal amount of light weighting for the ICEV is very sensitive to parameters affecting lifetime fuel cost (most importantly fuel price and total driving distance) because it represents a high share of total costs. For the BEV the optimal amount of light weighting and its cost benefits are more sensitive to parameters affecting battery cost, most importantly battery specific cost and vehicle range. The light weighting cost function is very important for both drivetrains. The sensitivity of the results to those parameters was studied.
The research presented in this work can be used to evaluate and compare the implications of light weighting on conventional and electric vehicles' mass, energy use and costs. Overall the results show that light weighting is a promising technology option for the reduction of vehicle energy use and costs. In order to decide on the best light weighting strategy it is important to also consider other aspects such as safety and life-cycle environmental impacts.
The method presented in this paper is generally not limited to light weighting but can be equally applied to other technology options reducing vehicle energy use (e.g. reduction of aerodynamic drag or tire rolling resistance) and optimization objectives.
| Cgl | Glider cost | [$] |
| mgl | Glider mass | [kg] |
| mgl,fix | Fixed glider mass | [kg] |
| mgl,var | Variable glider mass | [kg] |
| Δmgl,var | Reduction of variable glider mass | [kg] |
| Δmgl,var,max | Maximum amount of variable glider mass reduction | [kg] |
| mpt | Power train mass | [kg] |
| mes | Energy storage system mass | [kg] |
| msup | Mass of structural support | [kg] |
| SCgl,fix | Fixed specific glider cost | [$] |
| SCgl,var,0 | Baseline variable specific glider cost | [$] |
| SCgl,var (Δmgl,var) | Specific glider cost as a function of variable glider mass reduction | [-] |
| BEV | Battery Electric Vehicle |
| GHG | Greenhouse Gas |
| ICEV | Internal Combustion Engine Vehicle |
| NEDC | New European Driving Cycle |
- ,
Power Management and Design Optimization of Fuel Cell/Battery Hybrid Vehicles ,Journal of Power Sources , Vol. Vol. 165 (No. 2), :819-8322007, https://doi.org/10.1016/j.jpowsour.2006.12.038 - ,
Optimal Plug-in Hybrid Electric Vehicle Design and Allocation for Minimum Life Cycle Cost, Petroleum Consumption, and Greenhouse Gas Emissions ,Journal of Mechanical Design , Vol. Vol. 132 , :0910132010, https://doi.org/10.1115/1.4002194 - ,
An Optimization Framework for Comparative Analysis of Multiple Vehicle Powertrains ,Energies , Vol. Vol. 6 , :5507-55372013, https://doi.org/10.3390/en6105507 - ,
Optimal Implementation of Lightweighting and Powertrain Efficiency Technology in Passenger Vehicles ,Transport , Vol. Vol. 27 , :237-2492012, https://doi.org/10.3846/16484142.2012.719546 - ,
Optimal Lightweighting in Battery Electric Vehicles ,Proceedings of the International Electric Vehicle Symposium , 2012 - ,
Economic Assessment of Greenhouse Gas Emissions Reduction by Vehicle Lightweighting Using Aluminum and High-Strength Steel ,Journal of Industrial Ecology , Vol. Vol. 15 (No. 1), :64-802010, https://doi.org/10.1111/j.1530-9290.2010.00288.x - ,
Impact of Lightweight Design on Energy Consumption and Cost Effectiveness of Alternative Powertrain Concepts ,Proceedings of European Electric Vehicle Congress , 19-222012 - ,
Lightweighting Impacts on Fuel Economy, Cost, and Component Losses ,SAE International, SAE 2013-01-0381 , 2013 - ,
Life-cycle Energy and Greenhouse Gas Emission Benefits of Lightweighting in Automobiles: Review and harmonization ,Environmental Science & Technology , Vol. Vol. 47 (No. 12), :6089-60972013, https://doi.org/10.1021/es3042115 - ,
Vehicle Lightweighting vs. Electrification: Life Cycle Energy and GHG Emissions Results for Diverse Powertrain Vehicles ,Applied Energy , Vol. Vol. 126 , :13-202014, https://doi.org/10.1016/j.apenergy.2014.03.023 - ,
, Vehicle Propulsion Systems , 2007 - ,
Advisor 2.1: A User-friendly Advanced Powertrain Simulation Using a Combined Backward/forward Approach ,IEEE Transactions on Vehicular Technology , Vol. Vol. 48 (No. 6), 1999, https://doi.org/10.1109/25.806767 - ,
Discrepancies between Type-approval and Real-world Fuel Consumption and CO2 Values in 2001-2011 European Passenger Cars ,Report , 2012 - ,
Comparative Environmental Life Cycle Assessment of Conventional and Electric Vehicles ,Journal of Industrial Ecology , Vol. Vol. 17 (No. 1), 2012, https://doi.org/10.1111/j.1530-9290.2012.00532.x - ,
Environmental certificate A-class, Mercedes-Benz , 2008 - ,
Assessment of Fuel Economy Technologies for Light-duty Vehicles , 2011 - ,
Comparing the Benefits and Impacts of Hybrid Electric Vehicle Options ,EPRI 1000349 , 2001 - ,
Assessment of Electric Vehicle and Battery Technology, CE Delft, commissioned by EU , 2011 - ,
Performance of Batteries for Electric Vehicles on Shorter and Longer Term ,Journal of Power Sources , Vol. Vol. 212 , 2012, https://doi.org/10.1016/j.jpowsour.2012.03.085 - ,
Modeling the Performance and Cost of Lithium-ion Batteries for Electric Drive Vehicles , 2011 - ,
Future Steel Vehicle ,Overview report , 2011 - ,
New Steel Body , 2003 - ,
Super Light Car - An Integrated Research Approach for Lightweight Car Body Innovations ,Proceedings of the Conference Innovative Developments for Lightweight Vehicle Structures , 2009 - ,
Note on the Potential and Costs for Further CO2 Reduction Beyond 2012- development of Indicative Future Cost Curves , 2008 - ,
, Lightweight, Heavy Impact , 2012 - ,
Evaluating the Potential for Secondary Mass Savings in Vehicle Lightweighting ,Environmental Science & Technology , Vol. Vol. 46 (No. 5), :2893-29012012, https://doi.org/10.1021/es202938m


