


Due to growing worldwide concerns regarding anthropogenic interference with the climate system, 141 countries have, since December 2009, associated themselves with the Copenhagen Accord [1] that declared that deep cuts in Global Greenhouse Gas (GHG) emissions are required so as to hold the increase in global temperature below 2 degrees Celsius. Despite recent projections [2] indicate that the world is not on track to meet this 2 °C target – the long-term average temperature increase is more likely to be between 3.6 °C and 5.3 °C – it remains technically feasible, though extremely challenging [3]. To keep open a realistic chance of meeting the 2 °C target, intensive action is required before 2020, the date by which a new international climate agreement is due to come into force.
The European Union (EU) perspective is that industrialized countries should contribute to this global emissions reduction target by reducing GHG emissions by 20% by the year 2020 and between 80% and 95% by the year 2050, relative to 1990 levels. Even in the absence of a wider international agreement on climate policy, the EU has set an ambitious climate and energy policy framework for 2020 [4]-[7] and is now reflecting on a new 2030 framework [8]. Moreover European Commission (EC) laid out long term roadmaps which commit for reductions between 80% and 95% by 2050 relative to 1990 levels [9]–[11]. Table 1 illustrates the EC perspective on how the mitigation target should be distributed amongst sectors [9].
EU Low Carbon Roadmap GHG reduction compared to 1990
Sectors |
2005 |
2030 |
2050 |
|---|---|---|---|
Power (CO2) |
−7% |
−54 to 68% |
−93 to −99% |
Industry (CO2) |
−20% |
−34 to −40% |
−83 to −87% |
Transport (incl. CO2 aviation, excl. maritime) |
30% |
+20 to −9% |
−54 to −67% |
Residential and services (CO2) |
−12% |
−37 to −53% |
−88 to −91% |
Agriculture (non-CO2) |
−20% |
−36 to −37% |
−42 to −49% |
Other non-CO2 emissions |
−30% |
−72 to −73% |
−70 to −78% |
Total |
−7% |
−40 to −44% |
−79 to −82% |
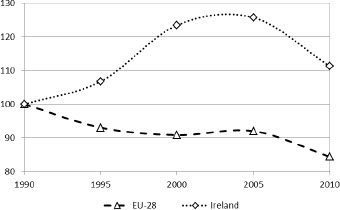
This paper focuses on Ireland, which is an interesting case study relative to other EU Member States (MS). Firstly in Ireland despite the recent economic recession, energy demand growth over the period 1990 to 2011 has been significant (1.8% per annum on average [12]) driven largely by high economic growth (4.8% per annum on average growth in real GDP). This increased energy demand was supplied mainly by fossil fuels, which accounted for 94% of all primary energy used in Ireland in 2011. Oil is the dominant energy source with a share of 49% in 2009 (was 47% in 1990), followed by natural gas with a share of 30% and coal (9%). Renewable energy passed from a low base of 1.8% of primary energy requirement, to 6%, largely driven by increase in wind energy capacity [12]. The rapidly increasing consumption of energy in Ireland, combined with the decreasing domestic production, has resulted in a significant increase in energy imports in recent years. Ireland exhibits a significant dependence on imported fossil fuels, which accounted for 88% in 2011 [12]. The UK is the major source of oil and natural gas for Ireland [13], [14]. Moreover this resulted in a 25.3% growth in energy-related carbon dioxide (CO2) levels for the period while EU emissions declined [15], as showed in Figure 1. If we reference GHG emissions reductions against 1990 levels rather than 2010 levels results in a very different scale of challenge: an 80% emissions reduction target relative to 1990 levels is equivalent in Ireland to an 82% emissions reduction target relative to 2010 levels, while for EU is 76%.
Historical GHG Emissions in EU-28 and in Ireland indexed to 1990
The second distinguishing characteristic of Ireland is the importance of the agricultural sector in the energy and climate debate. Agriculture in Ireland is predominantly based on dairy and beef production from ruminant animals, most of which (over 80%) is exported. Livestock activities are largely based on extensive, grass-based farming. Approximately 82% of total agricultural area in 2010 is devoted to grass (silage, hay and pasture), while the remainder is allocated to rough grazing (11%) and crop production (7%) [16]. In terms of the total land area of Ireland, agriculture accounts for about 60% as shown in Figure 2.
Breakdown of land use in Ireland in 2010
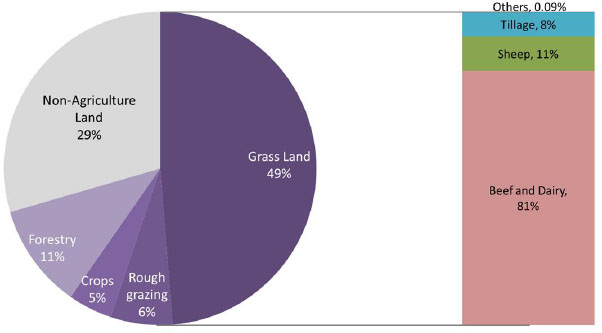
The agri-food sector contributes approximately 7% to Ireland’s economy (in terms of GDP), but at the same time agriculture accounts for 32.1% (in 2011) of total GHG compared with just 11.9% for the EU (average across EU-28) [15]. Of these emissions only 5% are associated with energy (for combustion) while the remaining originates as non-combustion emissions (namely methane and nitrous oxide). Beef and dairy farming is particularly challenging in terms of climate mitigation with very few options for emissions reduction [17]. Hence, it is very difficult to reconcile growth in beef and dairy farming with a low GHG emissions economy. This results in a considerable challenge for Ireland to meet deep emissions reduction targets.
Ireland has not established a firm mandatory target for the year 2050, but does have ambitious and legally binding targets for GHG emissions reduction targets for the year 2020 (this is dealt with in detail in a separate paper [18]). Under Directive 2009/29/EC approximately half of GHG emissions are due to large point source emitters (within part of industry, power generation and transformation) and are regulated under the European Emissions Trading Scheme (ETS). The collective target for all participants in the EU ETS is a 21% reduction in GHG emissions relative to 2005 levels† by 2020. Under the EU Effort Sharing Decision 2009/406/EC for the remaining half of greenhouse gas emissions (including agriculture), i.e. non-ETS emissions, the target for Ireland is to achieve a 20% reduction relative to 2005 levels.
Renewable energies are one of the key drivers for significant reductions in GHG levels. Bioenergy in the form of bioliquids, biogas and solid biomass may have a major role to play and represent one of the major options for substituting fossil fuels in the energy mix. However there are a number of environmental concerns associated with bioenergy centering on potential ecosystem damage, especially in the developing countries, and the level of climate change benefits of some bioenergies, particularly first generation biofuels [19]–[22]. Arising from these concerns and those linked to impacts for food prices, the EU Renewable Energy Directive (Directive 2009/28/EC) [6] establishes that biofuels must meet certain “sustainability criteria” in order for them to be counted towards national biofuels targets. The main criteria are:
From January 2017, the greenhouse gas emissions saving from the use of biofuels and bioliquids compared with the fossil fuels they displace shall be at least 50%. From 2018 that saving shall be at least 60%;
Biofuels from peatlands and land with high biodiversity value or high carbon stock may not be used;
Impact of biofuel policy on social sustainability, food prices and other development issues is to be assessed. Separate studies for Ireland [19], [23], [24] and UK [25] show these “sustainability criteria” beyond 2017 may affect the availability of bioenergy (especially biodiesel) from international trade limiting de facto the capacity of single countries of achieving emissions reduction targets.
The work presented in this paper assesses the role of bioenergy in Ireland in the context of achieving challenging GHG emission mitigation policies by 2050. It investigates a number of key technical and non-technical issues namely; how bioenergy can contribute to GHG emissions reduction targets for Ireland; how bioenergy will impact on Ireland’s energy import dependency and how bioenergy will compete on land usage with agri-food sector. Moreover this work scrutinizes how limited availability of bioenergy imports impacts on the energy system attempts to achieve deep GHG emissions reductions. This analysis is carried using the Irish TIMES model which is a bottom-up technology rich energy systems model for Ireland (details in the Methodology section).
The analysis in this report derives from scenario analysis using the Irish TIMES energy systems model [26]. The Irish TIMES model provides a range of energy system configurations for Ireland that each delivers projected energy service demand requirements optimised to least cost and subject to a range of technical and policy constraints for the period out to 2050. It provides a means of testing energy policy choices and scenarios, and assessing the implications:
For the Irish economy (technology choices, prices, output, etc.);
For Ireland’s energy mix and energy dependence;
For the environment, with a particular focus on greenhouse gas emissions.
It is used both to examine baseline projections, and to assess the implications of emerging technologies and of mobilising alternative policy choices such as meeting renewable energy targets and carbon mitigation strategies.
The Irish TIMES model was developed with TIMES (The Integrated Markal-Efom System) energy systems modelling tool; developed and supported by the Energy Technology Systems Analysis Program (ETSAP), an Implementing Agreement of the International Energy Agency (IEA) ‡. TIMES is a bottom-up model generator for local, national or multi-regional energy systems, which combines two different, but complementary, systematic approaches to modelling energy: a technical engineering approach and an economic approach [27]. TIMES computes a dynamic inter-temporal partial equilibrium on integrated energy markets. The objective function to maximize is the total surplus. This is equivalent to minimizing the total discounted energy system cost while respecting environmental and many technical constraints. This cost includes investment costs, operation and maintenance costs, plus the costs of imported fuels, minus the incomes of exported fuels, minus the residual value of technologies at the end of the horizon. The full technical documentation of the TIMES model is available in Loulou et al. [28]. A number of studies involving TIMES (and its predecessor MARKAL) models may be found in [29], [30].
The Irish TIMES model was originally extracted from the Pan European TIMES (PET) model and then updated with improved data based on much extensive local knowledge. The Irish energy system is characterized and modelled in terms of its supply sectors, its power generation sector, and its demand sectors. Extensive description and details on modelling structure and approach may be found in [18], [26], [31].
The Irish TIMES model used in this analysis has a time horizon of 45 years that ranges from 2005, the base year, to 2050, with a time resolution of four seasons with day-night time resolution, the latter comprising day, night and peak time-slices [26]. Energy demands are driven by a macroeconomic scenario, which is based on the ESRI HERMES macroeconomic model of the economy [32], with key drivers extended to the period 2050. On the supply side, fossil fuel prices are based on IEA’s current policy scenario in World Energy Outlook 2012 report [33]. Given the importance of renewable energy for the achievement of mitigation targets, Ireland’s energy potentials and costs are based on the most recently available data. The domestic bioenergy resources are represented by 12 different commodities. The total resource capacity limit for domestic bioenergy – considering both available and technical potential – has been set at 2,887 ktoe for the year 2030 and at 3,805 ktoe by 2050, based on the estimates from [12], [19], [23], [34], [35]. The potential for each individual commodity is shown in Table 2. The upper capacity limit for other renewable resources such as onshore and offshore wind energy, ocean, hydro, solar and geothermal energy are summarized in [31]. The use of geothermal energy in Ireland is limited only to small installations in the residential and services sector mostly for space and water heating purposes. Because solar and geothermal energy contribute marginally to scenarios outputs, no maximum potentials have been provided in the model.
Bioenergy potential in the Irish TIMES model
Commodity |
2010 |
2020 |
2030 |
2040 |
2050 |
Unit |
|---|---|---|---|---|---|---|
Agricultural residues-dry |
153 |
188 |
188 |
188 |
188 |
[ktoe] |
Maize/wheat |
0 |
42 |
45 |
45 |
45 |
[ktoe] |
Miscanthus crop (Total) |
6 |
36 |
160 |
285 |
353 |
[ktoe] |
Miscanthus crop - RSV 1 |
6 |
36 |
89 |
89 |
89 |
[ktoe] |
Miscanthus crop - RSV 2 |
0 |
0 |
22 |
22 |
22 |
[ktoe] |
Miscanthus crop - RSV 3 |
0 |
0 |
0.2 |
0.2 |
0.2 |
[ktoe] |
Miscanthus crop - RSV 4 |
0 |
0 |
37 |
37 |
37 |
[ktoe] |
Miscanthus crop - RSV 5 |
0 |
0 |
7 |
7 |
7 |
[ktoe] |
Miscanthus crop - RSV 6 |
0 |
0 |
3 |
22 |
22 |
[ktoe] |
Miscanthus crop - RSV 7 |
0 |
0 |
0 |
106 |
174 |
[ktoe] |
Willow crop (Total) |
6 |
33 |
143 |
255 |
316 |
[ktoe] |
Willow crop - RSV 1 |
6 |
33 |
79 |
79 |
79 |
[ktoe] |
Willow crop - RSV 2 |
0 |
0 |
8 |
8 |
8 |
[ktoe] |
Willow crop - RSV 3 |
0 |
0 |
12 |
12 |
12 |
[ktoe] |
Willow crop - RSV 4 |
0 |
0 |
20 |
20 |
20 |
[ktoe] |
Willow crop - RSV 5 |
0 |
0 |
25 |
40 |
40 |
[ktoe] |
Willow crop - RSV 6 |
0 |
0 |
0 |
12 |
12 |
[ktoe] |
Willow crop - RSV 7 |
0 |
0 |
0 |
85 |
146 |
[ktoe] |
Forestry residues |
122 |
176 |
212 |
269 |
326 |
[ktoe] |
Biogas from landfill and other |
57 |
57 |
57 |
57 |
57 |
[ktoe] |
Biogas from Grass |
0 |
744 |
1,136 |
1,136 |
1,136 |
[ktoe] |
Municipal waste - BMSW |
142 |
543 |
706 |
869 |
1,031 |
[ktoe] |
Recycled vegetable oil |
0 |
1 |
2 |
2 |
2 |
[ktoe] |
Oil seed rape/algae |
2 |
30 |
41 |
95 |
133 |
[ktoe] |
Agricultural residues - wet |
67 |
78 |
79 |
79 |
79 |
[ktoe] |
Wood processing residues |
75 |
92 |
117 |
115 |
137 |
[ktoe] |
630 |
2,021 |
2,887 |
3,395 |
3,805 |
[ktoe] |
The cost assumptions for domestic bioenergy commodities are based on [36] for biogas from grass, [37] for forestry, [38] for willow and miscanthus crops and delivery costs, and [23] for wheat crops, Oil Seed Rape (OSR) and Recycled Vegetable Oil (RVO). For the remaining commodities, the cost assumptions used in the PET model within the RES2020 project [39] were used. Cost estimates for bioenergy imports are based on [23] international trends. Details are summarized in Table 3. Cost assumptions for bulk renewable energy technologies are based on [40], [41] (for wind energy) and [42] (for solar).
Bioenergy cost assumption (€2000/GJ)
Commodity |
2010 |
2020 |
2030 |
2040 |
2050 |
Unit |
|---|---|---|---|---|---|---|
Agricultural residues-dry |
4.6 |
5.2 |
5.2 |
5.2 |
5.2 |
[€/GJ] |
Maize/wheat |
17.7 |
17.7 |
17.7 |
18.7 |
19.8 |
[€/GJ] |
Miscanthus crop - RSV 1 |
2.8 |
4.4 |
4.8 |
5.1 |
5.4 |
[€/GJ] |
Miscanthus crop - RSV 2 |
3.0 |
4.8 |
5.3 |
5.6 |
5.9 |
[€/GJ] |
Miscanthus crop - RSV 3 |
3.3 |
5.3 |
5.8 |
6.1 |
6.4 |
[€/GJ] |
Miscanthus crop - RSV 4 |
3.6 |
5.7 |
6.3 |
6.6 |
7.0 |
[€/GJ] |
Miscanthus crop - RSV 5 |
3.9 |
6.1 |
6.7 |
7.1 |
7.5 |
[€/GJ] |
Miscanthus crop - RSV 6 |
4.1 |
6.6 |
7.2 |
7.6 |
8.1 |
[€/GJ] |
Miscanthus crop - RSV 7 |
4.4 |
7.0 |
7.7 |
8.1 |
8.6 |
[€/GJ] |
Willow crop - RSV 1 |
4.3 |
6.9 |
7.6 |
8.0 |
8.4 |
[€/GJ] |
Willow crop - RSV 2 |
4.8 |
7.6 |
8.3 |
8.8 |
9.3 |
[€/GJ] |
Willow crop - RSV 3 |
5.2 |
8.3 |
9.1 |
9.6 |
10.1 |
[€/GJ] |
Willow crop - RSV 4 |
5.6 |
8.9 |
9.8 |
10.4 |
11.0 |
[€/GJ] |
Willow crop - RSV 5 |
6.0 |
9.6 |
10.6 |
11.2 |
11.8 |
[€/GJ] |
Willow crop - RSV 6 |
6.5 |
10.3 |
11.4 |
12.0 |
12.7 |
[€/GJ] |
Willow crop - RSV 7 |
6.9 |
11.0 |
12.1 |
12.8 |
13.5 |
[€/GJ] |
Forestry residues |
6.8 |
6.8 |
6.8 |
6.8 |
6.8 |
[€/GJ] |
Biogas from landfill and other |
3.3 |
4.7 |
5.1 |
5.4 |
5.6 |
[€/GJ] |
Biogas from grass |
6.6 |
6.6 |
6.6 |
6.9 |
7.2 |
[€/GJ] |
Municipal waste - BMSW |
0.4 |
0.2 |
0.2 |
0.2 |
0.2 |
[€/GJ] |
Recycled vegetable oil |
5.5 |
5.5 |
5.5 |
5.8 |
6.1 |
[€/GJ] |
Oil seed rape/algae |
23.1 |
23.1 |
23.1 |
23.1 |
23.1 |
[€/GJ] |
Agricultural residues - wet |
0.0 |
0.0 |
0.0 |
0.0 |
0.0 |
[€/GJ] |
Wood processing residues |
1.9 |
1.9 |
1.9 |
1.9 |
1.9 |
[€/GJ] |
Bio ethanol - RSV 1 |
19.0 |
18.0 |
16.2 |
16.2 |
16.2 |
[€/GJ] |
Bio ethanol - RSV 2 |
19.0 |
19.5 |
19.5 |
20.6 |
21.8 |
[€/GJ] |
Bio ethanol - RSV 3 |
19.0 |
21.1 |
24.0 |
25.4 |
26.8 |
[€/GJ] |
Bio ethanol - RSV 4 |
19.0 |
23.2 |
29.4 |
31.0 |
32.7 |
[€/GJ] |
Biodiesel - RSV 1 |
26.6 |
30.6 |
28.9 |
28.9 |
28.9 |
[€/GJ] |
Biodiesel - RSV 2 |
26.6 |
33.0 |
34.1 |
36.0 |
38.0 |
[€/GJ] |
Biodiesel - RSV 3 |
26.6 |
35.3 |
40.3 |
42.6 |
45.0 |
[€/GJ] |
Biodiesel - RSV 4 |
26.6 |
38.6 |
48.7 |
51.4 |
54.3 |
[€/GJ] |
Wood pellets - RSV 1 |
11.0 |
6.7 |
5.4 |
5.4 |
5.4 |
[€/GJ] |
Wood pellets - RSV 2 |
11.0 |
7.1 |
6.2 |
6.2 |
6.2 |
[€/GJ] |
Wood pellets - RSV 3 |
11.0 |
7.9 |
6.9 |
6.9 |
6.9 |
[€/GJ] |
Wood pellets - RSV 4 |
11.0 |
8.5 |
7.9 |
7.9 |
7.9 |
[€/GJ] |
Bio rape seed |
31.1 |
33.3 |
35.6 |
37.8 |
40.0 |
[€/GJ] |
Wood chip - RSV 1 |
5.4 |
3.3 |
2.7 |
2.7 |
2.7 |
[€/GJ] |
Wood chip - RSV 2 |
5.4 |
3.5 |
3.0 |
3.0 |
3.0 |
[€/GJ] |
Wood chip - RSV 3 |
5.4 |
3.9 |
3.4 |
3.4 |
3.4 |
[€/GJ] |
Wood chip - RSV 4 |
5.4 |
4.2 |
3.9 |
3.9 |
3.9 |
[€/GJ] |
Based on work undertaken by Ireland’s transmission system operator EirGrid [43], the level of intermittent (non-dispatchable) renewable generation – namely wind, solar and ocean energy – is limited here to a maximum share of 70% of electricity generation within each timeslice and to 50% at annual level to account for operational issues associated with such high levels of variable generation in the power system. Regarding policies, investment subsidies and feed-in-tariffs for renewables based on policies currently in practice are assumed here to continue until 2030 and no trading of green certificates is assumed. The installation of new coal power plant capacities are limited to the replacement of current capacity levels, while for wind a maximum installation rate is set at 750 MW per year. Additional information regarding the main input assumptions may be found online at
In this analysis we do not model non energy-related emissions associated with agriculture but rather take projections from other sources and use them to exogenously establish the target for the energy system. Set against this backdrop, this paper makes a simple assumption regarding GHG emissions in agriculture, namely that agriculture emissions in 2020–2050 are the same as current national projections (+1% relative to 1990) [44] for 2020. This anticipates growth in agricultural activity in conjunction with the implementation of some level of mitigation.
In this paper results for four distinct scenarios are presented to explore the role of bioenergy in Ireland’s low carbon future. The main scenarios assumptions are listed below:
Business as Usual (BaU) scenario: it delivers energy system demands at least cost in the absence of emissions reduction targets and efficiency improvements. It is used as a reference case (counterfactual) against which to compare three the distinct mitigation scenarios;
CO2-80 scenario: the energy system is required to achieve at least an 80% CO2 emissions reduction below 1990 levels by 2050 (−85.7% relative to 2005). The pathway includes interim targets in line § with the EU 2020 climate energy package [4], [5], i.e. 20% CO2 emissions reduction by 2020 relative to 2005 levels. Agriculture GHG emissions are implicitly assumed to grow by 4% in the period 2005-2020 [44], while over the period 2020-2050 are assumed constant;
CO2-80 SC scenario: it delivers the same emissions reduction pathway than CO2-80 scenario, but it simulates how shortages on imported bioenergy commodities consequent with the introduction of the Sustainability Criteria (SC) of the EU Renewable Energy Directive may affect the energy system choices. To simulate the maximum levels of available imported bioenergy, which meet SC requirements, we refer to analysis in Clancy et al. [23]. Assuming a global context of high bioenergy demand driven by the introduction of mitigation targets in several countries, the “Medium supply/High demand” scenario has been used as main reference for the period 2010–2030, as shown in Table 4**.
CO2-80 DR scenario: it delivers the same emissions reduction pathway than CO2-80 scenario, but it simulates an energy scenario where, given the growing concerns over sustainability and impacts in terms of Direct and Indirect Land Use Change (DLUC and ILUC) of most of the imported bioenergy crops, the mitigation targets may be achieved only by mean of Domestic Resources (DR), meaning that no bioenergy imports are allowed beyond 2020.
Imported bioenergy potential in CO2-80 SC scenario
Description |
2010 |
2020 |
2030 |
2040 |
2050 |
Unit |
|---|---|---|---|---|---|---|
Bio ethanol |
781.3 |
409.4 |
1,404.1 |
1,460.8 |
1,519.9 |
[ktoe] |
Biodiesel |
101.5 |
0.0 |
109.9 |
114.4 |
119.0 |
[ktoe] |
Wood pellets |
22.9 |
0.0 |
427.1 |
444.4 |
462.4 |
[ktoe] |
Wood chip |
7.6 |
0.0 |
142.4 |
148.1 |
154.1 |
[ktoe] |
The main scenarios assumptions are summarized in Table 5.
Summary of scenario assumptions
Scenario |
Mitigation target |
Bioenergy imports |
||||
|---|---|---|---|---|---|---|
2020 |
2030 |
2050 |
2020 |
2030 |
2050 |
|
BaU |
No |
No |
No |
Yes |
Yes |
Yes |
CO2-80 |
−20.4% GHG (−30.4% CO2) rel. 2005 |
−20% GHG (−32% CO2) rel. 1990 |
−52.4% GHG (−80% CO2) rel. 1990 |
Yes |
Yes |
Yes |
CO2-80 SC |
−20.4% GHG (−30.4% CO2) rel. 2005 |
−20% GHG (−32% CO2) rel. 1990 |
−52.4% GHG (−80% CO2) rel. 1990 |
Limited |
Limited |
Limited |
CO2-80 DR |
−20.4% GHG (−30.4% CO2) rel. 2005 |
−20% GHG (−32% CO2) rel. 1990 |
−52.4% GHG (−80% CO2) rel. 1990 |
No |
No |
No |
This section provides a range of energy system configurations for Ireland that each deliver projected energy service demand requirements optimised to least cost and subject to different policy constraints for the time period out to 2050. This provides a means of testing energy policy choices and scenarios and assesses the implications for the Irish economy and energy system. This results section is structured as follows. Firstly pathways are presented and discussed. Secondly the BaU scenario is compared against the CO2-80 scenario focusing in particular on the role of bioenergy. This section further discusses implications for the energy system of reduced availability of sustainable bioenergy for international trade, assessing how this results in terms of capacity of delivering deep emissions reductions. This is followed by a discussion on how these future low carbon economies may result on Irelands import dependency and land usage. Lastly it discusses economic impacts of energy futures in term of CO2 marginal abatement costs.
The total GHG emissions pathways for the four policy scenarios are shown in Figure 3.
Total GHG emissions trajectories by scenario (Mt CO2,eq)
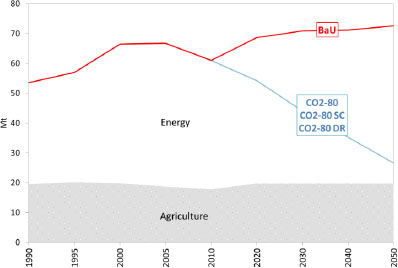
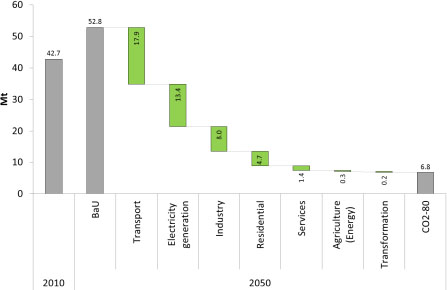
This section firstly presents the CO2 emissions for the resultant energy systems from the BaU and 80% CO2 emissions reduction scenario (CO2-80) for the period to 2050. The results show radically different futures. In the absence of emissions mitigation (see Figure 4), the BaU scenario shows the energy system emissions at approximately 53 Mt CO2 in 2050, representing a growth of 24% relative to 2010 (or 55% growth relative to 1990). By contrast, an 80% CO2 reduction target means effectively reducing by 87% the projected BaU emissions. In the CO2-80 scenario the greatest reduction in emissions relative to 2010 is in the transport sector (from 19.6 Mt to 1.7 Mt) followed then by electricity generation (from 14.3 Mt to 0.9 Mt).
Incremental change in CO2 emission required by each sector in CO2-80 relative BaU scenario and 2010 (Mt)
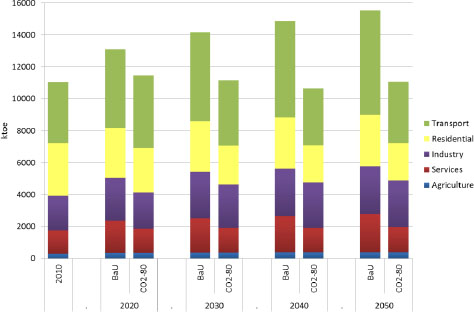
The evolution of Total Final Consumption (TFC) of energy by sector in BaU and CO2-80 scenarios is presented in Figure 5. Changes in final energy consumption are driven by economic activity (which affects energy service demands), the type of end use energy (including electricity) and the efficiencies of end-use technologies, in addition to consumer response to changing energy prices and to policy measures. There is currently no feedback between the Irish TIMES scenario results and the economy and hence in all scenarios, economic growth (measured in terms of GDP) follows the same trend, growing by 1.9% per annum on average over the period 2010–2050. TFC grows by 0.9% p.a. in the BaU scenario and remain stable (+0.002% p.a.) in the CO2-80 scenario, illustrating the increased decoupling between economic growth and emissions growth.
Table 6 and Figure 5 summarize the primary energy requirements in these alternative energy futures. The projected primary energy consumption in the BaU suggests future trends very similar to current, i.e. substantial reliance on oil and gas with a small share for renewables. The CO2-80 scenario shows a drop in reliance on oil from 2030, coupled with a renewables (wind and bioenergy) expansion. By 2050 liquid biofuels and biogas are extensively used in transport (51%-55% of transport TFC), while biomass is largely used in industry (63% of industry TFC) and buildings (26% of buildings TFC). Coal has all but disappeared from the domestic energy system except for use in industry in combination with CCS technology. Wind energy and natural gas in combination with CCS technology provide an impetus for the electrification of private cars and rail in the transport sector.
Primary energy trends for BaU, CO2-80 (ktoe)
BaU |
CO2-80 |
||||||
|---|---|---|---|---|---|---|---|
2010 |
2020 |
2030 |
2050 |
2020 |
2030 |
2050 |
|
Fossil Fuels (total) |
14,436 |
17,211 |
18,384 |
19,406 |
13,507 |
11,225 |
7,859 |
Coal and peat |
2,031 |
2,325 |
2,008 |
1,436 |
715 |
456 |
506 |
Oil (incl. int. aviation) |
7,713 |
9,807 |
10,499 |
11,395 |
7,917 |
6,464 |
3,055 |
Oil (excl. int. aviation) |
6,939 |
8,484 |
9,082 |
9,871 |
6,594 |
5,047 |
1,530 |
Natural gas |
4,692 |
5,078 |
5,878 |
6,575 |
4,875 |
4,305 |
4,298 |
Renewables (total) |
761 |
1,347 |
1,530 |
1,863 |
1,466 |
4,525 |
11,286 |
Hydro |
52 |
45 |
45 |
43 |
88 |
93 |
104 |
Wind |
242 |
545 |
545 |
545 |
662 |
1,334 |
1,651 |
Biomass |
211 |
552 |
641 |
828 |
415 |
1,489 |
3,071 |
(of which imported) |
11 |
3 |
38 |
117 |
58 |
877 |
1,873 |
Bioliquids |
93 |
73 |
120 |
96 |
102 |
352 |
1,751 |
(of which imported) |
71 |
71 |
77 |
93 |
71 |
309 |
1,615 |
Biogas |
58 |
57 |
57 |
57 |
57 |
57 |
1,193 |
Other renewables |
24 |
0 |
6 |
82 |
12 |
13 |
28 |
Electricity imports (net) |
40 |
0 |
55 |
119 |
170 |
170 |
170 |
Total |
15,238 |
18,558 |
19,969 |
21,388 |
15,143 |
15,921 |
19,315 |
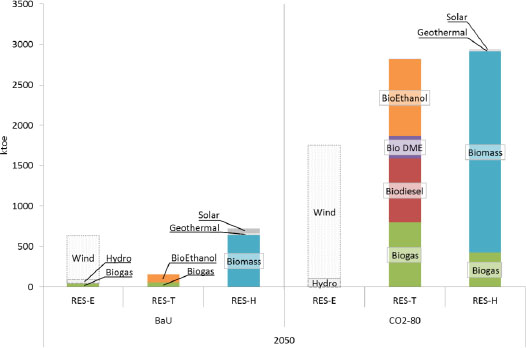
Focussing on renewable energy and in particular on bioenergy Figure 6 details the modal results for renewable heat (RES-H), transport (RES-T) and electricity (RES-E) from the energy system cost optimal analysis for the BaU scenario and the CO2-80 scenario. The coloured areas represent bioenergy commodities, while grey pattern bars represent other renewables. In the BaU scenario bioenergy consumptions are dominated by biomass, with 642 ktoe in RES-H while bioethanol dominates in the transport sector (93 ktoe). In the RES-E 46 ktoe are delivered by biogas generation. In the CO2-80 scenario growth of bioenergy consumptions are mainly delivered in the heating sector, where biomass consumption results 2,500 ktoe by 2050 and transport; and transport, which shows an steep increase of biofuel consumption, delivered by bioethanol (33.7%), biogas (28.2%) and biodiesel (28.0%). No bioenergy is hence consumed in the electricity generation sector, dominated by wind generation (94.1% of renewable electricity). In this scenario (CO2-80), renewables account for 61.8% of Gross Fuel Consumption (GFC)†† by 2050, in which biofuels deliver for 81.4% of transport GFC‡‡ and 61.4% of thermal GFC.
Final energy demand by sector in REF and CO2-80 (ktoe)
Bioenergy consumption by mode in BaU and CO2-80 (ktoe)
This section discusses the sustainability of low carbon future pathways, in particular how the ability of the energy system of delivering deep reductions in emissions levels given the sustainability implications of bioenergy imports. The CO2-80 results are compared with results from the CO2-80 SC scenario (which limits imported bioenergy commodities due to the Sustainability Criteria (SC) of the EU Renewable Energy Directive) and the CO2-80 DR scenario (in which mitigation targets may be achieved only by mean of Domestic Resources (DR)).
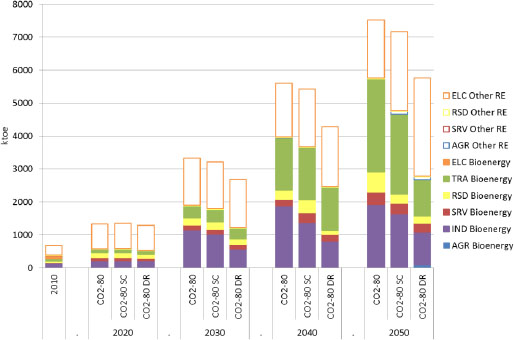
Figure 7, which compares bioenergy and other renewables consumption by sector§§ for CO2-80, CO2-80 SC and CO2-80 DR, shows that restrictions in biofuels and biomass imports have only limited impact on the short term (2020) but may have a larger impact on over the longer term. Reductions in bioenergy levels are only partially replaced with domestic bioenergy resources and other renewable sources (mostly from the power sector).
Bioenergy and other renewables consumption by sector in CO2-80, CO2-80 SC and CO2-80 DR (ktoe)
Results for the CO2-80 SC scenario indicate that since 2030 bioenergy consumption reduces in all end-use sectors (by about 6% in 2030 and by 19% in 2050 relative to the CO2-80 scenario) while renewable electricity grows (+36% by 2050 relative to CO2-80). Figure 8 shows that in the transport sector the drop in biodiesel imports are only partially balanced by higher domestic biogas production (from grass) (+21%) and increased imports of ethanol (+32%). With respect to heating, electricity displaces biomass and biogas (-20% and -38%) in the heating sectors.
Bioenergy consumption by mode in CO2-80, CO2-80 SC and CO2-80 DR (ktoe)
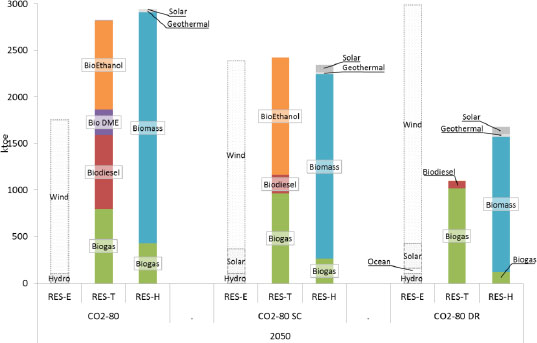
The CO2-80 DR shows a similar pattern, but with steeper reduction trends in bioenergy consumption. By 2030 the reduction in bioenergy consumption is 36% lower relative to the unconstrained case (CO2-80) and passes to 53% in 2050. The heating sectors moves further from bioenergy (−42% in 2030 and −45% in 2050) to electricity (+2.5% in 2030 and +76% in 2050) which shows increased levels of renewable generation (+2.4% in 2030 and +70% in 2050 from onshore and offshore wind, solar and some ocean energy). The transport sector (freight and public transport) from 2030 transitions from bioliquids to biogas, while in 2050 about 40% of freight fleet consumes hydrogen (from gasification of coal with CCS).
The results (shown in Table 7) moreover indicate that drops on bioenergy imports cause reductions of the renewable shares (measured as share of total gross energy consumption)***, which are driven by reduced bioenergy consumptions in transport and heating sectors (where biomass and biofuels are the dominant renewable sources). These limitations do not influence the share in the electricity generation sector, where it indeed grows. By contrast, the reduced bioenergy availability forces the model to adopt deeper efficiency measures causing an increase in end-use efficiency in transport, residential and services sectors.
Renewable share and energy efficiency for CO2-80, CO2-80 SC and CO2-80 DR
CO2-80 |
CO2-80 SC |
CO2-80 DR |
||||
|---|---|---|---|---|---|---|
2030 |
2050 |
2030 |
2050 |
2030 |
2050 |
|
Renewable share |
25.4% |
54.8% |
24.7% |
52.2% |
21.1% |
43.6% |
of which RES-H |
11.7% |
21.2% |
10.9% |
17.3% |
7.0% |
12.7% |
of which RES-E |
11.0% |
13.0% |
10.9% |
17.6% |
11.4% |
22.6% |
of which RES-T |
2.9% |
20.9% |
3.0% |
17.8% |
2.6% |
8.3% |
Energy savings |
−21.3% |
−28.7% |
−22.0% |
−29.2% |
−23.3% |
−32.9% |
As third consequence, the results highlight (Table 8) an increase in electricity importance for the end-use sectors. By 2050 electricity grows by 35% (CO2-80 SC) and 67% (CO2-80 DR) respectively relative to the CO2-80 case; and become the most important energy vector for meeting heat demand. The electricity generation fuel mix to meet this increased electricity demand is summarized in Figure 9.
Share of energy use in end-use sectors for CO2-80, CO2-80 SC and CO2-80 DR
CO2-80 |
CO2-80 SC |
CO2-80 DR |
||||
|---|---|---|---|---|---|---|
2030 |
2050 |
2030 |
2050 |
2030 |
2050 |
|
Fossil fuels/TFC |
64.3% |
30.5% |
65.0% |
28.6% |
68.3% |
33.1% |
Renewables/TFC |
14.9% |
44.5% |
14.2% |
37.4% |
9.9% |
23.1% |
Electricity/TFC |
20.8% |
25.0% |
20.8% |
34.0% |
21.8% |
43.8% |
of thermal TFC |
33.3% |
35.5% |
33.2% |
52.2% |
35.1% |
65.9% |
of transport TFC |
4.9% |
11.0% |
5.2% |
11.0% |
5.3% |
12.3% |
Electricity generation by fuel in CO2-80, CO2-80 SC and CO2-80 DR
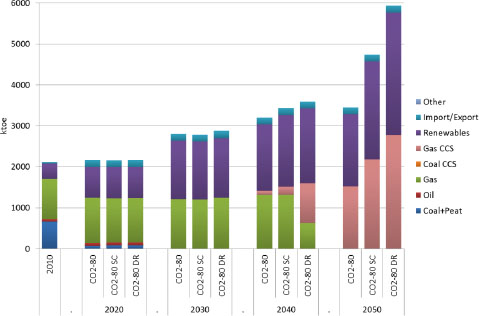
Table 9 highlights the implications of these different mitigation scenarios on another key policy issue, energy security. The analysis here is limited to import dependency, which is a crude and limited metric by which to assess energy security. More details on implications for Ireland’s energy security are assessed in a separate analysis [45]. Focussing first on primary energy import dependency, the results show that the import dependency in the business as usual scenario grows to approximately 93% in 2050, while across the mitigation scenarios reducing trends are shown. Bioenergy contributes in this reduction resulting in all scenarios with lower import dependency indices compared to overall primary energy levels.
Primary energy and bioenergy import dependency
Scenario |
2010 |
2020 |
2030 |
2040 |
2050 |
|
|---|---|---|---|---|---|---|
Primary energy |
BaU |
86.0% |
86.8% |
87.9% |
91.4% |
92.9% |
CO2-80 |
86.0% |
85.9% |
81.3% |
78.3% |
72.4% |
|
CO2-80 SC |
86.0% |
85.1% |
79.6% |
71.4% |
67.5% |
|
CO2-80 DR |
86.0% |
84.9% |
76.9% |
68.9% |
65.0% |
|
Bioenergy |
BaU |
32.6% |
10.9% |
14.1% |
16.6% |
21.5% |
CO2-80 |
32.6% |
22.4% |
62.5% |
68.6% |
58.0% |
|
CO2-80 SC |
32.6% |
13.7% |
47.3% |
41.9% |
41.3% |
|
CO2-80 DR |
32.6% |
0.0% |
0.0% |
0.0% |
0.0% |
The potential growth of bioenergy raises a number of concerns relating to land depletion and implications with one of Ireland’s most important economic sectors: the agri-food sector. These concerns have also been highlighted recently in [24] which shows that the EU Agricultural Policy (Cross Compliance) [46], [47] does not accept that pasture (currently 4 Mha in Ireland) can be ploughed to generate arable land for biofuel production. Ireland is not self-sufficient in grains [19] and as such there would be intense competition for a grain ethanol industry with the likelihood that ethanol production in Ireland would be based on imported grains or at least necessitate import of more grain [24].
This section therefore presents a first attempt on quantifying this impact, presenting modelling results, not only in terms of energy flows or emissions, but also in terms of land consumption. The conversion factors of each individual commodity (Table 10) are drawn from [24], [48], [49]. Crop rotation levels determine the ratio between required and contracted land.
Bioenergy conversion factors
Commodity |
Conversion factor [ha/ktoe] |
Rotation |
Reference |
|---|---|---|---|
Willow |
253.0 |
1 in 2 |
[48] |
Miscanthus |
268.3 |
1 in 1 |
[48] |
Rape seed biodiesel |
910.2 |
1 in 5 |
[49] |
Palm oil biodiesel |
348.9 |
1 in 1 |
[49] |
Wheat ethanol |
634.4 |
2 in 3 |
[49] |
Optimized wheat ethanol |
498.4 |
2 in 3 |
[49] |
Grass biomethane |
263.4 |
1 in 1 |
[24] |
Table 11 summarizes energy crops (including grass) consumptions in the different scenarios converted into land units, namely hectares. Regarding imported commodities, the model does not distinguish between different import locations nor different feedstock crops and hence the following assumptions were made to complete this analysis:
Imported bioethanol is assumed to originate from optimized wheat crops;
Biodiesel originates from palm oil;
Woody biomass originates from miscanthus crops.
Land required (contracted) for domestic and imported energy crops in 2030 and 2050
Unit: [kha] |
BaU |
CO2-80 |
CO2-80 SC |
CO2-80 DR |
|||||
|---|---|---|---|---|---|---|---|---|---|
2030 |
2050 |
2030 |
2050 |
2030 |
2050 |
2030 |
2050 |
||
Domestic |
Willow |
0 |
0 |
40 |
44 |
50 |
160 |
73 |
160 |
Miscanthus |
30 |
30 |
43 |
95 |
43 |
95 |
43 |
95 |
|
Grass biomethane |
0 |
0 |
0 |
299 |
0 |
299 |
63 |
299 |
|
Wheat ethanol |
0 |
0 |
0 |
0 |
0 |
0 |
0 |
8 |
|
Rape seed biodiesel |
148 |
0 |
148 |
148 |
148 |
148 |
148 |
148 |
|
TOTAL |
178 |
30 |
231 |
586 |
241 |
702 |
326 |
710 |
|
Imported |
Wheat ethanol |
58 |
70 |
213 |
677 |
222 |
894 |
0 |
0 |
Palm oil biodiesel |
0 |
0 |
8 |
247 |
8 |
42 |
0 |
0 |
|
Wood chip††† |
10 |
31 |
229 |
229 |
36 |
40 |
0 |
0 |
|
Wood pellets‡‡‡ |
0 |
0 |
0 |
260 |
102 |
121 |
0 |
0 |
|
TOTAL |
68 |
100 |
450 |
1,413 |
368 |
1,096 |
0 |
0 |
|
[%] of agri land |
Domestic |
4.2 |
0.7 |
5.4 |
13.7 |
5.7 |
16.5 |
7.6 |
16.7 |
Imported |
1.6 |
2.4 |
10.7 |
33.6 |
8.8 |
26.1 |
0 |
0 |
|
Given the total of Ireland’s agriculture land is 4.3 Mha [49], the required land for domestic energy crops in 2030 ranges from 1.4% (in BaU) to 4% (in CO2-80 DR) and by 2050 between 0.7% (in BaU) and 11.9% (in CO2-80 DR) of total agriculture land. Given crop rotation this translates into values shown in Table 11. Equally bioenergy imports by 2050 require the equivalent of 1.8% (BaU) to 28.3% (CO2-80) of current agricultural land.
Currently tillage accounts only for about 0.4 Mha, while the remaining 3.9 Mha are under pasture grassland. Mitigation scenarios therefore indicate that by 2050 to produce methane from grass would require the equivalent of 8% of current grassland area. Energy crops in total (willow, miscanthus, wheat and rapeseed) would require an equivalent between 64% (CO2-80) and 73% (CO2-80 DR) of today’s arable land contracted by 2030 and between 79% and 113% by 2050.
However research in [50] has highlighted that practices such as increasing nitrogen (N) fertiliser input (to the limit permitted by the EU Nitrates Directive) combined with increasing the grazed grass utilisation rate may in future significantly increase the grass resource available in excess of livestock requirements (from 1.7 million t of dry matter (DM) to 12.2 million t DM/annum), limiting the competition with traditional dairy, beef and lamb production systems (reduction in required land for energy uses) and providing an alternative enterprise and income to farmers. This will potentially reduce land use competition by making more land readily available for grass as a feedstock for biomethane production.
One of the main insights that can be gained from the use of energy systems models such as TIMES is from quantifying the impact of different mitigation targets on marginal CO2 abatement costs, which provide an indication of the costs of abating the last tonne of CO2 and can be used as a proxy for indicating the level of carbon tax that may be required to reach a certain level of mitigation.
Table 12 summarises the marginal CO2 abatement costs for the mitigation scenarios presented in this paper. The CO2-80 SC scenario indicates as early as 2030, higher CO2 abatement prices due to insufficient availability of bioenergy resources. By 2050 this difference becomes steeper, illustrating how bioenergy imports influences the achievement of this challenging mitigation targets. Similarly the CO2-80 DR scenario shows that limitations in import options may forces the energy system to invest in expensive abatement technologies (e.g. hydrogen) which drives the marginal abatement costs at values even higher than the CO2-80 SC case.
CO2 marginal abatement cost (€2010/tonne)
Scenario |
2020 |
2030 |
2040 |
2050 |
|
|---|---|---|---|---|---|
CO2-80 |
74 |
98 |
312 |
395 |
[€/tonne] |
CO2-80 SC |
74 |
110 |
380 |
1,389 |
[€/tonne] |
CO2-80 DR |
74 |
259 |
387 |
1,747 |
[€/tonne] |
Transitioning to a low carbon economy to mitigate climate change represents globally one of the most challenging policy targets for the future years. The EU has set this ambition implementing policy targets for the year 2020 and aiming to achieve reductions between 80% and 95% relative to 1990 levels by 2050. The paper has a specific focus on bioenergy, which the results suggest are likely to be the most significant fuel source for the future low carbon economy. There are several concerns however regarding sustainability of these energy sources. The paper shown that application of sustainability criteria in international markets – for example as in the EU Renewable Energy Directive – may cause restrictions in bioenergy supply (mostly biodiesel), which can strongly influence the ability of Ireland energy system to deliver GHG emissions reductions. With constraints on imports, bioenergy contributions are significantly reduced, mainly within the transport sector, with consequent increases in electrification – based on gas CCS and renewables (wind, solar and also ocean) – end-use efficiency and hydrogen. Marginal CO2 abatement costs rise sharply in accordance with the level of import restrictions.
This paper also sheds light on some of the implications for energy security. The energy import dependency in Ireland is anticipated to be reduced significantly in all the mitigation scenarios considered. Variable renewable energies – namely wind, solar and ocean – are the main drivers of this reduction, but also bioenergy positively contributes with at least 40% domestic consumption.
Finally the results point to the implications of bioenergy in terms of land usage. Domestically bioenergy passes from approximately 5,000 ha of land contracted in 2010, to about 710,000 ha by 2050 (in the CO2-80 DR scenario), equivalent to 17% of total agricultural land area. This may have serious implications for the food supply which should be addressed in future. Further research work is required to improve the integrated modelling of both the energy and agriculture systems in order to provide richer insights to the strategy between energy, food and climate mitigation.
Carbon Dioxide Equivalent
Carbon Dioxide
European Commission
European Environment Agency
Electricity Generation Sector
Environmental Protection Agency
Emissions Trading Scheme
Energy Technology Systems Analys
European Union
Gross Domestic Product
Gross Final Energy Consumption
Greenhouse Gases
Hectare
International Energy Agency
Industry Sector
Non-Emission Trading Sectors
Residential Sector
Renewables in the Electricity Sector
Renewables in the Heating Sector
Renewables in the Transport Sector
Services Sector
Total Final Consumption
Transport Sector
- ,
Report of the Conference of the Parties on its Fifteenth Session, held in Copenhagen from 7 to 19 December 2009. ,Decisions adopted by the Conference of the Parties , 2009https://unfccc.int/documentation/documents/advanced_search/items/6911.php?priref=600005735#beg, [Accessed: October-2013] - , Climate Change 2014: Mitigation of Climate Change. Working Group III Contribution to the Fifth Assessment Report of the IPCC2014
- ,
Redrawing the Energy-Climate Map , http://www.worldenergyoutlook.org/energyclimatemap/, [Accessed: August-2013] - ,
DIRECTIVE 2009/29/EC the European Parliament and of the Council of 23 April 2009 amending Directive 2003/87/EC so as to improve and extend the Greenhouse Gas Emission Allowance Trading Scheme of the Community, European Parliament and Council, Editor 2009 ,Official Journal of the European Union , 25 - ,
DECISION No 406/2009/EC of the European Parliament and of the Council of 23 April 2009 on the effort of Member States to reduce their Greenhouse Gas Emissions to meet the Community’s Greenhouse Gas Emission reduction Commitments up to 2020, European Parliament and Council ,Official Journal of the European Union , 132009 - ,
DIRECTIVE 2009/28/EC of the European Parliament and of the Council (EC) of 23 April 2009 on the Promotion of the use of Energy from Renewable Sources and Amending and Subsequently Repealing Directives 2001/77/EC and 2003/30/EC , http://www.energy.eu/directives/pro-re.pdf - ,
DIRECTIVE 2006/32/EC of the European Parliament and of the Council of 5 April 2006 on Energy end-use Efficiency and Energy Services and repealing Council Directive 93/76/EEC, European Parliament and Council ,Official Journal of the European Union , 222006 - ,
15 final, A Policy Framework for Climate and Energy in the Period from 2020 to 2030, Communication from the Commission to the European Parliament, the Council, the European Economic and Social Committee and the Committee of the Regions , http://ec.europa.eu/clima/policies/2030/docs/com_2014_15_en.pdf - , A Roadmap for moving to a Competitive Low Carbon Economy in 2050, Communication from the Commission to the European Parliament, the Council, the European Economic and Social Committee and the Committee of the Regions, European Commission, Editor, 2011
- ,
885 Final, Energy Roadmap 2050, Communication from the Commission to the European Parliament, the Council, the European Economic and Social Committee and the Committee of the Regions , http://eur-lex.europa.eu/LexUriServ/LexUriServ.do?uri=COM:2011:0885:FIN:EN:PDF - ,
144 Final, Roadmap to a Single European Transport Area - Towards a Competitive and Resource Efficient Transport System , http://eur-lex.europa.eu/LexUriServ/LexUriServ.do?uri=COM:2011:0144:FIN:EN:PDF - , Energy in Ireland 1990-2011Report, Report published by Sustainable Energy Authority of Ireland, 20122012
- , Oil Information, 2012
- , Natural Gas Information, 2012
- ,
Annual European Union Greenhouse Gas Inventory 1990-2011 and Inventory Report 2013 ,Submission to the UNFCCC Secretariat , http://www.eea.europa.eu/data-and-maps/data/data-viewers/greenhouse-gases-viewer - ,
Database of Area Farmed in June by Region, Type of Land Use and Year , http://www.cso.ie/px/pxeirestat/Statire/SelectVarVal/Define.asp?MainTable=AQA05&TabStrip=Select&PLanguage=0&FF=1, http://dataservice.eea.europa.eu/PivotApp/pivot.aspx?pivotid=475, [Accessed: October-2013] - , A Marginal Abatement Cost Curve for Irish Agriculture, Teagasc Submission to the National Climate Policy Development Consultation, 2012
- ,
Modelling the Impacts of Challenging 2020 non-ETS GHG Emissions reduction Targets on Ireland's Energy System ,Energy Policy , Vol. Vol. 62 (No. 0,), :1438-14522013, https://doi.org/10.1016/j.enpol.2013.07.129 - ,
Can we meet Targets for Biofuels and Renewable Energy in Transport given the Constraints imposed by Policy in Agriculture and Energy? ,Journal of Cleaner Production , Vol. Vol. 18 (No. 16-17), :1671-16852010, https://doi.org/10.1016/j.jclepro.2010.06.027 - ,
Good or Bad Bioethanol from a Greenhouse Gas Perspective - What determines this?, Applied Energy, , Vol. Vol. 86 (No. 5), :589-594,2009, https://doi.org/10.1016/j.apenergy.2008.11.025 - ,
Biofuels: Environment, Technology and Food Security ,Renewable and Sustainable Energy Reviews , Vol. Vol. 13 (No. 6-7), :1275-12872009, https://doi.org/10.1016/j.rser.2008.08.014 - ,
Is it Better to import Palm Oil from Thailand to produce Biodiesel in Ireland than to Produce Biodiesel from Indigenous Irish Rape Seed? ,Applied Energy , Vol. Vol. 86 (No. 5), :595-6042009, https://doi.org/10.1016/j.apenergy.2008.07.010 - ,
Bioenergy Supply Curves for Ireland 2010 - 2030 ,SEAI & AEA. , 2012 - ,
The Resource of Biomethane, produced via Biological, Thermal and Electrical Routes, as a Transport Biofuel ,Renewable Energy , Vol. Vol. 55 (No. 0), :474-4792013, https://doi.org/10.1016/j.renene.2013.01.012 - ,
UK and Global Bioenergy Resource ,Report to DECC, AEA , 2011 - , Irish TIMES Energy Systems Model, in EPA Climate Change Research Programme 2007-2013, Report Series
- ,
Long-term Energy Models: Principles, Characteristics, Focus, and Limitations ,Wiley Interdisciplinary Reviews: Energy and Environment , Vol. Vol. 2 (No. 2), :158-1772013, https://doi.org/10.1002/wene.62 - ,
Documentation for the TIMES Model, Energy Technology Systems Analysis Programme (ETSAP) , 2005http://www.etsap.org/documentation.asp - ,
Joint Studies for New and Mitigated Energy Systems, Final Report of Annex XI , (2008-2010)2011 - , Global Energy Systems and Common Analyses, Final Report of Annex X, (2005-2008)2008
- ,
Modelling the Impacts of Challenging 2050 European Climate mitigation Targets on Ireland’s Energy System ,Energy Policy , Vol. Vol. 53 (No. 0), :169-1892013, https://doi.org/10.1016/j.enpol.2012.10.045 - , , Medium-Term Review:, 2013-20202013
- , World Energy Outlook, 2012
- ,
, 2010 - , All Ireland Roundwood Production Forecast 2011-2028., COFORD, Department of Agriculture, Fisheries and Food, 2011
- ,
The Effect of Feedstock Cost on Biofuel Cost as Exemplified by Biomethane Production from Grass Silage ,Biofuels Bioproducts and Biorefining , Vol. Vol. 5 (No. 6), :670-6822011 - ,
Harvesting Wood for Energy Cost-effective Woodfuel Supply Chains , http://www.coford.ie/media/coford/content/publications/projectreports/Harvesting_Wo od_low_res_for_web.pdf, in Irish Forestry, 2011, - ,
The Economic Viability of Biomass Crops versus Conventional Agricultural Systems and its Potential Impact on Farm Incomes in Ireland, in 107th EAAE Seminar, Modelling of Agricultural and Rural Development Policies, January 29th-February 1st, Sevilla, Spain, 2008. , - ,
, http://www.cres.gr/res2020/, [Accessed: May-2013] - , Electricity Generation Cost Model - 2011 Update, Revision 1, Prepared for Department of Energy and Climate Change:, 2011
- , Investment and Operation Cost Figures - Generation Portfolio, Survey 2011, 2011
- , Solar PV cost update, Prepared for Department of Energy and Climate Change:, 2012
- ,
All Island TSO facilitation of renewables Studies ,Final Report , http://www.eirgrid.com/renewables/facilitationofrenewables/2010 - ,
Ireland’s Greenhouse Gas Emissions Projections, 2012-2030, Environmental Protection Agency , 2013 - ,
Energy Security Analysis: The Case of Constrained Oil Supply for Ireland ,Energy Policy , Vol. Vol. 66 (No. 0), :312-3252014, https://doi.org/10.1016/j.enpol.2013.11.043 - ,
- ,
- ,
Bioenergy Atlas , http://maps.seai.ie/bioenergy/ - ,
What is the Energy Balance of Grass Biomethane in Ireland and other Temperate Northern European Climates? ,Renewable and Sustainable Energy Reviews , Vol. Vol. 13 (No. 9), :2349-23602009, https://doi.org/10.1016/j.rser.2009.04.003 - ,
How much Grassland Biomass is Available in Ireland in excess of Livestock Requirements? ,Irish Journal of Agricultural and Food Research , Vol. Vol. 52 (No.1), :67-802013