


Climate change is a factor that will have an effect on energy supply although the impact can be both positive and negative. Renewable Energy (RE) sources are closely related to climate conditions and for this reason, according to [1], it can be expected that climate change will affect RE sources more intensively than fossil ones. Examples of factors that will impact RE are changes in temperature, wind patterns, cloudiness and the hydrological cycle. The optimal design of future RE systems will depend on future climate. Past experience of climate (physical) conditions should therefore be used with care when planning future RE systems.
The scale of energy conversion plants (refineries, electricity production facilities, etc.) is usually larger for fossil fuel and nuclear facilities. Hence technical failure, for whatever reason, would have a greater impact for these than for more decentralised RE plants. This factor was a motivation for investigations of interface delamination in wind rotor blades subjected to different mechanical and physical (electricity, temperature, moisture) loadings which in fact is observed as the more frequently catastrophic damage in the wind rotor blades [2].
The failure of energy devices such as wind turbines needs detailed investigations, which has been developed in numerous important studies devoted to the analytical modelling and to numerical one – FEM, BEM, etc. In [3] an extensive literature review on existing analytical models for both single and double-lap adhesive joints has been made to assist the designer to choose the right model for a particular application. The literature review shows that almost all analytical models for adhesively bonded lap joints are two-dimensional. One of them is the shear lag method, which was first applied by Volkerson [4] and Cox [5] and till now is one of the basic methods for studying different type of composites [6]. The shear lag method as an analytical one has its advantages and disadvantages. The bending must be neglected, according to the hypothesis of the method. The proper use of shear lag method depends strongly on the structure under consideration. If the structure works in such a way that bending is negligible, then this method works well. Despite the well known advantages of the shear lag method, its use and applicability to determine the interface delamination under influence of environmental factors for wind turbine blades and for determining the pull-out force for renovation of old buildings is still insufficient.
The numerical modelling by finite element analysis of adhesively bonded joints is reviewed in detail [7], in terms of different kinds of loading, environmental behavior, fatigue loading analysis and dynamic characteristics of the adhesively bonded joints. Various FE models on PZT-structure interaction have been proposed since the 1990s.
The classification of the FE models falls into three categories, namely direct formulation of elements for specific application, utilization of a thermoelastic analogy and the use of commercially available FEA codes incorporated with piezoelectric element formulation. The goal of numerical calculation is directed to develop a FEA-based impedance model for the prediction of structural response resulting from induced strain actuation. Further the impedance model is applied for electrical mechanical impedance technique in order to make a proper identification of the damage. The problem is that for such identification of damage the high-frequency band containing many peak frequencies should be chosen. Moreover a detailed derivation (semi-analytical, where harmonically excited displacement has been computed from FEA) is provided to integrate the shear lag effect into impedance formulation. This confirms the importance of analytical methods for validation and improvements of the numerical calculations.
The interface delamination of a preliminary damaged bi-material structure started with the work of Lemaitre et al. [8] and is of interest for the author’s investigations from 2009 till now. Consequently the elastic-brittle [8] and cohesive interface delamination [9] of bi-material structure under static or dynamic time harmonic loading, piezomonitoring of interface delamination of a bi-material structure [10] and single lap joints at mechanical loading and environmental conditions [11], [12] are considered and the closed form formulae were obtained for respective interface debond lengths. To validate the obtained results for interface debond length the comparison with experimental data [13] as well as with 2D BEM [14], [15] has been done. In both cases the comparison showed good agreement, which confirms the applicability of the closed form analytical formulae for debond length in practice as well as the right choice of the analytical shear lag method. The obtained simple formulae for interface debond lengths make the calculations easier and faster compared to numerical calculations.
The reason to apply this modelling to the wind rotor blade is also prompted by the nature of construction of wind rotor blades, the appearance of damage of type interface delamination, influence of physical conditions on delamination, etc. The blade consists of a regular repetition along the longitudinal direction of bi-material plate (two layers) with different material properties. Hence the blade can be considered as a composition represented by a unit bi-material cell which can be damaged or not. The goal of the modelling of wind rotor blade is to obtain simple analytical formulae for a rapid prognosis using the results for the interface delamination of unit bi-material cell subjected to different mechanical, electric loadings together with temperature and moisture, as well as to propose criterion giving the safety zones when the parametric analysis is done. In the first part of the present paper, which extends the investigations in [16], the new criterion for safety working zone of unit bi-material cell is proposed and applied for new materials used in manufacturing the wind rotor blade.
The authors would like to note that the contribution of all our papers on interface delamination of different bi-material structures with progressive interface delamination under different types of mechanical loading at environmental conditions and their piezo monitoring consists in possible large applications to wind turbine blades, solar system, repairing of constructions, etc. The simple formulae for debond lengths and formulation of acriterion for detecting the debond length via electric gradient and a criterion for safety zones are proposed as well and are new ones in the specialized literature.
The other interesting problem on energy saving constructions is the new materials used in the building industry. This problem will be partially considered in a second part of the present paper. The motivation of such investigations is given bellow.
In connection with EU policies for Energy Efficiency by the end of 2020, all new buildings should comply with the Energy Performance of Buildings Directive obligations and thus meet Nearly Zero Energy (NZE) performance levels using innovative, cost- optimal technologies with integration of renewable energy sources on site or nearby. Although there is no exact definition for Nearly Zero Energy Building (NZEB) [17] until now, some European countries have already standards referring to the quality of the building envelope. The building envelope (or building enclosure) is the “skin” through which the building loses energy. The numerous functions of the building envelope can be separated into three categories:
Support (to resist and transfer mechanical loads);
Control (the flow of matter and energy of all types);
Finish (meeting human desires on the inside and outside) [17], [18].
Some of the new classes of materials for construction, in general, are reinforced with Nano Tubes (NT). They can be applied very successfully as the barriers and to entirely satisfy the mentioned requirements. Moreover, recent research has shown that the incorporation of Carbon Nano Tubes (CNT) in cement is a novel way to improve material mechanical and durability properties. Their high aspect ratios require significantly high energy of crack propagation. On the other hand, having very small diameters, they reduce matrix porosity, and CNT diameters, being close in size to the thickness of the calcium silicate hydrate layers, may show very different bonding mechanisms and reduce the volume of the structural material [19]. These are qualities highly esteemed for the application of CNT/cement composites as reinforcing layers in rehabilitation of old buildings and energy saving. This was the motivation to consider the problem with renovation of old buildings by using new and modern composite materials. The results presented in the second part of the study can find two basic applications. One of them is in relation with new buildings regarding the erection of barriers. We consider in this case a representative unit cell of glass-fabricated element reinforced by CNTs. The second application concerns the rehabilitation of old structures. The representative element is fabricated from Portland cement and CNTs. We perform pull-out analysis in both cases, since this a common analysis of reinforced composite materials for civil engineering. The goal consists in determining the static response of the unit cell and to predict the pull-out force of a nano tube acting along the interface, which is an important factor for the new building material as well as for renovation of old buildings.
The shear lag method has been known from the assumptions proposed in [5] for studying composite materials. The main idea of the shear-lag analysis is the assumption which involves a simplification of in-plane shear stress and decouples the 2-D problem into two 1-D ones. One of the main hypotheses of the shear lag model is that the load is transferred from broken fibres to adjacent ones by the matrix shear force. Hence, the matrix shear force is independent of transverse displacements.
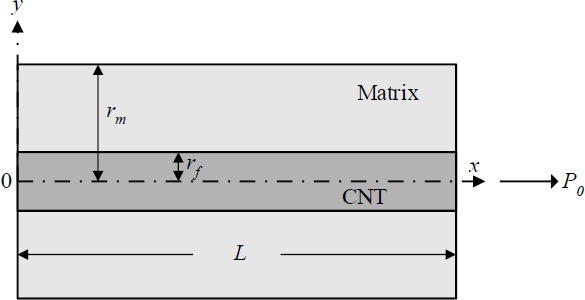
The experiments show that the full degradation of the rotor blade is usually directed along the interface between layers. Since the rotor blade consists of a regular repetition along the longitudinal direction of a bi-material plate with different material properties, the structure can be considered and represented by a unit cell [10]-[16]. The shear lag analysis will be applied to the model of the unit 2-D bi-material cell according to Figure 1, where 2hα(α = A, B), 2l, 2le, T, H indicate the thicknesses of plates A and B, the length of the unit cell, the debonding length, and the temperature and moisture concentration change, respectively. The external mechanical load applied is ε0, while the electric field is given by the electric displacement D0.
Model of the unit cell of bi-material in wind rotor blade
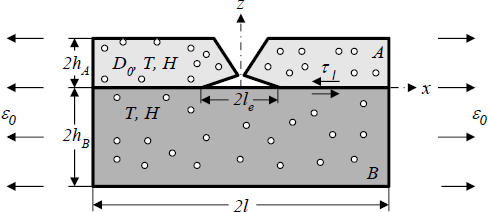
The first plate A is assumed to be transversally isotropic elastic with piezoelectric properties and sensitive to thermal effects, while the second plate B is isotropic, sensitive to thermal and moisture effects. Both plates are connected with a zero thickness isotropic elastic material line (interface I), working only on shear, while both plates work on extension.
According to the shear lag hypothesis the 1-D system of differential equations for the equilibrium of the unit cell is obtained from the 3-D case [16], i.e.:
Mechanical, temperature and moisture boundary as well as contact conditions are:
where σk, εk(k = A, B) are the stresses and strains, τI is the interfacial shear stress, DzA is the electric displacement of plate A .
The integration of the last 2 equations of eq. (1) gives the temperature and moisture in the form:
According to the considered materials of plates A and B, for plate A we have εH = 0, for plate B εpzel = 0. The solution DzA= D0, 0≤x≤l of the third equation of (1) is obtained for the piezoelastic case [15].
The constitutive equations for the plates A and B as well as for the interface I are as follows:
where σk and uk , (k = A, B) are stresses and displacements and EzA is the electric gradient for plate A ; c*ij (i, j = 1,2,3) are transformed from elastic cij constants (measured at constant electric field), e*ij, ε*ij (i, j = 1,2,3) are transformed from piezoelectric and dielectric eij, εij (i, j = 1,2,3) constants (measured at constant strain), α*ij (i, j = 1,2,3) are transformed from thermal stress coefficients αij (i, j = 1,2,3), p*3 is transformed from pyroelectric coefficient p3 for the plate A ; EB,αB, βB are Young’s modulus, thermal and moisture expansion coefficients for plate B and GI is the shear modulus of the interface, respectively. We have to note that the transformation of the coefficients cij, eij, εij, αij, p3 (i, j = 1,2,3) to the respective coefficients denoted by supstars has to be done, because we reduce them from 3-D problem to 1-D [16]. Again, remember that the electric field acts along the axis Oz , while the mechanical load along the axis Ox .
Putting eq. (4) into eq. (1) we get the following system of ordinary differential equations corresponding to the 1-D case with shear lag hypothesis:
together with:
The total hygrothermal piezoelastic stresses for the model (Figure 1) read:
The length of an interfacial debonding is found from the condition that the interface shear stress reaches its failure limit τcr, i.e. τI (le) = τcr. According to [16] we have the following equation to be solved with respect to the debond length le:
The solution of eq. (8) is:
Calculating the coefficient C at constant geometry and combined loading one can vary and choose mechanical and physical properties of the bi-material structure in order to find a more reliable structure with respect to the appearance of an interface delamination. To have the real solution for the debond length the following conditions have to be satisfied: C≥1 and C≤[exp(2λl) +1]/2 exp(λl). On the other side when C = 1, the full degradation of the interface appears, i.e. le = l while if C = [exp(2λl) +1]/ 2exp(λl) there is no delamination along the interface, i.e. le = 0. This criterion can be used for express prognosis of the existence of safety zones and is formulated for a first time.
The geometry, the mechanical and electric loads, the temperatures and moisture concentrations are given as follows: l = 140 mm, hA = 2 mm, hB = 5 mm, ε0 = 0.005 ÷ 0.02, D0 = 0.5 C/m2, T0 = 200 K, T1 = 370 K, H0 = 0.5 (wt.%), H1 = 2.5 (wt.%). The interface is made from polyacrylate glue and is given with GI = 800 MPa and τcr = 18 MPa. The material properties of the plates A (PZT-5H [20]) and B (T300/5208 Carbon/Epoxy – isotropic in y -direction [21]) are given in Table 1.
Properties of the materials
| Characteristics and units | Symbols used | PZT-5H | Carbon/Epoxy T300/5208 |
|---|---|---|---|
| Elastic constants [GPa] | c11 | 126.0 | 10.3 |
| c33 | 117.0 | ||
| c12 | 55.0 | ||
| c13 | 53.0 | ||
| Piezoelectric constants [C/m2] | e31 | -6.5 | |
| e33 | 23.3 | ||
| ε33 | 1.3 | ||
| Pyroelectric coefficients x 10-6 [C/m2K] | p3 | -5.4832 | |
| Thermal stress coefficients x 106 [N/m2K] | α11 | 1.97382 | |
| α33 | 1.4165 | ||
| Thermal expansion coefficient x 10-6 [1/K] | αB | 22.5 | |
| Moisture expansion coefficient [1/wt.%] | βB | 0 | 0.006 |
Bellow, the following cases for material and physical characteristics of the plates A and B are considered and compared:
Case 1: plate A : piezo-elastic, plate B : elastic;
Case 2: plate A : piezo-thermo-elastic, plate B : thermo-elastic;
Case 3: plate A : piezo-thermo-elastic, plate B : hygro-thermo-elastic.
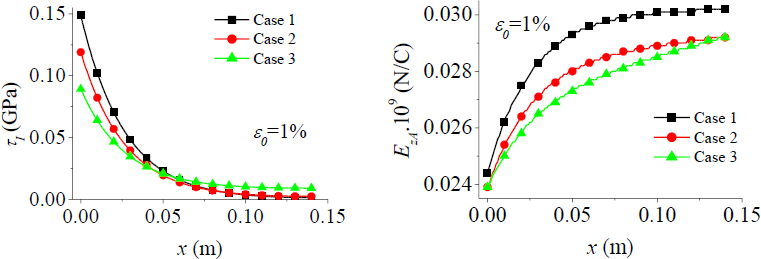
Figure 2 shows the behaviour of the displacements and stresses in the plates A and B along the length of the bi-material unit cell (0 ≤ x ≤ l) at ε0 = 0.01. The presence of temperature (case 2) and temperature and moisture (case 3) significantly decreases the values of the displacements and axial stresses, comparing with the case 1. Figure 3 describes the behaviour of the interface shear stress and electric gradient along the length of the bi-material unit cell (0 ≤ x ≤ l) at ε0 = 0.01. It can be seen, that the presence of thermal and moisture excitation also leads to a reduction of the interface shear stress and electric gradient values.
Displacements and stresses as a function of x (0≤x≤l
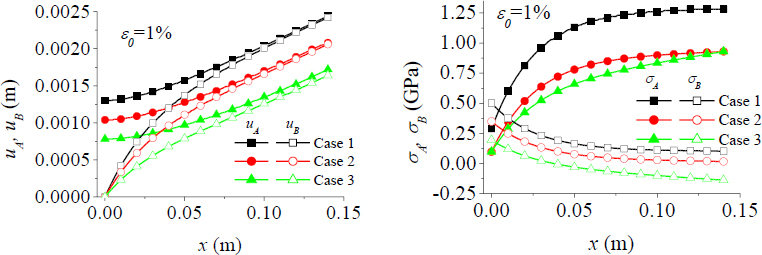
Interface shear stress and electric gradient as a function of x (0 ≤ x ≤ l
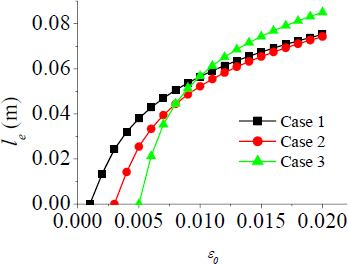
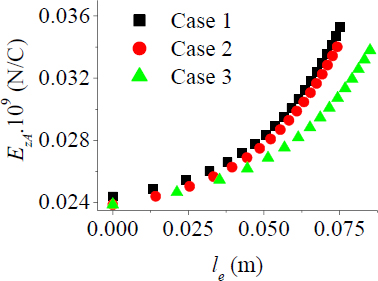
The debond length (Figure 4) grows up with increasing the mechanical load ε0 = 0.005÷0.02 . The presence of temperature (case 2) decreases the values of the debond length, while when the moisture (case 3) is included, it can be observed that for some values of the mechanical load ε0>0.01 the debond length has higher values than for the other two cases (case 1 and case 2).
Behaviour of the debond length for different values of the mechanical load
The indirect dependence of the electric gradient from debond length is shown in Figure 5. A significant influence of the moisture is observed. Its presence (case 3) decreases the values of the electric gradient referred to Cases 1 and 2. Again, as remarked in [16], to the value of the debond length le, the respective value of electric gradient EZA uniquely corresponds. This criterion is very important and gives the possibility to know the value of the debond length by measuring the respective value of the electric gradient. This result can help the experimental work how to find the value of the debond length which is not easy to measure and in fact is a new criterion proposed for this type of modelling in the literature.
Behaviour of the debond length
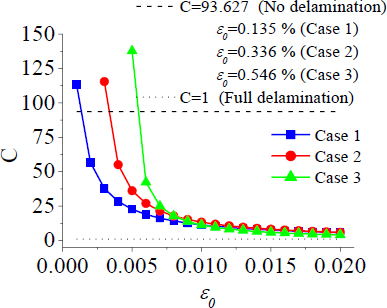
The limit value of the coefficient C (no interface delamination, according to this criterion) was calculated for the materials considered. One can see the behaviour of the coefficient C as a function of ε0 for a considered 3 cases of structures (Figure 6). For a given geometry, material and physical properties the limit value of C = 93.627 (no interface delamination), but at ε0 = 0.135% - for case 1, ε0 = 0.335% - for case 2, ε0 = 0.546% - for case 3. So, the presence of moisture and temperature in the second plate B delays the interface delamination.
Behaviour of the coefficient C
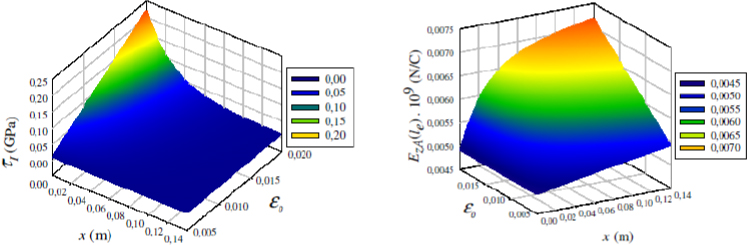
To see better the influence of the mechanical load ε0 and the coordinate x (0 ≤ x ≤ l) 3-D pictures are illustrated in Figure 7. Increasing the value of the mechanical load leads to increasing the values of the interfacial shear stress and electric gradient as a function of the debond length.
3-D behavior of the interfacial shear stress and electric gradient
In this part of the present paper the modelling of the idealized straight line part of a wind rotor blade by an analytical shear lag model is presented in order to analyse and detect the possible interface delamination through the change of the voltage, temperature and moisture. The considered problem is based on the work [16] for the new materials used in manufacturing of wind rotor blade. The rapid prognoses can be made through the new criterion C for possible existence of safety working zones.
The provided numerical calculations for the interface debond length for 3 cases show the strong influence of the presence of moisture, which is very important for the possible full degradation of the interface of the bi-material structure, as well as the strong influence from mechanical and physical properties of the materials taken for the plate B . It is very important as a recommendation for the technology of the construction of rotor blade to choose the proper material for the second plate. On the other hand the presence of a thin layer (plate A ) made from piezoelectric ceramic composite can serve as a sensor layer to detect the interface debond length. Concluding, the optimal choice of the geometry, material properties and loading characteristics is an important factor, which can be easily realized by the analytical method shown in the previous sections (also, see [16] for details).
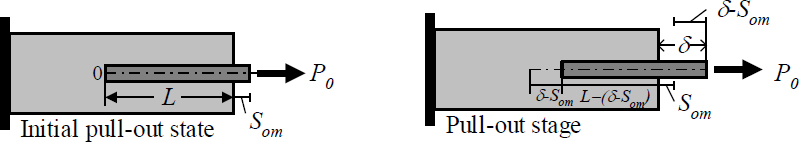
The problem to be analysed refers to a pull-out modelling whereby a tensile load is applied to the tip of a single CNT (with length L ) embedded into a metal or ceramic matrix. A representative unit composite cell is shown in Figure 8. The pull-out analysis is performed considering static P0. The shear-lag assumptions for the linear slip-softening interface model are applied. It is also assumed that both CNT (the term “fibre” will be used hereafter) and the matrix have an elastic behaviour with Young’s modulus Ef,m. The subscripts m, f denote the material and geometric parameters of the corresponding matrix and nanotube. Two main stages develop in the interface region during the entire loading process – slip stage (with partial bonded and debonded parts) and pull-out stage (Figure 9). The model does not take into account the effect of Poisson’s ratio of the matrix, and the fibre is frictionally bonded to the matrix. The relation between interfacial sliding stress (τI ) and interfacial slip displacement (S) gives information about the fibre/matrix interface. The interfacial relative displacement (S) is the relation between the fibre and matrix axial displacements S = uf - um
Representative unit cell
State of the problem
The shear-lag method is applied to the plane partial differential equations and the final form of the respective equilibrium equations reads:
where Af, Am, rf and rm are the cross section areas and radii of the fibre and matrix respectively.
The constitutive equations for the matrix, nanotube and interface are taken as:
where kc is a cohesive parameter.
The contact and boundary conditions of the problem are:
The goal in this part of the study is to determine the static response of the unit cell and to predict the pull-out force of a NT along the interface. Denote by Pmax the maximal value of the nanotube pull-out force (in which the pull-out stage starts) and by Som = S|x=L the relative slip displacement on the interface of the matrix and CNT. The Som value corresponds to the Pmax value.
The pull-out analysis is performed finding the P - S curve. In the pull-out stage the variable Som ≤ δ ≤ L is introduced to find the distribution of the pull-out force vs. given values δi = (L − Som)/i (i = 1,2..n).
Introducing the parameters α = 2/ rf , β = 2rf / (rm2 - rf2, η = AfEf / AmEm,
For slip stage;
For pull-out stage;
The numerical results found using the designed model concern two cases of bimaterial units:
Case 1: CNT/Portland cement composite with Em = 20 GPa, τcr = 12 MPa (for the cement);
Case 2: CNT/BS Glass composite with Em = 74 GPa, τc = 70 MPa (for the BS Glass).
We assume in both cases that, L = 10 ÷ 50 nm, rf = 1 nm, rm = 10 nm, Ef = 1,000 GPa, P0 = 200 nN, kc = 0.1 ÷ 1.0 nN/nm3, Som<δ<L, P = Af σ, Ppullout Af σ0.
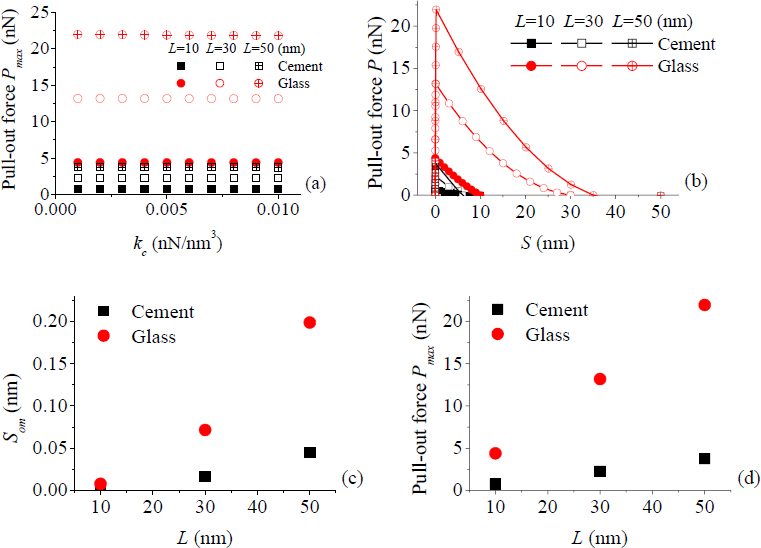
The results in Figure 10 (a) show the dependence of the Pull-out force from the cohesive parameter kc and fibre length. The relation between the Pull-out force and the Relative Slip Displacement (RSD) is presented in Figure 10 (b). Figure 10 (c, d) illustrates the behaviour of RSD at Pmax versus the CNT length, as well as the Pull-out force versus the CNT length. Note that the results in the Figures 10 (b-d) are found for a specified value kc = 2 x 10⁻³ nN/nm3.
Relation between: Pull-out force and kc (a); Pull-out force and RSD (b); Maximum RSD when Pmax occurs and CNT length (c); Pull-out force and CNT length (d)
The pull-out force plays an important role when the hardness of the composite is studied. It is evident from the second part of the present paper that if the old building is covered with thin coating made from cement/CNT composite, it will be better protected then in the opposite case. The new buildings will be also better protected against environmental impact, since the composite glass/CNT acts as a non-conductor of moisture.
| A | cross section areas | [nm2] |
| DzA | electric displacement | [C/m2] |
| EzA | electric gradient | [N/C] |
| h | thickness | [m] |
| H | moisture | [wt.%] |
| kc | cohesive parameter | [nN/nm3] |
| l | length | [m] |
| L | length | [nm] |
| le | interfacedebond length | [m] |
| Pmax | maximal value of pull-out force | [nN] |
| r | radius | [nm] |
| S | relative slip displacement | [nm] |
| T | temperature | [K] |
| u | displacement | [m] |
| σ | stress | [GPa] |
| ε | strain | [ - ] |
| ε0 | tensile strain | [ - ] |
| τI | interfacial shear stress | [GPa] |
| τcr | failure value of the interfacial shear stress | [MPa] |
The authors greatly appreciate the financial support from European Polytechnical University, Pernik, Bulgaria and the project E02/10.12.2014of Bulgarian National Foundation.
- ,
Security Aspects of Future Renewable Energy System, A Short Overview ,Energy , Vol. Vol. 61 , :598-6052013, https://doi.org/10.1016/j.energy.2013.09.023, pp - ,
, , http://www.caithnesswindfarms.co.uk/accidents.pdf [Accessed: 24-March-2015] - ,
Analytical Models of Adhesively Bonded Joints-Part I: Literature Survey ,Int. Journal of Adhesionand Adhesives , Vol. Vol. 29 (No. 3), :319-3302009, https://doi.org/10.1016/j.ijadhadh.2008.06.005, ppalso see Part II, Vol. 29, No. 3, pp 331-341, 2009 - ,
, Luftfarhtforschung , Vol. Vol. 15 , :41-471938, pp - ,
The Elasticity and Strength of Paper and Other Fibrous Materials ,Brit. J. Appl. Phys , Vol. Vol. 3 (No. 3), :72-791952, https://doi.org/10.1088/0508-3443/3/3/302, pp - ,
Fracture Mechanics of Unidirectional Composites Using the Shear-Lag Model I: Theory ,J. Compos. Mater , Vol. Vol. 22 , :561-5881988, https://doi.org/10.1177/002199838802200604, pp - ,
A Review of Finite Element Analysis of Adhesively Bonded Joints ,Int. Journalof Adhesion and Adhesives , Vol. Vol. 32 (No. 4), :248-2642011, https://doi.org/10.1016/j.ijadhadh.2011.01.006, pp - ,
Reinitiation of a Crack Reaching Interface ,Int. Journal of Fracture , Vol. Vol. 80 , :257-2761996, https://doi.org/10.1007/BF00018507, pp - ,
Interface Behavior of a Bimaterial Plate under Dynamic Loading ,Journal of Engineering Mechanics , Vol. Vol. 136 (No. 10), :1194-12012010, https://doi.org/10.1061/(ASCE)EM.1943-7889.0000155, pp - ,
Interface Delamination of Bi-material Structure under Time Harmonic Load Cohesive Behaviour of the Interface ,ZAMM , Vol. Vol. 92 (No. 1), :41-512012, https://doi.org/10.1002/zamm.201000210, pp - ,
Interfacial Debonding of a Piezoelastic Bi-material Structure Applicable for Wind Rotor Blades ,J.Mechanics of Advanced Materials and Structures , 2014, https://doi.org/10.1080/15376494.2013.864433 - ,
Piezo Health Monitoring of Adhesive Joints ,SDEWES2014 , 2014, https://doi.org/10.13140/2.1.4060.0322, pp 0194-1-11 - ,
Monitoring of Piezo Single Lap Joints under Static Loading ,SDEWES2014 , 0202-1-122014, https://doi.org/10.13140/2.1.2487.1681, pp - ,
Cracked Bi-material Plates under Thermomechanical Loading Proceedings Fractography of Advanced Ceramics III, Trans Tech Publications Ltd ,In Key Material series , Vol. 409 , :406-4132009, https://doi.org/10.4028/www.scientific.net/kem.409.406, pp - ,
Precracking and Interface Delamination in a Bi-material Structure: Static and Dynamic Loadings ,ActaMecanicaSinica , Vol. Vol. 27 (No. 1), :80-892011, https://doi.org/10.1007/s10409-011-0414-3, pp - ,
Technical Damage in Wind Rotor Blade under Static Load at Environment Conditions ,CET , Vol. Vol. 42 , :91-962014, pp - ,
, , http://ec.europa.eu/energy/efficiency/buildings/buildings_en.htm [Accessed: 24-March-2015] - ,
, Building Science for Building Enclosures , 2005 - ,
Analysis of the Prescriptions forEnergy Quality Buildings in Three Parisian Urban Development Projects ,Journal ofSustainable Development of Energy, Water and Environment Systems , Vol. Vol. 3 (No. 2), :118-1302015, https://doi.org/10.13044/j.sdewes.2015.03.0009, pp - ,
Nanotechnology in Concrete - A Review ,Construction and Building Materials , Vol. Vol. 24 (No. 11), :2060-20712010, https://doi.org/10.1016/j.conbuildmat.2010.03.014, pp - ,
Thermostressed State of a Piezoelectric Body with a Plane Crack under Symmetric Thermal Load ,Int. Appl. Mech , Vol. Vol. 44 (No. 3), :320-3302008, https://doi.org/10.1007/s10778-008-0048-8, pp - ,
, , http://composite.about.com/library/data/blc-t300-5208.htm [Accessed: 24-March-2015] - ,
Analytical Pull-out Analysis for Carbon Nanotube-Cement Composites under Static Loading ,Comptesrendus de l’AcademieBulgare des Sciences , Vol. Vol. 66 (No. 3), :431-4382013, pp