


Approximately 25% of the total primary energy demand in the European Union (EU) is satisfied by natural gas. Despite the estimated decrease in energy demand, the consumed quantities of natural gas are expected to increase up to 30% in 2035 [1]. The EU has set objectives to achieve a share of 20% of energy from renewable energy sources in the gross final consumption [2]. Eurostat provides intermediate results on these objectives [3]. The share of renewables in the gross final energy consumption was 14.1% in 2012. This means that from this date forward the annual increase should be at least 4.5% in order to meet the 20% objective. Despite possible adverse effects on amongst others crop prices, food supply, biodiversity and forest protection; biomass contributes for almost 66% to the primary production of renewable energy in 2012 [4]. Applying biomass for energetic purposes should therefore be done as efficient as possible. An example of more efficient use of biomass is electricity production through biomass gasification combined with a gas turbine (35–40%), which is energetically advantageous, compared to combustion of biomass (25–30%) [5]. Synthetic Natural Gas (SNG) produced through biomass gasification followed by a methanisation step can contribute to the targets set by the EU for the reduction of the emissions of fossil carbon, since it has a renewable origin. Besides this, due to similar characteristics SNG can be mixed with natural gas, which is advantageous since there is a large gas infrastructure present [6].
The gasification technology can be applied on a large scale (i.e. several hundreds of megawatts). Given the high European green gas ambitions and the presence of a natural gas grid, suitable for distribution of SNG, there are opportunities for the large-scale application of biomass gasification for SNG production. In line with the expected increase in natural gas use [1] this paper argues that since, natural gas is the cleanest fossil fuel and therefore it has better long-term opportunities than coal and oil, especially when large-scale injection of a green gas, such as SNG, is applied. This paper argues that the environmental and energy performance of such a large system are currently unknown for two reasons. First, most literature only studies the (partial) upstream chain and not the conversion or downstream distribution part of bioenergy systems (see for example [7]-[9]. Second, there are only a few studies available that specifically look at SNG or biomass gasification from a system perspective. The study by Uslu et al. [10] does look at large scale bioenergy supply systems, but only includes the upstream chain including pretreatment, but it excludes biomass conversion to a liquid or gaseous fuel. Besides this, the study is mostly focused on the cost aspect of such a supply system. The same arguments also hold for the more recent study by Lin et al., whom look at pretreatment and long distance transportation [11]. Two recent Life Cycle Analyses (LCAs) are available [12], [13] of which the first studies biomass gasification for heat and power production on a small scale. The second study does focus on SNG production, but also studies a small-scale system. Another recent study by Sriwannawit et al. explores the economic feasibility of biomass gasification systems in Indonesia [14]. They focus on the economic viability of biomass gasification on a small scale for electricity production in rural areas. In these studies, the energy performance is underexposed, since LCAs [12], [13] mainly focus on the environmental impact of systems or services. The study by Sriwannawit et al. uses locally available biomass resources [14], which is not in line with our research where we assume that biomass has to be transported over long distances. The studies that do take into account long distance transportation exclude the conversion step to power, gas or a liquid energy carrier.
This study argues that the conclusion by Iakovou et al. that few studies focus on supply chain issues in the context of the whole chain is still valid [15]. Therefore, the environmental and energy performance of the whole chain of large-scale biomass gasification for SNG (including biomass production, harvesting, handling, storage, intermediate transport, pretreatment, transport to conversion plants, conversion, distribution to the end-user and finally end-use) is not well known. This research studies options for centralised large-scale biomass gasification for the production of SNG in order to optimally exploit the existing natural gas infrastructure, distribute energy sources, fulfil environmental objectives and maintain a strong market position on the long term.
The main aim is to analyse the environmental impact and energetic performance of SNG when SNG replaces 1% of the current natural gas consumption in the EU28 by analysing the upstream and midstream part of the chain. This equals 0.25% of the final gross energy consumption, which is no more than 11% of the needed annual increase to reach the objective of 20% renewables in the final gross energy consumption in the EU in 2020. In order to determine the performance of the biomass to SNG to end-use chain a chain analysis is done.
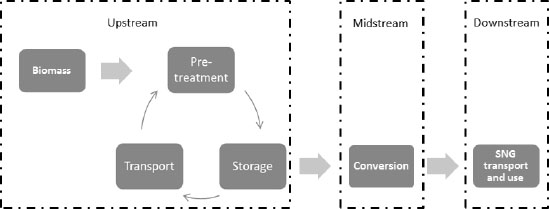
A dynamic model is developed to simulate SNG routes and calculate it’s environmental and energetic performance. The model is divided in three parts; the upstream, midstream and downstream part of the chain. Figure 1 gives an overview of the model. Biomass is produced and harvested; subsequently it is pre-treated and stored on-site. Transport is applied to a secondary pretreatment facility when pelleting or torrefaction is applied. Subsequently, the pre-treated biomass is stored at the conversion site where SNG is produced. After production, SNG is injected into the grid, mixed and transported to the end-user.
Overview of the different process steps in the applied model
Energy performance indicators are numerous in literature. This research restricts itself to the use of the Energy Efficiency (EE) which is defined as the ratio of usable energy (i.e., SNG) produced to the energy contained in the biomass feedstock [16]. The EE is applied to determine the conversion efficiency of the whole biomass to SNG supply chain. It is a representation of the energy content lost due to processing of biomass in secondary and/or tertiary products and the external fossil inputs. The Energy Ratio (ER) is defined as the total usable energy produced by the system divided by the total energy input to drive the system. An ER > 1 implies that the energy input is smaller than the produced energy output [16]. The equations for the ER and the EE are respectively taken from [17], [18] and subsequently adjusted to the system described in this paper:
where ESNG is the energy contained in the SNG delivered to the grid, Efossil input is the amount of fossil energy used in the upstream process and Ebiomass is the energy contained in the biomass at harvest.
The environmental performance is measured with two indicators, namely land use in hectares and GHG emissions in CO2 eq MJ−1 SNG supplied. In these CO2 equivalents, CO2, CH4 and N2O are taken into account, since these are the most common GHGs related to agriculture [19]. CH4 consumed during fertiliser production is integrated in the calculations. This value includes all fossil inputs for nitrogen fertiliser. The needed equation to calculate the reduction in GHG emissions relative to the conventional fossil chain is derived from [20]:
The chain analysis requires an overview of the steps in the biomass to SNG to end-use chain. These are all the steps in which energy is consumed. The chain starts at the site where biomass is produced and subsequently transported to and converted at the biomass gasification site. After this the SNG is distributed towards the end-user and combusted. In the following, the different steps in the biomass supply chain are elaborated upon.
The difference in net yield between intensive and extensive systems can be a factor 2.3–8 for short rotation poplar depending on the region in which they are produced in Europe [21]. Short rotation poplar production can be, to some extent depending on the system, accompanied with planting, fertilisation, crop protection, weeding, irrigation and harvesting. When taking these individual steps into account it appears that irrigation (which is left out in this paper), fertilisation and harvesting have a significant impact compared to the other steps. Fertilisation can be responsible for over 40% of the total fossil inputs in the intensive biomass production system [21].
This research applies two biomass production systems. The first is an intensive production system with nitrogen fertilisation based on the NWEhigh scenario developed by Nonhebel and a plantation lifetime of 20 years [21]. Yields are assumed to be 10 tonne ha−1 yr−1 on a dry basis (db); this is in the same range as values provided by [21] and [22]. The second is an extensive system in which incremental growth rates of European forests are harvested for energetic purposes in which yields are assumed to be on average 2 tonne ha−1 yr−1 db. Moisture content of the harvested wood is assumed to be 50%, with a primary energy density of 10 MJ kg−1. The differences between the production systems are in fossil energy input, but also in the dispersion of biomass. The intensive scenarios apply 70 kg of nitrogen ha−1 yr−1 and use the emission factor given by the IPCC [19] for N2O emissions. Therefore the emissions for N2O are estimated at 0.7 kg ha−1 yr−1. Land preparation, harvesting and fertilisation are taken into account in the intensive scenarios. The extensive scenario harvests the increment rate of existing forests and therefore does not take land preparation and fertilisation into account. Subsequently, handling, transport, pretreatment, storage and conversion to SNG are taken into account for all scenarios.
This research considers four pretreatment options. On-site drying, on-site chipping, torrefaction and pelleting further down the chain at an intermediate location. Torrefaction requires no fossil inputs, since approximately 10% of the energy contained in the biomass is used for the process whilst simultaneously 30% of the mass is lost [23]. This results in an increase in energy density of a factor 1.3. The energy losses do result in increasing land requirements. Pelleting requires external inputs in order to apply the pressure and temperature required to produce them. Pellet production is assumed to be based on natural gas [24]. A reduction to a moisture content of 10% wb is applied for pellets based on data from Uslu et al. [10].
Due to the seasonality of the growth of biomass and pretreatment, storage is required in order to foresee in year-round supply to the conversion facility. After harvesting in winter, log-wood needs an on-site drying period in order to reach a moisture content below 30% on a wet basis (wb). At this point the logs are suitable for chipping and further processing [25]. From an energetic point of view on-site drying is required, since it increases the energy density of the wood. A nine months on-site drying period is assumed to be enough to reach a moisture content below 30% wb [25] which is a rate at which wood is further transported. This research assumes that a moisture content of 20% wb can be achieved by passive drying. Chipped biomass with 20% or less moisture is suitable for gasification.
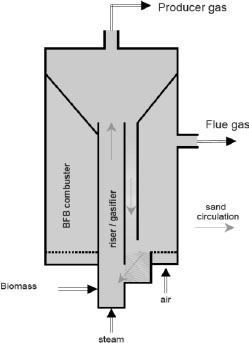
The Energy Research Centre of the Netherlands (ECN) has developed the MILENA biomass gasification process, which is schematically represented in Figure 2 [26]. Biomass is fed into the riser/gasifier simultaneously with superheated steam. Opposite to the biomass, sand is injected into the riser as a bed material. The biomass decomposes partially into gas and is removed as producer gas. Tars, dust and bed material come down due to reduced velocity and are recirculated. The tars and dust are combusted in order to heat the bed material [27]. When impurities are removed the gas can be upgraded to SNG by a methanation step at a total efficiency of about 70% depending on the quality of the feedstock. For woody biomass with 20% moisture wb an efficiency of 70% is applied. For pellets and torrefaction respectively 72% and 72.5% are applied as conversion efficiencies, due to a decrease in moisture towards 10% and 3% wb. The latter might be on the high side due to a reduction in the quantity of hydrocarbons present in the feedstock (B. van der Drift, personal communication, August 14, 2014).
Schematic overview of the MILENA gasification process [26]
At high pressures (up to 40 bar) the biomass to SNG yield can be 70%. Therefore this research does not take into account energy use for injection into the high pressure transmission system, since it assumes that it has sufficient pressure in order to be fed directly into a pipeline system, similar to natural gas from a wellhead [28] or like storage systems that operate at higher pressure than the pressure used in the transmission grid in order to apply free flow when necessary (B. Kootstra, personal communication, May 5, 2014). Injection into the high pressure grid is, despite its higher energy cost, done for multiple reasons. The high pressure transmission grid is an active grid which means it is bidirectional. Furthermore, this grid is able to handle different gas qualities and is used in the Netherlands to supply energy to large industrial users [29]. Injection capacity in this grid is larger than in the low pressure distribution grid.
During pretreatment and conversion the energy content of the biomass changes. According to research by van der Drift et al. [30] the process efficiency from pre-treated biomass to SNG is approximately 70%. In order to determine the overall energetic efficiency of the supply chain the losses due to pretreatment should be taken into account. Assuming that no biomass is lost in the process of handling, storage and transport, the energy content only decreases due to torrefaction. It is possible to compensate for these losses, during transport. Hence, about 90% of the energy contained in the biomass remains after torrefaction, whilst 30% of the mass is lost [23] which can be advantageous in transport when the energy consumption for transport is reduced compared to untreated biomass. Furthermore torrefaction requires 5% more biomass when compared to a chain with only drying and chipping. For pelleting this is 3% less, because the conversion efficiency to SNG is higher than for dried and chipped biomass. A decrease to a moisture content of 10% wb is assumed for pelleting. Therefore the energetic feasibility of torrefaction and pelleting are determined by the transport distance, the changing energy density of pre-treated biomass and the used transportation type after torrefaction or pelleting. Eq. (4) and (5) are applied to determine the break-even distance for torrefied biomass with dried biomass (20% wb) as a reference. The break-even distance for pelleting can be calculated analogue to torrefaction.
Eq. (4) was applied to calculate the energy required for transport when fresh or pre-treated biomass is used. Eq. (5) was applied to calculate the energy required for the aforementioned pretreatment technologies:
where:
ET is the total energy consumed to transport biomass [MJ a-1];
ETMn is the modal energy intensity of transport mode n [MJ/kg km];
Biodi is the demand for biomass at the conversion plant, where i, when applied, refers to the pretreatment technology [MJ a-1];
ηCx is the efficiency of the applied conversion technology x, dependent on the applied pretreatment technology i [%];
HVi is the LHV of biomass i [MJ kg−1];
Dn is the transport distance for transport mode n [km];
Ehi is the total energy consumption for handling/intermodal transfer, where i, when applied, refers to the pretreatment technology [MJ a-1];
Ep is the sum of the energy consumed in biomass, due to pretreatment [MJ a-1];
ηPi is the energetic efficiency of pretreatment technology i [%].
When pretreatment is applied, the sum of eq. (4) and (5) was taken to calculate the energy requirement for transport and the energy required for pretreatment of biomass. Solving the equation ET fresh = Ep + ET pretreatment gives the unknown variable D. This is the so-called break-even transport distance. We apply the modal energy intensity (MJ/ton km) to describe the energy consumption for transport. To estimate the break-even distance for the studied chains, the average energy intensity for the combination of transport modes was determined based on the energy consumption and transport distance per mode.
The consumption of water, the effect of biomass cultivation on groundwater, nutrient loading and emissions due to Indirect Land Use Change (ILUC) are not taken into account. The downstream part of the SNG chain is equal to the downstream natural gas chain and is therefore not taken into account. Combustion at the end-user is taken into account for the reference scenario when considering CO2 emissions, since they have a fossil origin.
The net efficiency of natural gas production (1 - (losses + energy industry own use) / production) in Europe is 90.7% based on data from 2010 [31]. This means that for one unit of energy delivered 0.1025 units are needed. Natural gas emissions are derived from Harrison et al. [32], whom estimate that 1.4% ± 0.5% of the gross natural gas production is emitted during production, processing, distribution, transmission and storage. Assuming that 90% of the high calorific natural gas consumed in industry consists of methane, this shows that methane emissions are in the order of 1.26% of the gross natural gas production. This research assumes that natural is gas combusted in order to use it for production, processing, distribution, transmission and storage of natural gas and therefore results in emissions of CO2; in literature a value of 56.1 g CO2 MJ−1 is often applied [33]. Indirect energy is not taken into account for the production of the wellhead and processing plants, distribution and storage. This research tries to replace 1% of the natural gas consumption in the EU; emissions from the wellhead and processing plant are therefore marginal and the emissions from distribution and storage are the same for SNG.
The energy efficiency for the natural gas chain is calculated by eq. (6); the energy ratio by eq. (7):
where:
Enatural gas delivered is the amount of natural gas delivered to the grid;
Efossil input is the amount of fossil energy used in the upstream process;
Egross natural gas produced is the amount of natural gas produced in order to deliver Enatural gas delivered to the grid.
All scenarios use the same biomass transport distances which are 20 km for forwarding and 3,000 km towards the conversion plant. An average of 3,000 km is assumed to be realistic within the borders of the EU28. When a combination of transport types is applied this research assumes truck transport of 500 km combined with 2,500 km over water for which a barge is applied suitable for short sea distances. Table 1 shows the different routes simulated to fulfil the scenario of 1% SNG. Four types of pretreatment are taken into account namely, drying, chipping, torrefaction and pelleting. A ceteris paribus approach is applied in which one chain parameter is changed in order to determine its impact on the efficiency of the whole chain and to make its impact comparable with alternative supply chains. The differences in these scenarios are in the transport distances, transport modes, the amount of handling (i.e., loading and unloading movements), energy density of biomass due to varying pretreatment and the total biomass demand determined by the changing properties of biomass depending on the chosen pretreatment.
Upstream biomass to SNG routes
Production |
Forwarding |
Onsite pre-treatment |
Transport |
Intermediate pre-treatment |
Transport |
|
|---|---|---|---|---|---|---|
0 |
Extensive |
20 km |
Chipping Drying |
Truck 3,000 km Netherlands |
||
1 |
Intensive |
20 km |
Chipping Drying |
Truck 3,000 km Netherlands |
||
2 |
Intensive |
20 km |
Chipping Drying |
Truck 3,000 km Intermediate |
Barge (shortsea) 2,500 km Netherlands |
|
3 |
Intensive |
20 km |
Chipping Drying |
Truck 3,000 km Intermediate |
Torrefaction |
Truck 2,500 km Netherlands |
4 |
Intensive |
20 km |
Chipping Drying |
Truck 3,000 km Intermediate |
Torrefaction |
Barge (shortsea) 2,500 km Netherlands |
5 |
Intensive |
20 km |
Chipping Drying |
Truck 3,000 km Intermediate |
Pelleting |
Barge (shortsea) 2,500 km Netherlands |
The scenarios are designed in such a way that an analysis can be done of the energetic performance and environmental impact of the production systems, the transport modes and pretreatment options. Besides this, an analysis of the energetic feasibility of torrefaction and pelleting is done based on break-even distances for transport.
The input data for the model are displayed in Table 2. It gives an overview of the parameters taken into account and their values. A value of 35.86 MJ l−1 is applied for the energy density of diesel. Indirect energy use for machinery is not taken into account for loading, handling and pretreatment. This means that indirect energy needed for manufacturing and maintenance of loading and handling equipment and for the construction of pretreatment facilities are left out. Furthermore the indirect energy for storage is left out, which means that only loading and unloading are taken into account. Emissions from indirect energy use for transport are based on natural gas.
Input data for the simulations addressing energy consumption and GHG emissions
Process or product |
Specific process or product |
Direct |
Unit |
Indirect |
Unit |
Source |
Remark |
|---|---|---|---|---|---|---|---|
Ploughing and preparation |
1,327 |
[MJ ha−1 20 yr−1] |
[34] |
During establishment phase; production phase is 20 years |
|||
324 |
[MJ ha−1 20 yr−1] |
[35] |
Ploughing, tillage and pesticide application; Natural gas based |
||||
215 |
[MJ ha-1 yr-1] |
200 |
[MJ ha-1 yr-1] |
Only applicable for intensive system |
|||
Crop protection |
[36] |
Three rounds yr−1 |
|||||
[21] |
Indirect energy per spraying round |
||||||
Harvesting |
73 |
[MJ ton−1] |
28 |
[MJ ha−1 yr−1] |
[36] |
Indirect energy is assumed to be similar to fertiliser application; Indirect energy is assumed to be derived from natural gas |
|
Forwarding |
3.4 |
[MJ ton−1 km−1] |
0.92 |
[MJ ton−1 km−1] |
Assumed to be half as efficient as truck transport |
||
Fertiliser |
Fertiliser application |
180 |
[MJ ha−1 yr−1] |
[37] |
|||
Fertiliser production |
28 |
[MJ ha−1 yr−1] |
[35] |
Manufacture and maintenance of machinery (natural gas based) |
|||
35.3 |
[MJ kg-N−1] |
[35] |
This includes indirect energy for production and CH4 feedstock |
||||
Loading |
Loading of biomass Chipping |
10.8 |
[MJ ton−1] |
[34] |
|||
Original in MJ kg−1 DM; assumed moisture |
|||||||
Pre-treatment |
249 |
[MJ ton−1] |
[34] |
content 50% |
|||
Pelleting |
464 |
[MJ ton−1] |
[10] |
||||
Transport |
Truck |
1.68 |
[MJ ton−1 km−1] |
0.46 |
[MJ ton−1 km−1] |
||
Barge (Short sea) |
0.28 |
[MJ ton−1 km−1] |
0.03 |
[MJ ton−1 km−1] |
|||
Emissions |
Specific emission |
Direct |
Unit |
Indirect |
Unit |
Source |
Remark |
Fertilisation |
Fertiliser CO2 emissions |
2.2 |
[kg CO2 kg] fertiliser |
[40] |
Production phase |
||
(nitrogen) |
Fertiliser N2O emissions |
1 |
[%N2O kg-N−1] |
[19] |
After application |
||
Pelleting |
Emissions CO2 |
190 |
[g CO2kg−1] pellets |
[24] |
Pellet production based on natural gas |
||
Emissions CH4 |
0.92 |
[g CH4 kg−1] pellets |
[24] |
Pellet production based on natural gas |
|||
Chipping |
CO2 emissions |
18 |
[g CO2kg−1] woodchips |
Chipping with diesel engine |
|||
Diesel combustion |
CO2 emissions |
73.54 |
[g CO2 MJ−1] diesel |
[41] |
Equals 2,637 g CO2 l−1 diesel |
||
Natural gas combustion |
CO2 emissions |
56.1 |
[g CO2 MJ-1] natural gas |
[33] |
|||
Scenario input general |
Specific input |
Unit |
|||||
Global warming potential |
CH4/100 year |
21 |
CO2 equivalents |
[42] |
Data taken on 22.07.2014 |
||
Global warming potential |
N2O/100 year |
310 |
CO2 equivalents |
[42] |
Data taken on 22.07.2014 |
||
Scenario input |
|||||||
intensive |
|||||||
Fertiliser – N |
70 |
[kg ha−1 yr−1] |
[21] |
||||
Plantation lifetime |
20 |
[yr] |
[21] |
||||
Yield |
10 |
[ton dm yr−1] |
|||||
Scenario input |
|||||||
extensive |
|||||||
Plantation lifetime |
∞ |
[yr] |
|||||
Yield |
2 |
[ton dm yr−1] |
The results are divided in the energetic and environmental performance. The energetic performance takes into account the EE and ER. Therefore the results needed are the consumption of fossil energy for all supply chain elements and the energy lost in the biomass due to pretreatment and conversion steps.
The ER and the EE of the reference scenario are respectively 9.8 and 81.4% when methane losses are aggregated with fossil input. When losses are left out the ER and EE are respectively, 13 and 83.7%. For every unit natural gas delivered 0.014 units CH4 are emitted to the atmosphere and 0.1 units CH4 are combusted. This results in the emission of 9.9 g CO2 eq MJ−1 natural gas delivered to the grid. When combustion of the natural gas is included total emissions are 66 g CO2 eq MJ−1. The energetic performance of the reference scenario is substantially higher than the simulated scenarios. The environmental advantage of a biogenic against an anthropogenic carbon source is not well represented in these figures.
The required quantities of SNG correspond to about 5.4 GW installed gasification capacity when producing continuous on a year round basis (8,760 hours). It is assumed that the installed gasification capacity is located near the port of Rotterdam.
When comparing the intensive scenarios 1 to 5 with the extensive scenario 0 it appears that the extensive scenario requires roughly a factor 5 more land. The difference in performance of the scenarios 0 and 1 in which only drying and chipping are applied is determined by the fossil inputs into the intensive production system. The extensive system has the best energetic and environmental performance due to the absence of fossil inputs into the biomass production system. The difference in energy use and emissions between scenarios 0 and 1 with equal transport is very limited; these are respectively, 0.02 MJ MJ−1 SNG and 3 g CO2 eq MJ−1 SNG. The extensive scenario 0 shows small advantages compared to scenario 1, such as a better EE. The availability of land is a physical limitation and therefore challenging to overcome especially when large quantities are required. Therefore this research continues with the analysis of intensive biomass production scenarios.
The results of the 6 simulations and the reference scenario are displayed in Table 3. It gives an overview of the environmental impact and energetic performance of the different biomass to SNG chains. Biomass production contains the steps ploughing and preparation, crop protection, harvesting, fertilisation and loading. Transport energy consists of direct and indirect transport energy excluding forwarding, which is in the order of 0.5% of the total transport energy.
Environmental and energetic performance of the simulated scenarios
Scenario |
0 |
1 |
2 |
3 |
4 |
5 |
Reference |
Unit |
|
|---|---|---|---|---|---|---|---|---|---|
Energy scenario |
1.4 |
1.4 |
3.6 |
1.6 |
3.7 |
3.3 |
9.8 |
– |
|
Energy efficiency |
20.6 |
18.7 |
50.6 |
24.2 |
48.6 |
49.9 |
81.4 |
[%] |
|
Land requirements |
0.36 |
0.07 |
0.07 |
0.07 |
0.07 |
0.07 |
[m2MJSNG−1] |
||
Installed capacity |
5.4 |
5.4 |
5.4 |
5.4 |
5.4 |
5.4 |
[GW] |
||
Biomass production |
Share of total |
0.01 |
0.03 |
0.04 |
0.04 |
0.04 |
0.03 |
[MJFossil MJSNG−1] |
|
Transport energy |
Share of total |
0.64 |
0.64 |
0.18 |
0.54 |
0.17 |
0.17 |
[MJFossil MJSNG−1] |
|
Direct |
0.56 |
0.57 |
0.22 |
0.49 |
0.22 |
0.25 |
0.1 |
||
Energy use |
Indirect |
0.14 |
0.16 |
0.06 |
0.14 |
0.06 |
0.05 |
[MJFossil MJSNG−1] |
|
Total |
0.71 |
0.73 |
0.28 |
0.64 |
0.27 |
0.31 |
0.1 |
||
Direct |
41 |
43 |
18 |
38 |
17 |
37 |
56 |
||
CO2 emissions |
Indirect |
8 |
9 |
3 |
8 |
3 |
3 |
10 |
[g CO2 eq MJSNG-1] |
Total |
49 |
52 |
21 |
46 |
20 |
40 |
66 |
||
GHG reduction potential |
24.7 |
20.3 |
68.5 |
30.5 |
69.1 |
39.2 |
[%] |
Scenario 2 underlines that transport is the determining factor in energy consumption and emissions. The GHG reduction potential more than triples whilst the energy use decreases with a factor 2.6 all due to a change in transport mode. Scenario 3 shows that torrefaction has limited impact when inefficient transport is applied. The ER increases which is due to a decrease in fossil energy for transport. Despite the increase in demand for biomass when torrefaction is applied there is an energetic profit for transport. The differences in performance between scenario 2 and 4 are smaller. This underlines that the impact of torrefaction is limited when the transport mode is optimised. When comparing the difference between torrefaction and pelleting (scenario 4 and 5) it becomes clear that the EE and ER are in the same range despite the fact that torrefaction has no external inputs. The ER however decreases whilst the EE increases. The decrease in ER is caused by the increase in fossil input when pelleting is applied instead of torrefaction. The increase in EE is due to a decrease in biomass demand and an increase in fossil input. Despite the extra biomass that has to be transported due to torrefaction in scenario 4 it uses less energy than scenario 5 in which pelleting is applied instead of torrefaction.
The largest energetic impact on the system is from transport and therefore the effect of a decrease of 5% in direct energy use for transport on the system is shown in Table 4 assuming that transport becomes more efficient in the future.
The environmental and energetic performance with 5% more efficient transport
Scenario |
0 |
1 |
2 |
3 |
4 |
5 |
Unit |
|
|---|---|---|---|---|---|---|---|---|
Energy ratio |
1.4 (4.8%) |
1.4 (4.6%) |
3.6 (3.4%) |
1.6 (4.4%) |
3.7 (3.3%) |
3.3 (2.9%) |
– |
|
Energy efficiency |
20.6 (10.9%) |
18.7 (12%) |
50.6 (1.3%) |
24.2 (7.4%) |
48.6 (1.2%) |
49.9 (1.2%) |
[%] |
|
CO2 emissions |
Direct |
41 (−4.5%) |
43 (−4.3%) |
18 (−3.2%) |
38 (−4.1%) |
17 (−3.1%) |
37 (−1.4%) |
[g CO2 eq MJ-1SNG] |
Energy use |
Direct |
0.56 (−4.5%) |
0.57 (−4.4%) |
0.22 (−3.5%) |
0.49 (−4.3%) |
0.22 (−3.3%) |
0.25 (−2.8%) |
[MJFossil MJSNG−1] |
GHG reduction potential |
24.7 (28.1) |
20.3 (23.8) |
68.5 (69.5) |
30.5 (33.3) |
69.1 (70) |
39.2 (40.1) |
[%] |
Table 4 shows the increase or decrease of the ER, EE, carbon emissions and energy use between brackets when transport is 5% more efficient. The values for the GHG reduction potential are the actual values. The effect on the GHG reduction potential varies between 0.9% and 3.4%. This emphasizes that the best performing scenarios are the least affected and a reduction in transport distance is required to significantly increase the biomass to SNG chain.
When the extra fossil input for pelleting or the losses in biomass due to torrefaction is larger than the gains from more efficient transport it is energetically unfeasible to apply pretreatment steps such as torrefaction and pelleting. Therefore there is a break-even distance for transport in which the energetic performance of a biomass supply chain in- or excluding torrefaction or pelleting is the same. The energetic feasibility of these pretreatment steps is therefore dependent on the applied transport type and the transport distance.
The gasification process does not require a specific type of pretreatment in order to function. The only physical limitation is the size of the biomass particles injected into the reactor. Pretreatment does have a positive effect on the conversion efficiency of the gasification process. Furthermore, pretreatment decreases the energy use for transport. However, when the energy input or the energy losses due to pretreatment are larger than the reduction in transportation energy the application of pretreatment is energetically unfeasible. Therefore it is of interest to determine the break-even distances for transport in order to find the energetic feasibility of the whole biomass supply chain.
Figure 3 shows the break-even distances for the two transport modes applied in this research. Table 2 shows the applied energy use for different transport types. Calculations for Figure 3 have been done for the combination of indirect and direct energy per transport mode whilst assuming the net process efficiencies for torrefaction and pelleting to respectively be, 92% and 84% [10].
Break-even transport distances for torrefaction by trucks and short sea barge
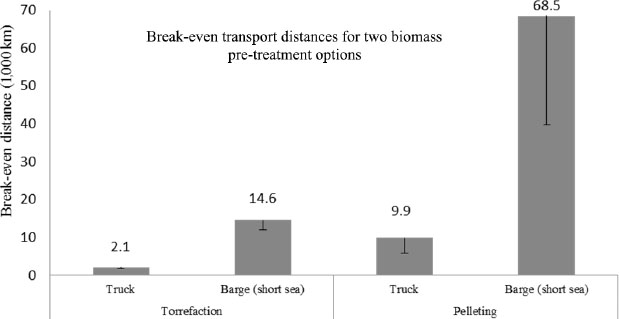
The error bars show the results when the energy densities from [10] are applied for torrefaction (20.4 MJ kg−1) and pelleting (17.7 MJ kg−1) instead of the calculated energy densities which are 14.3 MJ kg−1 for dried biomass, 18.8 MJ kg−1 for torrefied biomass and 15.9 MJ kg−1 for pellets. Break-even distances are in 1,000 km.
Figure 3 clearly illustrates why scenario 3 has a better performance than scenario 1. The transport distance in both scenarios is 3,000 km by truck which is above the break-even distance for torrefaction. Based on Figure 3, scenario 4 should have had a better performance than scenario 2, since the transported distance of 2,500 km is far below the break-even distance for transport by barge. This is rescinded by the 500 km truck transport causing the scenarios to have a similar performance. Pelleting is energetically unfeasible, since both break-even distances for transport by short sea barge and truck are far above the realistic transport distances within Europe.
The EE and the ER of the reference scenario are significantly higher than the EE and ER of the simulated scenarios. When taking into account that the EU is on the verge of a substantial energy system transition, it can be argued that a biogenic carbon source has clear advantages over an anthropogenic carbon source. Besides the GHG reduction potential of biomass for energetic purposes this might be a reason to apply SNG at the cost of natural gas despite its smaller energetic performance.
Choosing an intensive system over an extensive system is accompanied with some insecure aspects. When large quantities of biomass are required an intensive system has logistic advantages, due to the need for less transport. Transport has the largest influence on the overall system performance. When taking the large quantities of biomass into account that are necessary to fulfil a rather small SNG demand it is justifiable to use an intensive system. Hence, when the required area is larger the average forwarding distance will also increase. Besides this, the energy input for harvesting is expected to be higher per mass unit of harvested material. The environmental performance is determined by land requirements and CO2 emissions. Emissions caused by ILUC are not taken into account. Scenarios one to five are expected to perform worse when ILUC is taken into account. When taking a worst case scenario (i.e., converted fens in Europe) emissions due to drainage might be in the order of 290-3,230 g CO2 eq m−2 year−1 [43]. When comparing these values to scenario 4 with the largest GHG reduction potential it appears that emissions caused by ILUC are roughly 1 to 12 times higher. When emissions increase with a factor 4 due to ILUC the performance is even worse than the fossil reference scenario.
The estimated break-even distances and thus the energetic feasibility of torrefaction within the European boundaries might vary when natural degradation of chipped biomass is taken into account.
The available forests in the EU are limited. Asikainen et al. [44], estimate the amount of energy from forests (extensive systems) that can be harvested technically and sustainably in the EU27 to be in the order of 36 Mtoe yr−1. This is 24% of the theoretical potential and 9% of the primary energy demand in the EU for natural gas. The demand of 4.04 Mtoe yr−1 (1% of the European natural gas consumption) would therefore require 5.8 Mtoe yr−1 of raw biomass corresponding to 16% of the annual available biomass. This underlines that biomass from extensive systems has less potential to foresee in the desired quantities. Overall it becomes clear that replacing significant quantities of natural gas in the EU with SNG seems unfeasible when an extensive production system is used. In the most optimistic scenario 20% of the natural gas consumption could be replaced from extensive production systems assuming that the annual increment rate can be harvested. In practice this value will be no more than 5% of the total natural gas demand. When looking at the intensive production system 1.4% of the arable land currently in use is required. Even when both production systems are combined, the EU cannot replace its natural gas consumption with SNG from indigenous biomass. Furthermore, replacing only 1% already has a substantial logistical impact. To illustrate this, the quantities transported correspond to 5% of the EUs current food flow.
Torrefaction or pelleting should be done when the desired conversion process needs a certain type of feedstock quality. This can relate to consistent feedstock quality in order to stabilise the conversion process, to avoid biological degradation but also to grindability of torrefied biomass for use in coal-fired power plants. When the applied pretreatment is necessary e.g., based on previous arguments than it should be done as close to the harvest location as possible.
This study shows that the analysed biomass supply chains cannot compete with the conventional reference scenario when looking at the energetic performance and land use. The ER and EE of the reference scenario are respectively a factor 2.6 and 1.6 higher than the best performing biomass supply chain. The reduction in GHG emissions is between 20% and 69% at the cost of respectively, 1.2 and 1.3 Mha, which emphasises the importance of well-designed biomass supply chains.
Depending on the design of the biomass supply chain the environmental and energetic performance can be quite divergent. This is emphasised by the intensive scenarios 4 and 5. Whilst the energetic performances are in the same range, the environmental performances (when using carbon emissions as an indicator) differ respectively a factor 2.2. This shows that torrefaction overall has a better performance than pelleting despite the requirement of 8% more land.
Pretreatment such as torrefaction and pelleting do not contribute to the energetic and environmental performance of the biomass supply chain within the borders of the EU when transport is optimised. This is supported by the difference in performance of scenario 1 and 3 in which biomass transport is kept constant and torrefaction is added. Truck transport is not optimal and therefore the contribution of torrefaction is significant. When transport is optimised the advantage of torrefaction is gone.
Determining the optimal scenario in the context of long term sustainability is a challenge since sustainability has three components; social, environmental and economic. The ER and EE only take energy into account and are therefore not representative to determine the sustainability of biomass supply chains. The intensive scenarios 2 and 4 are the best performing scenarios when looking at energy use and carbon emissions. This emphasizes that transport is the determining factor in biomass supply chain design.
- , Annex A — Tables for Scenario Projections, World Energy Outlook 2013, 2013
- ,
- , , 2014
- , Share of Renewable Energy in Gross Final Energy Consumption, 2014
- ,
The Bumpy Road of Biomass Gasification in the Netherlands: Explaining the Rise and Fall of an Emerging Innovation System ,Technological Forecasting & Social Change , Vol. Vol. 75 (Issue 1), :57-772008, https://doi.org/10.1016/j.techfore.2006.08.006 - ,
Production of Synthetic Natural Gas (SNG) from Biomass, Energy Research Centre of the Netherlands (ECN) , 2006 - ,
Logistics Management and Costs of Biomass Fuel Supply ,International Journal of Physical Distribution & Logistics Management , Vol. Vol. 28 (Issue 6), :463-4771998, https://doi.org/10.1108/09600039810245120 - ,
Economics of Biomass Energy Utilization in Combustion and Gasification Plants: Effects of Logistic Variables ,Biomass and Bioenergy , Vol. Vol. 28 (No. 1), :35-512005, https://doi.org/10.1016/j.biombioe.2004.04.009 - ,
Logistics Issues of Biomass: the Storage Problem and the Multi-biomass Supply Chain ,Renewable and Sustainable Energy Reviews , Vol. Vol. 13 (No. 4), :887-8942009, https://doi.org/10.1016/j.rser.2008.01.003 - ,
Pretreatment Technologies, and their Effect on International Bioenergy Supply Chain Logistics, Techno-economic evaluation of Torrefaction, fast Pyrolysis and Pelletisation ,Energy , Vol. Vol. 33 (No. 8), :1206-12232008, https://doi.org/10.1016/j.energy.2008.03.007 - ,
Biomass Feedstock Preprocessing and Long-distance Transportation Logistics ,GCB Bioenergy , Vol. Vol. 8 (No. 1), :180-1902015, https://doi.org/10.1111/gcbb.12241 - ,
Life Cycle Assessment of Bioenergy Production from Orchards Woody Residues in Northern Italy ,Journal of Cleaner Production , Vol. Vol. 112 (Part 4), :2569-25802016, https://doi.org/10.1016/jJdepro.2015.09.094 - , Life-Cycle Assessment of Bio-Fuel Production using Syngas from Biomass, Handbook of Bioenergy, 2015
- ,
Policy Impact on Economic Viability of Biomass Gasification Systems in Indonesia ,J. sustain. dev. energy water environ. syst. , Vol. Vol. 4 (No. 1), :56-682016, https://doi.org/10.13044/j.sdewes.2016.04.0006 - ,
Waste Biomass-to-energy Supply Chain Management: A Critical Synthesis ,Waste Management , Vol. Vol. 30 (No. 10), :1860-18702010, https://doi.org/10.1016/j.wasman.2010.02.030 - ,
Energy and Greenhouse Gas Balance of Bioenergy Production from Poplar and Willow: A Review ,Gcb Bioenergy , Vol. Vol. 3 (No. 3), :181-1972011http://dx.doi.org/10.1111/j.1757-1707.2010.01073.x - ,
Modelling of Energy and Carbon Budgets of Wood Fuel Coppice Systems ,Biomass and Bioenergy , Vol. Vol. 21 (No. 1), :1-192001, https://doi.org/10.1016/S0961-9534(01)00016-2 - ,
Life Cycle Assessment of Electricity production from Poplar Energy Crops Compared with Conventional Fossil Fuels ,Energy Conversion and Management , Vol. Vol. 40 (No. 14), :1477-14931999, https://doi.org/10.1016/S0196-8904(99)00076-X - , 2006 IPCC Guidelines for National Greenhouse Gas Inventories, Prepared by the National Greenhouse Gas Inventories Programme, 2006
- ,
Greenhouse Gas Footprints of different Biofuel Production Systems ,Renewable and Sustainable Energy Reviews , Vol. Vol. 14 (No. 7), :1661-16942010, https://doi.org/10.1016/j.rser.2010.02.014 - ,
Energy Yields in Intensive and Extensive Biomass Production Systems ,Biomass and Bioenergy , Vol. Vol. 22 (No. 3), :159-1672002, https://doi.org/10.1016/S0961-9534(01)00071-X - ,
Poplar as a Feedstock for Biofuels: A Review of Compositional Characteristics ,Biofuels, Bioproducts and Biorefining , Vol. Vol. 4 (No. 2), :209-2262010, https://doi.org/10.1002/bbb.206 - ,
Review: A Review on Biomass Torrefaction Process and Product Properties for Energy Applications ,Industrial Biotechnology , Vol. Vol. 7 (No. 5), :384-4012011, https://doi.org/10.1089/ind.2011.7.384 - ,
A Systems Analysis of Biomass Densification Process ,Doctoral dissertation, University of British Columbia, Vancouver, Kanada , 2005 - , Woodfuels Handbook, Production, Quality requirements, Trading, 2008
- , MILENA Gasification Process, n.d.
- , MILENA Biomass Gasification Process, 2011
- ,
Gas Compression, In Oil and Gas Production Handbook: An Introduction to Oil and Gas Production, Transport, Refining and Petrochemical Industry , Vol. Vol. 3.0 , :1522013 - ,
Development Options for the Dutch Gas Distribution Grid in a Changing Gas Market ,Networking, Sensing and Control (ICNSC), 2011 IEEE International Conference on, pp 32-37, IEEE , 2011 - ,
MILENA Gasification Technology for High Efficient SNG Production from Biomass ,14th European Biomass Conference & Exhibition , 17-212005 - ,
Energy Balances of OECD Countries - 2012 edition, International Energy Agency, Paris , 2012 - ,
Methane Emissions from the Natural Gas Industry, US Environmental Protection Agency ,National Risk Management Research Laboratory , 1996 - ,
Regenerative Energiesysteme: Technologie-berechnung-simulation ,Carl Hanser Verlag GmbH Co KG , 2013, https://doi.org/10.3139/9783446435711 - ,
Short-rotation Forestry of Birch, Maple, Poplar and Willow in Flanders (Belgium), II. Energy Production and CO2 Emission Reduction Potential ,Biomass & Bioenergy , Vol. Vol. 31 (No. 5), :276-2832007, https://doi.org/10.1016/j.biombioe.2007.01.002 - ,
A Method of Energy Balancing in Crop Production and its Application in a Long-term Fertilizer Trial ,Agriculture, Ecosystems & Environment , Vol. Vol. 86 (No. 3), :303-3212001, https://doi.org/10.1016/S0167-8809(00)00286-3 - ,
Comparison of Renewable Fuels Based on their Land use using Energy Densities ,Renewable and Sustainable Energy Reviews , Vol. Vol. 14 (No. 9), :3148-31552010, https://doi.org/10.1016/j.rser.2010.07.029 - ,
A Model for Fossil Energy use in Danish Agriculture used to Compare Organic and Conventional Farming ,Agriculture, Ecosystems & Environment , Vol. Vol. 87 (No. 1), :51-652001, https://doi.org/10.1016/S0167-8809(00)00297-8 - , Direction Indirect, the Indirect Energy Requirements and Emissions from Freight Transport, Doctoral dissertation, 1998
- ,
Energy Use and Emissions by Mode (in Dutch) ,RIVM-rapport 773002007, Bilthoven , 1997 - ,
Review of Greenhouse Gas Emissions from Crop Production Systems and Fertilizer Management Effects ,Agriculture, Ecosystems & Environment , Vol. Vol. 133 (No. 3), :247-2662009, https://doi.org/10.1016/j.agee.2009.04.021 - ,
Well-To-Wheels Analysis of Future Automotive Fuels and Powertrains in the European Context--WELL-to-WHEELS Report Version 2c, Joint Research Centre of the EU Commission , 2007 - , , 2014
- ,
Ecological Restoration of Rich Fens in Europe and North America: from Trial and Error to an Evidence-based approach ,Biological Reviews , Vol. Vol. 90 (No. 1), :182-2032014, https://doi.org/10.1111/brv.12102 - ,
Forest Energy Potential in Europe (EU27) ,Finnish Forest Research Institute, Vantaa , 2008