


The world currently uses fossil fuels like oil, coal and natural gas for its energy demand. Fossil fuels will get too expensive or too environmentally damaging to retrieve [1]. An increase in air pollution has been and is still detected for most parts of India and China [2] due to a drastic increase in energy consumption [3]. Renewable energy resources like wind, wave, current and solar energy will never run out. Oceans cover more than 70% of the earth's surface. Research in ocean wave energy, tidal energy, and offshore wind energy has led to promising technologies and, in the cases of offshore wind energy, to an increasing commercial deployment [4]. These renewable energy technologies have the potential to help protect and potentially lower the adverse effects on global climate [5]. But since the ocean environment is an important habitat, this living space has to be protected while these technologies are developed. With regards to that offshore wind farms with marine growth on their steel structures build an artificial reef which increases and develops marine life (mammals, seals, fish population) [6]. Nevertheless especially offshore wind energy is an environmentally friendly energy harvesting method due to its significantly higher wind speed and capacity factor [7].
The article focusses on wind, wave and current energy in water depths up to 30 m including the technologies used to measure data. Due to the relatively low water depth, a promising new approach of using thermal differences in the ocean will be circumvented. Currently existing methods of gathering wind and wave data rely, if not measured offshore, on computations and models such as GEOS-5 data [8]. Accuracy and reliability [9] are two of the main issues that models and computations have to face. With regards to accuracy, it has been shown [10] that reanalysis data can underestimate wind speeds and hence lower the expectations. These uncertain representations of “true” wind speeds [11] cause deviations in Annual Energy Production (AEP). Efforts have been made to improve the accuracy of reanalysis data [12], with the limiting factor of having measured data available which can be used for model calibration. Besides using reanalysis data it was shown that networks of sounding stations can be used [13]. Comparison to other techniques revealed that these results are again lower, which means that the underestimation described in [10] increases. Another approach by Kubik et al. [14] compared available raw mast data with simulated reanalysis data. As conclusion they have stated that “raw reanalysis data may offer a number of significant advantages as a data source”. In contrast, Mo et al. [15] concluded that using only reanalysis data, it is possible to update existing wind maps with regards to extreme wind speeds. In parallel with the use of reanalysis data for meteorological parameters, Peres et al. [16] have been successfully using reanalysis data in combination with neural networks for the record extension of significant wave data. Lange et al. used reanalysis data ocean circulation models in comparison to satellite scatterometry ending with the conclusion that the differences in using the data sources “have important implications for regional ocean dynamics and modelling” [17]. The spatial variation [18], a problem fixed metocean stations have to face, is an advantage of floating Light Detection and Ranging (LiDAR) Systems.
This article, in accordance with [17], proves that measurements offshore are necessary and reanalysis data can only be used to fill gaps and extend, not replace, the time series.
The importance of measurements with regards to wind or wave energy is well understood. Once the wind farm is built and the first turbines are converting energy, the owners are interested in its performance. Therefore the so-called performance measurements are set up and carried out, comparing the potential wind energy which could have been achieved with the actual energy fed into the grid or wind farm system. The base for the potential energy calculations is metocean data such as wind speed, relative humidity, pressure and temperature (the latter three parameters for compensation purposes).
These parameters are recorded by instruments mounted on the metocean station at the respective height. In case the metocean station’s layout has been designed in relation to the used wind turbines and these have not changed throughout the planning process – the met mast is usually installed up to five years before the first turbine is erected – the measurements are carried out at hub height. Due to the fact that the aforementioned problems may occur, the metocean station is not able to measure at hub height, which in turn is favourable for a LiDAR device that offers measuring heights between 10 m and 300 m (Zephir LiDAR). Adding a LiDAR to an existing metocean station allows measuring on the lower and upper tip height as well, which adds more data to wind shear profiles.
Additionally wave measurements are a key element in designing the entire wind farm. Parameters usually recorded are wave length and period besides wave height and tide levels. All mentioned parameters are used creating a load profile which is in turn used by civil engineers for the design of the wind turbine (steel thickness, foundation length, depth the foundation needs to be hammered into the seabed). Besides planning, the wind farm wave measurements are also used during the construction as well as operation and maintenance after construction is finished. Jackup barges, floating platforms with up to 50 m long feet that can be let down onto the seabed lifting the platform, are a convenient solution for constructing wind turbines offshore. Even for these stable barges there are limiting parameters like wave height, which can stop construction and therefore need to be monitored 24/7.
Offshore metocean stations are a key driver during the planning process, are helpful while constructing the wind farm and are not only supporting the operation and maintenance but also the performance and its increase during the lifetime of a wind farm.
The area of interest covers the wind speeds within the entire rotor operating range of the future wind farm. With planned hub heights of approximately 90 m and a rotor diameter of approximately 130 m, the measuring range extends from 30 m up to 160 m above sea level. Therefore the current given options are either a conventional buoy with wind sensors or a conventional met mast.
A conventional buoy with wind sensors will detect the wind climate near the ocean surface with maximum measuring height of up to 10 m. The data may get influenced because of the motion of the buoy in case no passive gimbal system is used. The bigger issues will be the prognosis of the wind speed and direction in hub height of the planned turbine as, even if multiple measurements are recorded within 10 m, there is a lack of data while calculating the shear profile up to hub height. The prognosis error will extend thresholds because of a lack of data about the thermal layering.
A met mast can cover the whole area with wind sensors, but often such a construction is not realized for economic reasons. Safety instructions and conditions regarding altitudes of more than 100 m above sea level are considerable and lead to a further dramatic price increase of the construction. Therefore it is often recommended to stay below 100 m.
The basic design should include the highest measuring altitude at hub height of future wind farms (see Figure 1). In addition to wind climatologic data (wind speed, wind direction, air pressure, temperature and atmospheric humidity), oceanographic data (wave height, wave period, tide level amongst others) is captured. A triangular mast design is a good and established option, although some metocean stations use square lattice masts without any negative impact. The top has to be equipped with one or two anemometers measuring at hub height, though the top wind vane has to be installed within 10% of the hub height. At the wind vane level the other control anemometer(s) should be installed. Getting nearly IEC 61400 compliant data the following parameters should be measured too: the atmospheric pressure and temperature, which are usually mounted on top of the mast (around hub height) and at the mast platform (usually in the range of 25 m to 30 m above sea level). Different measuring levels equipped with wind speed and wind direction sensors will complete the figure to get reliable shear profiles. At specific metocean station setups there are additional and varying sensors used: ultrasonic anemometers have proven to cause high maintenance in some cases although once working, they deliver scientifically useful data (heat flux for example).
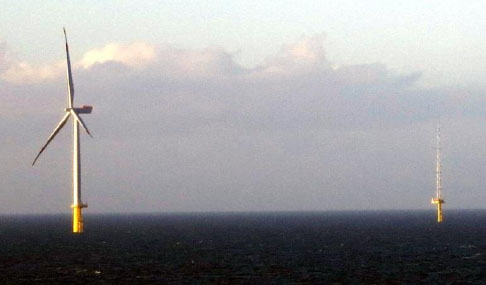
Metocean station and wind turbine in the North Sea
The anemometers, except the top anemometer, are placed on horizontal booms which have to be mounted in a way that the influence by the mast is minimised, although the booms still need to have the required stability. Furthermore it is essential that the measuring devices can be hauled in for maintenance without heavy equipment because this can be time-consuming and distract workers from their planned jobs. Therefore retractable and hinged booms are often of great convenience. The booms have to be made of a round profile, the boom length should be a least 3 times the mast diameter. The length of the vertical booms should be 25 times of the horizontal boom diameter. The data cable should run inside the vertical boom including the connector, as especially on lower booms and on metocean stations close to shore (up to 25 km), birds usually land and sit on the booms, picking cables and destroying connectors.
Successful development of wind power should be based on information on wind speed and wind direction even in heights above the hub height of the planned turbines. Nowadays those hub heights vary between 70 m and 115 m. Covering the range of 200 m or up to 300 m, it is important to use new observation methods and strategies as conventional metocean stations will be too expensive. A promising concept for wind energy purposes is the remote sensing technique: the most interesting device which is used offshore on some metocean stations is the Lidar, based on laser Doppler scatterometry.
A Lidar is an optical remote sensing device that can measure the speed of a particle. The air contains those particles which are illuminated with laser light, the reflected signals (backscatter) are detected by the Lidar. The evaluation of those signals delivers information about the wind speed and wind direction in heights from 10 m up to 200 m – 300 m above the device (depending on the model/manufacturer). Lack of experience still limits the use of Lidars despite its potential cost savings. While uncertainty of Lidars in flat terrain is well documented, there are few campaigns done in complex terrain or offshore, although organisations as the Offshore Wind Accelerator (OWA) have supported use of Lidars offshore. The results are very promising, but to get the project bankable conventional sensors are still needed. Lidar uncertainty also relates to the deployment, processing and analysis of data. When Lidars will be incorporated into best practices and standards like MEASNET, IEA and the IEC 61400-12 the price of metocean stations can drop because of reduced steel, its construction and operation. Dogger Bank metocean stations have been dismantled for maintenance while a Lidar, sitting on the platform of one of the masts, continued measuring [19]. Despite the result that the Lidar measured continuously and with little deviation to the metocean stations, Lidars are still not industry standard and not part of e.g., the IEC 61400.
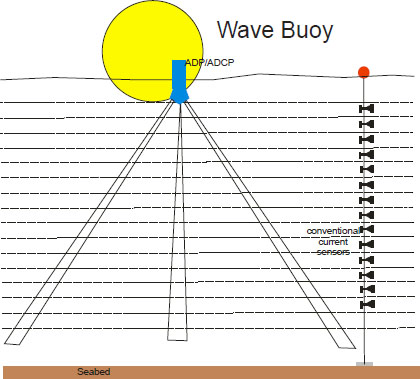
In addition to wind sensors at metocean stations, wave sensors are used. Established measuring methods are Acoustic Doppler Profiler (ADP) (see Figure 2), a directional buoy, an array of pressure-sensors or an echo-sounder. In some cases wave radars are used as well, but depending on the power supply they are not chosen because of the energy demand: For a self-sustaining measurement station offshore it is not applicable due to its power demand. In rare cases they are used, in case of power supply by connection to the grid or additional renewable energy converters (micro wind turbine, solar panels, fuel cells).
ADP/ADCP sensor
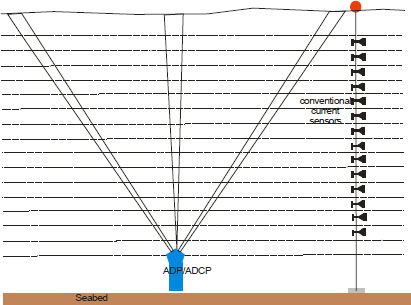
The use of an oceanographic sensor Acoustic Doppler (Current) Profiler [AD(C)P] is a working solution capturing oceanographic parameters like current (speed/direction) distribution over depth, temperature, wave height and wave direction. AD(C)P send acoustic signals and detect the backscattered signal. The devices work with three or more ultrasonic transducers. For every transducer the signals are processed and build the base for the calculation of the oceanographic data. The oceanographic data in general containing current, wave height and the wave peak period are stored. As these devices are able to measure all significant data about waves and currents, there is no need for any additional measurement equipment regarding wave energy.
Due to the attenuation of the wave induced pressure signal with depth [20], pressure based underwater measurements have to be carried out with a sensor of suited effective range [21].
The same problem applies if one chooses a pressure sensor array with at least 3 sensors. The pressure sensor array offers the possibility to get the real pressure spectrum. This time domain based information can be used to choose the right transformation into the frequency domain. This device will be strongly affected by the pressure attenuation by depth. Because of this the mounting, especially the mounting depth, of this device has to be chosen according to the expected wave length, but those arrays will not deliver any information about the current flow. Getting good directional wave information, the number of sensors has to be increased; otherwise the information is very imprecise. (e.g., 4 sensors lead to a 60° resolution) [22].
Another way to measure wave and current parameters with one device is an AD(C)P with Acoustic Surface Tracking (AST). That means that the movement of the water surface is directly measured, it is not the result of an indirect physical parameter like the pressure signal. So the AST is not subject to attenuation like velocity and pressure signals. Without any moving parts, unwanted accelerations will not occur. This stable device will not be influenced by those issues.
Wave buoys are able to measure the wave height. Specially equipped devices are able to detect the wave direction and other parameters. Buoys measure waves by integrating the vertical acceleration. These measurements could build the base for several oceanographic questions. The local oceanographic climate can be compared with other locations. The averaging time for the measurements of currents and wave parameters is an important issue, because of different project needs. The operating experience shows that a buoy is a very accurate device but expensive in comparison to other measurement techniques. A major problem can be the mooring of those devices; many buoys are lost because of destroyed anchor lines or are accidentally damaged by ships.
An echo-sounder is a device that uses sound pulses from a fixed point to a moving water surface. The pulses measure the surface elevation. This method is susceptible to spume produced by breaking waves and atmospheric inhomogeneities like fog. For accurate measurements, a reference measurement line is needed. So it is not suitable for a self-sustaining offshore application. The measured data need data transformation from the time domain into the frequency domain, since those devices are mainly designed to measure the water-level.
Depending on the metocean station there are already met masts equipped with Lidars as supporting wind sensor today. Due to the additional power consumption caused by the Lidar there are either more renewable energy converters (micro wind turbines, solar panels or fuel cells) necessary or a small power generator (diesel) can be used. Some Lidar manufacturers offer specific power packages based on renewables being able to power their device for the given location throughout the whole year, not influenced by seasons.
Space is usually limited on offshore platforms, which in turn is not favourable for an additional Lidar of roughly 1 m2 and its additional power pack of 2 m2 to 3 m2 Additional micro wind turbines, if used, also may interfere with existing ones, leading to no significant increase in power due to wake effects.
In case the Lidar fits onto the platform and into the autarkic power system it is mainly used for comparisons between data measured by the conventional sensors and the Lidar data. In some cases it is also used as redundancy for broken devices at heights which do not carry working instruments anymore. Detecting the wear and tear of conventional equipment – degradation effects – is another way of using the Lidar data.
The lattice structure is typically square or triangular with interconnections between the three or four main pipes. Depending on the location of the Lidar the lattice structure can cause backscatter which, over a certain level, can cause package loss and a lack of information, resulting in invalid data.
Conventional wave buoys including wind sensor technology, as mentioned in the section “Buoy”, are the predecessors of today’s floating Lidar technology. Though bigger, heavier and able to measure at heights up to 300 m above sea level, the principles as well as problems are similar.
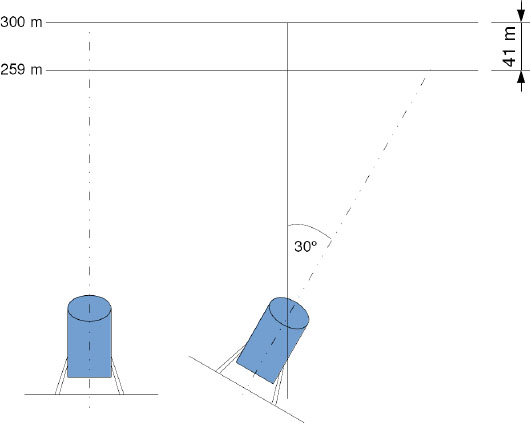
Due to the motion caused by waves and the resulting angle from perpendicular, the Lidar’s measurement heights vary depending with height from a few meters within the first meters up to 40 m at a measurement height of 300 m [see Figure 3, assumed angle due to waves (from perpendicular): 30°, resulting measurement height above sea level: 259 m (300 m level)]. There are two solutions on this issue: a passive gimbal system which balances the Lidar so that it measures perpendicular to the sea level and, as a cheaper and maintenance free alternative, a correction calculation of the data post campaign using yaw, pitch and roll data from the wave sensors. In rare cases a combination of these techniques has been used which increased the performance.
Influence of waves on Lidar measurement height
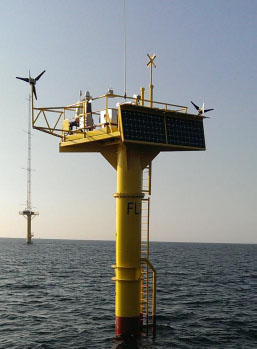
Getting rid or even minimise the movements, there is a floating Lidar developed by Babcock Marine & Technology (Figure 4) that does not tilt more than 5° even if tide and wave direction are opposing forces. Therefore there is no need for a gimbal system or post campaign calculations, the data measured can be used immediately.
Floating Lidar by Babcock Marine & Technology [23]
A floating Lidar also adds further possibilities when it comes to the measurement location. Due to its mobility it can be moved around within the wind farm and measure over a wider area of interest. In addition to that, after completion of the construction of all wind turbines, it can be used to monitor the performance of the whole farm by turbine, not only the ones surrounding a fixed metocean station.
Wave buoys, which lack current distribution information over depth and – depending on the model and manufacturer – wave direction, in combination with ADP/ADCP (Figure 5) are another advanced metocean station and complete the plain wave buoy for wave energy measurements. As there are no wind measurements recorded in this setup, an additional Lidar is an option, transforming this station into a complete floating Lidar.
Wave buoy with current sensor
Judging the importance of measurements one needs to carry out analyses comparing the measurements offshore with alternative measurements or reanalysis data, i.e. Modern Era Retrospective Analysis for Research and Applications (MERRA) data [24]. MERRA data is processed by a Goddard Earth Observing System Data Assimilation System Version 5 (GEOS-5 [8]) algorithm out of a wide range of measurements consisting of land, sea and radar data by measurement stations, planes, weather balloons, buoys, ships and satellites. The results are packages for various meteorological parameters ranging from sea levels, irradiation or – as used in the following analysis – wind speed and direction data.
MERRA data is available for the whole world in a resolution of 1/2 degrees latitude x 2/3 degrees longitude [25] stored in HDF files. It is dating back to 1st January 1979 up to 31st December 2015. There is new MERRA v2 data with a higher resolution, but has not been used for the analysis and the results shown below.
Data for the research presented in [26] has been measured at the FINO 1 measurement and research station in the German North Sea. FINO [27] is short for “Forschung In Nord- und Ostsee” (English: Research in the North and Baltic Sea) and is an institute operating three research stations (measurement masts, short met masts) in the German parts of the North and Baltic Sea.
The analysis has been performed for all three measurement stations with the result that the behaviour is similar (see [26]). Therefore only results from FINO 1 are presented in this paper.
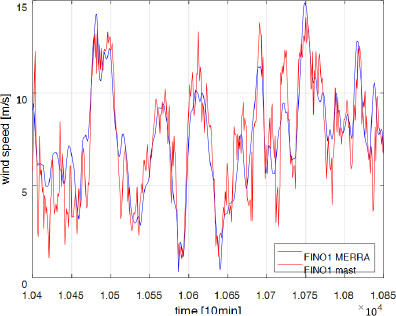
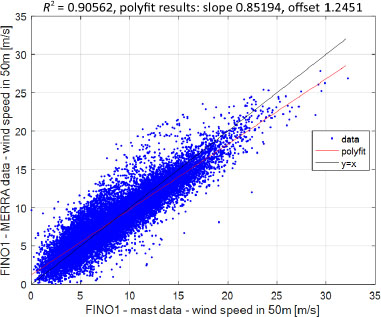
Figure 6 displays the time series of the met mast and MERRA data. It can be seen that both time series are almost congruent but differ slightly, though there is no permanent offset. The MERRA data is also smoother compared to the met mast data, consisting of less and lower frequencies. Deviations range from 0.1 m/s up to 3 to 4 m/s. For a better detection of these deviations the ratio (Figure 7) has been calculated and displayed. Though the deviations of the aforementioned 3 to 4 m/s exist, it is rather the exception than the rule. The correlation coefficient reveals the relation between both time series. With a value of 0.9 both time series are close to being called identical (0.95 to 1) but still differ greatly.
Comparison of wind speeds measured at the FINO 1 met mast with MERRA data for the closest data point around the mast
Ratio plot of FINO1 met mast and MERRA data including correlation coefficient as well as slope and offset of the polyfitted line
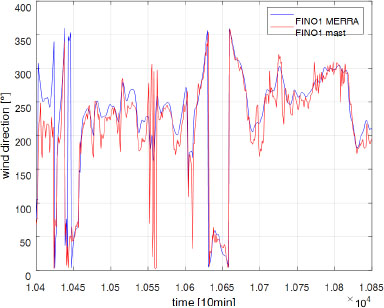
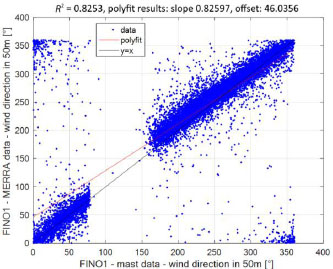
Results are worse with regards to the wind direction (Figures 8 and 9). Increased deviations within the time series are visible and are in line with the results from the correlation coefficient, slope and offset. A correlation coefficient of 0.82 is far from identical. The gap in the area of 80° to 160° in Figure 9 is due to a malfunction of the wind vane at the met mast. This data has been filtered upfront and is not part of the results. The amount of dots in the upper left and bottom right corner are a result of inaccurate alignment of the wind vane. Aligning a wind vane offshore is hard and tricky as there are no references in the landscape one can use. Hence the vanes are usually aligned to the mast centre applying an offset either in the data logger or in post processing. This means that the technician working a few meters away from the mast in up to 90 m height has to lean behind the vane pointing it as close as possible to the mast centre. This does not always work out in the most accurate way, so that offsets of 3° to 5°, worst case 6° to 10°, are typical.
Comparison of wind speeds measured at the FINO 1 met mast with MERRA data for the closest data point around the mast
Ratio plot of FINO1 met mast and MERRA data including correlation coefficient as well as slope and offset of the polyfitted line
It has been demonstrated in the above presented research results that offshore measurements of the meteorological parameters (wind speed and wind direction) are necessary, as alternatives like MERRA data (or other reanalysis data) can be used for calculating the rough wind speed distribution and prevailing wind direction, but with respect to bankable results the data differs too much from measured.
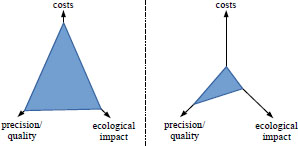
In contrast, costs and the ecological impact are far more intense in installing, operating and maintaining as well as dismantling an offshore metocean station. A steel structure rammed or hammered into the seabed is frightening to marine life and may harm the animals in the worst case. Nevertheless, research has shown that under certain conditions an increase in marine life due to the hard steel structures is possible, hence the ecological impact reduces a little.
For numerical data one may think that there is no ecological impact at all, as this data is the result of an algorithm. Data, which is fed into the system, is provided by buoys and ships as well as planes besides various other sources. These systems have an impact on the ecology.
Costs are zero (see Figure 10, right) with regards to the numerical data as the NASA is giving away MERRA data for free and one has only to provide a mail address. Installing, maintaining and operating as well as dismantling a metocean station is highly cost intensive. Due to the fact that providers of these masts do not release information on the costs, only estimations out of experience can be carried out. For an operation of 25 years, costs including maintenance, operation, installation and dismantling range from 10 to 15 million EUR.
Triple aim diagram for a conventional metocean station (left) and numerical tools (MERRA, HIRLAM, GEOS-5)
Despite some beliefs that measurement campaigns only before and during the construction of an offshore wind farm are necessary, this paper reveals the importance of wind and wave measurements after finished construction, during operation. With new technology being developed, the costs for measurements offshore decrease rapidly – compare costs for the construction of an offshore met mast (roughly 5 to 10 million EUR depending on size and equipment) with assumed prices for a floating Lidar of about 150,000 EUR.
There is always a need for wind and wave measurements offshore, being used for operation, performance, maintenance and even scientific purposes. Research in the area of heat flux (air mass movement) for example, which is assumed to increase the performance of wind turbines, is just about to start, which is the reason why data in this area are of interest for researchers. With regards to wave measurements there is a need in monitoring the wave states for load profiles, which may need to be adjusted during the turbine life cycle, turbine maintenance and cable repair or scour protection [28] (using numerical models trying to predict its extent).
Measurements on metocean stations throughout the lifetime of a wind farm are advantageous and in some rare cases already acknowledged as they are part of performance analyses in some wind farms as main source of wind speed information. An independent metocean station is the source of valid datasets which can be used for comparisons in and around the wind farm.
From a financial point of view the costs of refurbishing a metocean station, may it be at hub height only to save costs or for the whole station and operating it for additional years are often a fraction of the installation costs. The benefit though, being able to sell data for that location to existing or potential wind farm operators in that area, may already cover the expenses.
- ,
How we must Build the Electric Future ,The Journal of the International Energy Agency , (Issue 6), 2014 - ,
World Energy Outlook Special Report, India Energy Outlook , http://www.worldenergyoutlook.org/media/weowebsite/2015/IndiaEnergyOutlook_WEO2015.pdf, [Accessed: 11-May-2016] - ,
Administration ,China and India Account for Half of Global Energy Growth through 2035 , https://www.eia.gov/todayinenergy/detail.cfm?id=3130, [Accessed: 11-May-2016] - ,
Results and Conclusions of a Floating-lidar Offshore Test, EERA Deep Wind’2014, 11th Deep Sea Offshore Wind R&D Conference ,Energy Procedia , Vol. Vol. 53 , :156-1612014, https://doi.org/10.1016/j.egypro.2014.07.224 - ,
The Role of Renewable Energy in Climate Stabilization: Results from the EMF27 Scenarios ,Climatic Change , Vol. Vol. 123 (Issue 3), :427-4412014, https://doi.org/10.1007/s10584-013-0924-z - ,
Short-term Ecological Effects of an Offshore Wind Farm in the Dutch Coastal Zone: A Compilation ,Environmental Research Letters , Vol. Vol. 6 , :035101:132011 - , Wind Turbines – Fundamentals, Technologies, Application, Economics, 2013
- ,
The GEOS-5 System , http://gmao.gsfc.nasa.gov/GEOS/, [Accessed: 10-May-2016] - ,
Effects of Different Wind Data Sources in Offshore Wind Power Assessment ,Renewable Energy , Vol. Vol. 77 , :101-1142015, https://doi.org/10.1016/j.renene.2014.12.009 - ,
Quantifying Sources of Uncertainty in Reanalysis Derived Wind Speed ,Renewable Energy , Vol. Vol. 94 , :157-1652016, https://doi.org/10.1016/j.renene.2016.03.028 - ,
What can Reanalysis Data Tell us about Wind Power? ,Renewable Energy , Vol. Vol. 83 (Issue C), :963-9692015, https://doi.org/10.1016/j.renene.2015.05.027 - ,
Extreme Values Analysis for estimating 50 Year Return Wind Speeds from Reanalysis Data ,Wind Energy , Vol. Vol. 17 (Issue 8), :1231-12452014, https://doi.org/10.1002/we.1630 - ,
Evaluation of Global Wind Power ,Journal of Geophysical Research , Vol. Vol. 110 (Issue D12), 2005, https://doi.org/10.1029/2004JD005462 - ,
Exploring the Role of Reanalysis Data in Simulating Regional Wind Generation Variability over Northern Ireland ,Renewable Energy , Vol. Vol. 57 , :558-5612013, https://doi.org/10.1016/j.renene.2013.02.012 - ,
Estimating the Extreme Wind Speed for Regions in China using Surface Wind Observations and Reanalysis Data ,Journal of Wind Engineering and Industrial Aerodynamics , Vol. Vol. 143 , :19-332015, https://doi.org/10.1016/j.jweia.2015.04.005 - ,
Significant Wave Height Record Extension by Neural Networks and Reanalysis Wind Data ,Ocean Modelling , Vol. Vol. 94 , :128-1402015, https://doi.org/10.1016/j.ocemod.2015.08.002 - ,
Evaluation of the Wind-resource Estimation Program WAsP for Offshore Applications ,Journal of Wind Engineering and Industrial Aerodynamics , Vol. Vol. 89 (Issues 3-4), :271-2912001, https://doi.org/10.1016/S0167-6105(00)00082-9 - ,
Evaluation of the Spatio Temporal Variation of China’s Offshore Wind Resource based on Remotely Sensed Wind Field Data ,Renewable and Sustainable Energy Reviews , Vol. Vol. 24 , :142-1482013, https://doi.org/10.1016/j.rser.2013.03.058 - ,
Dogger Bank Lidar confirms Technology meets Met Masts for Wind Data Collection, ZephIR Lidar , http://www.zephirlidar.com/dogger-bank-lidar-confirms-technology-meets-met-masts-for-wind-data-collection/, [Accessed: 26-January-2016] - , Acoustical Oceanography, Principles and Applications, 1977
- , Oceans and Coasts (in German), Fachbereich Physik, 2003
- , Introduction to Physical Oceanography, Department of Oceanography, 2006
- ,
Rosyth Business Park, Rosyth, Dunfermline, Fife, KY11 2YD , - ,
- ,
, http://gmao.gsfc.nasa.gov/research/merra/intro.php, [Accessed: 24-March-2016] - ,
Offshore Wind Energy Development based on Merra Data ,Proceedings of the 10th Conference on Sustainable Development of Energy, Water and Environment Systems, SDEWES 2015.0910 , 1-172015 - , Weather and Climate out of one Hand, “Deutscher Wetterdienst - Wetter und Klima aus einer Hand, Das Projekt FINO-Wind” (in German)
- ,
The Effects of Scour on the Design of Offshore Wind Turbines ,Delft University of Technology , http://ocw.tudelft.nl/fileadmin/ocw/courses/OffshoreWindFarmEnergy/res00076/Scour___MAREC_2004.pdf, [Accessed: 26-January-2016]