


The existing buildings in the campus of the studied case were mainly built in the 1960s, and therefore are facing the need for renovations [1]. Concurrent with the renovation, the sustainable campus development requires to improve the energy efficiency of the buildings, and to develop the functionality of the properties to meet the current requirements. Moreover, the city where the campus is located has several plans to promote renewable energy, carbon neutral scenarios, or sustainable urban planning. Thus, the campus is also required to take into account and implement possible strategies related to energy efficiency issues [2]. One of the advantages for campus buildings is the possibility of actions which are taken not for a single building, but for a group of buildings. Moreover, the Green Guide for Universities, which is published by International Alliance of Research Universities (IARU) [3], clearly says that energy consumption of campus buildings can be the main target for campus sustainability. It suggests that establishing energy measures by installing effective metering technology is key to identify infrastructure and effective operation strategy to improve energy efficiency of campus buildings. There are a lot of academic and practical challenges. For example, Agdas et al. [4] assessed the campus buildings by Leadership in Energy and Environmental Design (LEED) to build the sustainable policies. Eriksson et al. [5] analysed the ongoing progress of campus retrofitting at three university campuses. In the case of China, Tan et al. [6] conducted the green campus initiative which carried out energy- and resource-efficient campus development. The series of these studies suggest that new energy planning methods for existing campus building stocks are greatly required. This research work, therefore, establishes a feasible methodology to utilize available big database in terms of energy use in a campus seeking appropriate technical solutions, and develops an on-site energy distribution model by combining with the optimisation method (Multi-Objective Building Performance Optimization Software -MOBO). Moreover, the campus development can be a pilot site to test or demonstrate advanced technology applications or the innovative concept of spatial planning as a part of the city. Sustainable campus development can enhance the transition toward carbon neutral urban development or renewable energy based district development. Thus, this research work tested the concept of distributed energy system and the potential of energy efficiency improvement ideas for existing campus building stocks by utilizing measured energy data resources.
The Energy Performance of Buildings Directive (EPBD) requires all new buildings to be nearly Zero Energy Buildings (nZEB) by 31.12.2020 in the context of energy challenges in Europe [7], [8]. However, achieving the energy balance status in ZEB without grid support would be quite difficult. The study, thus, focuses on the boundary of the buildings, so that it is not limited to only single building but spans a cluster of buildings, the so called “energy community”. The Distributed Energy Systems (DESY) project [9], which was a R&D program for local energy systems in Finland, defined local district energy as “sustainable hybrid energy production using local renewable energy sources”. DESY also took into account that energy production in several countries is nowadays too dependent on external factors. Walker et al. explored whether the provision of community benefit was associated with increased local support for a hypothetical, future offshore wind farm in Exmouth, UK, using an experimental methodology [10]. Previous studies [11], [12] by one of the present authors clarified that energy sharing has the potential to reduce primary energy consumption by considering a combination of different building types such as office, hotel, hospital or commercial buildings, and Combined Heat and Power (CHP) size and operation. The case study was focused on Japanese buildings. Thus, in this research work, Finnish buildings which connect to district heating network were examined as a case study.
This research describes the potential study of on-site energy management and operational strategies of existing campus buildings on their impact on energy improvements. Using an optimisation approach, the feasibility of local energy management among buildings which connect to district heating network was studied.
The domain of this case study is the campus buildings of a Finnish University. The campus includes more than twenty buildings (Figure 1). Both electricity and heat in the campus are supplied through commercial grid and district heating network by a private energy company.
Building layout in the campus
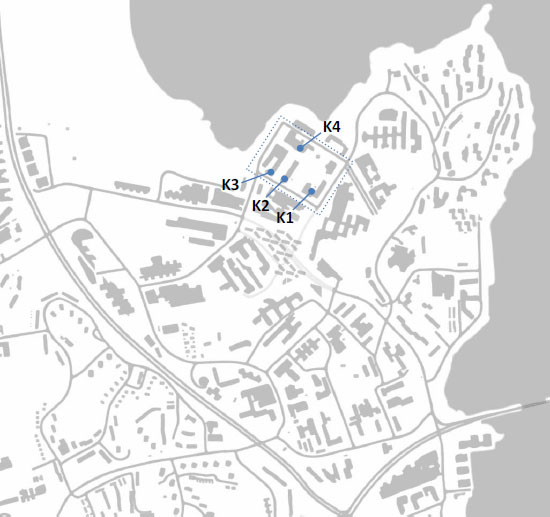
Considering the possibility of integration by local energy grid, four campus buildings (K1, K2, K3, and K4) in the same block are selected for the case study (Figure 1, Table 1). All buildings were constructed in the 1960s. K1 building has research and teaching facilities for Mechanical and Energy Engineering and Engineering Physics and Mathematics. Some academic and student service facilities and restaurants are located in this building. There are main entrances under the great lecture hall, a spacious staircase of three floors, and the lecture and seminar rooms and meeting rooms around it. K2 building also has research and teaching facilities for Mechanical Engineering. There is a large machine hall space in the building that is equipped with a gantry crane. K3 building has the Mechanical Engineering Faculty including several machine halls. The spaces for teaching and research personnel are located around the main corridor. Other spaces include hall-like laboratories with a crane runway and other devices typical of machine halls. K4 building is one of the four Mechanical Engineering buildings. Mechanical Engineering Flow Laboratory and several work halls are located in K4 building. According to the difference in space use of each building (Table 2), the demand profiles are different. The energy data, which are used in this study, are hourly data of electricity and heat from district heating network, which were measured in 2012.
Specifications of the buildings [13]
K1 |
K2 |
K3 |
K4 |
|
|---|---|---|---|---|
Year of completion |
1966 |
1965 |
1968 |
1967 |
Year of renovation |
2003 |
1987 |
||
Gross building area [m2] |
8,616 |
9,700 |
7,229 |
9,165 |
Energy sources |
District heating |
|||
Facility functions |
Teaching, research and office (details in Table 2) |
|||
Energy class |
D |
G |
F |
E |
Electricity demand [MWh/a] |
764.2 |
383.8 |
945.7 |
643.3 |
Heat demand [MWh/a] |
817.6 |
862.9 |
1,581.8 |
1,760.5 |
Space use of each building
[m2] |
K1 |
K2 |
K3 |
K4 |
|---|---|---|---|---|
Office |
2,498.9 |
414.2 |
1,085.2 |
867.8 |
Classroom |
1,540.7 |
42.5 |
412.8 |
163.1 |
Research facility |
52.3 |
154.1 |
300.4 |
237.5 |
Laboratories |
72.7 |
288.2 |
912.3 |
853.5 |
Stores |
182.5 |
231.5 |
854.1 |
1,517.8 |
Industrial facilities / research halls |
0.0 |
906.7 |
1,269.8 |
1,078.4 |
Corridors, lobbies, (excl. stair rooms) |
1,703.7 |
374.3 |
653.3 |
957.1 |
Restaurants and kitchens |
119.8 |
0.0 |
0.0 |
0.0 |
Technical facilities, cleaning and property maintenance |
478.7 |
119.5 |
299.4 |
669.5 |
Special facilities |
0.0 |
0.0 |
25.6 |
14.9 |
Toilet, rest and social facilities |
445.1 |
167.6 |
223.6 |
175.8 |
Housing |
102.0 |
0.0 |
63.2 |
0.0 |
Room floor area in total |
7,196.4 |
2,698.6 |
6,099.7 |
6,535.4 |
Generally, the amount of energy use is determined by power of the system (kW), operating hours (h) and spatial volume to control (m2). Thus, the operation period and space use efficiency are selected as focal points to reduce energy use. To understand current situation of campus buildings, short surveys were carried out at K4 building in December 2013, and at K1 building in January 2015. Four thermometer devices with data logger were distributed and used to measure the indoor air temperature and relative humidity at 10 minutes interval. The rooms are office space, lecture hall and lobby space near the building entrance. The measurement was carried out on both weekdays and weekends. Figure 2 shows the result of the air temperature trend. Working hour is mainly from 8:00 to 16:00, or 9:00 to 17:00 (8 hours). However, the heating systems are operated 24 hours to keep indoor climate stable even in weekends and holidays. Thus, the optimal HVAC control considering actual use of space and working hours have potentials to reduce energy use.
Indoor climate of rooms in K4 building
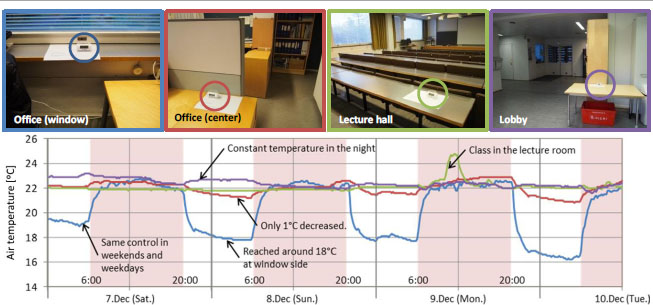
All four buildings, which are connected to the district heating network, are heated based on the occupational space. The open hours of the lecture room are mainly from 8:00 to 18:00 on working days. According to the room booking system, averaged occupied hour of the lecture room is four hours (min. 2.8 hours and max. 6.6 hours). It means that the rooms are not always active but controlled with the same temperature.
Improving the space use efficiency by managing room from low active rooms to higher active rooms and aggregating active space, space heating controls in inactive rooms can be moderated and energy reduction is expected. Thus, in this study, “operation period” and “space use efficiency” are focused to find the potentials for energy reduction. It requires occupant (mainly University staff and students) participation to change their passive attitude in constant operations into active attitude in flexible operations. Thus, new dialogue with occupants in terms of indoor climate and HVAC controls using information of invisibles (air, heat and electricity) is needed to acquire their active commitment.
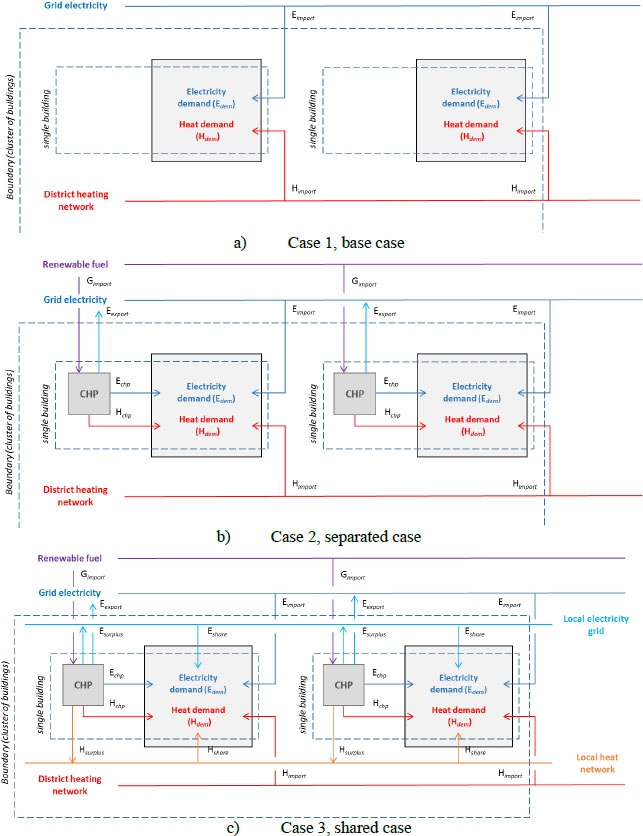
In order to investigate the impact of on-site energy generation and sharing, three cases were prepared (Figure 3). Case 1 as base case, which is based on measured results in 2012, Case 2 as separated, which means that on-site energy management separated without the sharing of surplus energy, both electricity and heat, among buildings, and Case 3 as shared, in which on-site energy management with sharing energy among buildings. It means that the surplus energy of the CHP can be shared to neighbour buildings. Case 1 as a “base case” means the current situation, in which the buildings do not have any on-site generation technology such as CHP and all electricity demand is covered by the grid supply and all heat demand is covered by district heating network. In Case 2, the buildings are able to have on-site CHP and generate both electricity and heat. Surplus electricity can be sold to the grid but surplus heat is exhausted to the air. Deficit electricity is covered by the grid and deficit heat is covered by district heating network. Moreover, the Case 3 can be shared surplus energies (electricity and heat) that can be shared among buildings if there is some energy deficit situation. The use of thermal energy storage is not discussed in this paper in order to study the impact of energy sharing among buildings in particular.
Energy flow of each case
In order to study the energy balance among buildings in the boundary by the on-site energy model, which was developed in the previous study by the authors [11], [12], was used in this research. To consider the Finnish energy infrastructure, the calculation of heat supply for deficit heat demand is replaced the supply by district heating network instead of local gas boiler. Primary energy factor are used the values shown in Table 3. Renewable fuel in this study is, for example a kind of biomass based fuel. In this study, the effect of selling the surplus electricity to the grid is not taken into account because the focus is not zero energy balance through the year but the on-site energy generation and consumption. The surplus heat from CHP, which does not meet the requirement from other buildings at the moment, is exhausted. Also, storage effect is not considered in this study.
Primary energy factors [14]
Electricity from the grid |
1.7 |
Heat from district heating |
0.7 |
Renewable fuels used in the building |
0.5 |
The Multi-Objective Building Performance Optimization Software (MOBO) [15] was used in the optimization. Two optimizations were done, namely minimize annual Primary Energy (PE) consumption in case of buildings separated (op.sep) and that of sharing energy among buildings (op.shr). The parameters of NSGA II are 50 population and 100 generation, totally 5,000 calculation. The objective of the optimisation is minimising the total primary energy consumption (kWh) of the four buildings. CHP capacity (kWe) of each building as design variable is prepared as per 11 discrete values (0, 50, 100, 150, 200, 250, 300, 350, 400, 450 and 500). When the value is 0, it means the building has no CHP.
Table 4 shows the results of optimisation. The optimisation result of the separated case (op.sep) shows that primary energy consumption is 77% of the base case (base) based on distributing on-site CHPs in every building. Moreover, by sharing energy within four buildings, the primary energy is 65% of the base case. It means that the balances of surplus and deficit electricity and heat are managed and reduce the reliance on the energy infrastructure. Thus, the on-site energy management has positive potential to reduce primary energy consumption within the boundary.
Results of optimal CHP combinations and annual primary energy consumption
CHP capacity [kWe] |
Primary energy [GWh/a] |
|||||||
|---|---|---|---|---|---|---|---|---|
K1 |
K2 |
K3 |
K4 |
Separated |
Sep/base |
Shared |
Shr/base |
|
Base |
--- |
--- |
--- |
--- |
246.9 |
--- |
246.9 |
--- |
op.sep |
100 |
50 |
100 |
100 |
189.8 |
0.77 |
160.3 |
0.65 |
op.shr |
0 |
500 |
0 |
0 |
299.9 |
1.21 |
125.3 |
0.51 |
The result of sharing optimization (op.shr) is one 500 kWe CHP at K2 building and the primary energy can be reduced by 49% by sharing surplus energy among buildings. However, the combination of on-site CHP in op.shr does not have any positive advantage to reduce primary energy consumption “without sharing”. The primary energy consumption increases by 21% compared with the base case. The results suggest that on-site energy generation has potential and it is more effective by sharing energy. Therefore, the sharing possibility can be one of the key issues when on-site energy systems are planned.
Figure 4 shows the result distribution of candidates which are collected through optimisation process. The x-axis indicates the expected reduction ratio of separated case (Case 2) compared with base case, and y-axis is that of shared case (Case 3). The value 1.0 indicates the primary energy of the base case. Candidates are located in the first and fourth quadrants (I, IV) more than the second and third quadrants (II, III). It means that on-site energy generation does not always have positive merit in terms of primary energy consumption. The distribution layout shows that the best solution of sharing optimisation case (op.shr) is located in the fourth quadrant (IV). The on-site energy generation has advantage by integrating buildings and sharing energy, and disadvantage by separating buildings and without sharing. Some solutions are located in the first quadrant (I), which means all on-site energy generation of these candidates cannot be expected. Since most of the solutions are located in the third and fourth quadrants (III, IV), energy sharing has effective results for on-site energy systems. Therefore, the concept of energy community has positive impact for approaching zero energy status by sharing energy among buildings.
Distribution of candidates, primary energy reduction in Case 2 (separated case) and Case 3 (shared case) compared with Case 1 (base case)
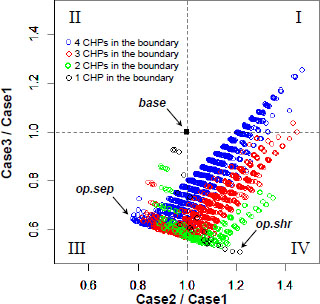
Figure 4 also shows the influence of capacity distribution and primary energy reduction. Black circles indicate the results of one CHP in the boundary, green circles show those of two CHPs, red circles show those of three CHPs, and blue circles show that four CHPs, which means each building has CHP. The larger number of CHPs is the smaller primary energy consumption in separated cases (Case 2). On the other hand, the smaller number of CHPs is the smaller primary energy consumption in shared cases (Case 3). Capacity distribution is one of the influential factors for primary energy consumption by on-site energy generation and integration. Moreover, in Case 2, if the number of CHP units is less than the number of buildings, it means that some buildings are supplied energy from the grid and district heating network. Thus, in case of a single building boundary, on-site generation has potential to reduce primary energy consumption. It is because the primary energy factor of CHP operation is less than the grid electricity and district heating network.
Space is heated extra hours before and after the working hours. Pre-heating is within 2 hours in the morning. By minimizing the amount of heating hours that are needed within the working hours, heating energy reduction can be expected. Furthermore, if considering the lowest daily average outdoor temperature to start space heating was changed to be 1 °C lower, Heating Degree Day (HDD) is expected to be reduced by 11.2%, and 16.8% in case of 2 °C lower (Table 5).
Impact of space heating demand by considering the lowest daily average outdoor temperature to start space heating service
Base |
−1 °C |
−2 °C |
|
|---|---|---|---|
Daily average outoor temperature |
17 |
16 |
15 |
HDD |
3,797 |
3,371 |
3,159 |
Heating demand |
--- |
−11.2% |
−16.8% |
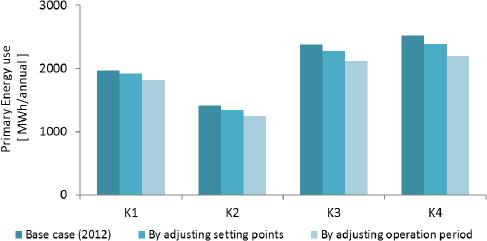
The impact on primary energy spending is estimated with four selected campus buildings; K1, K2, K3, and K4 buildings with information of audit results (2012) on the wall. Figure 5 shows the energy saving impact by adjusting HVAC setting points based on a 3 to 5% reduction, and additionally by adjusting the heating period from 14 to 9 hours. According to the results, 8 to 13% reduction of total energy use is expected. It means that all four buildings have potential to reduce energy use for space heating. Since these strategies for improving building service system were adopted considering the space use of each building shown in Table 2, the difference of expected reduction percentage is caused by the difference of space use share of each building. By investigating inactive rooms or considering space use efficiency, additional possibility of primary energy reduction can be expected.
Primary energy use reduction by HVAC control
The form of energy, which is invisible, needs to be converted into information for providing a means of control interaction with occupants to acquire their understanding. If energy system control was changed without interaction, their dissatisfaction would be increased. Building energy management systems are installed in many campuses, such as “building dashboard” in the campus of Oberlin College in US [16], or “energy display” installed at the entrance hall of campus buildings in Otaniemi campus of Aalto University in Finland, which is a study case of this research work. However, providing energy information of campus buildings is not enough to enhance students’ decision making for their energy use changes. This proposal part involves ideas to reduce energy for space heating and method to disclose environmental information to occupants.
The proposed idea, “Energy dialogue with invisibles” consists of three steps:
Implement flexible HVAC control adjustment considering the operation period and space use;
Measure and provide environment information;
Enhance to change energy attitude of the occupants.
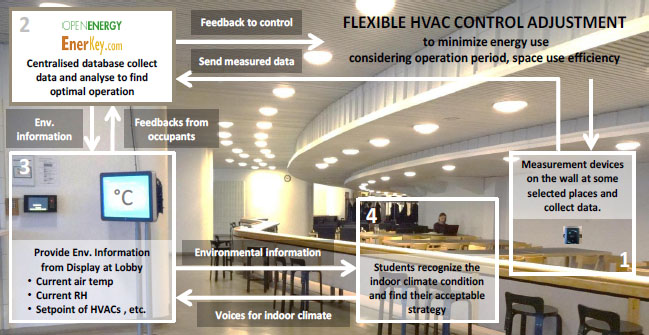
If occupants recognize indoor climate conditions and are involved in HVAC control decision, then optimal control can be realized and their energy behaviour can be developed. The following four steps, which are shown in Figure 6, are the conceptual flow of “Energy dialogue”:
Measure indoor climate conditions: Wireless sensors in the occupational spaces measure the indoor climate where HVAC control strategy are changed or modified (e.g. lecture hall, lobby, PC spots, etc.);
Manage measured data: Wireless sensors send measured data to centralized database for analysis to find optimal control strategy considering current situations;
Provide indoor climate information via lobby displays: Environmental information from database is presented on the lobby displays which are already installed in several buildings by the properties company. It can be a good opportunity to browse lobby displays frequently by occupants (students and staff);
Feedback from occupants: Occupants can recognize indoor climate conditions and post their voices and requests to change or keep the conditions. This progress can be the start of “Energy dialogue” between occupants and HVAC control.
Image of information system for “energy dialogue”
Environment information can be a good start to have “Energy dialogue” with occupants to acquire deeper understandings and connect to their actual behavioural changes and active commitment to campus energy. Combined with various activities, acceptable indoor climate with minimal energy use would be realized.
In the campus, implementing sustainable campus development is a good opportunity to develop students’ behavior, thus, the energy dialogue can be integrated into the sustainable campus development activities. Energy dialogue is the first trigger to think campus energy as a personal problem and make good decisions for suitable behavior. Moreover, using environmental information and energy dialogue can be applied to academic educational programs such as courses of School of Engineering, School of Architecture or other schools.
In this work, the potential of the impact of energy improvements of existing campus buildings by on-site energy management and operational strategies was studied. Using optimisation approach, the optimal CHP capacity, distribution and operation mode for minimizing annual primary energy consumption were simulated. The main findings are the following:
Optimisation result of separated case (op.sep) shows that primary energy consumption is 77% of the base case (base) based on distributing on-site CHPs in every building. Moreover, by sharing energy within four buildings, the primary energy is 65% of base case. On-site energy generation has potential and it is more effective by sharing energy. Therefore, the sharing possibility can be one of the key issues when on-site energy systems are planned;
The energy saving impact by adjusting HVAC setting points are expected to have 3 to 5% reduction, and additionally by adjusting operation period, 8 to 13% reduction of total energy use are expected;
Capacity distribution is one of the influential factors for primary energy consumption by on-site energy generation and integration. In case of single building boundary, on-site generation has potential to reduce primary energy consumption. This result may be explained based on the fact that the primary energy factor of CHP operation is less than the grid electricity and district heating network. Distribution of the CHP capacities is one of the key factors for energy efficiency of the community;
Furthermore, the efficiency of district heating network is one of the related factors for total energy efficiency. The influence and benefit of on-site energy systems for district heating network will be among the coming research questions.
Echp |
Electricity production by CHP (hourly) |
[kWh] |
Edem |
Total demand of electricity (hourly) |
[kWh] |
Eexport |
Electricity export for the grid (hourly) |
[kWh] |
Eimport |
Electricity import from the grid (hourly) |
[kWh] |
Eshare |
Shared electricity among buildings (hourly) |
[kWh] |
Esurplus |
Amount of electricty surplus (hourly) |
[kWh] |
Gexport |
Renewable fuel export (hourly) |
[kWh] |
Gimport |
Renewable fuel import (hourly) |
[kWh] |
Hchp |
Heat production by CHP (hourly) |
[kWh] |
Hdem |
Total heat of electricity (hourly) |
[kWh] |
Himport |
Heat export for district heating network (hourly) |
[kWh] |
Hshare |
Shared heat among buildings (hourly) |
[kWh] |
Hsurplus |
Amount of heat surplus (hourly) |
[kWh] |
Current energy system in the campus
Optimisation case with the on-site CHPs are separated
Optimisation case with the on-site CHPs are integrated and shared
The first author would like to acknowledge the Finnish Academy (grant No.274256, “Nearly zero energy community by integrating and optimizing local energy systems”, (2014 -2017)), for partly funding this research.
- ,
Measured Energy Consumption of Educational Buildings in a Finnish City ,Energy and Buildings , Vol. Vol. 87 , :105-1152015, https://doi.org/10.1016/j.enbuild.2014.11.032 - ,
, 2014http://www.aalto.fi/en/about/reports_and_statistics/aalto_university_board_report_2014.pdf, [Accessed: 19-August-2015] - ,
Green Guide for Universities , http://www.iaruni.org/sustainability/green-guide, [Accessed: 19-August-2015] - ,
Energy Use Assessment of Educational Buildings: Toward a Campus-wide Sustainable Energy Policy ,Sustainable Cities and Society , Vol. Vol. 17 , :15-212015, https://doi.org/10.1016/j.scs.2015.03.001 - ,
Nordic Campus Retrofitting Concepts – Scalable Practices ,Procedia Economics and Finance , Vol. Vol. 21 , :329-3362015, https://doi.org/10.1016/S2212-5671(15)00184-7 - ,
Development of Green Campus in China ,Journal of Cleaner Production , Vol. Vol. 64 , :646-6532014, https://doi.org/10.1016/j.jclepro.2013.10.019 - ,
Directive 2012/27/EU of the European Parliament and of the Council of 25th October 2012 on the Energy Efficiency ,Official Journal of the European Union , 2012 - ,
EPBD Recast, Directive 2010/31/EU of the European Parliament and of the Council of 19th May 2010 on the Energy Performance of Buildings (recast) ,Official Journal of the European Union , 2010 - ,
The Distributed Energy Systems (DESY) Program , http://www.cleen.fi/en/desy, [Accessed: 19-August-2015] - ,
Community Benefits, Framing and the Social Acceptance of Offshore Wind Farms: An Experimental Study in England ,Energy Research & Social Science , Vol. Vol. 3 , :46-542014, https://doi.org/10.1016/j.erss.2014.07.003 - ,
Energy Sharing and Matching in Different Combinations of Buildings, CHP Capacities and Operation Strategy ,Energy and Buildings , Vol. Vol. 82 , :685-6952014, https://doi.org/10.1016/j.enbuild.2014.07.077 - , Advantage of Local Energy Matching and Sharing Towards Zero Carbon Community, Conference Proceedings Zero Carbon Buildings Today and in the Future 2014, 2014
- ,
- ,
FIN3 Building Code D3: Energy Efficiency of Buildings , 2012 - , New Software for Multi Objective Building Performance Optimization
- ,