


The transportation sector is responsible for approximately 24% of the World’s Greenhouse Gases emissions (GHG), while road travel accounts for three-quarters of transport emissions. Most of that comes from passenger vehicles – cars and buses – which contribute 45.1% to road travel [1]. In addition, transportation modes are responsible for more than half of global petroleum consumed [2]. In Brazil, this reality is emphasised mainly due to road transport predominance, which significantly contributes to a generally low economic and energetic performance [3] and difficulties implementing sustainable practices in developing cities [4]. In such a context, the notable influence of such displacement category on environmental impacts is confirmed.
In Brazil, transport accounts for the largest share of energy consumption, contributing to negative environmental impacts. Only in 2019, at least 196.5 million tons of CO2eq. came from transport – a 47% share of all energy emissions. These pollutants are mainly generated due to the use of fossil fuel vehicles: trucks and automobiles being the two main emitters responsible for 40% and 31% of greenhouse gases, respectively [5].
Hence, several strategies to mitigate impacts on urban zones using mobility patterns changes are reported, such as improvements in vehicles' fuel economy, emission control, and fuel changes [6]. However, it is estimated that the reduction in the fuel consumption on urban transport vehicles, despite its crescent technological evolution, will not be enough to offset the increase of more than 160% in demand for passenger and cargo transport forecasted for the period 2020–2050 [7]. In contrast to other sectors, urban mobility emissions still do not show a reduction. The sector does not present the expected level of eco-efficiency, as it continues to increase annually by 2.5%, on average per year, between 2010 and 2015 [8].
Many contributors can be associated with such circumstances, including low use of active and public modes of transport, as modal choices are often associated with socio-economic interactions [9]. Nonetheless, as widely demonstrated, mobility becomes more sustainable when the barriers to private vehicle use increase and the public transport system or other more environmentally friendly forms of displacement improve [10]. Studies related to public transport have high relevance since such shifts take advantage of an already existing infrastructure and public authorities’ involvement, as public transport is often an already consolidated service in the market with high demand [11].
Considering this multiplicity of factors, the reduction of fossil fuel consumption in urban transport vehicles with the use of alternative energy sources such as hydrogen [12] and electricity [13] is regarded as a feasible driver for reducing the sector's emissions. Once this substitution starts taking effect, public transport, in particular, can have a significant contribution, as it can reduce final energy consumption and concomitantly create a favorable condition for a sustainable urban mobility plan that lessens the use of private transport [10]. In this scenario, electric vehicles (EV) are viewed as an alternative, allowing technological evolution to diminish CO2 emissions and increase the use of natural resources, as EV can provide lower carbon emissions [14].
Indeed, this transition to electric public transport is aligned to the sustainable and smart cities trend, which focuses on the use of cleaner energy [15] and the stimuli of public transport [16]. Accordingly, studying the transition from conventional to electric transport is a good opportunity for policymakers to start erecting a smarter and more sustainable city. Emerging studies attack these issues from different fronts; Ajanovic and Haas [17] show the importance of sensitivity analysis in assessing the environmental benignity of different electricity mixes. On the other hand, Bugaje et al. call attention to renewable energy sources as a tool to provide clean energy to electric-mobility solutions based on the performance of a decentralized photovoltaic system in Kenya [18].
In this regard, Brazil emerges as a good case to analyse the transition from conventional to electric vehicles. The increase in the number of EVs in the country’s fleet could be environmentally positive and favourable, since its electric energy matrix was composed of 88.8% of electricity from renewable energy sources in 2020 [19].
Thus, a reasonable deduction is that motorized vehicles should undergo a decarbonization process, and public transport should be a priority target. One can analyse such decarbonization degree through life cycle assessment (LCA) [20]. This technique has already proved to successfully support decision-making in the urban context, especially considering that LCA is increasingly applied for impact analysis associated with transport systems [21].
Consequently, LCA studies have been developed in different contexts to support public policies formulation. The tool has been frequently used to compare motorized transport vehicles technologies [22], power sources [23], and planning or management of transport infrastructure [24]. Previous LCA studies have also focused on developed countries, comparing the use of buses with different energy sources, for instance, the use of fossil fuels compared to alternative transportation fuels like biodiesel [23] and comparisons between combustion and electric vehicles [25]. Furthermore, the field of transportation is so important that some studies have focused on using LCA for specific vehicle materials, such as the tire industry products [26].
In contrast, there is still a limited number of studies about urban-related LCA, linked to mobility [17], wellbeing [27], as well as social and territorial specificities [28]. This situation comes as no surprise since holistically evaluating the environmental impacts of land planning policies understandably complexifies an analysis. It also implies the need to consider several aspects intimately related to territorial features and production-consumption patterns [29]. Researches also call attention to this possibly occurring because environmental impacts of transportation in urban mobility are frequently overlooked. The reasons are a scarcity of appropriate assessment methods and a difficulty to capture the environmental consequences of the entire cause and effect chain at a city scale [30].
Therefore, this study aims to investigate the environmental impacts, both present and future, of changes in energy sources of buses for urban public transportation. The proposed scenarios differ depending on (1) the share of electric buses, (2) the electricity supply mix (3) the choice of liquid fuel – Diesel or biodiesel, and the latter increase in percentage added to the mix.
LCA is performed according to the international standards ISO 14040 [31] and ISO 14044 [32]. The ISO 14040 methodology sets out the framework for the LCA by defining four separate phases: (1) goal and scope definition, (2) inventory analysis, (3) impact assessment, and (4) interpretation, the latter used to revisit and refine all phases as the study develops. Conformity to accepted international standards supports the quality of the study and improves the reliability of the results. Therefore, the following subsections describe the LCA choices based on that.
The existing transport modes in Porto Alegre are buses, minibuses, shared bicycles, shared cars, and taxis [33]. There is a significant daily flow of passengers transported by bus, estimated at 22% of the passengers commuting daily in the metropolitan region in 2018 [34]. Having these data in mind, the LCA aims to generate information on potential impacts – based on a diagnosis of the public bus transport system’s current operation and the projection of potential impact reduction according to public policies addressed to the variables in the system in Porto Alegre, Brazil.
It is also worth noticing that Porto Alegre was selected because it is a metropolis located in southern Brazil, and cities can play an effective role in the global effort to comply with the Paris agreement [35]. Furthermore, Porto Alegre decision-makers are conducting a master and a mobility plan review. Some of the city council members are developing climate change guidelines, trying to align with the sustainable development goals in its strategies [34]. Moreover, the city has had since 2015 a Sustainable Innovation Zone (ZISPOA) that aims to become the most sustainable and innovative region in Latin America by 2030.
Notwithstanding, most of these initiatives have not yet gotten off the ground as the transportation sector has proven to be challenging territory for advancing sustainable development policy. Particularly in Brazil, this context is exacerbated since passenger transport is especially carbon-intensive [36]. As a result, Porto Alegre still does not have a concrete sustainability plan, limiting the scenario choices to data gathered from national policies, public procurement agreements, information from the municipality, and plans not yet implemented locally.
The LCA goal is to compare the potential environmental impacts related to the use of conventional buses (CBs) and electric buses (EBs), including the production of fuels, electricity, and batteries. The study is based on data from an existing bus lot (no. 7), with vehicle type, efficiency, and operation data provided by the local bus operator, Public Transport and Circulation Company (PTCC). Carris, a public entity licensed to provide municipal transport service, was chosen due to its quantitative influence on Porto Alegre’s fleet. There are 342 vehicles divided into 37 different lines that, in the base month of October 2018, perform 88,202 trips and transport 5,085,869 passengers [34].
Another reason for Carris selection was the provider’s close relationship with electric vehicles, having been the main testing site of the Chinese company BYD (Build Your Dreams) in 2016, which operates and implements such technologies in several cities around the world [36]. Herein, a gradual transition from the current CB to EB is assessed. Also, the gradual increase of the content of biodiesel mixed with diesel oil as provided in the CNPE nº 16 Resolution [37] is considered. Under the schedule established by the resolution, the minimum biodiesel content in the diesel oil will be increased by 1% per year until it reaches 15% in 2023, as shown in Table 1.
Moreover, based on a review of transportation electrification studies, it was found beneficial to expand the environmental impact calculations beyond just global warming potential (GWP) and to include ozone formation, human health impacts (HH) [38].
Fuel change over time according to National Regulations [%]
Year |
2020 |
2021 |
2022 |
2023 |
2024 |
2025 |
2026 |
2027 |
2028 |
2029 |
2030 |
Diesel |
12 |
13 |
14 |
15 |
15 |
15 |
15 |
15 |
15 |
15 |
15 |
Biodiesel |
88 |
87 |
86 |
85 |
85 |
85 |
85 |
85 |
85 |
85 |
85 |
Source: CNPE nº 16 Resolution [37]
Diagram of scenarios assessed in this study; Scenario 1: BAU; Scenario 2: ELE1, and Scenario 3: ELE2
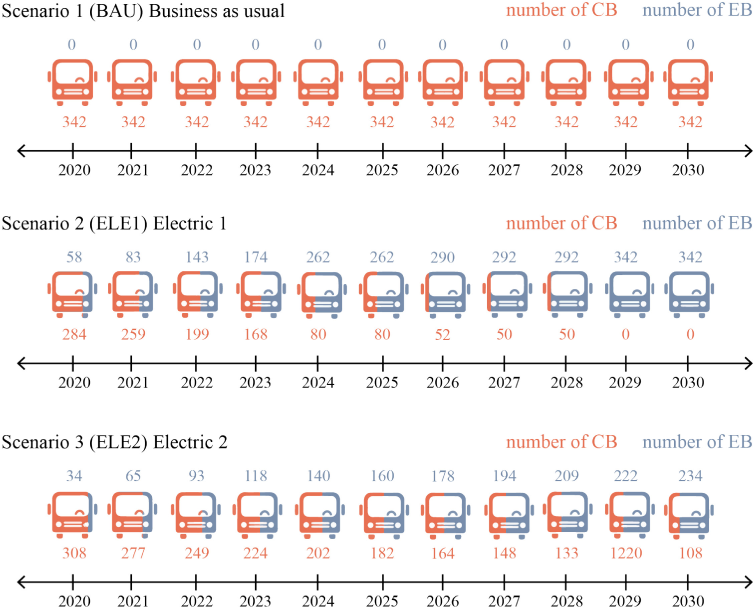
To develop the LCA, three scenarios were created to verify the operational impacts of public transport. Such scenarios were chosen due to their contribution to implementing green strategies and bringing to light the possibility of a transition to a more sustainable fleet. This occurs especially because fleet switching impacts are measured over the years.
Furthermore, operational impacts are verified through changes in the vehicle power source through the time frame analyzed. The buses examined correspond to 20.72% of Porto Alegre’s current bus fleet in circulation. The analysed scenarios are described below and represented in Figure 1, which shows changes in the bus fleet from 2020 to 2030.
Scenario 1 – BAU (Business as usual): Analysis CB use impacts considering Diesel mixed with biodiesel content as fuel, following CNPE Resolution No. 16 [37].
Scenario 2 – ELE1 (Electric 1): Scenario in which the increase of biodiesel on the mixture and the gradual replacement from CB to EB occur in parallel. As the end of life of the vehicle is 14 years [39], a total replacement of the fleet to EB occurs in 2029.
Scenario 3 – ELE2 (Electric 2): Scenario in which the increase of biodiesel and the replacement of 10% per year from CB to EB happen, under Public Competition Notice No. 01/2015 – SMT [40] following two criteria: (i) renewal of at least 10% of the total fleet each year; (ii) maximum average age of the fleet of 5 years.
It is also worth mentioning that the evolution of electric power generation over the years in Brazil was taken into account. This is due to the great importance of assessing the environmental impacts of different alternative scenarios, not only of fuel consumption but also of the contribution of different energy sources in Brazilian conditions. The estimated prognosis of the share by source in total electricity generation in Brazil was based on data provided by the Climate Centre [19], represented in Table 2.
Finally, it is worth pointing out that the study does not consider the possible need for growth in the vehicle numbers due to unexpected demand. Such a decision was made considering the complex analysis that would be needed for such projection and the lack of data available at the time of the execution of this analysis. It is also essential to add that bus lifespan and battery replacement in EB were included in the scenarios [41].
Estimated share by source in total electricity generation [%]
Year |
2020 |
2021 |
2022 |
2023 |
2024 |
2025 |
2026 |
2027 |
2028 |
2029 |
2030 |
Sugarcane |
1.2 |
1.2 |
1.2 |
1.3 |
1.3 |
1.3 |
1.6 |
1.8 |
2.0 |
2.3 |
2.6 |
Bagasse |
8.5 |
8.3 |
8.1 |
7.8 |
7.6 |
7.4 |
7.4 |
7.5 |
7.5 |
7.6 |
7.6 |
Hydro |
70.2 |
70.3 |
70.7 |
70.6 |
70.9 |
71.0 |
70.1 |
69.2 |
68.4 |
67.3 |
66.4 |
Wind |
8.0 |
8.0 |
8.0 |
8.0 |
8.1 |
8.1 |
8.3 |
8.4 |
8.6 |
8.7 |
8.9 |
Natural Gas |
5.5 |
5.4 |
5.2 |
5.1 |
4.9 |
4.8 |
4.8 |
4.8 |
4.8 |
4.8 |
4.8 |
Oil |
0.0 |
0.0 |
0.0 |
0.1 |
0.1 |
0.1 |
0.2 |
0.2 |
0.3 |
0.4 |
0.5 |
Hard Coal |
2.2 |
2.2 |
2.1 |
2.0 |
1.9 |
1.9 |
2.0 |
2.1 |
2.2 |
2.3 |
2.4 |
Nuclear |
3.4 |
3.3 |
3.2 |
3.2 |
3.1 |
3.0 |
3.0 |
3.0 |
3.0 |
3.1 |
3.1 |
Solar |
1.0 |
1.3 |
1.5 |
1.9 |
2.1 |
2.4 |
2.6 |
2.9 |
3.2 |
3.5 |
3.7 |
Source: contribution based on data from the Climate Centre [19], imports not considered
Regarding the aspects that influence the emission factors, the bus use phase generates most of the atmospheric emissions, mainly due to the combustion emissions in this type of engine and the lifespan of such vehicles [21]. The scope is limited from cradle-to-grave considering fossil fuel as one of the primary energy sources present in this study. The system boundaries are defined with the primary focus on the vehicle's operating phase considering energy production components, such as the fuel or energy consumed to run the city buses. Currently, all buses run on Diesel S10 (10 ppm) with the gradual substitution from its pure form to a higher percentage of biodiesel in the mix according to the CNPE nº 16 Resolution [37].
The available data classify the Vehicle Consumption Category according to size and height (Micro; Light; Heavy; Bus 6x2; Special); the engine position (central, front, and rear); the presence of air conditioning; and the type of gearbox (manual or automatic) [42]. Nonetheless, only efficiency was considered as a factor regarding bus classification. It was assumed that both CB and EB are built utilizing the same bus shell, interior fittings, and AD components, considering it unlikely that these differences would significantly alter the results of the LCA study [41]. The bus production was not considered for that reason.
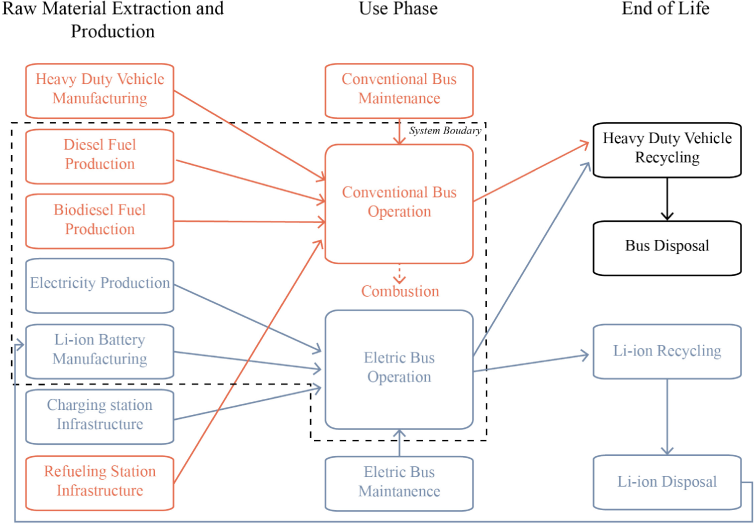
Manufacturing, maintenance and infrastructure stages, and end of life were disregarded, as specified by [21], since the absence of locally collected data may increase outcome uncertainties [43]. Therefore, regarding energy sources’ impact in the operational phase, production impacts, transport, and consumption (during operation) are included. For the electrification scenario, battery production and power generation for recharging electric vehicles were taken into account. Regarding the charging stations, their locations would be within public grounds on bus parking lots scattered in different regions of the city; in Carris’s case, the area is located in the Partenon neighborhood on the east end of the capital.
As shown in Figure 2, eventual changes in routes, and adaptations and maintenance of urban infrastructure were not considered. Battery disposal was also disregarded due to its uncertainties. In Brazil, most residues are accumulated in landfills, even though the final disposal of batteries is controlled by CONAMA Resolution No. 401 [44]. Nonetheless, a collecting system for rechargeable batteries is still tender; hence it is difficult to appraise its success rate [45] as current practices have many deficiencies [46]. It is important to point out that the disposal of Li-ion batteries may lead to significant environmental burdens, but there are still very few studies about the corresponding impacts [47].
System boundary and life cycle phases assessed in this study; CB (conventional bus) represented in orange and EB (electric bus) in blue
The LCA for this study was completed by combining four primary data sources, the ecoinvent® v3.6 database [48], the Public Transport and Traffic (PTCC) company’s database [49], materials from the Energy Research Company (ERC) [50] and the Climate Centre (CC) [19], and complementary literature. Emissions from fuel combustion were calculated based on GHG emission factors reported in the 2021 National Energy Balance [50]. Furthermore, data from the Brazilian matrix were adapted for the battery’s energy source production. Table 3 shows the quantities considered for each component of the system and the expenses per travelled km. The distance adopted for the use phase of vehicles under study was based on the mean life span of a public bus in Porto Alegre, which is 842,268 km. With these data and the bus efficiency per year, it is possible to determine the total quantity of fuel or electricity consumed in each scenario.
Description and quantitative of materials related to the displacement of 1 km considering the general fleet efficiency in 2020 (source: Ecoinvent) [35]
Material |
Dataset |
Amount |
Biodiesel |
Esterification of soybean oil (BR) |
0.48 kg |
Diesel |
Diesel, low-sulfur (BR) |
0.47 kg |
Battery |
Market for battery, Li-ion, rechargeable, prismatic (GLO) |
3.78E–06 p** |
Electricity* |
Electricity, high voltage, market group for electricity (BR) |
1.26 kWh |
*the electricity dataset considers the Brazilian energy matrix as described in Table 1.
**p is the abbreviation of per unit; the amount represents the impact of one battery
The PTCC provided fuel consumption and travel data. In addition, the fleet database was provided and promptly categorized by the bus prefix, identifying “Carris lot 7” individual characteristics, such as fuel consumption in litres per kilometre (L/km), buses models, quantities, and efficiency for each year. Regarding the battery, the ion-lithium battery type is the most used in electric buses, presenting 32 cells [51]. The batteries are assumed to be replaced every four years for a time interval that considers its maximum running capacity of 264,000 km [22]. Based on the average annual running of the vehicle described by PTCC [49], a battery consumes 126.5 kWh for every 100 km driven [52]. Consequently, to find the impacts of the use of vehicle batteries, the batteries data were tailored through an adaptation of the market type process from the 14-cell battery to a 32-cell example. As previous studies pointed out [53], it is also taken into account that the battery cell was unlikely to be produced in Brazil; hence, it was assumed that the battery cells are imported, and the battery pack is assembled in the country. On the other hand, changes in consumption due to variation in capacity (number of people transported) were neglected. Such an approach is justified because the primary data provided by PTCC are average data without information on that variation.
The stage of the Life cycle impact assessment (LCIA) was conducted following the ISO 14044 standard [32]. The characterization method applied was RECIPE version 1.04 (2016), that is, a problem-oriented approach (midpoint) in a hierarchical structure (H). The midpoint approach was selected, attempting to reduce the uncertainty of the results [53]. This approach characterizes the impact categories based on impacts that are directly caused by emitted pollutants, that is, the environmental impacts at an intermittent stage of the cause-effect chain in the form of indicators such as carbon dioxide (CO2) and nitrogen oxides (NOx) [54].
The environmental impact assessment was developed at the Simapro v9.1 software faculty version. Of the eighteen impact categories described in the method, Global Warming Potential (GWP); Ozone Formation – Human Health (HH) were selected for this study, as the emissions accounted for are related to the main environmental impacts of the transport sector. The impact categories chosen for evaluation are relevant for the studied system since the selection follows an approach adopted in the case studies with similar topics [21]. In addition, the choice also correlates with a direct link between these emissions and two sustainable development goals (SDGs): SDG 11 (related to sustainable cities and communities) and 13 (take urgent action to combat climate and its impacts), and some specific indicators suggested by the UN [55]. Finally, considering the allocation procedure, the cut-off system was adopted, in which all the raised impacts remain with the main product [56]. The requirements for the data used were accuracy, completeness and representativeness, consistency, and ease of reproduction.
The projections for future scenarios were developed by combining the variables described in Figure 1, Table 1, and Table 2. It is also worth noticing that scenarios 1 to 3 have possible combinations of power source changes: (1) BAU: following national law with stagnation of biodiesel percentage by 2023; (2) ELE1: the replacement from CB to EB occurs according to the bus end of life, also considering an increase of biodiesel percentage in the mix; (3) ELE2: following Public Competition Notice the replacement of CB to EB occurs in parallel to fuel changes.
Considering BAU, represented in Figure 1, only fuel changes are considered as the fleet remains the same with conventional buses only. In both ELE1 and ELE2, the fleet renewal begins in 2020. In ELE1, the complete substitution from CB to EB happens in 2029, and in ELE2 the complete fleet renewal is not reached until the end of the study time frame in 2030.
In the BAU scenario, the total and the percentage impacts of Diesel decrease over the years with the biodiesel's gradual replacement until the year 2023, when the percentage changes of biodiesel in the mix ceases. However, it is worth noticing that Diesel impact is the most representative in all the years and scenarios if present. For instance, in the BAU scenario, its percentage contribution in the analysis is also greater (83%) with approximately 2.64E+07 kg CO2eq. in 2020. On the other hand, biodiesel impact during the same year corresponds to just over 16%, with around 5.28E+06 kg CO2eq. in GWP.
In accordance with GWP, HH increased the total emissions over the years, from almost 2.20E+04 kg NOxeq. in 2020 to more than 2.28E+04 kg NOxeq. in 2030 at the BAU scenario. As happened in GWP impact, the total and the percentage impacts of Diesel decreased over the years from 76% to 71%. The percentage of biodiesel increased from 23% to 29% in the BAU scenario. In addition, the percentages of Diesel and biodiesel keep constant between 2023 and 2030 at 71% and 29%, respectively, as shown in Figure 3. Therefore, despite the small proportion of biodiesel in the mixture, its increment increases the impacts of both GWP and HH, as corroborated by previous studies [42]. The findings agree with the literature that brings some trade-offs about bioenergy because biomass cultivation could increase the nitrogen load while harvesting could reduce the nitrogen load slightly [57].
Regarding the ELE1 scenario, Diesel and Biodiesel reached their lowest impact in 2029, while all electricity sources reached their highest. On the other hand, batteries reached their highest impact in 2030, when 88 batteries were replaced (0.06% and 1.59E+03 kg CO2eq.). Furthermore, ELE1 shows that the GWP impact decreases from 2.67E+07 kg CO2eq. in 2020 to about 2.82E+06 kg CO2eq. in 2030; electricity encompasses 99.9% of the GWP impact. Additionally, the impact in 2030 is 10% of the impact in 2020 (ELE1). Thus, the transition to electric buses reduced almost 90% of the impact, counting almost 2.39E+07 kg CO2eq., as shown in Figure 3.
Policymakers should also pay attention to the energy matrix they are using for the electric vehicle fleet since an electric matrix based on renewables increases the benefits of electric vehicles, and instruments and energy policy play an important role in promoting such change [58]. This fact highlights the significance of each source's contribution to the energy matrix and its relationship with the total impact. In 2030 Brazilian electric energy matrix is expected to be composed of 89.2% of electricity from renewable energy sources.
Global warming potential (GWP), Human Health (HH), impact categories (in percentage kg/km) considering scenarios: BAU (a) and (b); ELE1 (c) and (d); ELE2 (e) and (f)
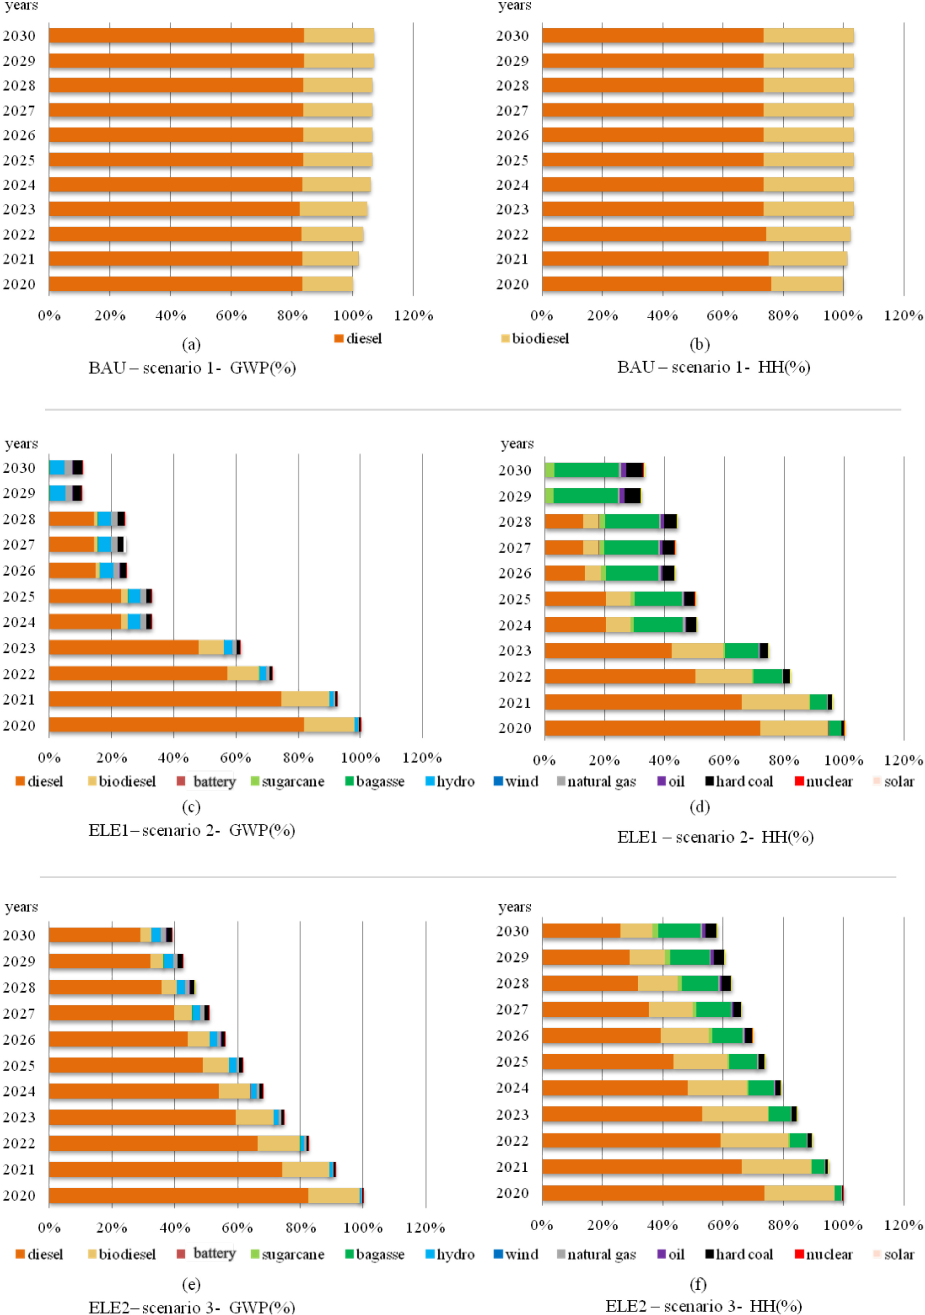
The structure of renewables expected in 2030 is 66.4% hydropower, 2.6% sugarcane, 7.6% bagasse, 8.9% wind energy, and 3.7% solar energy. The share of electricity from non-renewable energy sources is only 10.8%, including 4.8% natural gas, 0.5% oil, 2.4% hard coal and 3.1% nuclear.
Accordingly, in ELE1 in the same year, hydropower was the energy source with the highest contribution (45.8% and 1.29E+06 kg CO2eq.). Yet, two non-renewable energy sources, despite the low percentage in the electric energy matrix, presented the second and third highest impacts, respectively: (1) hard coal, 27% and 7.61E+05 kg CO2eq.; (2) natural gas, 21.9% and 6.19E+05 kg CO2eq.
Concurrently, regarding HH, Diesel and Biodiesel emissions decrease at both ELE1 and ELE2. For instance, Diesel decreases from 72% (2020) to 0% (2030) at ELE1 (the emissions decrease from more than 1.39E+04 kg NOxeq. to no more than 0 kg NOxeq.), while at the ELE2, it reduces from 73% (2020) to 44% (2030; the emissions decrease from more than 1.51E+04 kg NOxeq. to 5.32E+03 kg NOxeq.). In addition, biodiesel decreases from 22% (2020) to 0% (2030) at the ELE1 (the emissions drop from more than 2.26E–01 kg NOxeq. to more than 0 kg NOxeq.), while ELE2 ranges from 23% (2020) to 18% (2030; the emissions drop from more than 4.74E+03 kg NOxeq. to more than 2.17E+03 kg NOxeq.). Simultaneously, electricity impact increases at both ELE1 and ELE2. For example, in ELE2, from 2.9% more than 6.04E+02 kg NOxeq. (2020) to 36.7% more than 4.35E+03 kg/NOxeq. (2030), as shown in Figure 3.
However, it is necessary to point out that the reduction or increase of the respective emissions regarding different energy sources is intrinsically linked to the transitions considered during the scenarios' elaboration and not exclusively related to their individual impact.
It should be noted that in comparison to GWP, in HH (2030), bagasse was the energy source with the highest contribution (23.8% and 2.82E+03 kg NOxeq.), while once again hard coal came in second (6.2% and 7.40E+02 kg NOxeq.). The literature [59] highlights these drawbacks in bagasse, considering the correlation between combustion and harmful emissions that cause many public health issues, such as breathing and lung problems. Moreover, the indiscriminate use of resources, including chemical products (e.g., fertilizers or herbicides), water, fossil fuels, electric power, or land use, have caused a severe environmental impact on Human Health and ecosystem quality [60]. Furthermore, the study by Gasparotto and Da Boit Martinello [61] calls attention to the dangers of coal to human health. Coal-fired power plants are prodigious generators of environmental pollution, releasing large quantities of particles as atmospheric aerosols that present an invisible risk to human health.
Moreover, it is possible to observe that the variation in impacts is not proportional due to differences in the annual number of vehicle replacements. For instance, public bus transport companies deal with some challenging decisions because they should maximize their available and scarce resources in a smart way to achieve their business goals, reduce their costs and maximize their investments [62]. Therefore, new bus purchases should be assessed to optimize bus replacements. Besides, the battery shows the lowest impact in all years, ranging from 4.51E+02 kg CO2eq. (2021) to 1.59E+03 kg CO2eq. (2030) in ELE1 and ranging from 1.57E–05 kg CO2eq. (2023) to 4.45E–05 kg CO2eq. (2028) in ELE2. Considering ELE1, in 2029, the replacement of CB by EB already has reached more than 99%. It has a significantly lower impact than the others, demonstrating the potential transition to EB in Porto Alegre.
Figure 4 compares the impact values for the different scenarios during the evaluation period. As noted in the graph, EB adoption reduces GWP and HH impacts of the three evaluated scenarios. The scenarios ELE1 and ELE2, if adopted, can reduce the emissions significantly in comparison with BAU. Hence, the results presented in the study corroborate with other assessments carried out by [41] and [25] in developed countries. Besides, the findings expand the research in emerging countries, as [63] has already demonstrated that low-carbon buses can contribute to the decarbonisation of urban transport and help achieve carbon targets in the BRT system in Brazil. According to [64], one must also analyse battery replacements and bus fleet updates to compare the different types of fuels effectively. These factors have been poorly explored in the literature. Therefore, it is important to point out that these aspects were inserted in the developed scenarios, as mentioned in the method. However, in all three analysed scenarios, the impacts of batteries production represented small contributions to the CO2 emission results. Nonetheless, even though such impact represents a low percentage, it is fundamental to mention that the production results of the impacts align with the LCA literature about urban public bus transport. The impacts of battery production are not as great as those in the developed country contexts [25].
Impact projections of Global Warming Potential (GWP, in kg CO2 eq.) and Human Health (HH, in kg NOx eq.) per year from the public transportation system in Porto Alegre from fleet replacements and fuel changes among scenarios 1, 2 and 3
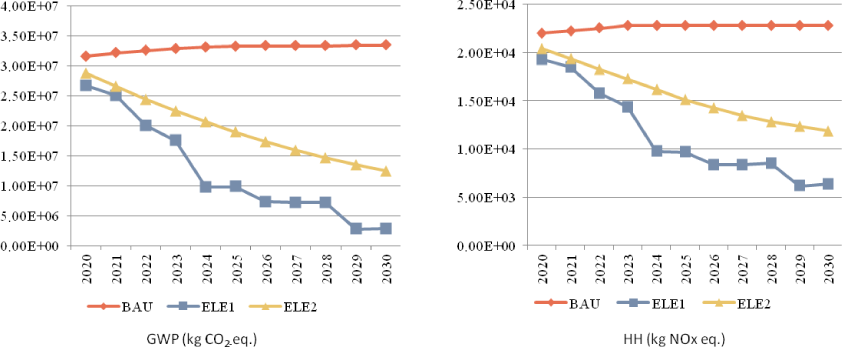
Regarding GWP results, the ELE1 scenario has the greatest impact reduction potential, followed by the ELE2 scenario compared to the BAU scenario. In the ELE1 scenario, in the years 2029 and 2030, there is already a total replacement of CB by EB, demonstrating the potential to reduce 90% GWP impacts compared to the BAU scenario. Consequently, based on the results included in the graphic shown in Figure 4, decision-makers can obtain a broad view of a possible EB scenario transition, facilitating the understanding and comparison between the scenarios. However, the graphic is only a tool in the decision-making process on LCA in the transport sector. It is recommended that decision-makers include other stakeholders in discussing public policy development.
On the one hand, deciding on the transition from CB to EB and analysing BAU in comparison to both ELE1 and ELE2, the decision-makers must consider the choice of the energy matrix for electricity. It corresponds to more than 99% of the impacts in the ELE1 scenario from 2029 onwards based on GWP impact. ELE1 and ELE2 appear as the best scenarios compared to BAU (see Figure 4). However, HH findings show the importance of considering the energy source when making a decision because the impact results varied over the years despite the reduction of fossil fuel consumption. Such findings align with the literature since researchers have shown that HH emissions depend heavily on the electricity energy matrix [64]. For example, when countries use a renewable matrix, they could reduce HH emissions [65]. If the electricity comes from fossil fuel sources, the damage to the environment and human health may persist [64]. Bicer and Dincer [64] also show that HH values may be higher in electric vehicles because of the manufacturing and maintenance stages compared to conventionally fuelled vehicles. Regarding the operation phase, in [64], the highest global warming potential per travelled kilometre is obtained from a conventional vehicle compared to an electric one, thus confirming the results of this study.
Finally, it is important to note that the scenarios were based on projections of the Brazilian electricity mix. The choices should also consider local electricity mixes; such a decision may change the results considerably, especially in large countries with significant differences between regions, such as Brazil.
Furthermore, the EB insertion can positively impact the reduction of fossil fuel dependence (such as Diesel used as fuel for buses) in cases where electricity production is based mainly on renewable sources. It is crucial to highlight that EB is preferred by users who use transport to commute to work. Even if the emissions decrease cannot be considered a priority item for passengers, congestion time and travel time are [66]. Consequently, it is essential that policies for promoting low emission vehicles address customer preferences and habits and territorial specificities, as different parts of the world need different approaches [67]. Thus, decision-makers should create different mechanisms that engage a target population to use EB, including other aspects, such as security, price, travel time, and quality of service offered.
This study shows that EB is an option to reduce environmental impacts for public transportation in Porto Alegre, Brazil, based on average Brazilian electricity mixes. According to GWP results, the transition from BAU to ELE1 scenario can be presented as the solution with a greater impact reduction; however, several factors were not considered, such as the financial investment for that transition. Particularly, the maintenance of the ELE2 scenario favours the gradual perception of fleet replacement by the population; such gradual change could engage and encourage the population to adhere to public transportation modes. However, scenario ELE1 is an alternative in case of the need to obtain results in the short term, depending on the main municipal climate change plan goals that should be aligned with GWP impacts and the local availability of renewable energy. Thus, intermediate scenarios should also be evaluated, given that decisions align with each region's strategic objectives and priorities.
The analysis presents an evaluation of the use of public buses, considered the most relevant stage of life cycle impacts of the public transportation system. Upon reaching a transition to a cleaner energy matrix, other stages (infrastructure maintenance and end of life of vehicles and their parts) may become more relevant to the public transportation system’s life cycle. So, future studies shall consider those stages and assess the future availability of clean energy supply, supporting broad and transparent decisions.
Finally, as a suggestion for further studies, the importance of analysing the economic feasibility of each scenario can be emphasised since the study is limited to understanding global warming potential and human health impacts from an environmental perspective. Therefore, the economic feasibility analysis should consider other aspects, such as the costs of recharging and replacing batteries and the availability of cleaner electricity to supply Porto Alegre, since the increase in demand may contribute to the use of fossil sources. In addition, the costs of Brazilian electric energy can be considered, compared to the costs of Diesel and biodiesel, performing an extrapolation period for fifteen years, for example. Another suggestion is to analyze results using sensitivity and uncertainty analysis to evaluate time-related and territorial variabilities, especially considering the energy pricing and availability.
The authors thank the institutions that support them in this study: CAPES (Coordination for the Improvement of Higher Education Personnel) and CNPq (National Council for Scientific and Technological Development – Brazil). The participation of A.P is sponsored by CNPq through the research fellowships PQ 2021: Grant number 310208/2021-1 and Universal: grant number: 429264/2018-6. The participation of M.L is sponsored by Capes through the research scholarship 2020: File number: 429264/2018-6. Moreover, we would like to thank the Public Transport and Circulation Company (PTCC) – in Portuguese EPTC – for the data provided to perform this research.
GWP |
Global Warming Potential |
[kg CO2eq.] |
HH |
Human Health |
[kg NOxeq.] |
Abbreviations |
|
BAU |
Business As Usual |
BYD |
Build Your Dreams |
CC |
Climate Centre |
CB |
Conventional Bus |
CNPE |
National Energy Policy Council |
CONAMA |
Brazilian National Environment Council |
CO2 |
Carbon Dioxide |
EB |
Electric Bus |
ELE1 |
Electric 1 |
ELE2 |
Electric 2 |
ERC |
Energy Research Company |
EV |
Electric Vehicles |
FU |
Functional Unit |
GHG |
Greenhouse Gas |
LCA |
Life Cycle Assessment |
LCIA |
Life Cycle Impact Assessment |
NOx |
Nitrogen Oxides |
p |
Per unit |
PTCC |
Public Transport and Circulation Company |
SDGs |
Sustainable Development Goals |
ZISPOA |
Sustainable Innovation Zone |
- Cars, planes, trains: where do CO2 emissions from transport come from?, https://ourworldindata.org/co2-emissions-from-transport, [Accessed Jan. 28, 2022]
- , International Energy Outlook 2016, Energy Information Administration.
- ,
CO2 emissions and road transport sector: a comparative analysis of the Carbon Intensity Index of the Federal District and Amazon ,Brazilian Applied Science Review , Vol. 4 (2), , https://doi.org/https://doi.org/10.34115/basrv4n2-003, Art. no. 2, Mar. 2020 - ,
Sustainable development in China: Trends, patterns, and determinants of the ‘Five Modernizations’ in Chinese cities ,Journal of Cleaner Production , Vol. 214 ,pp 685–695 , , https://doi.org/https://doi.org/10.1016/j.jclepro.2018.12.307, Mar. 2019 - Greenhouse Gas Emissions and Removal Estimates System”, http://seeg.eco.br, [Accessed Jan. 28, 2022]
- , Time-Based Life-Cycle Assessment for Environmental Policymaking: Greenhouse Gas Reduction Goals and Public Transit, 2015
- ,
Global Transportation Demand Development with Impacts on the Energy Demand and Greenhouse Gas Emissions in a Climate-Constrained World ,Energies , Vol. 12 (20), , https://doi.org/https://doi.org/10.3390/en12203870, Art. no. 20, Jan. 2019 - ,
Eco-Efficiency Indicators for Urban Transport,” Journal of Sustainable Development of Energy, Water and Environment Systems , Vol. 3 (2),pp 183-195 , , https://doi.org/https://doi.org/10.13044/j.sdewes.2015.03.0015, Jun. 2015 - ,
Modelling of University Student Transport Mode Choice in Joinville: A Binary Logistic Model for Active Modes ,Journal of Sustainable Development of Energy, Water and Environment Systems , Vol. 8 (4),pp 678-691 , , https://doi.org/https://doi.org/10.13044/j.sdewes.d7.0303, Dec. 2020 - ,
Environmental Impacts of Promoting New Public Transport Systems in Urban Mobility: A Case Study ,Journal of Sustainable Development of Energy, Water and Environment Systems , Vol. 5 (3),pp 377-395 , , https://doi.org/https://doi.org/10.13044/j.sdewes.d5.0143, Sep. 2017 - ,
Urban public transport in Europe: Technology diffusion and market organisation ,Transportation Research Part A: Policy and Practice , Vol. 46 (2),pp 269–284 , , https://doi.org/https://doi.org/10.1016/j.tra.2011.09.002, Feb. 2012 - ,
Sustainability Assessment of Innovative Energy Technologies – Hydrogen from Wind Power as a Fuel for Mobility Applications ,Journal of Sustainable Development of Energy, Water and Environment Systems , Vol. 9 (3),pp 1-21 , , Sep. 2021 - ,
Prospects for the Use of Electric Vehicles in Public Transport on the Example of the City of Czechowice-Dziedzice ,Transportation Research Procedia , Vol. 44 ,pp 110–114 , , https://doi.org/https://doi.org/10.1016/j.trpro.2020.02.016, Jan. 2020 - ,
Environmental impacts of hybrid and electric vehicles—a review ,Int J Life Cycle Assess , Vol. 17 (8),pp pp. 997–1014 , , https://doi.org/https://doi.org/10.1007/s11367-012-0440-9, Sep. 2012 - ,
Smarter Cities: Cleaning Electricity, Gas and Water Metered Consumption Data for Social and Urban Research ,Journal of Sustainable Development of Energy, Water and Environment Systems , Vol. 7 (3),pp 466-481 , , https://doi.org/https://doi.org/10.13044/j.sdewes.d6.0242, Sep. 2019 - ,
Towards Smart Cities Development: A Study of Public Transport System and Traffic-related Air Pollutants in Malaysia ,IOP Conf. Ser.: Earth Environ. Sci. , Vol. 167 ,pp 012015 , , https://doi.org/https://doi.org/10.1088/1755-1315/167/1/012015, Jul. 2018 - ,
On the Environmental Benignity of Electric Vehicles ,Journal of Sustainable Development of Energy, Water and Environment Systems , Vol. 7 (3),pp 416-431 , , https://doi.org/https://doi.org/10.13044/j.sdewes.d6.0252, Sep. 2019 - ,
Investigating the Performance of Rural Off-Grid Photovoltaic System with Electric-Mobility Solutions: A Case Study Based on Kenya ,Journal of Sustainable Development of Energy, Water and Environment Systems , Vol. 10 (1),pp 1-15 , , Mar. 2022. - , Emission of Greenhouse Gases - 2050: Economic and Social Implications of the Governmental Plan Scenario”, Climate Centre (in Portuguese - Centro Clima)
- ,
A new hybrid method for reducing the gap between WTW and LCA in the carbon footprint assessment of electric vehicles ,Int J Life Cycle Assess , Vol. 22 (1),pp 4–14 , , https://doi.org/https://doi.org/10.1007/s11367-015-0954-z, Jan. 2017 - ,
Infrastructure and automobile shifts: positioning transit to reduce life-cycle environmental impacts for urban sustainability goals ,Environ. Res. Lett. , Vol. 8 (1),pp 015041 , , https://doi.org/https://doi.org/10.1088/1748-9326/8/1/015041, Mar. 2013 - ,
Impact of Spanish electricity mix, over the period 2008–2030, on the Life Cycle energy consumption and GHG emissions of Electric, Hybrid Diesel-Electric, Fuel Cell Hybrid and Diesel Bus of the Madrid Transportation System ,Energy Conversion and Management , Vol. 74 ,pp 332–343 , , https://doi.org/https://doi.org/10.1016/j.enconman.2013.05.023, Oct. 2013 - ,
Comparative LCA of the use of biodiesel, diesel and gasoline for transportation ,Journal of Cleaner Production , Vol. 20 (1),pp 14–19 , , https://doi.org/https://doi.org/10.1016/j.jclepro.2011.07.026, Jan. 2012 - ,
Rethinking environmental LCA life stages for transport infrastructure to facilitate holistic assessment ,Journal of Industrial Ecology , Vol. 24 (5),pp 1031–1046 , 2020, https://doi.org/https://doi.org/10.1111/jiec.13010 - ,
Life cycle assessment of city buses powered by electricity, hydrogenated vegetable oil or diesel ,Transportation Research Part D: Transport and Environment , Vol. 75 ,pp 211–222 , , https://doi.org/https://doi.org/10.1016/j.trd.2019.08.019, Oct. 2019 - ,
Life Cycle Assessment of Tyre Manufacturing Process ,[Journal of Sustainable Development of Energy, Water and Environment Systems] , Vol. 8 (1),pp 22-34 , , https://doi.org/https://doi.org/10.13044/j.sdewes.d7.0260, Mar. 2020 - ,
Estimating the Potential of Ride Sharing in Urban Areas: the Milan Metropolitan Area Case Study ,[Journal of Sustainable Development of Energy, Water and Environment Systems] , Vol. 9 (3),pp 1-17 , , Sep. 2021 - ,
Critical review of life cycle assessment (LCA) for the built environment at the neighborhood scale ,Building and Environment , Vol. 93 ,pp 165–178 , , https://doi.org/https://doi.org/10.1016/j.buildenv.2015.06.029, Nov. 2015 - ,
Territorial Life Cycle Assessment (LCA): What exactly is it about? A proposal towards using a common terminology and a research agenda ,Journal of Cleaner Production , Vol. 176 ,pp 474–485 , , https://doi.org/https://doi.org/10.1016/j.jclepro.2017.12.169, Mar. 2018 - ,
Consequential LCA for territorial and multimodal transportation policies: method and application to the free-floating e-scooter disruption in Paris ,Journal of Cleaner Production , Vol. 273 ,pp 122898 , , https://doi.org/https://doi.org/10.1016/j.jclepro.2020.122898, Nov. 2020 - , ISO, ISO 14040:2006 Environmental management -- Life cycle assessment -- Principles and framework.
- , ISO, ISO 14044:2006 Environmental Magament - Life Cycle Assessment - Requirements and guidelines. 2006, International Standardisation Organisation.
- ,
Comparative analysis between transportation modes for sustainability perspective in one metropolitan region of southern Brazil,” Prod. , Vol. 30 , , https://doi.org/https://doi.org/10.1590/0103-6513.20190038, Sep. 2020 - Diagnosis of Mobility in the Municipality of Porto Alegre and its Metropolitan Interface”, 2019, https://prefeitura.poa.br/sites/default/files/usu_doc/projetos/smim/Plano%20de%20Mobilidade%20Urbana/Relatorio_PMU_Diagnostico_da_Mobilidade_0.pdf, [Accessed Jan. 28, 2022]
- ,
The evolution of city-scale GHG emissions inventory methods: A systematic review ,Environmental Impact Assessment Review , Vol. 80 ,pp 106316 , , https://doi.org/https://doi.org/10.1016/j.eiar.2019.106316, Jan. 2020 - Carris intends to include electric buses in the fleet of collectives, https://www.jornaldocomercio.com/_conteudo/2016/03/cadernos/jc_logistica/487175-carris-pretende-incluir-onibus-eletricos-na-frota-de-coletivos.html, [Accessed Jan. 28, 2022]
- National Petroleum Agency, Natural Gas and Biofuels, NPA (in Portuguese – Agência Nacional de Petroleo, Gás Natural e Biocombustíveis), Resolution CNPE No 16, DE 29.10.2018, 2018, https://www.legisweb.com.br/legislacao/?id=369098, [Accessed Jan. 28, 2022]
- , https://www.legisweb.com.br/legislacao/?id=369098, [Accessed Jan. 28, 2022]
- ,
Transport impacts on atmosphere and climate: Land transport ,Atmospheric Environment , Vol. 44 (37),pp 4772–4816 , , https://doi.org/https://doi.org/10.1016/j.atmosenv.2010.01.002, Dec. 2010 - Promised for October, renewal of Carris' bus fleet is due next year, https://gauchazh.clicrbs.com.br/porto-alegre/noticia/2019/10/prometida-para-outubro-renovacao-da-frota-de-onibus-da-carris-fica-para-o-ano-que-vem-ck2aywi5t01wj01n3veugd25r.html, [Accessed Oct. 07, 2021]
- Public Competition Notice No. 01/2015 - SMT", http://www2.portoalegre.rs.gov.br/smf/default.php?reg=19&p_secao=256, [Accessed Feb. 25, 2022]
- ,
Life Cycle Assessment of Diesel and Electric Public Transportation Buses ,Journal of Industrial Ecology , Vol. 17 (5),pp 689–699 , 2013, https://doi.org/https://doi.org/10.1111/jiec.12024 - ,
Public Bus Transportation System Environmental Impact Projections Regarding Different Policy Scenarios—A LCA Study ,Infrastructures , Vol. 6 (12), , https://doi.org/https://doi.org/10.3390/infrastructures6120169, Art. no. 12, Dec. 2021 - ,
How can energy prices and subsidies accelerate the integration of electric vehicles in Brazil? An economic analysis ,The Electricity Journal , Vol. 31 (3),pp 16–22 , , https://doi.org/https://doi.org/10.1016/j.tej.2018.03.007, Apr. 2018 - National Enviroment Council ( in Portuguese Conselho Nacional do Meio Ambiente - CONAMA). Resolution nº 401, November 5 of, http://conama.mma.gov.br/?option=com_sisconama&task=arquivo.download&id=, [Accessed Jan. 28, 2022].
- ,
Brazilian policy on battery disposal and its practical effects on battery recycling ,Journal of Power Sources , Vol. 137 (1),pp 134–139 , , https://doi.org/https://doi.org/10.1016/j.jpowsour.2004.02.023, Oct. 2004 - ,
A study of reverse logistics flow management in vehicle battery industries in the midwest of the state of São Paulo (Brazil) ,Journal of Cleaner Production , Vol. 19 (2),pp 168–172 , , https://doi.org/https://doi.org/10.1016/j.jclepro.2010.08.018, Jan. 2011 - ,
Comparative Life-Cycle Assessment of Li-Ion Batteries through Process-Based and Integrated Hybrid Approaches ,ACS Sustainable Chem. Eng. , Vol. 7 (5),pp 5082–5094 , , https://doi.org/https://doi.org/10.1021/acssuschemeng.8b05902, Mar. 2019 - ECOINVENT, Ecoinvent Database - Version 3.2020, https://ecoinvent.org, [Accessed Jan. 28, 2022]
- , Public Transport and Circulation Company, PTCC (in Portuguese – Empresa Pública de Transporte e Circulação),, “Consumption, Running and Number of Passengers Data Provided on Demand in the Month of November 2018—Values for the years 2017–2018”., 2018
- , Energy Research Company, ERC (in Portuguese), “Energy Balance 2020”,
- ,
A hybrid life cycle assessment of public transportation buses with alternative fuel options ,Int J Life Cycle Assess , Vol. 20 (9),pp 1213–1231 , , https://doi.org/https://doi.org/10.1007/s11367-015-0927-2, Sep. 2015 - ,
Real-world performance of battery electric buses and their life-cycle benefits with respect to energy consumption and carbon dioxide emissions ,Energy , Vol. 96 ,pp 603–613 , , https://doi.org/https://doi.org/10.1016/j.energy.2015.12.041, Feb. 2016 - ,
Life cycle assessment of electric vehicles and buses in Brazil: effects of local manufacturing, mass reduction, and energy consumption evolution ,Int J Life Cycle Assess , Vol. 24 (10),pp 1878–1897 , , https://doi.org/https://doi.org/10.1007/s11367-019-01615-9, Oct. 2019 - ,
Comparing the midpoint and endpoint approaches based on ReCiPe—a study of commercial buildings in Hong Kong ,Int J Life Cycle Assess , Vol. 19 (7),pp 1409–1423 , , https://doi.org/https://doi.org/10.1007/s11367-014-0743-0, Jul. 2014 - ,
Life cycle assessment of defluoridation of water using laterite soil based adsorbents ,Journal of Cleaner Production , Vol. 180 ,pp 716–727 , , https://doi.org/https://doi.org/10.1016/j.jclepro.2018.01.176, Apr. 2018 - Transforming our world: the 2030 Agenda for Sustainable Development | Department of Economic and Social Affairs.”, https://sdgs.un.org/2030agenda, [Accessed Feb. 25, 2022]
- ,
Life-cycle assessment of diesel, natural gas and hydrogen fuel cell bus transportation systems ,Journal of Power Sources , Vol. 170 (2),pp 401–411 , , https://doi.org/https://doi.org/10.1016/j.jpowsour.2007.04.036, Jul. 2007 - , Multi-environmental impacts of biofuel production in the U.S. Corn Belt: A coupled hydro-biogeochemical modeling approach, 2020
- ,
Simulation of the impacts on carbon dioxide emissions from replacement of a conventional Brazilian taxi fleet by electric vehicles ,Energy , Vol. 115 ,pp 1617–1622 , , https://doi.org/https://doi.org/10.1016/j.energy.2016.07.095, Nov. 2016 - ,
Investigating the Economic and Environmental Effect of Integrating Sugarcane Bagasse (SCB) Fibers in Cement Bricks ,Ain Shams Engineering Journal , Vol. 12 (3),pp 3297–3303 , , https://doi.org/https://doi.org/10.1016/j.asej.2020.12.012, Sep. 2021 - ,
Life cycle assessment of cane sugar production: The environmental contribution to human health, climate change, ecosystem quality and resources in México ,J Environ Sci Health A Tox Hazard Subst Environ Eng , Vol. 54 (7),pp 668–678 , 2019, https://doi.org/https://doi.org/10.1080/10934529.2019.1579537 - ,
Coal as an energy source and its impacts on human health ,Energy Geoscience , Vol. 2 (2),pp 113–120 , , https://doi.org/https://doi.org/10.1016/j.engeos.2020.07.003, Apr. 2021 - , Knowledge Management in Public Transportation: Experiences in Brazilian Bus Companies,” in Advances in Production Management Systems. Innovative and Knowledge-Based Production Management in a Global-Local World, Berlin, Heidelberg,, 2014
- ,
Well-to-Wheel analysis of fossil energy use and greenhouse gas emissions for conventional, hybrid-electric and plug-in hybrid-electric city buses in the BRT system in Curitiba, Brazil ,Transportation Research Part D: Transport and Environment , Vol. 58 ,pp 122–138 , , https://doi.org/https://doi.org/10.1016/j.trd.2017.10.015, Jan. 2018 - ,
Comparative life cycle assessment of hydrogen, methanol and electric vehicles from well to wheel ,International Journal of Hydrogen Energy , Vol. 42 (6),pp 3767–3777 , , https://doi.org/https://doi.org/10.1016/j.ijhydene.2016.07.252, Feb. 2017 - ,
Comparative LCA of electric, hybrid, LPG and gasoline cars in Belgian context ,World Electric Vehicle Journal , Vol. 3 (3), , https://doi.org/https://doi.org/10.3390/wevj3030469, Art. no. 3, Sep. 2009 - , Acceptance of Electric Vehicle in Indonesia: Case Study in Bandung,” in 2019 6th International Conference on Electric Vehicular Technology (ICEVT), Nov. 2019
- ,
Policies for Promotion of Electric Vehicles and Factors Influencing Consumers’ Purchasing Decisions of Low Emission Vehicles ,Journal of Sustainable Development of Energy, Water and Environment Systems , Vol. 5 (2),pp 151-162 , , https://doi.org/https://doi.org/10.13044/j.sdewes.d5.0139, Jun. 2017