


The urbanisation trend is ongoing worldwide. More and more people live in urban areas, and providing energy and mobility in virtually all cities is becoming challenging. Currently, urban areas host about 56% of the global population [1] and generate 70% of global greenhouse gases (GHG) [2]. In the EU, 29% of the total CO2 emissions were produced by the transport sector in 2018 [3]. Cars are the major emitters of CO2 emissions in the EU, with a market share of 82% in 2019 [4]. The problem is that mobility is still fossil-fuel dependent and largely car-oriented, with a limited number of alternative solutions. Battery electric vehicles (BEVs) could be one possible solution [5]. A mobility shift from fossil-fuelled passenger car transport (92% of cars were fossil-fuelled in the EU in 2019 [6]) and public transport to alternatively powered vehicles would be desirable for significantly reducing CO2 emissions. This study considers passenger mobility and how their CO2 emissions can be reduced with certain policies. Generally, policies should always interplay renewable and energy efficiency policies [7]. Policymakers have already started to promote different measures, strategies, and technologies to mitigate GHG emissions and transform cities towards sustainability [8]. For example, over the last years, very generous subsidies have been provided for BEVs to reduce their high investment costs. Furthermore, it is essential to provide and improve infrastructure for electric vehicles and public transport [9].
This paper deals with modelling transport policies in scenarios for urban passenger transport and its final application to urban areas. The core objective is to analyse possible scenarios for the future development of energy use in private passenger cars and public transport (bus, tram, metro, railway) and the development of their resulting flow and embedded GHG emissions up to 2050. Three scenarios are derived: one business as usual scenario, one with the focus on public transport and one with the focus on BEVs. In addition, the possible future development of the transport modal mixes is analysed considering different promoting policies for public transport and "clean" private cars, such as different types of electric vehicles (EVs). Moreover, scenarios for various electricity generation mixes are investigated.
The major new contribution of this paper is that it simultaneously considers GHG emissions from energy flow, emissions related to vehicle operation, and the embedded emissions from vehicle construction, material, and scrappage. In addition, this is done in a joint model for passenger cars, public transport and non-motorised transport.
This model allows evaluation of both types of GHG emissions simultaneously, changes in energy flow and the stock of vehicles, as well as the switch between private cars and public transport. Furthermore, the impact of the major policies is analysed.
Using the "TransLoc" model, different future scenarios are derived, major mobility indicators are evaluated, and major assumptions in the scenarios are comprehensibly documented. No such comprehensive approach has been applied in the literature. The scenarios calculated in this paper are using data from the city of Vienna in Austria. However, the methodology can be applied to any other city, and the conclusions are generally transferable to other urban areas.
The focuses of the scenarios were derived from existing literature. A specific aspect of the future of mobility in cities is the electrification of the transport system – public and private transport – see Ajanovic et al. [9]. Ajanovic et al. [5] pointed out the major factors for the success of urban transport electrification. Danielis et al. [10] highlighted the potential of electric vehicles. Their study also shows biofuels' importance for the transport sector's decarbonisation and calculated future passenger car scenarios. Also, Guo et al. [11] have determined the great potential for CO2 reductions of electrification of road transport. Menezes et al. [12] pointed out the importance of the use of biofuels in the future. In addition, they see great potential in public transport. Rottoli et al. [13] have conducted in-depth research on the impact and differences between direct and indirect electrification of transport. Carroll et al. [14] have measured the high potential emission reductions from a shift toward public transport.
Lyons et al. [15] have provided an insight into scenario development and its benefits, specifically for the transport sector. Ehrenberger et al. [16] have calculated land transport scenarios and their impact on energy demand and emissions, focusing on technological potentials. In addition to the shift to rail transport, the development of technologies, fleets and their use is especially important to be able to reduce fossil energy use sustainably. Matthias et al. [17] have worked on different scenarios, especially for road transport and its emissions in Germany. One of the model's main features is the possibility of considering modifications to the traffic flow and changes within the fleet. Yang et al. [18] also dealt with the future development of CO2 emissions in rapidly developing cities. Especially the promotion of polycentric urban forms and jobs-housing balanced satellite cities would reduce CO2 emissions in transport. Yan et al. [19] have conducted emission and energy projections for freight transportation. In the long term, emission standards in freight transport can reduce emissions if new technologies replace the vehicle fleet. Jian et al. [20] have developed different scenarios for developing different electric vehicle technologies in China. They summarise that especially BEVs in passenger transport and FCVs (fuel cell vehicles) in freight transport would lead to a significant reduction in oil consumption. Lee et al. [21] have developed a transport model with which the variables population, building area, industries, vehicle use, and the environment can be considered to examine the effect of CO2 reduction policies.
Achieving change in transportation requires ambitious policies. The role of policies has to be discussed; see, e.g. Siebenhofer et al. [22], who mainly showed preferred combinations of financial incentives to increase the dissemination of BEVs. The future development of urban transportation is strongly dependent on policies and their objectives; see, e.g. Rietmann and Lieven [23], who have measured the effectiveness of different measures on the promotion of electric mobility. Cansino et al. [24] have comprehensively identified various measures to promote electric mobility, and Enoch et al. [25] showed how policies could be implemented in practice. Finally, Dugan et al. [26] have shown how to combine policies in packages effectively.
The 2011 Transport White Paper set a target to reduce the use of conventionally fuelled cars by 50% by 2030 and phase them out of cities by 2050 [27], [28]. Based on this, the European Commission developed an Urban Mobility Package in 2013. The focus is on various aspects of transport, such as charging infrastructure for electric vehicles in urban areas, free emissions zones and their implementation, and financial support for developing urban mobility plans [29]. Lankao et al. [28] show a knowledge pathway toward an integrated research and development plan for urban electrification.
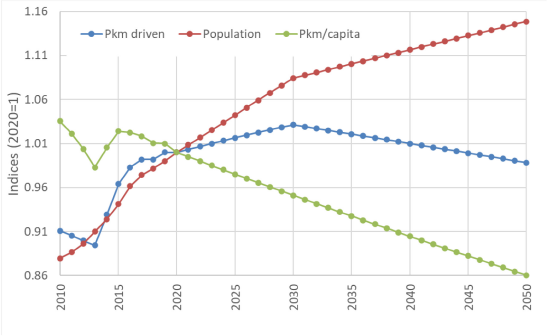
This chapter presents the method of approach applied in this paper. The fundamental method of approach builds on a forecast of the population up to 2050 and a slight decrease in passenger-km (pkm) travelled per capita due to higher prices for mobility in the future and urban planning approaches by the city for lower distances to be travelled. These basic assumptions for population, pkm driven per capita, and total pkm driven are the same in all scenarios up to 2050, and they are described in Figure 1.
Development of the indices for population, passenger-km driven and passenger-km driven per capita in the scenarios up to 2050
The analysis starts with a forecast of population and targets for the reduction of pkm mobility:
(1)
(2)
where:
| Passenger kilometre driven in year t [km], | |
| Passenger kilometre driven per capita in year t [km], | |
| Population in year t, | |
| Passenger kilometre driven of vehicle type j in year t [km], | |
| Growth factor of mode type j in year t. |
Four modes are considered:
mobility with conventional cars,
mobility with non-conventional cars (BEVs, FCVs),
mobility with public transport,
active mobility (walking, biking).
The mode type conventional cars provide the remaining person kilometres:
(3)
where:
| Passenger kilometre driven by conventional cars in year t [km]. |
The vehicle stock () in the scenarios is modelled as:
(4)
where:
| Stock of vehicle type j in year t, | |
| j | Type of vehicle, |
| Growth factor of car type j in year t. |
In addition, the total vehicle stock in 2050 () must be lower than the maximum allowed by current policy restrictions.
(5)
where:
| Total car stock in the year 2050, | |
| Maximum car stock in year 2050. |
The total energy flow demand (Et) in the scenarios is calculated as:
(6)
where:
| Energy consumption of car type i and fuel type j in year t [MWh], | |
| Stock of vehicle type i and fuel type j in year t, | |
| Fuel intensity of vehicle type i and fuel type j in year t [MWh], | |
| Service kilometre by fuel type j in year t [km], |
{petrol, diesel, LPG, electricity, CNG, biogenic fuels, hydrogen},
{cars petrol, cars diesel, cars LPG, cars electricity, cars CNG, cars hybrid (petrol-electric, diesel-electric), cars hydrogen}.
The total CO2 emissions (CO2Tot) are calculated as:
(7)
where:
| Total CO2 emissions in year t [Mill tons CO2], | |
| Total CO2 emissions of energy flow in year t [Mill tons CO2], | |
| Total CO2 emissions of embedded energy in year t [Mill tons CO2]. |
The CO2 emissions of energy flow () are calculated as:
(8)
where:
| Energy consumption of energy carrier j in year t [MWh], | |
| Overall CO2 emission factor of fuel j in year t [kg CO2/kWh]. |
The embedded CO2 emissions () for passenger cars are calculated as:
(9)
For for private vehicles, in 2020, the values in [Table 1] are used. For vehicles in public transport, a factor of 4 tons CO2 per ton of vehicle mass is used, assuming an average mass of 50 tons per vehicle.
Tons of CO2 per car in the year 2020
| t CO2/car | |
| Gasoline internal combustion engine (ICE) | 6 |
| Diesel (ICE) | 6.6 |
| Compressed natural gas (CNG) vehicle | 6.3 |
| Hybrid vehicle | 7.2 |
| Battery electric vehicle (BEV) | 10.5 |
| Fuel cell vehicle (FCV) | 9 |
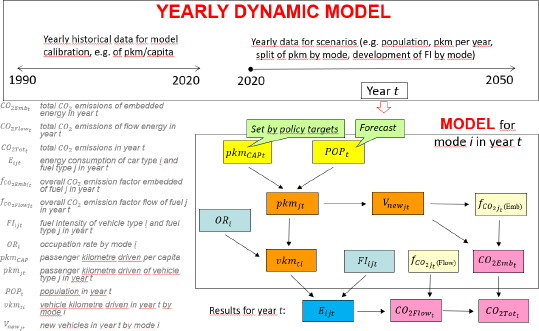
Figure 2 shows an overall flow chart for the method of approach applied in this study. Yearly historical data for the model calibration, e.g. of passenger kilometres per capita (), shows the developments within the mobility over the last 30 years between 1990 and 2020. From the current year t, respectively, in our calculations as of 2021, scenarios for further possible developments are modelled using annual input parameters (e.g. population (), pkm per year ()). Total passenger kilometres per year () are affected by population developments () and consequently by passenger kilometre per capita (). With an occupation rate () in the vehicles, vehicle kilometre driven () can be calculated from the . The energy consumption () results from the , and fuel intensity (). The total resulting emissions () are derived in the CO2 emissions flow () and the embedded CO2 emissions ().
Flow chart for the method of approach
The three scenarios are derived: first, a population forecast is used to predict future passenger-km driven. This gives the general growth for passenger mobility up to 2050.
Scenario A: in a Business as Usual (BAU) scenario, the developments over the past years are used for the future. Yet, the overall condition is that bottom-up mobility demand must be met. The flexible variable is petrol cars, covering the difference between total and bottom-up sums of cars with other fuels (diesel, electricity, compressed natural gas (CNG) and biofuels).
Scenario B: In a Public transport scenario, the growth of public transport is accelerated from an average growth rate of 2.6% in recent years to 4% in the following years up to 2050.
Scenario C: In a Battery Electric Vehicle (BEV) scenario, the growth of BEVs is significantly accelerated from an average growth rate of 3% per year in the BAU scenario to 4% per year in the following years up to 2050.
Next, for every year, the overall demand is split up for all scenarios into three modes: (i) public transport, (ii) private motorised transport with conventional vehicles, and (iii) private motorised transport with non-conventional vehicles (BEVs and FCVs). The public transport category grows by 2.6% in scenarios A and C and 4% in scenario B. The category of private motorised transport with non-conventional vehicles increases by 3% per year in scenarios A and B and 4% per year in scenario C. Note that private diesel use is reduced by about 4% in all scenarios following the trend of the last years.
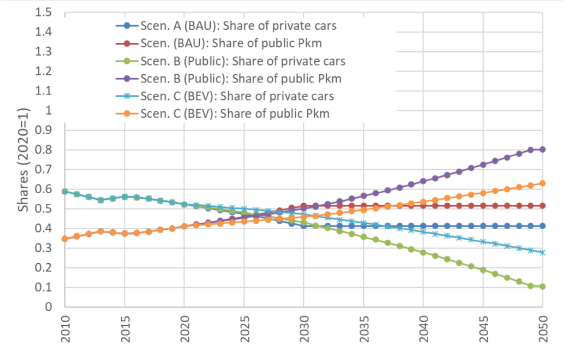
In the next step, three scenarios are defined with different shares of conventional private pkm driven, private non-conventional pkm driven and public transport pkm driven. Figure 3 shows the development of the shares for private and public transport pkm driven in the scenarios. The major assumptions regarding policies are:
In scenario A, no additional policies are implemented. In scenario B, rigorous support for the switch to public transport is provided. In contrast, in these scenarios, the further purchase of private cars is discouraged in general, e.g. because of the introduction of higher registration taxes, road tolls, higher parking fees, and increasing fuel taxes. Likewise, policies are introduced in scenario B that make fossil-fuel vehicles unattractive. All scenarios are calculated with an average electricity mix and a mix from 100% renewable energy sources (RES). For RES, we consider an official overall target of Austrian energy policy to reach 100% RES by 2030 in a balanced system.
Development of the shares of private and public transport pkm driven in the scenarios up to 2050
Like many other cities, Vienna has already set goals for a low-carbon future, aiming to reduce GHG emissions by 80%until 2050. The most relevant sector emitting GHG emissions in Vienna is the transport sector with 43%, followed by energy generation with 20% [22]. Hence, transport has the most significant contribution to GHG emissions and is the largest challenge in the decarbonisation of the city. Up to 2050, Vienna pursues a challenging climate protection plan, the so-called Smart City Wien Framework Strategy [30]. Several GHG emission mitigation strategies and policies are already in place in Vienna. However, reaching the ambitious goals set for the future will be challenging.
As in many other cities, the population in Vienna is growing, requiring many services that need energy, above all, of course, mobility. Mobility behaviour has changed significantly over the past decades. Between the 1970s and 1990s, private cars became more attractive and public transportation less popular. Since then, public transport share has risen significantly from 29% in 1993 to 38% in 2019, mainly due to the increased attractiveness of public transport. For the public transport system in Vienna, 852,000 annual tickets were sold among 1.9 million inhabitants [31], [32] in 2019.
Over time, overall energy consumption in transport by fuel has changed significantly, see Figure 4. In total, 8,560 GWh of energy was consumed in 1990. The energy consumption reached its peak at 14,880 GWh in 2005. Since then, the value has fallen slightly and continued to fluctuate. Most recently (2020), the transport sector in Vienna consumed 12,220 GWh. It is shown that the fuel mixes consumed have changed since 1990. The largest share of energy is consumed by fossil-fuelled vehicles, especially diesel, followed by petrol since 1996. Before that, the share of petrol dominated. The energy consumed by biogenic fuels has increased significantly since 2006, from 430 GWh to 650 GWh in 2020. Although the government promotes electro-mobility, the share of electricity consumed by transport has barely changed since 2000. The energy consumed by electric vehicles raised only from 610 GWh in 2000 to 630 GWh in 2020.
Development of overall energy consumption in transport in Vienna by fuel (data source [33], numbers for 2020 preliminary)
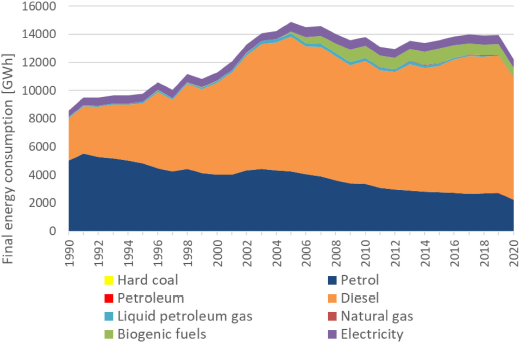
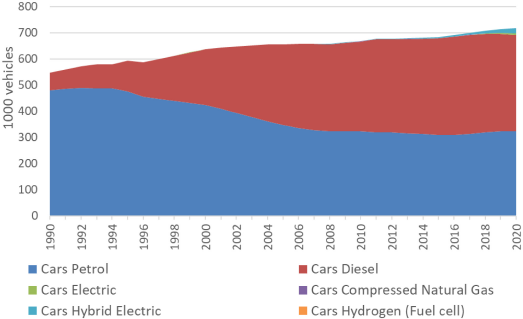
Figure 5 shows Vienna's passenger car stock development from 1990 to 2020. Private passenger mobility is dominated by conventional internal combustion engine vehicles powered by petrol and diesel. The total car stock increased from about 547,000 in 1990 to 737,000 cars in 2020 (35% growth). In 2020, about 323,000 cars were powered by petrol, 368,000 by diesel and only 6,000 by electricity.
Stock of passenger cars in Vienna from 1990 – 2020 (data source[34])
In the following, the results of the three analysed scenarios are presented. The focus is on the vehicle stock, the passenger kilometre driven, energy consumption flow, and corresponding CO2 emissions, including also embedded CO2 emissions of private cars and public transport [35].
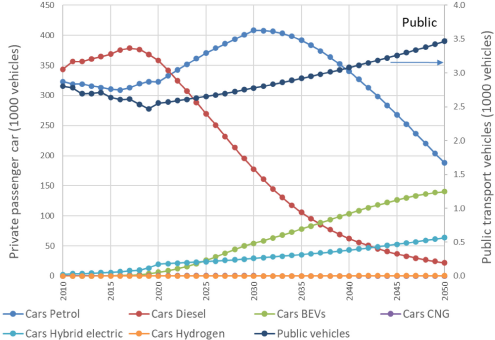
Figure 6 depicts the development of the vehicle stock of private passenger cars and vehicles in public transport in Vienna in scenario A (BAU) from 2010 to 2050. It can be seen that the overall stock decreases continuously, mainly because of declines in diesel and petrol cars, while especially the BEVs, hybrid electric vehicles (HEVs) and the public transport vehicles gain market shares. In this scenario, private passenger car stock decreased from 670,000 in 2010 to 410,000 in 2050. The number of diesel cars has been declining since 2018, while the number of petrol cars has decreased since 2031.
Development of the vehicle stock in scenario A (BAU)
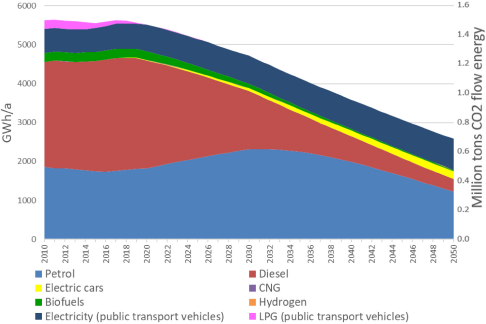
The development of energy consumption flow and CO2 emissions of private cars and public transport in Vienna in scenario A (BAU) is shown in Figure 7. Since the number of petrol and diesel cars will significantly reduce in the future, overall energy consumption flow and corresponding CO2 emissions will drop strongly by 2050. Especially the energy consumption from diesel vehicles declined from a peak of 2,900 GWh in 2017 to 325 GWh in 2050. CO2 emissions remained from 2010 to 2019 almost the same. However, the amount dropped from 1.5 million tons in 2019 to 0.5 million tons in 2050.
Development of energy consumption flow and CO2 emissions in scenario A (BAU)
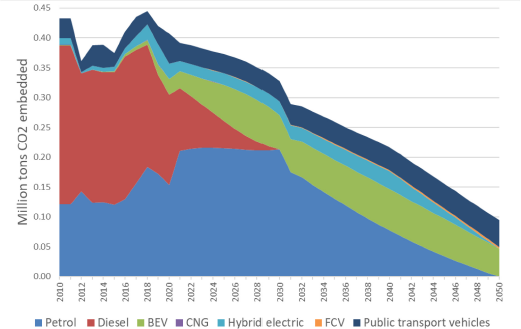
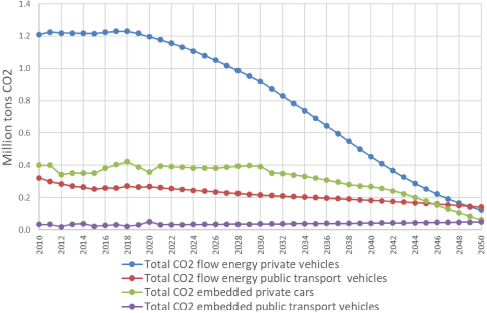
Embedded CO2 emissions of private cars and public transport in Vienna in scenario A (BAU) by 2050 are shown in Figure 8. In the BAU scenario, embedded CO2 emissions from fossil-fuelled vehicles decreased significantly from 0.4 million tons in 2018 to 0.1 million tons in 2050. On the contrary, the emissions of BEVs will increase strongly from almost no emissions in 2018 to almost zero emissions in 2050 due to the higher market share of BEVs. That shows that a modal shift towards public transport is becoming more important.
Development of embedded CO2 emissions of private cars and public transport in scenario A (BAU)
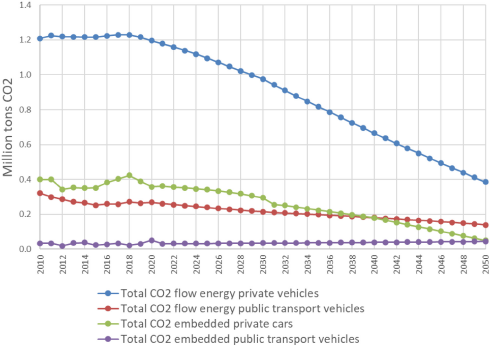
Finally, the results of the total CO2 emissions of private cars and public transport in Vienna in scenario A (BAU) by 2050 are shown in Figure 9. CO2 emissions from energy flow in private vehicles constitute the largest share. Total CO2 emissions decline slowly in the BAU scenario, from a peak of 2 million tons in 2010 to 0.6 million tons in 2050.
Development of total CO2 emissions in scenario A (BAU)
The development of the vehicle stock of passenger car transport and public transport in Vienna in scenario B (public transport) up to 2050 is shown in Figure 10. In the public transport scenario, the stock of public transport vehicles increased from 2,500 in 2019 to 4,600 in 2050. Fossil-fuelled vehicles decreased from 680,000 in 2020 to 3,000 in 2050.
Development of the vehicle stock in scenario B (public transport)
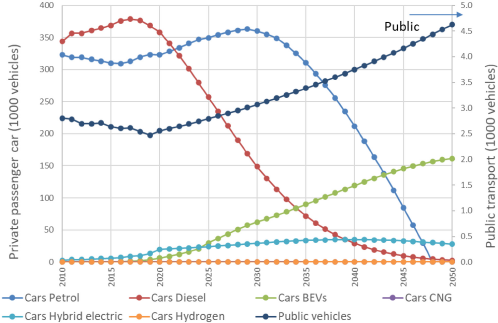
Figure 11 depicts the development of energy consumption flow and CO2 emissions of private passenger cars and public transport in Vienna in scenario B (public transport) from 2010 to 2050. The total energy consumption flow decreased much more than in the BAU scenario. Energy consumption caused by fossil-fuelled cars decreased from 4,700 GWh in 2019 to 300 GWh in 2050. By contrast, the energy consumption caused by public transport increased only slightly from 770 GWh in 2014 to 1,090 GWh in 2050. Similarly to the development of energy consumption flow, the resulting overall flow of CO2 emissions will decrease steadily by 2050. Only 0.2 million tons of CO2 emissions flow will be emitted in 2050 compared to 1.5 in 2010.
Development of energy consumption flow in scenario B (public transport)
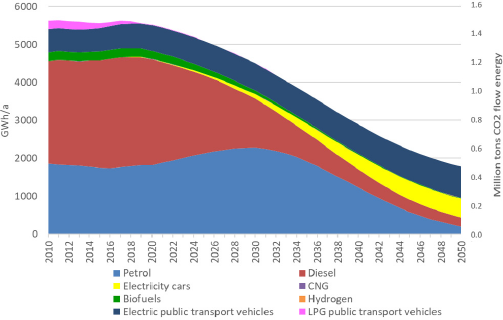
Figure 12 shows embedded CO2 emissions of private cars and public transport in Vienna in scenario B (public transport) from 2010 to 2050. Almost no more embedded CO2 emissions will be caused by fossil-fuelled cars after 2040. On the other hand, embedded CO2 emissions from BEVs and public vehicles constantly rise. In 2020, about 0.03 million tons CO2 emissions were embedded in BEVs and this amount will increase to 0.05 million tons in 2050.
Development of embedded CO2 emissions of private cars and public transport in scenario B (public transport)
Total CO2 emissions of private cars and public transport in Vienna in scenario B (public transport) by 2050 are illustrated in Figure 13. Total CO2 emissions from private vehicles would be significantly reduced compared to the BAU scenario's development. The peak of the total CO2 emissions was in 2010, with 2 million tons of CO2. In 2050, the total amount will be 0.36 million tons.
Development of total CO2 emissions in scenario B (public transport)
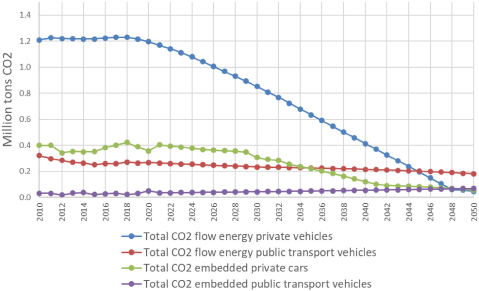
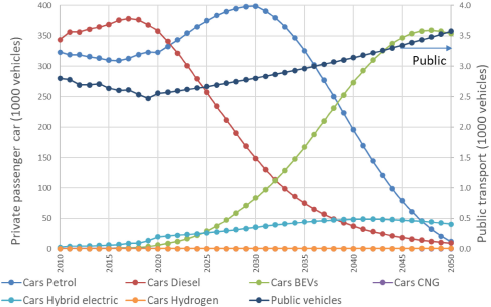
Figure 14 shows the development of the vehicle stock of private passenger cars and vehicles in public transport in Vienna in scenario C (BEV) from 2010 to 2050. The stock of BEVs increased significantly from zero in 2010 to 354,000 in 2050. Likewise, the number of vehicles in public transport is increasing. By contrast, fossil-fuelled cars' stock would significantly decrease from 667,000 in 2010 to 21,000 cars in 2050. The number of diesel-fuelled cars would decline faster than petrol-fuelled vehicles.
Development of the vehicle stock in scenario C (BEV)
The development of energy consumption flow and CO2 emissions flow of private passenger cars and public transport in Vienna in scenario C (BEV) by 2050 is illustrated in Figure 15. The total energy consumption flow decline is similar to the development in the public transport scenario.
Development of energy consumption flow and CO2 emissions flow in scenario C (BEV)
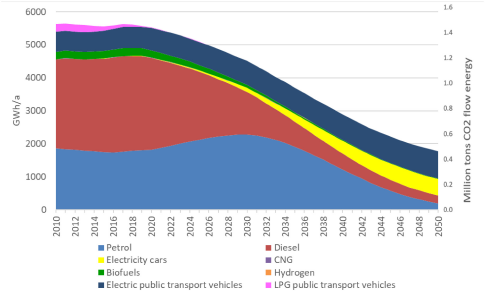
Only 1.780 GWh energy flow will be consumed in 2050, compared to 5.600 GWh in 2010. In particular, energy consumption flow by diesel decreases significantly from 2.900 GWh in 2017 to 240 GWh in 2050. Regarding CO2 emissions, a continuous increase can be observed. Only 0.3 million tons of CO2 flow will be caused by private passenger cars and public transport in 2050. The decrease in CO2 emissions caused by diesel cars is more significant than the decline from petrol vehicles.
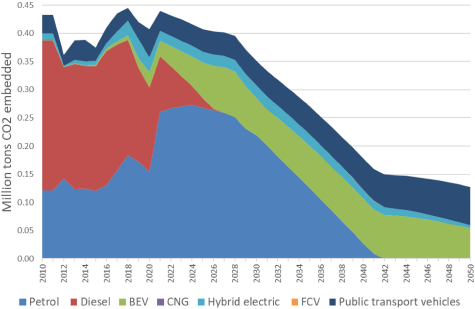
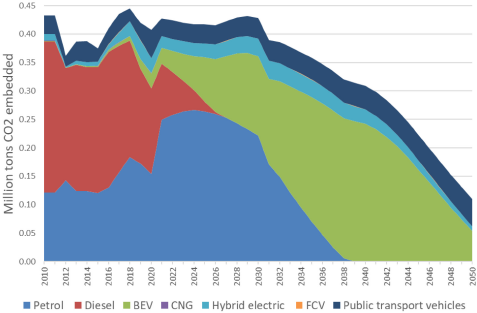
Embedded CO2 emissions of private cars and public transport in Vienna in scenario C (BEV) from 2010 to 2050 are shown in Figure 16. As in the public transport scenario, no more fossil-fuel caused embedded CO2 emissions would be in 2050. On the other hand, embedded CO2 emissions caused by BEVs increased significantly from 0.001 million tons in 2010 to 0.054 million tons in 2050.
Development of embedded CO2 emissions of private cars and public transport in scenario C (BEV)
Total CO2 emissions from private car transport and public transport in Vienna in scenario C (BEV) from 2010 to 2050 are shown in Figure 17. Total CO2 emissions will decrease continuously from 1.96 million tons in 2010 to 0.37 million tons in 2050.
Development of the total CO2 emissions in scenario C (BEV)
A critical issue is the development of the CO2 emission factor of electricity. The development of specific CO2 emissions for electricity is depicted in Figure 18. Two possible developments are shown: a business as usual electricity mix development (Ele-CO2-mix) and a progressive electricity mix (Ele-CO2-RES) development. The mix scenario considers more combined fuel and power production, which is favourable to the current mix but worse than electricity generation from RES. The RES scenario considers an official overall target of Austrian energy policy to reach 100% RES electricity generation by 2030 in a balanced system.
Development of the CO2 emission factors of transport fuels, Vienna example
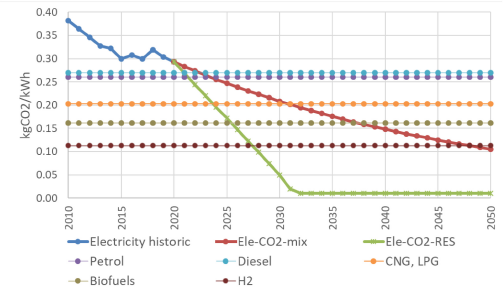
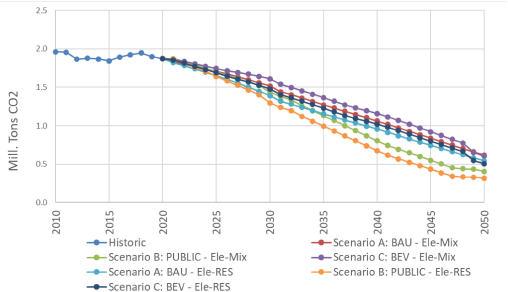
Figure 19 shows the development of overall CO2 emissions in passenger car transport in the BAU scenario A, the public transport scenario B and the BEV scenario C with the electricity mixes analysed. The CO2 emissions with electricity from RES from the different scenarios are also shown. Six possible paths were considered. One can notice that the electricity mix used in the BEV scenario has a considerable impact on total emissions, and the use of electricity from RES in the BEV scenario can significantly reduce emissions from passenger transport.
Development of the total CO2 emissions in the different scenarios
The main task of this study was to analyse energy use and resulting GHG emissions for private passenger cars and public transport in different scenarios until 2050. In addition to the energy emissions flow, embedded emissions of vehicles were also taken into account. The major conclusions of this analysis are:
(i) The model allows to consider the total and embedded GHG emissions flow simultaneously and to derive scenarios of future developments depending on policies implemented for any city worldwide.
(ii) Political measures still have the most significant impact on the future development of CO2 emissions in transport. Of the highest relevance is to provide measures to reduce the number of passenger-km driven by city planning to reduce distances between home, work, and leisure.
(iii) The transition to a sustainable transport system requires at least temporarily the "investment" in embedded CO2 emissions, e.g. in vehicles in public transport or new BEVs. However, in the BEV and public transport scenarios, these investments are paid back in about 5 to 10 years, and afterwards, clear net savings in GHG emissions are achieved.
(iv) The comparison between the "public transport" and the "BEV" scenario shows clear preferences for promoting public transport. On the one hand, it decreases overall emissions earlier. On the other hand, it leads to lower overall emissions in the long run. Hence, implementing policies promoting public transport is of high relevance. Many cities have already announced clear goals for shifting from private motorised transport to public transport, with a strong commitment to extending public lines. In a more ambitious strategy private car transport should be reduced in general.
(v) Within the scenario portfolio, the BAU scenario without an ambitious switch to RES and virtually without policy interferences – except the overall reduction in pkm travelled per capita – provides the worst-case solution from a GHG emission point-of-view.
(vi) As the largest part of the public transport and the newly introduced BEVs rely on electricity, it is very important how this electricity is generated. A major conclusion is that only if the electricity is increasingly generated from variable RES will a significant reduction in GHG emissions occur. Otherwise, the effect of electrification is almost neglectable.
(vii) Overall, the public transport scenario featuring electricity from RES has been identified as the scenario with the lowest total CO2 emissions over the investigated period up to 2050. One could avoid about 50% CO2 emissions of private passenger and public transport in this scenario, compared to the BAU scenario in 2050. Promoting public transport and BEVs is possible by employing emissions-free zones and subsidies. In addition, diesel vehicles can be banned from road traffic.
The results of scenario developments of this work are shown for a case study of the city of Vienna as a European metropolitan city. The methodology used is equally applicable to any other European city. Further, the methodology can be transferred to any other city. The only differences will be in the political targets of the cities (e.g. substitution of fossil fuels vs clean fuels).
The most important conclusion is that one can reduce GHG emissions in passenger transport in urban areas only if valid and ambitious policies are implemented. Otherwise, there is no chance of reaching climate policy goals.
The present work was funded by the Vienna Science and Technology Fund (WWTF) through the TransLoC-project ESR 17-067.
- , https://data.worldbank.org/indicator/SP.URB.TOTL.IN.ZS
- ,
Urban CO2 Emissions: A Global Analysis with New Satellite Data ,Policy Research Working Paper , (9845), 2021, https://doi.org/https://doi.org/10.1596/1813-9450-9845 - , https://theicct.org/transport-could-burn-up-the-eus-entire-carbon-budget/
- , , EU Transport in figures: Statistical Pocketbook 2021, 2021
- ,
Dissemination of electric vehicles in urban areas: Major factors for success ,Energy , Vol. 115 ,pp 1451–1458 , 2016, https://doi.org/https://doi.org/10.1016/j.energy.2016.05.040 - , , Vehicles in use Europe: ACEA Report, 2021
- ,
Do sustainable energy policies matter for reducing greenhouse gas emissions? ,CefES-DEMS Paper Series , (245), 2019, https://doi.org/https://doi.org/10.2139/ssrn.3513041 - ,
Good practice policies to bridge the emissions gap in key countries ,Global Environmental Change , Vol. 73 ,pp 102472 , 2022, https://doi.org/https://doi.org/10.1016/j.gloenvcha.2022.102472 - ,
On the Historical Development and Future Prospects of Various Types of Electric Mobility ,Energies , Vol. 14 (41070), 2021, https://doi.org/https://doi.org/10.3390/en14041070 - ,
Decarbonising transport in Europe: Trends, goals, policies and passenger car scenarios ,Research in Transportation Economics ,pp 101068 , 2021, https://doi.org/https://doi.org/10.1016/j.retrec.2021.101068 - ,
Road transport electrification – Is timing everything? Implications of emissions analysis' outcomes for climate and air policy ,Transportation Research Interdisciplinary Perspectives , Vol. 12 ,pp 100478 , 2021, https://doi.org/https://doi.org/10.1016/j.trip.2021.100478 - ,
Effectiveness of low-carbon development strategies: Evaluation of policy scenarios for the urban transport sector in a Brazilian megacity , 2017, https://doi.org/https://doi.org/10.1016/j.techfore.2016.08.016 - ,
Alternative electrification pathways for light-duty vehicles in the European transport sector ,Transportation Research Part D: Transport and Environment , Vol. 99 ,pp 103005 , 2021, https://doi.org/https://doi.org/10.1016/j.trd.2021.103005 - ,
Measuring the potential emission reductions from a shift towards public transport ,Transportation Research Part D: Transport and Environment , Vol. 73 ,pp 338–351 , 2019, https://doi.org/https://doi.org/10.1016/j.trd.2019.07.010 - ,
Scenario planning for transport practitioners ,Transportation Research Interdisciplinary Perspectives , Vol. 11 ,pp 100438 , 2021, https://doi.org/https://doi.org/10.1016/j.trip.2021.100438 - ,
Land transport development in three integrated scenarios for Germany – Technology options, energy demand and emissions ,Transportation Research Part D: Transport and Environment , Vol. 90 ,pp 102669 , 2021, https://doi.org/https://doi.org/10.1016/j.trd.2020.102669 - ,
Modelling road transport emissions in Germany – Current day situation and scenarios for 2040 ,Transportation Research Part D: Transport and Environment , Vol. 87 ,pp 102536 , 2020, https://doi.org/https://doi.org/10.1016/j.trd.2020.102536 - ,
Factors and scenario analysis of transport carbon dioxide emissions in rapidly-developing cities ,Transportation Research Part D: Transport and Environment , Vol. 80 ,pp 102252 , 2020, https://doi.org/https://doi.org/10.1016/j.trd.2020.102252 - ,
Climate policies for freight transport: Energy and emission projections through 2050 ,Transport Policy , Vol. 107 ,pp 11–23 , 2021, https://doi.org/https://doi.org/10.1016/j.tranpol.2021.04.005 - ,
Implications of road transport electrification: A long-term scenario-dependent analysis in China ,eTransportation , Vol. 6 ,pp 100072 , 2020, https://doi.org/https://doi.org/10.1016/j.etran.2020.100072 - ,
Forecasting model of activities of the city-level for management of CO2 emissions applicable to various cities ,Journal of environmental management , Vol. 286 ,pp 112210 , 2021, https://doi.org/https://doi.org/10.1016/j.jenvman.2021.112210 - ,
How Policies Affect the Dissemination of Electric Passenger Cars Worldwide ,Energies , Vol. 14 (82093), 2021, https://doi.org/https://doi.org/10.3390/en14082093 - ,
How policy measures succeeded to promote electric mobility – Worldwide review and outlook ,Journal of Cleaner Production , Vol. 206 ,pp 66–75 , 2019, https://doi.org/https://doi.org/10.1016/j.jclepro.2018.09.121 - ,
Policy Instruments to Promote Electro-Mobility in the EU28: A Comprehensive Review ,Sustainability , Vol. 10 (72507), 2018, https://doi.org/https://doi.org/10.3390/su10072507 - ,
Future local passenger transport system scenarios and implications for policy and practice ,Transport Policy , Vol. 90 ,pp 52–67 , 2020, https://doi.org/https://doi.org/10.1016/j.tranpol.2020.02.009 - ,
Developing policy packages for low-carbon passenger transport: A mixed methods analysis of trade-offs and synergies ,Ecological Economics , Vol. 193 ,pp 107304 , 2022, https://doi.org/https://doi.org/10.1016/j.ecolecon.2021.107304 - European Commission, Transport: What the Commission is doing, https://ec.europa.eu/info/topics/transport_de
- ,
Urban Electrification: Knowledge Pathway Toward an Integrated Research and Development Agenda , 2019, https://doi.org/https://doi.org/10.2139/ssrn.3440283 - , https://ec.europa.eu/info/law/better-regulation/have-your-say/initiatives/12916-Sustainable-transport-new-urban-mobility-framework_en
- , https://www.wien.gv.at/stadtentwicklung/studien/pdf/b008551.pdf
- , 2021, https://www.statistik.at/web_de/statistiken/menschen_und_gesellschaft/bevoelkerung/demographische_prognosen/bevoelkerungsprognosen/index.html
- ,
, Zahlen, Daten, Fakten , , Wiener Linien GmbH & Co KG - Betriebsangaben, 1990-2020 - , http://www.statistik.at/web_de/statistiken/energie_umwelt_innovation_mobilitaet/energie_und_umwelt/energie/energiebilanzen/index.html
- , https://www.statistik.at/web_de/statistiken/energie_umwelt_innovation_mobilitaet/verkehr/strasse/kraftfahrzeuge_-_bestand/index.html, 1991-2020
- ,
Electric Mobility in Cities: The Case of Vienna ,Energies , Vol. 14 (1217), 2021, https://doi.org/https://doi.org/10.3390/en14010217