


Reducing the cost of renewable energy (RE), particularly wind and solar, remains a challenge in developing countries. Most developing countries are struggling to lower the financing cost of renewables, which affects their competitiveness against fossil fuels [1]. Despite the financing cost, these countries are also hampered by the structural issue of high investment costs [1]. The overall net effect is a clear loss in competitiveness for renewable energy deployment in developing countries. There is a long-running bidirectional causality between renewable energy consumption and carbon emissions, which explains the notable influence of developing countries over global carbon emissions and the need to focus on the issues surrounding this [2].
Indonesia is one of the developing countries grappling with such renewable development challenges. Although endowed with vast renewable energy potential, the country is still highly dependent on fossil fuels for its electricity. Producing around 58% of domestic electricity, the coal-fired power plant dominates the electricity energy mix in the country [3]. To achieve Indonesia’s NDC (Nationally Determined Contribution) target, which takes the energy system as the second-largest contribution, the government has to go the extra mile to achieve the target of 23% renewable energy share in the primary energy supply by 2025 (Government Regulation 79/2014). Renewables only contributed 12.2% of the installed capacity mix in 2019, and it has been stagnant since 2011 [4]. When it comes to wind and solar energy, the adoption of both exhibits a stagnancy. By 2017, solar and wind electricity capacity was maintained below 0.1 GW [5]. Slow deployment of wind and solar in Indonesia is referred to some inefficiencies of renewable energy regulations [6].
Harsher regulations of carbon-based technologies, which may encompass tax incentives and other policies akin to them, have been enacted in light of the extensive deployment of renewable energy [7]. One example is the fiscal incentive, which aims to lessen costs associated with investment and plant operation [8]. The policies contribute substantially to driving the advance of renewable technologies by attracting the investment that leads to advancing technology penetration, resulting in a competitive cost and stimulating sustained development in the sector. The government institutes fiscal incentive policies at specific levels of intervention to enhance the competitiveness of renewable energy technology costs. They may manifest as income tax facilities, import duties and value-added tax (VAT) facilities, or subsidies. It should be noted that a policy’s efficiency has a negative correlation with its level of intervention [9]. Cost efficiency is considered an essential assessment of the incentive policy. The efficiency of the incentive policy hinges on its capacity to attract more investment in renewable energy by improving its cost competitiveness in the short term and accelerating its deployment in the long term.
Previous studies have highlighted the impacts of fiscal policies to enhance RE deployment by utilising several approaches, such as econometric analysis [10], cross-sectional time-series [11], and Input-Output (I-O) analysis [12]. Existing studies primarily focus on developed countries. For instance, focusing on the European Union, an empirical study measured the fiscal policy's effectiveness on renewable energy deployment in a particular region [13]. Over the district level, state fiscal incentives were observed to yield a notable positive effect on wind energy development in the western region of the United States [12]. The previous finding on fiscal policy impact so far has not been homogenous across countries. The magnitude of fiscal instruments’ effectiveness in developing countries such as Indonesia is still underemphasised in the literature. This paper aims to fill this gap and contribute new perspectives on the effect of fiscal policy by using Indonesia as a case study. This study presents a magnitude impact analysis of certain types of fiscal policy in the country utilising a financial model,.
Therefore, by employing six types of fiscal incentive scenarios which include tax incentives (tax holiday, tax allowance, value-added tax reduction) and subsidy policies (interest rate subsidy, land acquisition support, and project development facility), the study simulates the effect of particular interventions on the economic price of renewable energy power plants. This study makes significant contributions in several ways. First, the study contributes to the literature by providing an efficient policy for promoting the deployment of RE, especially wind and solar technology, in a developing country such as Indonesia. In developing countries, renewable development is complicated by the need to enhance electricity access for living improvement and maintain tariff affordability. Second, it employs a financial model designation in analysing data regarding particular, fiscal policies in Indonesia. Compared to other utilised measures, the impact of existing and the potential fiscal incentive can be estimated comprehensively. Third, policymakers could understand the kind of fiscal incentives that effectively increase investment in renewable energy projects.
The structure of the paper is as follows: Section 2 describes the prior research of incentive policies and their implication, section 3 presents the methods, and section 4 discusses the results and brings the main findings into context.
In a new era of energy investment, wind and solar electricity generation have become prominent for renewable energy investors [14]. This is partly because the last decade has seen a marked decrease in electricity costs from renewables, particularly wind and solar energy. There was an 82% decline in the global weighted-average levelised cost of electricity (LCOE) of solar photovoltaics, reaching 0.068 USD/kWh, with onshore wind and offshore wind amounting to 0.115 USD/kWh (fell 39%) and 0.053 USD/kWh (fell 29%), respectively [15]. Both technologies are increasingly out-competed compared to the estimated cost of new fossil fuel-fired projects, which may vary from 0.05 USD/kWh to 0.177 USD/kWh.
As costs continue to fall, the deployment of wind and solar is still ongoing and dominating the total renewables installations. Worldwide, solar photovoltaics (PV) installed capacity is expected to experience a 68% rise by 2025, with the total investment reaching 192 billion USD per year [1]. Meanwhile, there will be an increase of greater than 300% in the global cumulative installed capacity of wind power in 2025, from the remaining period up to 2050 (211 billion USD per year) [16]. The massive deployment of solar and wind investment cannot be disconnected from investment climate improvement, including technology advancement, up-gradation of electricity generation intermittent management, and high commitment from policy effort. These measures significantly take lead to costs fall of solar and wind investment.
Over the years, renewable technology has been attributed to the increase in electricity production costs due to the lower competitiveness of renewable energy systems (RES) technology in most electricity systems [17], but this is no longer the case. Even before considering the external costs of coal-fired generation, breakthroughs in solar and wind power have enabled them to rival the capacity of coal generators in providing affordable energy [18]. Furthermore, many new solar and wind installations could now compete with the operating costs of coal-fired power stations [19].
Several substantial factors can create a positive environment and leverage renewable energy deployment, such as financial, legislative, political, and fiscal incentives [20]. Due to high initial costs and potential risks related to technology and resource uncertainties, there is a need for financial support. This incentive can be a public sector fund provided through grants or loans [21]. Legislative support for the RE project is related to the importance of clear legal frameworks for improving investor interest. An example of this support is the Feed-in Tariff (FiT), which supplies renewable generators with a fixed income earned by their projects [22]. In addition, the expansion of renewable energy resources may be promoted through long-standing, nationwide political backing, including national energy policies [23]. Each type of support is necessary for addressing the specific aspects of many RE deployment obstacles.
Fiscal support to overcome financial barriers is necessary for deploying the renewable project. Particular forms of support could improve renewable energy competitiveness, particularly by addressing the proportion of initial costs from the total plant cost [24]. The intervention is essential in nurturing early-stage RE technology and changing its overall cost structure [25]. Furthermore, fiscal policies can improve the financial appeal of renewable power projects, enticing independent power productions to consider investing in them. Several policies, including fiscal incentives, could be employed in the renewable energy market to remedy its shortcomings, according to a dataset from the OECD panel [26].
Under a holistic view, fiscal incentives assume the form of several schemes, including tax incentives, subsidies, attractive loans, and a mix of other strategies (see Table 1).
Fiscal interventions
Scheme |
Price-driven |
Quantity-driven |
||
|---|---|---|---|---|
Investment incentive |
Generation incentive |
Investment incentive |
Generation incentive |
|
Tax exemption |
Carbon emission tax Tax allowance Tax holiday |
|||
Subsidy |
Fossil subsidy reformation Capital subsidy Rebate |
|||
Attractive loan |
Soft loan Partial loan guarantees |
|||
Other |
Grant |
Feed-in Tariff |
Tendering system for long-term contract |
|
Feed-in Premium |
Tendering system for investment grant |
Renewable portfolio standard |
||
Financial guarantee |
Rate-based incentive |
Tradable green certificate system Quota |
||
The means of government intervention within the market could be classified into two approaches: price-driven and quantity-driven. The price-driven approach does not impose quantity targets. Still, it concerns maintaining electric power generators through a financial subsidy per kW of capacity installed or a payment per kWh of energy produced [27]. In comparison, the quantity-driven approach is contingent on the government, specifically regarding what it desires to be the level of generation or market penetration of electricity from different RES [27]. Market penetration is promoted through this approach, where the regulators determine the desired quota or goal and the time frame while allowing competition between generators to dictate prices.
Subsequently, the policies are grouped in more detail based on government-specific purposes: investment incentives and generation incentives. The investment incentives aim to enhance the deployment of renewable energy investment. The implemented policies have to support the financing of independent power producers through investment subsidies, which can bring down the financial risk and encourage climate investment in the renewable energy sector [27]. Moreover, reforming fossil fuel subsidies is also important to ensure competitiveness in the energy sector [28]. Incentives, in contrast, place a greater emphasis on expanding renewable energy generation, with their prices being borne by consumers and largely offered as a fixed payment or as a premium per unit of energy generated. This kind of policy includes the feed-in tariff, feed-in premium, and public biddings.
Based on their advantages, fiscal incentives have been implemented by a certain region/country to support renewable energy deployment. In addition to penalising the use of fossil fuels due to externalities and recycling it for RE projects, several European countries have been delivering tax exemptions, such as for individual investors of wind energy in Germany and reduction of tax on biofuel in France [20]. This particular approach has also been implemented in some emerging countries. The government of China has been delivering support by providing various fiscal incentives. These include VAT exemption for power installations that utilise municipal solid waste incineration and tax exemption for three years’ worth of income for various types of renewable energy (wind, solar, hydro, and geothermal power projects). It is also possible to finance the import duty and VAT of vital components and raw materials used by local businesses to build wind turbines [29]. As mandated by the Electricity Act of 2003, India has delivered fiscal incentives, including tax holidays, 100% depreciation in year 1, concessional import duties, and sales tax exemption [30]. In Brazil, specific tax incentives have been regulated to reduce the cost at phases of construction and operation of renewable energy for electricity generation [31]. In the South-East Asian region, some countries, including Malaysia, Indonesia, the Philippines, and Thailand, have implemented several types of fiscal incentives [24]. Today, the Government of Indonesia has actively intervened in the renewable energy market through an incentive policy to improve market competitiveness. The intervention includes income tax incentives, tax holidays, import duties exemptions, monetary contributions to green investments, and soft loans. However, the financial strain imposed by these incentive policies has caused them to face stagnation.
As is common with other renewable energy technologies, wind and solar are capital intensive. The cost component of both technologies is dominated by the upfront capital cost, predominantly referred to as capital expenditure [32], particularly the cost of the wind turbine [33]. Even though, between 2010 and 2019, there was an 82% and 39% drop in the global weighted-average LCOE of utility-scale wind and PV plants, respectively, it remains true that the share of different cost components is specific to the country and the project in question. In wind and solar power projects, such components involve the country’s cost structures, site requirements, and the competitiveness of the local wind and solar industry. Some countries exhibit significant improvement in terms of reducing the cost of renewables. China and India are two countries which have lower capital costs for all-generation technology than the global benchmark.
Even though some improvements have been demonstrated in the capital cost of wind and solar projects in other countries, they remain uncompetitive in Indonesia [34]. For instance, in India, China, and Europe, solar PV enjoys a capital cost of below 1000 USD/kW, whereas, in Indonesia, it can vary from 700 to 1200 USD/kW [15]. The overall capital cost is ultimately influenced by various factors associated with each capital cost component. As mentioned above, the expenditures on equipment dominate the total investment cost. In contrast, the local content requirements have resulted in the prohibitive prices of solar PV modules, regarded as one of the most expensive pieces of equipment in Indonesian solar projects compared to their non-solar counterparts. It is also worth noting that a lack of sufficient critical infrastructure affects these steep capital costs. For instance, wind power relies more on critical infrastructure to transport rotor blades and tower segments than solar PV equivalents. Therefore, these components’ installation and logistics costs may increase if the turbine is built in an underdeveloped region. Moreover, Indonesia’s bureaucratic system, whose process involves the procurement of permits and land access, as well as the entire management of grid access, may exacerbate pre-development costs because these costs depend on a country’s regulatory environment.
The experience of other advanced countries indicates that the decline of project costs with the increased deployment of wind and solar cannot be separated from fiscal policies. On the one hand, new markets have become accessible due to the fiscal instruments in some countries. A new wave of solar and wind power expansion will follow, aiding cost offsetting through the learning effect [16]. Moreover, fiscal policy might also impact the cost component, thus promoting the further deployment of future renewables.
One could reduce the LCOE of the renewable power plant by turning to the international market to ensure lower prices for renewable equipment. Subsequently, some countries grant exemption from import duty in the case of equipment in the power sector. Such an incentive facility would decrease the LCOE at a rate 2−5% lower than that involving the adoption of import duties and taxation [34]. Moreover, some countries have introduced a viability gap fund (VGF) to bolster an installation’s financial viability and appeal to investors through direct assistance. Through a capital grant scheme, the VGF would reduce LCOE by 15.7% under the assumption of a 20% capital grant injection [34]. Another well-known fiscal instrument is a soft loan, which sets a loan below the market interest rate, which will cause a notable decrease in the current rate of solar LCOE to the range of 3.5−8 USD cents per kWh [34].
Against this backdrop, this study fills the gap in the existing literature by simulating several types of fiscal policies toward the deployment of renewable energy, which is partially installed in remote areas. With this aim, the research was conducted in Indonesia, an archipelagic country where wind and PV development deployment is still in the initial stage. This study is noteworthy for deploying renewables, particularly small-medium capacity projects supporting local energy security.
This study proposed a descriptive research approach which examines how distinct fiscal policy instruments interfere with the viability of a particular RE project. This study generally employed multi-approach assessment using simple financial feasibility and cost-benefit analysis. The financial structure of RE projects was modelled to elicit the price by holding the project’s net present value (NPV) at a constant zero level as the least criterion for feasibility. The results were further deployed into cost-benefit analysis to examine the lowest required price for a project to be viable. The estimated electricity price in this study also perceived as bid price by the independent power producers to the utility company. Fiscal incentive schemes (tax reliefs and subsidies) were incorporated to determine how the policies affect the electricity price. We also performed a sensitivity analysis to evaluate the price’s response if the policy variables change.
In general, this study aims to simulate the effect of several government interventions through fiscal policy on electricity prices generated from the renewable energy power plant. The simulations only focused on solar PV and wind energy as the subject of analysis, considering the growing global investment in the two technologies and the Indonesian target to deploy a larger scale of solar and wind energy in coming years. As the object of observation, this study examined 66 solar PV and wind power plant projects across Indonesia listed in the 2019−2028 Electricity Supply Business Plan. All projects are assumed to be built in 2020, with a project lifetime of 25 years for solar PV and 30 years for a wind power plant. The standardisation of the starting year in 2020 aims to ensure the same cost and price level for all projects; therefore, they are easier to compare. The sample distribution is presented in Table 2.
Assumptions and data for the cost breakdown were collected from various sources, including a review of the extant literature and primary input from RE project developers. We used a sample of five RE projects, consisting of two wind and three solar power plants, to define the financial and technical assumptions. The required information for the cost breakdown emerged from a series of in-depth interviews, focus group discussions (FGDs), and mini-surveys involving national and international scale RE developers. Various assumptions used for the financial model were determined through interpolating the collected data. A policy review was also undertaken to evaluate the existing fiscal policy in the RE sector.
Sample distribution
RE technology |
Total projects |
Capacity range [MW] |
Totalcapacity [MW] |
Distribution based on island |
||||
|---|---|---|---|---|---|---|---|---|
Sum-atra |
Java |
Kalim-antan |
Sula-wesi |
Eastern Indon. |
||||
Solar PV |
36 |
0.25–100 |
581 |
50% |
3% |
3% |
10% |
33% |
Wind |
30 |
3.8–150 |
1448 |
21% |
53% |
5% |
5% |
16% |
Total |
66 |
0.25−150 |
2029 |
26% |
38% |
6% |
6% |
24% |
Note: Eastern Indonesia includes Bali, Nusa Tenggara, Maluku, Papua, and West Papua
The main method used in this study is a financial model simulation, which further needs the cost breakdown of the project’s overall expenditure. It has already been mentioned that the projects evaluated in this study are an ex-ante simulation. The cost components indicated here are predominantly based on the project’s feasibility study. Still, some cost components are benchmarked to the current operating power plants with several adjustments (e.g., accounting for exchange rate and inflation).
As an overview, the cost components of an RE power plant project are composed of three main expenses, namely (1) Capital Expenditure (CAPEX), which includes Engineering, Procurement, and Construction (EPC) costs and non-EPC costs; (2) Operating Expenditure (OPEX); and (3) Financing Cost (cost of the equity and cost of debt)). Value-added tax (VAT) adds to the overall CAPEX as it is mandatory by the government and typical in each country. As a result, the VAT component raises the average cost of electricity generated. Furthermore, along with revenue, these cost components determine the electricity price level (see Table 3).
Summary of general parameters
Parameter |
Value |
|---|---|
Cost of equity |
14.98% |
Cost of debt |
7.00% |
Debt to Equity Ratio |
70:30 |
Corporate income tax rate |
25% |
Weighted Average Cost of Capital & Discount Rate |
8.17% |
Inflation rate |
3.50% |
Exchange rate |
IDR14,000 per USD |
OPEX escalation |
40% higher than inflation |
Regional Adjustment Factor |
|
Sumatra |
1.2 |
Java |
1 |
Kalimantan |
1.3 |
Bali & Nusa Tenggara |
1.5 |
Sulawesi |
1.4 |
Maluku & Papua |
1.6 |
In general, the regulatory and geographic aspects influence both revenue and the cost of power plants. As regulated in the Indonesian Ministry of Industry Regulation No. 5/2017, solar PV projects must meet the local content requirement (Tingkat Komponen Dalam Negeri, acronym TKDN). TKDN requires the power plant projects to use at least 40% locally produced solar modules. According to the IESR [4], this will significantly increase solar modules as the price difference between local and imported modules is quite high, around 27% to 88%. Meanwhile, the geographic factor is represented by the regional adjustment factor, which will affect certain costs that differ geographically, such as the cost of civil works and land acquisition.
The characteristics of each technology, combined with regulatory and geographical factors, create additional factors affecting the cost components of RE. These features have also been considered in developing the cost structure. For instance, the biogas and biomass power plant require a major overhaul after thousands of working hours or around eight years. Meanwhile, solar PV power plants experience a certain degradation rate which causes decreasing electricity produced annually and the inverter of solar PV in general needs replacement every ten years.
The proportion of each cost component − CAPEX and OPEX − is also different for each RE. In general, the proportion of CAPEX of solar PV and wind power plants is higher than that of their OPEX, which only accounts for approximately 1% to 2% of CAPEX cost per annum. The OPEX is assumed to increase by 4.9% annually after adjusting to the inflation rate. Understanding this will provide insight into estimating the period of cash disbursement and the choice of source of financing along the project’s lifetime.
The simulation of project feasibility through a financial model was conducted using the Discounted Cash Flow method. This approach will generate the NPV, which is difference between the cost of an initial investment with the present value of potential cash flow over the project lifetime. Furthermore, the Internal Rate of Return (IRR) is another commonly used indicator to evaluate a project at which NPV equals to zero.
The process started with calculating the investment cost (CAPEX) and operating & maintenance cost (OPEX) over the project lifetime. Then, constructing the income and cash flow statements precedes estimating the NPV and IRR. If NPV equals zero, the IRR will be at the same level as the discount rate.
The next step of the simulation was to induce fiscal policy interventions (Table 4) in the financial model and evaluate the new price given the government interventions. The interventions are categorised into two groups: tax incentives and subsidies. The tax incentives comprise of the tax holiday, tax allowance, and reduction in value-added tax. Whereas the interest rate subsidy (soft loan), land acquisition support, and project development facility (only focuses on feasibility study (FS) expense subsidy) compose the subsidy policies.
Fiscal policy interventions
Type of Intervention |
Intervention name |
Mechanism |
|---|---|---|
Tax Incentive |
Tax Holiday(Based on the Minister of Finance Regulation No. 150/PMK 010/2018) |
Reduction in the corporate income tax:
|
Tax Allowance (Based on the Minister of Finance Regulation No. 89/PMK 010/2015) |
Scheme:
|
|
Reduction on VAT |
VAT reduction to several levels: 5% and 0%. |
|
Subsidy |
Cost of Fund Subsidy |
Reduction in the cost of funds to several levels: 4% and 3%. Evaluation of an increase to 12%. |
Feasibility Study(FS) Expense Subsidy |
Reduction of FS fee expense to several levels: 25%, 50%, 75%, and 100%. |
|
Land Acquisition Support |
Reduction of land transaction cost and land-right transfer fee, or land concession agreement which is commonly through Build, Operate and Transfer (BOT). |
For decades, Indonesia’s electric power industry has been managed solely by Perusahaan Listrik Negara (PLN), a state-owned monopoly, with various business units that carry out functions involving generation, transmission, and distribution. However, to meet the skyrocketing electricity demand since the 1980s, the government has taken action to deregulate the power market structure and introduce competition in the power sector [35]. The 1985 electricity law signified the start of the structural reform that contributed to the opening up of the electricity market to private investors. Still, it had little impact on administrative governance structures [36]. Indonesia began allowing Independent Power Plants (IPPs) to participate in the electricity industry in 1992, notably in the power generation business units.
In 2020, the government stipulated a mandate to PLN to expedite the provision of electricity across the country and aim for a 100% electrification rate through the construction of power plant projects using renewable energy, coal, and gas. The programs include Fast Track Program (FTP) I, FTP II, and 35 GW Program. In response to the mandate, private investors were invited to leverage their involvement in Indonesia’s power industry by participating in the construction of power plants, including the related transmission lines, and for PLN to purchase the electricity and, in addition to that, in a limited permit, supply end users. In the future trajectory, the role of the private sector is expected to be more salient as IPP-owned power plants are projected to outgrow PLN’s power generators—more than 75% of private ownership in the 35 GW program. Furthermore, deploying renewable energy projects increases the demand for private investments [37].
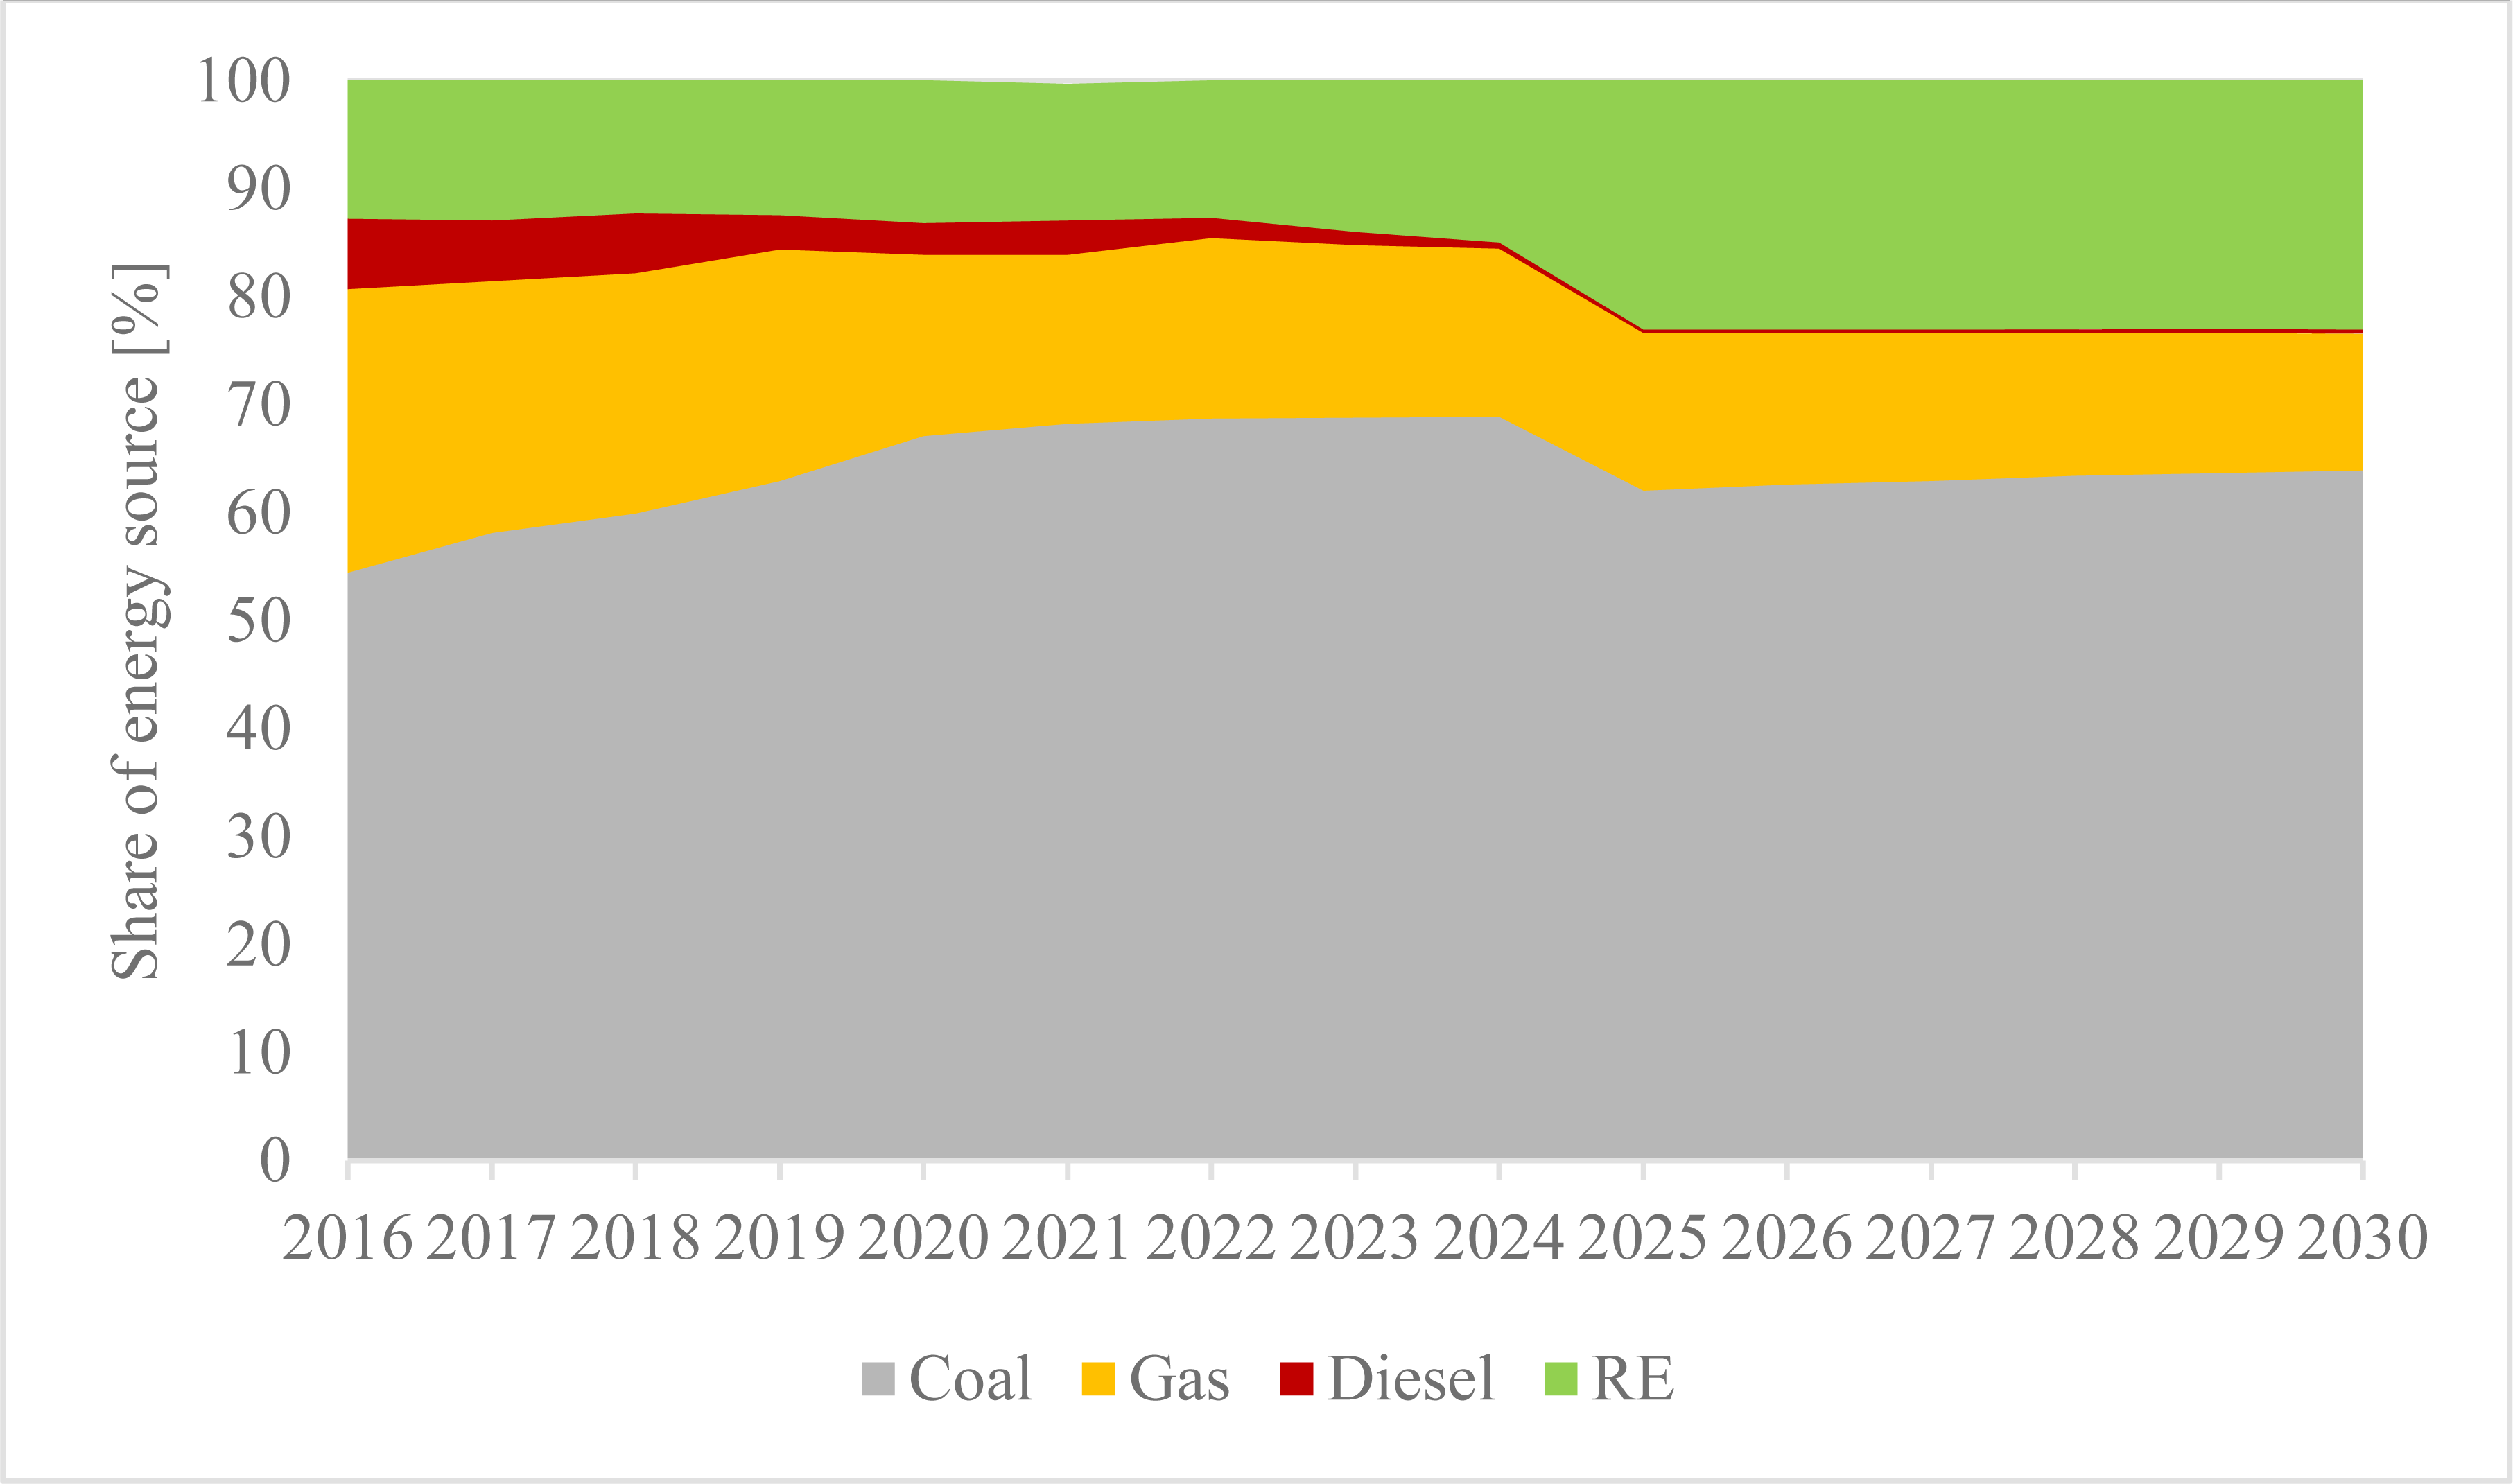
Following the government’s climate commitment to cut 29% of carbon emissions (approximately 834 million tons CO2 annually) compared to the baseline by 2030, the electricity sector aims to achieve a 23% renewable energy share by 2025. Figure 1 depicts the change in electrical energy mix over the last six years and projections for future trajectory. For decades, coal-based electricity has dominated the nation’s power industry, occupying the lion’s share of just above 66% in 2020 and tending to rise until 2024 by up to 68%. Meanwhile, the diesel power plant is pushed down to the minimum level. Nonetheless, despite the country’s effort to achieve the climate pledge, the contribution of renewable energy generation did not exhibit any significant improvement during the past couple of years. In 2020, RE only contributed 13.2% and was forecasted to have a paltry incremental before being expected to achieve 23% in 2025. Indonesia’s slow deployment of renewable energy power plants depends on several convoluted conditions such as an unfavourable pricing scheme, uncertain regulation and the business climate [38].
Electric Energy Mix 2016−2030, where 2021−2030 data are projected under the optimal scenario
The impact of existing and potential fiscal incentives on the feasibility of solar and wind projects in Indonesia was estimated by utilising a financial model. The investigation included 66 solar PV and wind power plant projects across Indonesia, listed in the 2019−2028 Electricity Supply Business Plan.
The tax incentive policies include tax allowance, tax holiday, and VAT reduction. Each intervention derives a different level of price change. Tax allowance results in higher price change followed by tax holiday and VAT reduction. However, the price elasticity is different in each type of technology for each policy intervention. According to [32], the price distribution of solar PV is huge compared to wind due to the wide capacity gap in solar PV projects (see Table 2), but the tax allowance as an intervention has consistently reduced price of both renewable energy sources.
Price distribution of solar PV and wind projects as a result of tax reduction policies
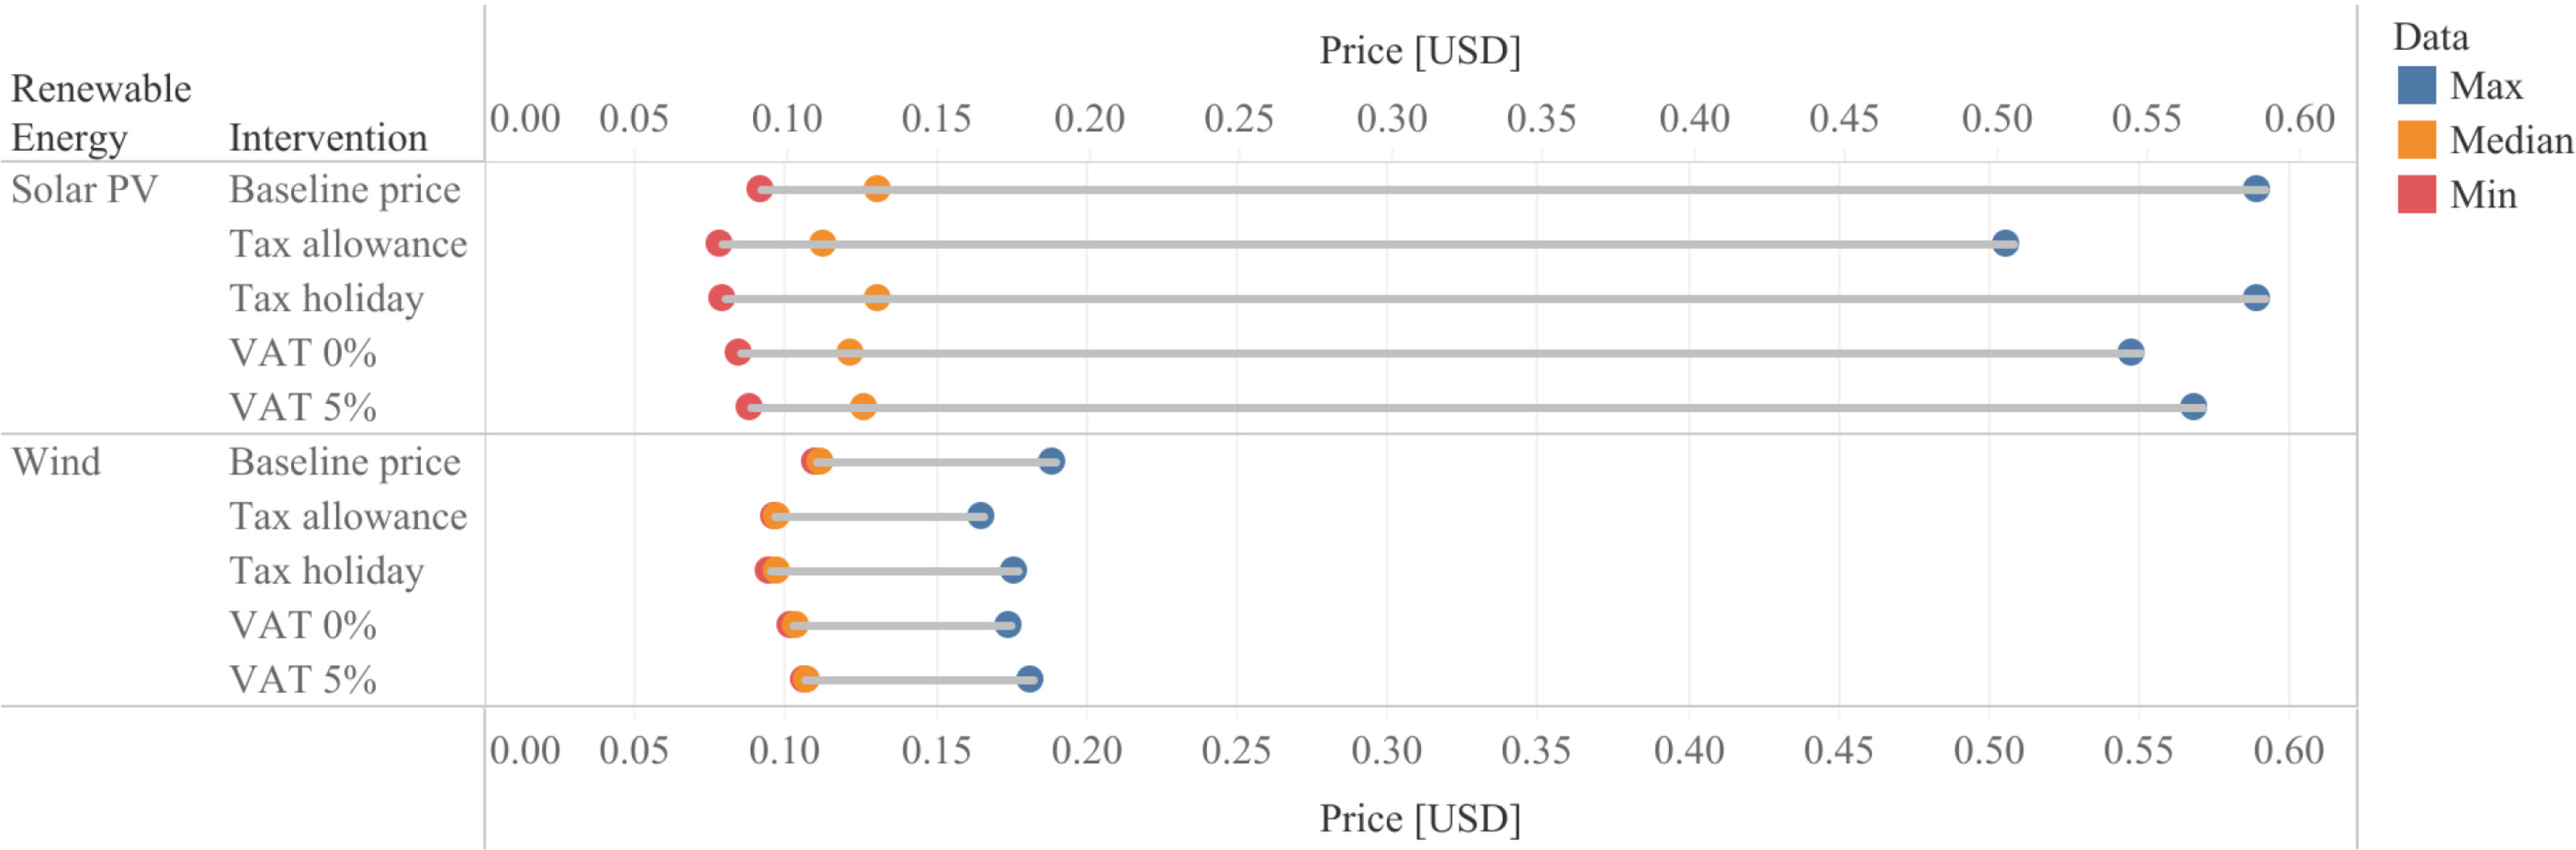
This typical policy has been implemented since 2015 through the Regulation of Minister of Finance No. 89 the Year 2015. It regulates the reduction of the net income for tax calculation and a set of asset depreciation and loss compensation setting for several key sectors in Indonesia, including renewable energy. This arrangement makes a project eligible for income tax exemption in the early operationalisation stage. Based on the simulation result, with the application of tax allowance in the RE power plant project, the electricity price drops on average at 12.63% for wind and even greater for solar PV at 14.3%. This price change is the highest compared to other fiscal policy interventions observed in this study. Furthermore, it also might be implied that tax allowance is the most applied facility by RE power plant developers due to ease of application and less complicated requirements.
The tax holiday is a particularly new facility in the energy sector introduced in 2018 through the Regulation of Financial Minister No. 150 of 2018. The facility offers an income tax reduction for a project with specific requirements, notably in the amount of initial investment. This facility is less favourable because not all projects are qualified to be rewarded with the incentive, and thus it has a low rate of applicants. When simulating a tax holiday in the financial model, the outputs present a declining average price rate of 11.9% and 8.8% for wind and solar PV, respectively. Similarly, a study conducted by the Fiscal Policy Agency in 2018 indicated a 2.11% increase in project IRR using the tax holiday facility.
The price reduction for Solar PV in the tax holiday scheme is significantly lower than the price reduction resulting from tax allowance. This is because the minimum initial investment requirement causes many solar PV projects being not eligible to apply for the tax holiday, given their small scale and lower investment. Whereas small-scale projects essentially have the potential to escalate the electricity rate, particularly in remote areas. Hence the facility is fundamentally needed to increase project feasibility.
The government has set a 10% value-added tax for imported components and civil works. Although this value makes up only a small portion of CAPEX, it might be very considerable for a small-scale project if one can eliminate it. Reducing 50 % VAT shrinks electricity prices on average by 3.6% for solar PV and wind energy. In comparison, fully exempted VAT drops the price to on average 7.2% relative to the basic price with no facility applied. Fiscal Policy Agency found that delivering import facility to RE power plant project allows IRR to rise to 3.62% for solar PV power plants.
The subsidy schemes simulated in this study − the cost of debt, cost of land, and expense for undertaking the feasibility study − have different impacts on the prices of solar and wind power plants. On average, solar prices are more sensitive to subsidies than wind prices, except for the cost of debt. According to Figure 3, solar PV and wind price distribution significantly vary for each subsidy intervention. Still, the cost of debt rising from baseline (7%) to 12% caused the highest increase in median prices compared to other interventions.
Price distribution of solar PV and wind projects as a result of subsidy intervention
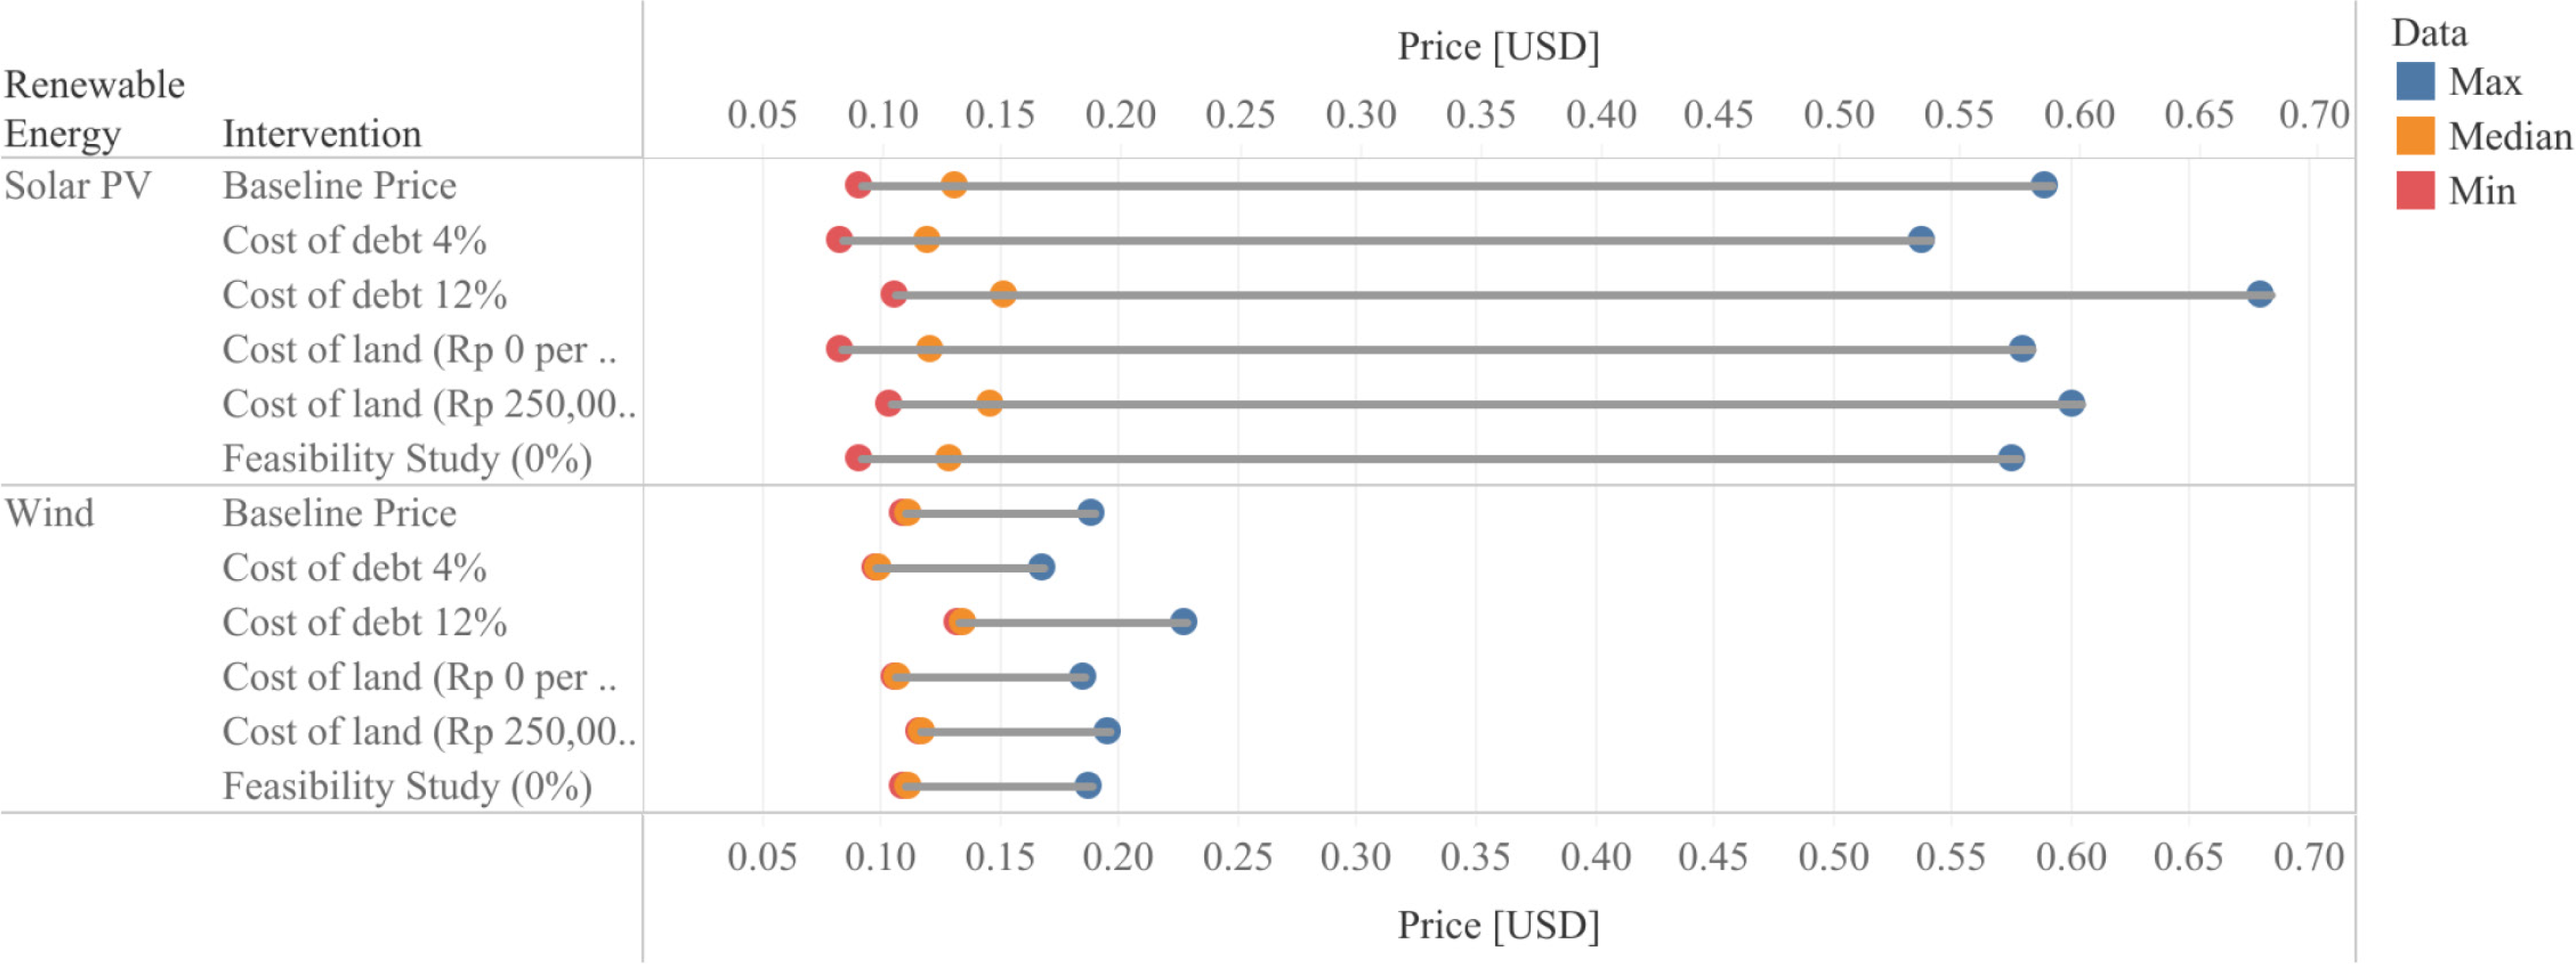
The reduction in the cost of debt from 7% to 4% − referring to the interest rate of the international loan for developing countries − could, on average, reduce electricity price of wind power prices by 11.34 % and solar prices by 8.63%. However, on average, when this cost increases from 7% to 12% − referring to the domestic loan interest rate − it can increase electricity price of wind power by 20.38% and solar power by 15.56%. These data show that an increase in the cost of debt has a more price-sensitive impact; thus, expanding access for developers to get funding at a low cost is crucial.
The limited capacity of public funding to support massive renewable energy deployments in Indonesia is a strong reason to encourage private sector investment to take part [38]. Capacity or scale is noteworthy because private international finance is not suitable for funding small capacity projects [39], such as solar power plants in remote areas. However, it is critical to understand that the high cost of borrowing is also caused by the efficiency and competitiveness of the renewable energy market and domestic market maturity level [15], even policy instability, particularly in the long-term horizon [40].
Considerable land requirements are one of the challenges in developing these types of RE because the common scheme in Indonesia forces the developer to acquire land instead of leasing it. Land prices also vary widely in each region; in the densely populated island of Java which is the centre of the Indonesian economy, the land is many times more expensive than in the eastern region of Indonesia. In addition, the higher the land price, the higher the land-right transfer fee paid to the local government. The impact of an increase in land prices from USD 7.14 per m2 to USD 17.9 per m2 on average could increase the price of solar power higher than wind, reaching 11.87% and 5.67%, respectively, due to the higher land requirements per megawatt (MW) of solar power plant compared to wind. Apart from land access [6], the project location will also depend on the location of potential wind and solar irradiance, which makes the location can be anywhere, including in forest areas, as in the initial stage of the Sidrap project, which had problems related to land acquisition [41]. Notable alternative schemes to meet land requirements by collaborating with local governments through public-private partnership (PPP) schemes include engaging with corporations having access to sufficient land holdings or accumulating land from local communities [39]. In addition, the government should understand the urgency of fixing issues related to the land procurement process, such as unregistered land and overlapping permits that have the potential to cause conflicts, and even project cancellations, such as what happened in the wind plant project in Yogyakarta [6].
Developers face a dilemma when undertaking a feasibility study (FS). FS needs to be performed before the developer participates in a tender by the government, which makes this cost becomes sunk cost when the project does not pass the tender and reaches the power purchase agreement. FS is also a requirement in PPA, one of which is used as the basis for determining the point to install the metering system. As one of the most commonly offered project development facilities by governments or international financial institutions, the simulation results show that eliminating expense for preparing FS in the electricity generation cost structure has a slight impact, 1.32% and 0.19% for solar and wind plants respectively. Although it does not substantially impact the price, a good feasibility study document through a series of project development facilities and a solid environmental and social impact assessment are potentially improving the project’s credibility; hence it will help the project to be more bankable and secure lower cost of fund. The availability of de-risking instruments can aid in reducing financing costs, as was the case in India [6].
The findings generate two major outcomes by simulating six types of fiscal incentive scenarios using a financial model of solar PV and wind in Indonesia. Tax holidays and allowance would significantly lower electricity prices compared to subsidy schemes, holding other types of incentives adjusted at a certain level as assumed in this study. Then, the solar PV project is more sensitive in response to fiscal intervention than wind technology. For instance, with the same level of change in land acquisition cost, solar PV has two times higher change in price than wind power plants. The reasons are that most solar PV power plants are highly dependent on land area and have smaller scale compared to wind power plant, so they are highly elastic in terms of cost alteration. The particular result indicates the effect of the fiscal intervention on the electricity price generated from renewable energy power plants vary depending on the type of incentive. Different features of the project, such as the project’s scale and location, contribute to the variation of the examined electricity price.
This finding is consistent with other studies that investigate fiscal incentives in other regions. A 50% VAT for developers could boost solar power plant investment in China [42]. In addition to tender and feed-in tariff policy, tax incentive has also increased the capacity deployment of renewable energy in the EU and US [10]. The intervention effect the return of renewable energy investment. The particular effect is necessary since an effective policy should address risk and return dimensions to support renewable energy deployment through private finance mobilisation [26]. It leverages renewable energy competitiveness by addressing the proportion of the initial cost [24]. Consequently, tax incentives are uncertain since they affect government budget availability and fiscal policy [11]. Therefore, the intervention is essential in nurturing the early stage of renewable development, such as in Indonesia [25].
To date, fossil fuels are still dominant at more than half of the current Indonesian energy mix. Creating an enabling environment for renewable energy investment is also expected to boost RE deployment. This process can be started by supporting the elements of RE competitiveness, such as enacting a favourable policy for RE and overcoming the financial and market barriers. Utilising state fiscal incentives can close the gap in electricity generation costs between renewable energy and fossil fuel. Therefore, this study focuses on simulating the effect of several Indonesian government interventions through six different fiscal incentive scenarios on electricity prices generated from the renewable energy power plant.
This study has two major findings. The tax reduction policy − specifically the tax holidays and allowance – generates significantly lower electricity prices than subsidy incentives. In terms of renewable energy technology, solar PV has higher sensitivity to fiscal intervention compared to wind. The varied scale and locations contribute to the variation of generated electricity prices. The combination of various fiscal policies might induce the private investment required to achieve the 23% RE proportion target by 2025. However, in the long term, it is necessary to create a pathway for lessening government intervention and creating market-based mechanisms in the Indonesian RE market. Nevertheless, fiscal intervention is essential to promote investment and reduce the investor's perceived risk in the initial stage of development of that market.
The authors acknowledge financial support from the research grant – Hibah Penelitian Dasar, Ministry of Research, Technology and Higher Education, Republic of Indonesia (NKB-2619/UN2.RST/HKP.05.00/2020).
Abbreviations |
|
CAPEX |
Capital Expenditure |
FS |
Feasibility study |
IRR |
Internal Rate of Return |
LCOE |
Levelised Cost of Electricity |
NPV |
Net Present Value |
OPEX |
Operating Expenditure |
PLN |
Perusahaan Listrik Negara |
PPA |
Purchasing Power Agreement |
PV |
Photovoltaics |
RE |
Renewable Energy |
RES |
Renewable Energy Systems |
VAT |
Value-Added Tax |
VGF |
Viability Gap Fund |
- Derisking Renewable Energy Investment: A framework to Support Policymakers in Selecting Public Instruments to Promote Renewable Energy Investment in Developing Countries, 2013, https://www.undp.org/content/undp/en/home/librarypage/environment-energy/low_emission_climateresilientdevelopment/derisking-renewable-energy-investment.html, [Accessed: 22.05.2022]Available:
- ,
The Role of Renewable Energy Consumption and COmmercial Services trade in Carbon Dioxide Reduction: Evidence from 25 Developing Countries ,Applied Energy , (211),pp 1229–44 , 2018, https://doi.org/https://doi.org/10.1016/j.apenergy.2017.12.019 - , BP Energy Economics, BP Statistical Review of World Energy, 2018
- Jakarta, 2019, http://iesr.or.id/wp-content/uploads/2019/12/Indonesia-Clean-Energy-Outlook-2020-Report.pdf, [Accessed: 22.05.2022]Available:
- , , World Energy Statistics and Balances, 2018
- ,
Overcoming barriers to solar and wind energy adaption in two Asian giants: India and Indonesia , Vol. 132 ,pp 1216–1228 , 2019, https://doi.org/https://doi.org/10.1016/j.enpol.2019.05.055 - ,
Environmental regulation and innovation in renewable energy technologies: Does the policy instrument matter ,Technological Forecasting & Social Change , Vol. 153 ,pp 119921 , 2020, https://doi.org/https://doi.org/10.1016/j.techfore.2020.119921 - Investment Incentives for Renewable Energy: Case Study of IndonesiaGeneva, 2012, https://www.iisd.org/sites/default/files/publications/investment_incentives_indonesia.pdf, [Accessed: 22.05.2022]Available:
- ,
Designing effective and efficient incentive policies for renewable energy in generation expansion planning , Vol. 88 ,pp 2201–2209 , 2011, https://doi.org/https://doi.org/10.1016/j.apenergy.2010.12.022 - ,
The evaluation of renewable energy policies across EU countries and US states: An econometric approach ,Energy for Sustainable Development , Vol. 31 ,pp 83–90 , 2016, https://doi.org/https://doi.org/10.1016/j.esd.2015.12.006 - ,
The impact of state financial incentives on market deployment of solar technology ,Energy Policy , Vol. 46 ,pp 550–557 , 2012, https://doi.org/https://doi.org/10.1016/j.enpol.2012.04.032 - ,
Fiscal and Economic Impacts of State Incentives for Wind Energy Development in the Western United States ,Renewable and Sustainable Energy Reviews , Vol. 34 ,pp 136–144 , 2014, https://doi.org/https://doi.org/10.1016/j.rser.2014.03.015 - ,
An empirical analysis of the fiscal incidence of renewable energy support in the European Union ,Energy Policy , Vol. 143 ,pp 111483 , 2020, https://doi.org/https://doi.org/10.1016/j.enpol.2020.111483 - , , Renewables 2017: Analysis and Forecasts to 2022, 2017
- , 2020, https://www.irena.org/publications/2020/Jun/Renewable-Power-Costs-in-2019, [Accessed: 22.05.2022]Available:
- Abu Dhabi, 2019, https://www.irena.org/-/media/Files/IRENA/Agency/Publication/2019/Nov/IRENA_Future_of_Solar_PV_2019.pdf, [Accessed: 22.05.2022]Available:
- ,
Measuring the cost of renewable energy in Germany ,The Electricity Journal , Vol. 31 ,pp 29–33 , 2018, https://doi.org/https://doi.org/10.1016/j.tej.2018.04.002 - Abu Dhabi, 2018, https://www.irena.org/-/media/Files/IRENA/Agency/Publication/2017/Nov/IRENA_NDC_methodology_2018.pdf?la=en&hash=4E6E9173BB306CDD4295F1E7F5FB1CF477CEAAF5, [Accessed: 22.05.2022]Available:
- , 2017, https://assets.kpmg.com/content/ dam/kpmg/in/pdf/2017/09/Solar-beats-coal-cost.pdf, [Accessed: 22.05.2022]Available:
- ,
Review of Policies Encouraging Renewable Energy Integration & Best Practices ,Renewable and Sustainable Energy Reviews , Vol. 45 ,pp 249–262 , 2015, https://doi.org/https://doi.org/10.1016/j.rser.2015.01.035 - , IRENA Handbook on Renewable Energy Nationally Appropriate Mitigation Actions (NAMAs) for Policy Makers and Project Developers, 2012
- , State Clean Energy Policies Analysis (SCEPA) Project: An Analysis of Renewable Energy Feed-in Tariffs in the United States (Revised), National Renewable Energy Lab. (NREL), 2009
- ,
Analysis of the Effectiveness of National Renewable Energy Policies: A Case of Photovoltaic Policies ,Renewable and Sustainable Energy Reviews , Vol. 79 ,pp 669–80 , , https://doi.org/https://doi.org/10.1016/j.rser.2017.05.033 - ,
Renewable Energy in Southeast Asia: Policies and Recommendations ,Science of the Total Environment , Vol. 670 ,pp 1095–1102 , 2019, https://doi.org/https://doi.org/10.1016/j.scitotenv.2019.03.273 - ,
On the Selection of Financing Instruments to Push the Development of New Technologies: Application to Clean Energy Technologies ,Energy Policy , Vol. 43 ,pp 252–66 , 2012, https://doi.org/https://doi.org/10.1016/j.enpol.2012.01.001 - ,
Public Policy Influence on Renewable Energy Investments—A Panel Data Study across OECD Countries ,Energy Policy , Vol. 80 ,pp 98–111 , 2015, https://doi.org/https://doi.org/10.1016/j.enpol.2015.01.026 - ,
Efficiency and effectiveness of promotion systems for electricity generation from renewable energy sources e Lessons from EU countries ,Energy , Vol. 36 ,pp 2186–2193 , 2011, https://doi.org/https://doi.org/10.1016/j.energy.2010.06.028 - Indonesia’s Effort to Phase Out and Rationalise Its Fossil-Fuel Subsidies, 2019, https://www.oecd.org/fossil-fuels/publication/Indonesia%20G20%20Self-Report%20IFFS.pdf, [Accessed: 22.05.2022]Available:
- ,
How to Stimulate Renewable Energy Power Generation Effectively?–China’s Incentive Approaches and Lessons ,Renewable Energy , Vol. 92 ,pp 47–564 , 2016, https://doi.org/https://doi.org/10.1016/j.renene.2016.02.001 - ,
Examining the Regional Pattern of Renewable Energy CDM Power Projects in India ,Energy Economics , Vol. 80 ,pp 98–111 , 2014, https://doi.org/https://doi.org/10.1016/j.eneco.2014.01.007 - ,
Low Carbon Transition through Renewables Sources – An Overview of the Renewable Energy Program in the State of Minas Gerais ,Journal of Sustainable Development of Energy, Water and Environment Systems , Vol. 8 (2),pp 252–267 , 2020, https://doi.org/https://doi.org/10.13044/j.sdewes.d7.0295 - ,
The economics of wind energy ,Renewable and Sustainable Energy Reviews , Vol. 13 ,pp 1372–1382 , 2009, https://doi.org/https://doi.org/10.1016/j.rser.2008.09.004 - , , The Economics of Wind Energy, 2009
- Levelized Cost of Electricity in Indonesia: Understanding the Levelized Cost of Electricity Generation, 2019, http://iesr.or.id/v2/publikasi_file/LCOE-Full-Report-ENG.pdf, [Accessed: 22.05.2022]Available:
- Study on Electricity Supply Mis and Role of Policy in ASEAN. ERIA Research Project Report 2015-18, 2019, http://www.eria.org/RPR_FY2015_No.18_Chapter_2.pdf, [Accessed: 22.05.2022]Available:
- , Power Market Structure Revising Policy Options, World Bank, 2013
- Paris, 2021, https://iea.blob.core.windows.net/assets/6756ccd2-0772-4ffd-85e4-b73428ff9c72/FinancingCleanEnergyTransitionsinEMDEs_WorldEnergyInvestment2021SpecialReport.pdf, [Accessed: 22.05.2022]Available:
- ,
Sidrap: A study of the factors that led to the development of Indonesia’s first large-scale wind farm ,Case Studies in the Environment , Vol. 3 (1),pp 1–12 , 2019, https://doi.org/https://doi.org/10.1525/cse.2018.001453 - ,
Indonesia’s energy transition and its contradictions: Emerging geographies of energy and finance ,Energy research & social science , Vol. 41 ,pp 230–237 , 2018, https://doi.org/https://doi.org/10.1016/j.erss.2018.04.023 - ,
Generating a framework to facilitate decision making in renewable energy investments ,Renewable and Sustainable Energy Reviews , Vol. 95 ,pp 217–226 , 2018, https://doi.org/https://doi.org/10.1016/j.rser.2018.07.035 - ,
Rethinking renewable energy targets and electricity sector reform in Indonesia: A private sector perspective ,Renewable and Sustainable Energy Reviews , Vol. 101 ,pp 231–247 , 2019, https://doi.org/https://doi.org/10.1016/j.rser.2018.11.005 - ,
Renewable energy policies in promoting financing and investment among the East Asia Summit countries: Quantitative assessment and policy implications ,Energy Policy , Vol. 95 ,pp 427–436 , 2016, https://doi.org/https://doi.org/10.1016/j.enpol.2016.02.017