


To achieve the climate targets of the Paris Agreement, the European Union aims to be net-zero Green House Gas (GHG) emissions by 2050 [1]. Despite the prevalent policy measures, the transport sector has proved to be the most challenging to decarbonise. It accounts for around a quarter of the European GHG emissions; while other sectors have seen a decline of around 20−50% since 1990, the transport sector's emissions have increased by almost 20% [2].
In the horizons of urban development, the use of energy in transport is very closely linked to the design of urban spatial development, existing and planned future infrastructure, economic policies, and the dominant modes used for freight and passenger transport. The European Commission has also outlined the role of cities and local urban planning as one of the key areas of action [3]. However, estimating the energy efficiency potentials in urban spatial and infrastructure development has proved challenging; this is even more so in the case of an inter-connected region like the European Union comprising a multitude of geopolitical, cultural, and social entities.
Much research has focused on how the built environment characteristics influence travel and transportation energy use. For an overview of the general state-of-the-art in this field, one could visit Handy et al., 2002 [4]; Cao et al., 2009 [5]; Saelens and Handy, 2008 [6]; Ewing and Cervero, 2010 [7]; and Næss, 2012 [8]. The main challenge is maintaining accessibility while reducing transport volumes and sustaining a shift from energy-demanding travel modes to travel modes requiring less energy per person-kilometre travelled or ton-kilometre of freight. Based on the- state-of-the-art research such as the ones mentioned above, we consider the following three spatial characteristics to be most important:
First characteristic: High population density for the city as a whole, understood as the continuous urbanised area (i.e., the morphological city). Newman and Kenworthy, 1989 [9] established the connection between urban density and energy use for transport. Many later studies have supported their groundbreaking study; see, for instance, Næss, 1993 [10]; Næss, 1996 [11], and Kenworthy, 2003 [12].
Second characteristic: Residential location close to the main centre of a larger city/metropolitan area. Numerous studies show that the number of kilometres travelled decreases the closer the residential area is to the centre. At the same time, the travel modes are shifting towards modes requiring less energy per person-kilometre. For recent European studies, see for example Næss et al., 2017 [13]; Næss et al., 2019 [14]; Elldér, 2014 [15], and Engebretsen et al., 2018 [16].
Third characteristic: Specialised labour-intensive or visitor-intensive jobs are located close to the main centre of the city/metropolitan area. This has been seen in several studies; among the recent ones, see Engebretsen et al., 2018a [17], and Wolday et al., 2019 [18].
A large volume of existing literature concerning the impacts of built environment (i.e., land use, buildings, and transport infrastructure) characteristics on transport volumes and the modal split has been reviewed in connection with the study presented in this article (for the full review, visit Næss et al., 2020 [19] ). Being very diverse and carried out in different countries and cities of different sizes, these studies represent different geographical, social, political, and cultural contexts. The same applies to the few studies about the travel behavioural effects of economic instruments to regulate traffic, such as road tolls and parking fees, where most studies are from the USA. Some cities are well represented in many studies and indicate – on a case level – that urban development following the three characteristics mentioned above is impacting the energy use related to transport positively, making it represent an energy-efficient urban development (Næss et al., 2011 [20]; Vold, 2006 [21]; Tittu et al., 2020 [22]).
The existing studies on built environment impacts on transportation have varying methodological quality and focus on different aspects. Some studies focus only on commuting, others on non-work travel (e.g., shopping). Some studies include only residents of the morphological city (or parts of it); others include residents from all over the metropolitan area. And some focus only on local or intra-metropolitan transport, while other studies also include travel outside the metropolitan area (such as holiday trips). Hence, the difficulty in generalising the effects of energy-efficient urban planning on travel behaviour is quite evident. On the other hand, it is quite evident that it is necessary to – despite the difficulties – try to generalise the effects.
This study aims to provide a quantitative assessment for an exploratory scenario that outlines potential savings through efficient urban planning, mainly in terms of spatial development, transport infrastructure, and economic instruments. The exploratory scenario contrasts traditional urban development that is considered a scenario of business as usual. The results for the two scenarios are compared in terms of final energy demand and annualised systems costs to assess the potential impact of introducing best practices in urban spatial and infrastructure development.
A two-stepped approach is used in this study to analyse the extent of the impact of energy-efficient urban development practices compared to traditional development practices. First, a reference model for the European transport sector comprising 28 European countries is set up using a bottom-up analysis tool. This model encapsulates the main indicative output features to compare the two scenarios: the final transport energy demand, transport activity demand, and transport systems costs. Once a reference model for a base year is established, the transport demand is projected into the future, considering different traffic growth and modal shift rates. These growth and modal shift rates are key in establishing a baseline EU28 traditional model and an alternate EU28 transport model based on energy-efficient urban spatial and infrastructure development. The focus of the second step is on estimating, to the extent possible, the future annual growth and modal shift rates for the two scenarios. These steps are further elaborated on in the following sections.
A bottom-up approach helps create a reference model for EU28, where different transport data are gathered from various sources and analysed accordingly. Figure 1 shows the major inputs and some of the outputs that result in a EU28 reference model for a base year.
The methodology followed for creating a EU28 reference transport model
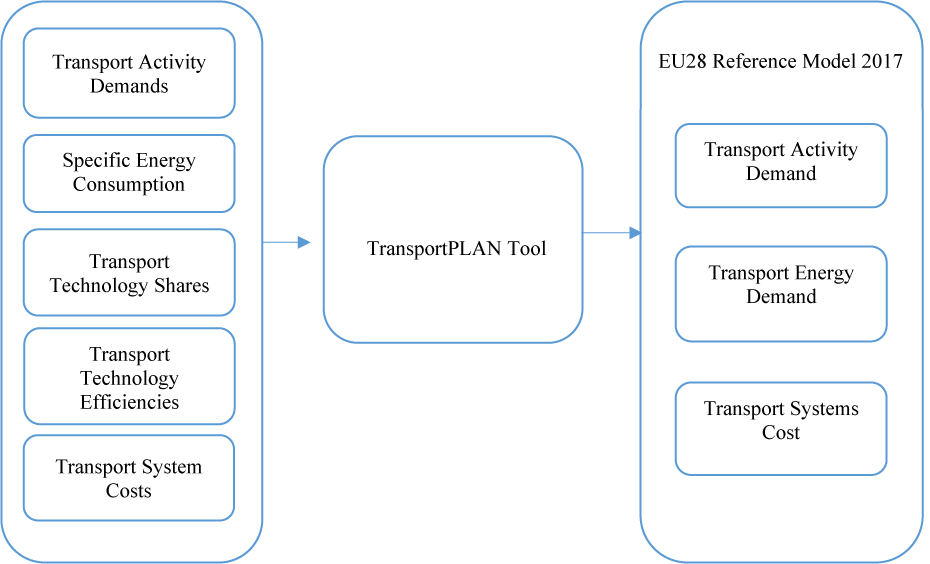
A transport scenario modelling tool called “TransportPLAN” is used to create the reference model. The two scenarios (baseline and energy-efficient urban spatial development) are built on top of the reference model. The tool was originally developed as a part of the CEESA project [23]. TransportPLAN allows users to create detailed transport scenarios with five-year intervals from 2020 to 2050. For all modes of transport, the transport demand, share of fuels and technologies, and vehicle and infrastructure costs derive from statistics, models, and publications and make up the foundation of the scenario development. The transport sector is split into two parts; passenger and freight, each of which has different modes of transport, as shown in Figure 2.
Modes of transport analysed in TransportPLAN
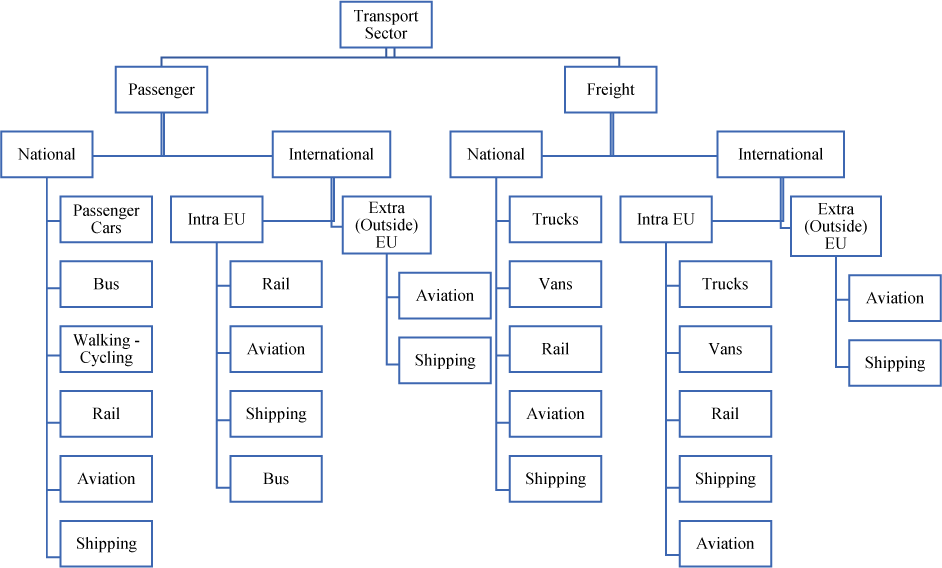
The transport demands of passenger cars, trucks, buses, and bicycles/walking are analysed based on different distance bands. In contrast, a split between international and national transport is applied for air, rail, and sea transport. Determination of transport energy demand and transport activity demand is key in estimating the energy efficiency potentials for the transport sector.
The data inputs include transport demand data, transport system cost data, and transport technology efficiencies. Different sources have been used to make reasonable estimates for the accumulation of transport demand. These sources include national travel surveys from individual countries, “EU transport in Figures” [24], and the Eurostat database [25]. The specific energy consumption values for passengers and freight transport were estimated for each country and used, along with the transport activity, to calculate the overall energy demand of each mode. Finally, the fuel share distribution for each mode is obtained from the Eurostat database [25]. The energy efficiency of all vehicles used in the analysis follows the methodology introduced in the Danish transport system model “Alternative Drivmidler” [26]. The methodology is adapted to display the energy efficiencies in a Danish context, but it is estimated that the methodology is applicable in a European context. The transport technology efficiencies and the cost of road vehicles and charging stations are found in [26]. The transport system infrastructure cost for road and rail infrastructure is calculated for each country based on historical infrastructure investment and maintenance costs [27].
The only system cost components under consideration were the transport systems costs related to road vehicles' annual investment and operation and maintenance. The analysis did not include the vehicle costs data for other modes such as rail, shipping, and aviation because of large deviations and unavailability of reliable references. However, it included the annual fuel cost for all vehicle types, annualised investment, maintenance cost related to road and rail infrastructure, and the annual cost of expanding the electric-vehicle charging infrastructure.
The results from the TransportPLAN scenario tool shown in Figure 1 are the annual transport demand in all modelled years, the energy consumption by mode of transport and type of fuel, and the costs associated with vehicles, fuel, and infrastructure. To develop transport scenarios towards 2050, TransportPLAN allows for the adjustment of five main parameters:
Annual growth of transport demand,
Modal shift rates,
Market share of transport technologies,
Annual improvements in the energy efficiency of vehicle technology,
Annual capacity utilisation rates
The parameters enable the user to create alternative scenarios whose components are:
Different levels of transport demand,
Variable rates of implementation of renewable transport technologies,
Move transport demand between modes of transport,
Improve the energy efficiency of conventional vehicles, and
Improve the capacity utilisation for both passenger and freight transport.
Since this study aims to estimate the potential in energy savings due to energy-efficient urban planning, two parameters were varied: the annual growth rates of transport demand and modal shifts. Both of these parameters form the basis of differences in the traditional growth and the energy-efficient growth scenario.
The market share of transport technologies, energy efficiency improvements of vehicle technology, and capacity utilisation rates remain largely unvaried in both scenarios, except for some inherent (to a small degree) increase in capacity utilisation due to the inter-dependence of urban spatial development and capacity utilisation. These values come from the disaggregation of data provided by the PRIMES model described in the “Clean Planet for All” [28].
The EU28 transport reference model set up in this study is constrained by several system boundaries that might affect the results, albeit not to a great extent. The model is set up on a bottom-up approach where different modes of transport have different categorisations in distance bands. This categorisation is not uniformly available in the national travel surveys of the different countries up to such a fine resolution. The available data were approximated to fit the resolution needed for the TransportPLAN tool. One could enhance results with the availability of better data in the future.
Once the groundwork for creating a reference EU28 model for a base year is complete, the next step is to make assumptions about the development of the two future scenarios towards 2050. As mentioned before, the two scenarios considered in this study are based on traditional vs. energy-efficient urban development encompassing spatial development, economic instruments, and transport infrastructure development. Among the five major variable parameters mentioned in the previous section, the annual growth and the modal shift rates form the factual basis of departure for the two scenarios above in 2050.
For the baseline, the traditional development scenario, annual growth, and modal shift rates are the same as the reference baseline for the PRIMES model [28]. For the energy efficiency scenario, alternate rates of modal shift and growth are obtained using a comprehensive analysis. The steps are outlined below, and the details are available as part of the report D2.1 [29] of sEEnergies (a project funded by the European Union’s Horizon 2020 Programme). While realising the inaccuracies associated with making future growth and modal shift assumptions applied to an aggregated geographical entity such as the EU, some estimations have been made to explore the potential of energy-efficient urban spatial, infrastructure, and price developments.
One should note that these estimates are in no way an attempt to actualise or predict the future of the European transport sector but only serve as exploratory scenarios to consider in a quantified manner. The premise is to explore an alternative urban development pathway to traditional development. The steps described below were followed to obtain the annual growth and modal shift rates for the energy efficiency scenario.
Step 1: A literature review is carried out on European studies published in peer-reviewed journals since 2000, about the impacts of urban spatial development, infrastructure development, and economic instruments such as road pricing and parking fees, on travel behaviour patterns. These studies have been compiled as recommended by [30] to estimate the elasticities between travel behaviour and the built environment. Appendix B of [31] presents a comprehensive list of the said studies.
Step 2: Based on the literature review in step 1, plausible estimates of the effects of these factors on travel behaviour and current trends were carried out. The focus was on the regions with the main city of the region belonging to the following size categories: Large Urban Areas (greater than 1 million inhabitants); Medium-Sized Urban Areas (100 thousand – 1 million); Small Urban Areas (10–100 thousand). On top of these distributions, to the extent possible, the estimates of effects of the built environment, road pricing, and infrastructure development on travel behaviour are also classified into four regions of Europe, Figure 3. Based on sociocultural, political, and urban-geographical differences, these are Northern Europe, Western and Central Europe, Southern Europe, and Eastern Europe.
Distribution of EU and EFTA countries between the four defined sub-regions of Europe

Step 3: An analysis of best practices for the three energy efficiency measures identified in steps 1 and 2, including (i) Urban spatial development, (ii) Transport infrastructure, and (iii) Economic instruments such as road pricing and parking fees from 1990–2015. The analysis would estimate potential energy savings if all regions of Europe followed these best practices.
Step 4: The energy-saving effect based on the best practices and the business as usual effects from 1990–2015 of the three measures are prolonged till 2050 to calculate the energy differentials for the two cases.
Step 5: The absolute energy saving potentials (in TJ) calculated via the differential in step 4 are converted into annual growth rates, cautiously assuming a 50/50 split in the energy savings attributable to demand reduction and modal shifts.
Final step − Peak Car: before the annual growth rates are fed into the TransportPLAN tool, the growth rates of cars are adjusted for the four regions of Europe based on the concept of “Peak Car”. Observed in most developed countries, it reflects the observation of slower growth rates, levelling off, or reducing various measures of car use. It contrasts the former idea that car use would grow with the growth of GDP, as people would replace slower forms of transport with transport by a car when they could afford it. According to studies such as [32], we are in the fourth travel era when the average per-capita growth of “daily travel” has ceased. The per capita vehicle travel grew rapidly between 1970 and 1990 but has since levelled off in most OECD countries and is much lower in European countries than in the US [33]. One of the driving forces for decreasing the share of car-based transport is that young people are less likely to have a driver’s license and travel exclusively by car than the previous generation. The declining number of young people with a driver’s license can indicate a peak car situation [34]. This trend is partly due to the increasing cosmopolitan globetrotting culture popular among young adults that are increasingly replacing holiday car travel with flights to exotic international destinations. It does not consider the effects of Covid-19 on the reduction in air travel and transport demand in 2020.
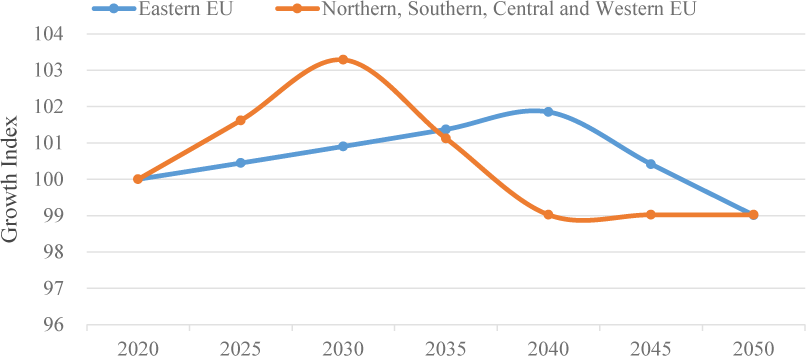
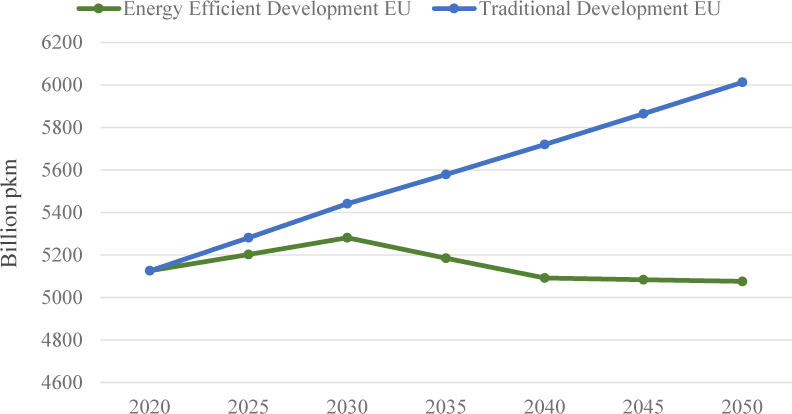
There are not much data available on the part of Eastern Europe. Private cars have become more common after the fall of The Berlin Wall in 1989. One can assume that the private car still symbolises freedom in Eastern Europe, and the peak car situation will occur later here than in the rest of Europe. This situation will mirror that in the global South, where peak car will also be expected to occur later [35]. Therefore, the implementation in TransportPLAN assumes different peak car periods for the four regions of Europe. As shown in Figure 4, the assumption is that cars will peak later in Eastern Europe than in Northern, Southern, West, and Central Europe. Similarly, Figure 5 shows the aggregated EU-level traditional (reference baseline) development of passenger car travel demand compared with the development when the energy-efficient practices of urban spatial, infrastructure, and road price development are introduced.
Passenger car evolution for four regions of Europe
EU passenger car evolution with and without energy-efficient development
This section presents the EU28 transport sector development results from reference 2017 to future 2050. The results are shown for both the traditional and energy efficiency development scenarios. The two scenarios are compared in terms of transport demand activity and final energy demand, i.e., the end-users energy consumption, without considering fuel-production energy losses. Furthermore, the comparison of growth schemes will rely on the total transport system cost, including cost and maintenance of vehicles, fuel production cost, and cost associated with renewal and development of transport infrastructure.
The composition of the current state of the transport system in the EU28 in this study reflects travel data from national travel surveys along with transnational European transport statistics. The transport activity is analysed for passenger and freight transport separately. The following presents the current transport system and the forecasted development from 2017 to 2050 for the two transport demand development schemes. The course of the traditional development scenario builds on the EU Baseline 2050 [28] in terms of implementing new transport technologies and fuels.
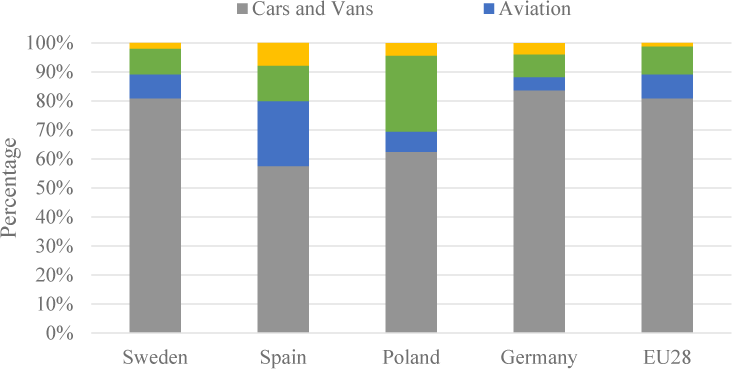
The passenger transport demand in the 2017 reference model is split between transport in personal vehicles, public transport (buses, coaches, and railways), biking and walking, and aviation.
Figure 6 shows the passenger transport activity distribution in 2017 for EU28 along with four representative countries for the four geographical regions of Europe. Most passenger-kilometres are travelled in personal vehicles, constituting 81% of the total transport demand. Public transport comprises 10% while biking and walking, and aviation makes up the remaining 2% and 10%, respectively. The share of transport demand differs from country to country. A clear pattern emerges: in Central, West, and Northern Europe, most passenger-kilometres are travelled in personal vehicles and a small share in public transport, by walking or cycling or by aviation. In the Southern and Eastern regions, a much larger share of transport is covered by public transport, walking, or cycling. Figure 7 shows the evolution of passenger transport demand of EU28 from 2017 till 2050 for both traditional and energy efficiency development.
Passenger activity demand distribution in 2017
Passenger activity demands distribution for traditional and energy-efficient development
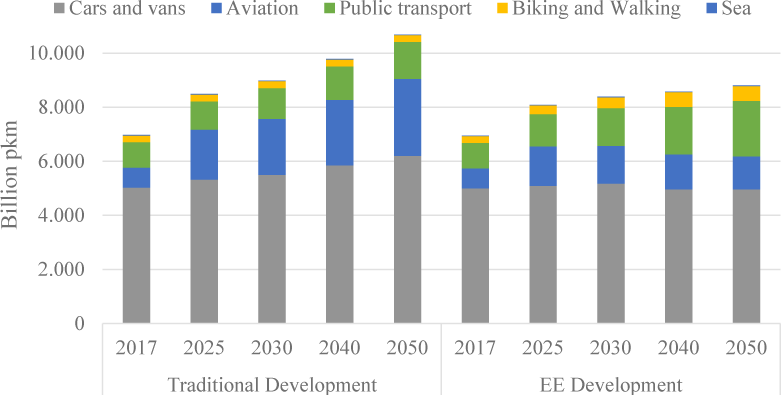
The development of passenger transport demand towards 2050 in the traditional urban development scheme sees an overall increase of 28% in total passenger-kilometres for all modes of transport combined. This transport demand in passenger vehicles grows by 20% from 2017 - 2050, public transport by around 34%, and transport activity by air grows a whopping 84%.
In the energy efficiency scenario, the development of the passenger transport demand towards 2050 follows a different trajectory. Interestingly, despite implementing all the energy efficiency measures, the passenger demand for cars and vans witnessed no substantial reduction in 2050 compared to 2017. It is a consequence of the huge expected increase in passenger cars and vans in EU28 in the traditional development scenario. The energy efficiency scenario displays a reduction in passenger cars and vans by 20% as compared to traditional development by 2050. Meanwhile, measures such as road pricing incentives and energy-efficient urban spatial and infrastructure development form the basis of significant modal shifts towards public transport, bicycling, and walking. In contrast to the traditional development in 2050, the transport activity for bicycling and walking grows by 116% in the energy efficiency scenario, while the passenger-kilometres travelled by public transport (which includes buses, coaches, and railways) increase by more than 50%. The economic instruments targeting air transport and abstaining from expanding airports lead to a reduction of 55% in the transport demand for aviation compared to traditional development.
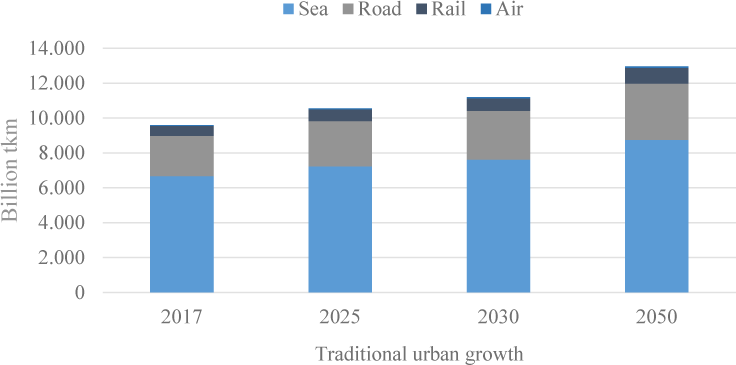
The freight transport demand in the 2017 reference model is covered by trucks, vans, railways, aviation, and sea transport. Most goods are transported by sea-going vessels; hence sea transport is responsible for most of the transport demand. Trucks and vans cover 24% of the total ton-kilometres in the EU28, 6% of the freight transport demand is covered by rail, while aviation and sea transport cover the remaining 0.5% and 69.5%, respectively. The modal split differs slightly between countries in the EU28, depending primarily on the access to freight transport by sea. In all countries, freight transport on the road covers most of the transport demand. This work considers the development of the freight transport demand in the EU28 under the traditional urban growth scheme only. The incentives briefly described above and outlined in detail in sEEnergies deliverable D2.1 [29] mainly target passenger transport and the reduction of transport in cars and aviation. The implementations will most likely affect intra-metropolitan freight transport, but this study has not quantified the effects. Hence only the development under the traditional urban growth scheme is considered.
Figure 8 depicts the development of the transport demand by the mode of transport. Road freight transport increases by 40% from 2017 to 2050, while freight transport by rail grows by 59%. The transport demand for aviation and sea increases by 84% and 31%, respectively.
Freight transport activity demand for EU28
The final energy demand for the transport sector in the EU28 in the 2017 reference model amounts to 18 PJ. Diesel-type fuels and petrol cover 75%, while 20% is met with jet fuel. The remaining energy demand is covered with biofuels and electricity. Electricity is primarily consumed by trains, while biofuels blended with diesel and petrol cover the energy demand of road vehicles.
Figure 9 shows the development of the final energy demands for the two growth scenarios. The transport demand growth observed in the EU28 under the traditional urban growth scheme is not visible in the final energy demand. Primarily due to the implementation of a large share of electric vehicles in the passenger vehicle fleet, hybrid vehicles in road freight transport, and significant electrification of the EU28 railway network, the final energy demand decreases 19% from 2017 to 2050 under the traditional urban growth scheme. In the case of energy-efficient urban growth, the final energy demand decreases by 37% in the same period.
EU28 Annual transport energy demand distribution by fuel
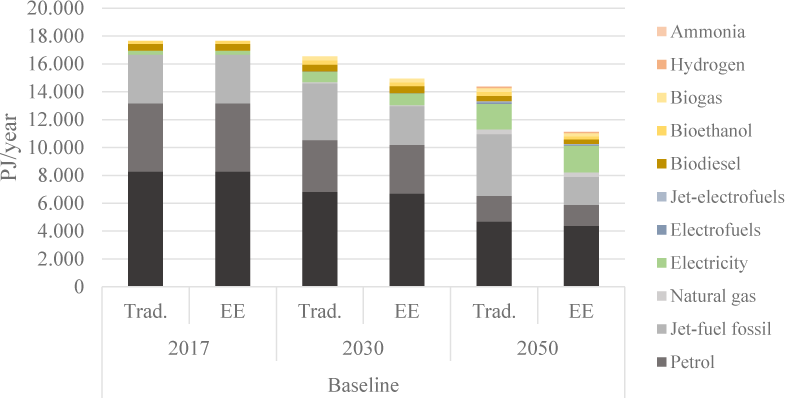
Under the energy-efficient urban growth scheme, the final energy demand for diesel and petrol for road vehicles decreases slightly. However, even more, noticeable is the decrease in final energy demand for jet fuel when restraining from expanding airport infrastructure and implementing economic incentives to reduce air transport.
The annual transport system costs consist of the cost of new vehicles and maintenance of existing vehicles, the cost related to road and railway infrastructure, and charging infrastructure and fuel costs. The fuel cost and especially the production cost of renewable transport fuels are uncertain; hence three different fuel cost scenarios are investigated. The results presented in this study consider the medium fuel scenario, see Figure 10. All the three fuel cost scenarios are further elaborated in section 3.3 of the sEEnergies D2.3 report [36]. The annual transport system cost in the EU28 in the 2017 reference model is 1.3 billion €. The vehicle cost comprises 68% of the total annual transport system cost, while fuel cost comprises 22%.
EU28 annual transport systems costs for traditional and energy-efficient development
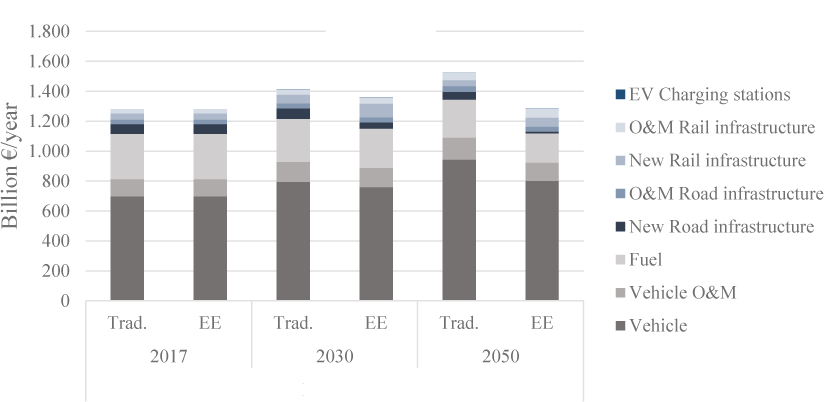
The annual transport system cost development is outlined for the schemes of traditional urban growth and energy-efficient urban growth. Under the traditional scheme, the annual transport system cost increases by 19% from 2017 to 2050. Vehicle and fuel costs still comprise most of the annual cost in 2050. If the transport demand growth follows the energy-efficient urban development scheme, the annual transport system cost will remain stable from 2017 to 2050, and no increase will occur. Less transport in passenger vehicles and a modal shift towards public transport lead to a smaller increase in vehicle cost. The lower energy consumption per passenger-kilometre in public transport compared to passenger cars leads to a decreased annual fuel cost. The increased cost of rail infrastructure is balanced by a decreased cost of new road infrastructure.
This work analyses the evolution of the transport system in the EU28 towards 2050, considering traditional and energy-efficient urban development. A reference model of the current state of the EU28 transport system uses the TransportPLAN tool, developed at Aalborg University, to create alternative scenarios from a well-documented, comprehensive starting point. The analysis of the development of the transport demand encompasses a traditional urban growth scheme and an energy-efficient growth scheme.
The results strongly indicate the significance of measures such as:
Energy-efficient urban spatial development focused on energy-efficient transport behaviour,
Economic incentives to discard travel in cars,
Abstaining from large investments in road infrastructure and airports.
These measures will have a noticeable effect on the transport system’s final energy demand.
Suppose the trajectory of the energy-efficient urban growth scheme is followed. In that case, the annual final energy demand will decrease by 20% in 2050 compared to the final energy demand in the traditional urban growth scheme. Hence, the recommendation is to pursue energy-efficient urban growth, as this will significantly reduce the need to implement renewable transport technologies and fuels and thus reduce the total cost of the transition.
- , European Commission, United in delivering the Energy Union and Climate Action - Setting the foundations for a successful clean energy transition, 2019
- Greenhouse gas emissions from transport in Europe - European Environment Agency, https://www.eea.europa.eu/data-and-maps/indicators/transport-emissions-of-greenhouse-gases-7/assessment, [Accessed: Apr. 16, 2021]
- European Commission, 2017, https://ec.europa.eu/clima/policies/transport_en, [Accessed: Apr. 15, 2021]
- ,
How the built environment affects physical activity: views from urban planning ,American Journal of Preventive Medicine , Vol. 23 (2),pp 64-73 , 2002, https://doi.org/https://doi.org/10.1016/S0749-3797(02)00475-0 - ,
Handy: "The relationship between the built environment and non-work travel: A case study of Northern California ,Transportation Research Part A: Policy and Practice 43.5 (2009): 548-559 , , https://doi.org/https://doi.org/10.1016/j.tra.2009.02.001 - ,
Built environment correlates of walking: A review ,Medicine & Science in Sports & Exercise , Vol. 40 ,pp 550-566 , 2008, https://doi.org/https://doi.org/10.1249/MSS.0b013e31817c67a4 - ,
Travel and the built environment ,Journal of the American Planning Association , Vol. 76 (3),pp 265-94 , 2010, https://doi.org/https://doi.org/10.1080/01944361003766766 - ,
Urban form and travel behavior: experience from a Nordic context ,Journal of Transport and Land Use , Vol. 5 (2),pp 21-45 , 2012, https://doi.org/https://doi.org/10.5198/jtlu.v5i2.314 - ,
Gasoline consumption and cities: A comparison of US cities with a global survey ,Journal of the American Planning Association , Vol. 55 ,pp 24-37 , 1989, https://doi.org/https://doi.org/10.1080/01944368908975398 - ,
Transportation Energy in Swedish Towns and Regions ,Scandinavian Housing & Planning Research , Vol. 10 (4),pp 187-206 , 1993, https://doi.org/https://doi.org/10.1080/02815739308730340 - ,
Energy use for transportation in 22 Nordic towns ,Scandinavian Housing & Planning Research , Vol. 13 (2),pp 79-97 , 1996, https://doi.org/https://doi.org/10.1080/02815739608730401 - , Transport energy use and greenhouse gases in urban passenger transport systems: A study of 84 global cities, Presented to the international Third Conference of the Regional Government Network for Sustainable Development, 2003
- ,
Which D's are the important ones? The effects of built environment characteristics on driving distance in Oslo and Stavanger ,Journal of Transport and Land Use , Vol. 10 (1),pp 945-964 , 2017, https://doi.org/https://doi.org/10.5198/jtlu.2017.1183 - ,
Residential location, commuting and non-work travel in two urban areas of different size and with different center structures ,Progress in Planning , Vol. 128 ,pp 1-36 , 2019, https://doi.org/https://doi.org/10.1016/j.progress.2017.10.002 - ,
Residential location and daily travel distances: The influence of trip purpose ,Journal of Transport Geography , Vol. 34 ,pp 121-130 , 2017, https://doi.org/https://doi.org/10.1016/j.jtrangeo.2013.11.008 - ,
Residential location, workplace location and car driving in four Norwegian cities ,European Planning Studies , Vol. 26 (10),pp 2036-2057 , 2018, https://doi.org/https://doi.org/10.1080/09654313.2018.1505830 - ,
Residential location, workplace location and car driving in four Norwegian cities ,European Planning Studies , Vol. 26 (10),pp 2036-2057 , , https://doi.org/https://doi.org/10.1080/09654313.2018.1505830, 2018a - ,
Workplace location, polycentricism and car commuting ,Journal of Transport and Land Use , Vol. 12 (1),pp 785-810 , 2019, https://doi.org/https://doi.org/10.5198/jtlu.2019.1488 - ,
Report on energy efficiency potentials in the transport sector , , https://doi.org/https://doi.org/10.5281/ZENODO.4059191, Sep. 2020 - ,
Oslo's farewell to urban sprawl ,European Planning Studies , Vol. 19 (1),pp 113-139 , 2011, https://doi.org/https://doi.org/10.1080/09654313.2011.530395 - ,
Phased implementation of transport pricing for Greater Oslo ,Transport Policy , Vol. 13 (2),pp 140-148 , 2006, https://doi.org/https://doi.org/10.1016/j.tranpol.2005.11.009 - ,
The urban density in two Nordic capitals - comparing the development of Oslo and Helsinki metropolitan regions ,European Planning Studies , 2020, https://doi.org/https://doi.org/10.1080/09654313.2020.1817865 - ,
Coherent Energy and Environmental System Analysis The Danish Council for Strategic Research Programme Commission on Sustainable Energy and Environment , 2011 - EU transport in figures - Publications Office of the EU, 2020, https://op.europa.eu/en/publication-detail/-/publication/da0cd68e-1fdd-11eb-b57e-01aa75ed71a1, [Accessed: Dec. 02, 2020]
- Database - Eurostat, 2020, https://ec.europa.eu/eurostat/web/transport/data/database, [Accessed: Sep. 04, 2020]
- , Danish Energy Agency and Cowi, Alternative drivmidler, 2013
- International Transport Forum, 2020, https://stats.oecd.org/Index.aspx?DataSetCode=ITF_INV-MTN_DATA, [Accessed: May. 29, 2020]
- European Commission, 2018, https://ec.europa.eu/clima/sites/clima/files/docs/pages/com_2018_733_analysis_in_support_en_0.pdf, [Online]Available:[Accessed: May. 29, 2020]
- , Report on energy efficiency potentials in the transport sector
- , Meta-Analyses of Built Environment Effects on Travel: No New Platinum Standard, J. Plan. Educ. Res.
- , Report on energy efficiency potentials in the transport sector
- ,
Peak Car and Beyond: The Fourth Era of Travel ,Transp. Rev. , Vol. 33 (3),pp 255-270 , , https://doi.org/https://doi.org/10.1080/01441647.2013.800615, May 2013 - Evaluating Public Transit Benefits and Costs Best Practices Guidebook, 2020, www.vtpi.org, Accessed: Dec. 02, 2020[Online]. Available:[Accessed: May. 29, 2020]
- ,
Who Made Peak Car, and How? A Breakdown of Trends over Four Decades in Four Countries ,Transp. Rev. , Vol. 33 (3),pp 325-342 , 2013, https://doi.org/https://doi.org/10.1080/01441647.2013.801928 - ,
Will peak car observed in the North occur in the South? A demographic approach with case studies of Montreal, Lille, Juarez, and Puebla ,Econ. Anal. Policy , Vol. 61 ,pp 39-54 , , https://doi.org/https://doi.org/10.1016/j.eap.2018.06.002, Mar. 2019 - , Report on energy efficiency potentials in the transport sector and conclusions from the developed scenarios