


On a global level, the extraction and processing of natural resources account for almost one-quarter of total greenhouse gas (GHG) emissions [1] and this share is expected to increase further by 2050 [1], [2]. Therefore, the material efficiency and circular economy approach, which aim to reduce the extraction and processing of virgin raw materials, show promising potential to contribute to climate mitigation. These interactions occur within the climate-resource nexus [3]). Such contributions encompass reducing GHG emissions and maintaining the availability of raw materials needed for low-carbon technologies for climate mitigation, e.g., renewable energy generation and electric mobility.
Material efficiency and circular economy approaches include designing for longevity and using less material; material substitution; waste reduction; and reuse, recovery, and recycling (e.g., [1], [2], [4]). Modelling studies indicate that applying such approaches could lead to global reductions in GHG emissions of about 15−20% by 2050 [5] or around 30% by 2060 [6].
GHG reduction potential arises from replacing carbon-intense with less (carbon-intense) materials – including substituting abiotic with biotic materials, primary with secondary materials, and heavier with lighter materials. As the greatest share of GHG emissions related to material production originates from the production of construction materials (approximately 40%), followed by the production of machinery and equipment and electronics, substitution plays a decisive role in the construction sector and the industry (e.g., [7], [8]). Using lightweight design and prioritising wood as a low-carbon material choice over steel and concrete in construction leads to relevant climate benefits (e.g., [7], [9]). According to Hertwich et al. (2019) [7], using timber instead of steel and concrete in construction can lead to avoided emissions ranging from 100−400 kg to more than one ton of CO2-eq per m³ timber. Furthermore, Gallego-Schmid et al. (2020) [9] found from a literature review that reuse, upcycling, and recycling promise substantial GHG emission reductions on product and functional unit levels, ranging from 30 to 50% for using recycled construction material to up to 99% at product level for material reuse based on the design for disassembly.
For the manufacturing of cars and electric and electronic equipment (EEE), Hertwich et al. (2019) [7] provide estimates of GHG emission saving potential from the lightweighting of cars, which can reduce their life cycle emissions by between 5% (for steel-based lightweighting) and 8% (for aluminium-based lightweighting). They also find that remanufacturing a diesel engine can save 69−90% of the embodied GHG emissions of producing a new diesel engine. Remanufacturing of EEE can lead to 50–80% GHG emission savings when excluding the use phase from calculations, in which longer-lived EEE can have lower energy efficiency performances than newer EEE [7]. Ellen MacArthur Foundation (2019) [2] shows that fostering product design changes that minimise waste generation and increasing reuse, remanufacturing and recycling rates could reduce global CO2 emissions from key industry materials (including steel, cement, aluminium, and plastics) by 3.7 billion tons CO2-eq or by 40% in 2050.
Hence, substituting virgin and carbon-intense raw materials with less carbon-intense material choices, secondary materials, and long-life products offers great potential for climate mitigation. However, this potential depends on the successful implementation of such approaches in different countries and thus also on capacities to overcome political, technological and socio-cultural barriers to implementation (see, e.g., [1], [3], [7]). Against this background, the present study uses qualitative and quantitative system dynamics modelling to identify and assess 'potentials' and bottlenecks of material efficiency and substitution approaches for reducing global GHG emissions. Different scenarios are run, presenting pathways toward a 100% renewable energy transition by 2050.
The results show that while a 100% renewable energy transition seems feasible globally, regarding needed raw materials out to 2100, both material efficiency and recycling are necessary to reduce the need for energy and increasingly expensive primary raw materials from low-grade reserves. Furthermore, increasing recycling reduces the need for increasingly expensive raw materials from low-grade reserves. Hence it can help mitigate economic constraints that hinder the renewable energy transition – and thus ease capacities to transition to 100% renewable energy. Regarding reductions in energy need and associated GHG emissions, substituting abiotic with biotic resources for material use appears more promising than increasing material efficiency. However, making such quantities of biotic resources available for material substitution requires, among other things, reducing animal product consumption and producing biomass in the areas hitherto not used for this purpose intensively (i.e., used extensively) or not at all. It is also required to reduce food waste to meet the needs of feeding a growing world population. Therefore, in addition to material efficiency and substitution, approaches that reduce overall energy and material needs, and associated GHG emissions, appear necessary. In this context, lifestyle changes towards reduced demand for energy, goods and services (i.e., sufficiency) emerge as relevant to achieving reductions compatible with maintaining global mean temperature increases within 1.5 degrees of warming.
Thus, this work puts the potential for material efficiency, material use of biotic resources, and sufficiency into perspective and looks at the magnitudes of capacities humanity needs for a global energy transition. Furthermore, this work examines global potential capacity constraints resulting from the dynamics of different pathways and the overlap of new net energy installations and repowering.
This section describes a set of quantitative models to assess the potential effects of the interconnections between climate mitigation and material efficiency. These interconnections were derived from first developing a qualitative model for the climate-resource-nexus.
To explore the climate-resource nexus, i.e., interlinkages between resource conservation and climate mitigation, a qualitative cause-and-effect model was first developed at a global scale − the Qualitative ICARE Model. The purpose of the model was to visualise nexus aspects collected from literature and expert interviews [3]. The quantitative models described in detail below are designed to explore a series of potentially relevant effects from this qualitative model:
Resource scarcity of critical materials could jeopardise the global transition towards renewable energy. Hence, fostering material substitution and material recycling is pivotal.
Greenhouse-gas-intensive materials like steel and concrete could be substituted by biotic materials that serve as a carbon sink.
A shift from depleting high-grade raw materials to low-grade raw materials could significantly increase material costs and thus imply economic obstacles for a transition towards renewables.
Increasing recycling could counteract rising material costs from depleting high-grade raw materials and trigger a shift of value creation away from raw material exporting countries. Countries with large anthropogenic stocks of material would be increasingly relied on.
The material efficiency of energy-intensive materials could decrease the need for energy and, thus, materials in a reinforcing feedback loop.
In terms of reduced demand for goods and services, sufficiency could lower the need for renewables because of the reinforcing feedback loops between energy and material needs. Fewer products imply less demand for energy for their production and processing, which implies less need for renewables and their resources, which in turn require less energy.
As the focus of this paper is to explore these effects quantitatively, three simulation models were developed:
The ICARE Energy Model with roughly 1,900 factors to explore the global transition toward renewable energy and its resource need.
The ICARE LULUCF (Land Use, Land-Use Change and Forestry) Model with more than 500 factors to explore the global potential for biotic resources for material and energy use.
The ICARE Game-Theoretical Model with less than 50 factors to explore the logic behind economic growth and the use of materials and its winners and losers.
The three models are based on system dynamics [10] using the software iMODELER (
Using system dynamics, one can explore non-linear developments resulting from the implementation of renewable energy projects. Therefore, it is also possible to estimate the need for resources and the accumulated depletion of raw materials, including the feedback loops between using materials and the need for energy already mentioned.
For a projection of demand, the World Energy Outlook (WEO) 2015 by the International Energy Agency (IEA) [13] provided narratives and data. From the WEO, we chose the New Policies Scenario with ambitious assumptions regarding energy efficiency performance of the sectors transportation, industry, and housing for our model. In this scenario, the WEO simply considers sufficiency to mean less demand for energy from every sector, i.e., less transportation, less production, less energy for housing, and less need for electricity.
While the WEO only projects to the year 2040, the energy demand value for 2040 was used to simulate out to the year 2050. After 2050, the energy demand was kept constant until 2100 to look ceteris paribus at the continued demand for resources from repowering renewables every 20 years (for wind energy) or every 25 years (for photovoltaics).
The model simulates monthly time steps, capturing variation between winter and summer for the different regions. However, it uses a lookup function to consider the daily variations of sunshine and wind. This enables simulating increasing demand for energy storage and expansion of the electricity grid to allow electricity transport from sunnier and windier parts to other regions. Since with the rising proportion of renewable energy, the peak production exceeds the local demand and energy would otherwise remain unused.
The model includes hydropower and biomass according to the WEO, plus offshore and onshore wind and photovoltaics (PV) as renewable energy. The model considers a world market for power-to-liquid/gas (P2L/G) for the storage and re-electrification of surpluses of renewable energy and the remaining demand for synthetic fuels (also as a feedstock for the chemical industry),
The model differentiates global regions according to the WEO, except that Europe is separated into Germany and the rest of Europe so that the model can be validated with other studies on Germany's path towards renewable energy, in particular the later mentioned RESCUE study [14]–[16].
The raw materials needed for renewable energy generation are differentiated at the aggregated level into precious metals, semi-precious metals, rare earth metals, industrial minerals, and non-ferrous non-precious metals. Specific materials like copper, silver, neodymium, iron, and aluminium are explicitly modelled. Other sectors' demand for those materials was added to the model based on a review of relevant literature (e.g., [17], [18]).
The potential substitution of greenhouse-gas-intensive steel, concrete and gypsum through biotic materials can be based on various assumptions. On a highly aggregated level, simple substitution of the same mass (i.e., million tons by million tons) was used to derive the proportion of energy need relative to the total need for the industry sector that most heavily relies on these materials. The assumption is based on the argument from the steel and concrete industry [19] that they are using lightweight construction materials. Although their lifespan for a single application might be longer, one could use wood in a cascade, i.e., sequentially (re)used for different purposes, from massive wood to different varieties of chipboard and cellulose.
The capacities to implement renewable energy (production of renewable energy technology components; transportation; installation of renewable energy technologies; land area for installation) are set to very high levels so that they do not act as constraints. That allows for a focus on the potential needs for raw materials. However, one can use the model with more precise estimates of actual capacities for different applications.
As outputs, the model assesses the need for resources, the depletion of known reserves, the associated CO2 emissions, and the economic effects on the different regions derived from energy production prices and regional value creation.
The ICARE Energy Model is quite comprehensive. It is highly aggregated to look at magnitudes and trends of developments but with robust quality. A greater level of detail would require more and significantly more complex assumptions, e.g. if the wood substitutes steel from windmills or aluminium from PV constructions.
The ICARE LULUCF Model assesses world regions according to the WEO using data from the Food and Agricultural Organization's (FAO) online database (
The model offers parameters to define future scenarios of afforestation or deforestation as well as increasing or decreasing shares of:
organic farming,
consumption of animal products,
food waste,
use of wood,
use of yields for non-food purposes,
sealing of land areas for settlements and infrastructure, and
cultivation of yet unused areas.
Wood and crops for material use, and at the end of a cascade, their end-of-life energy use are considered regarding their effect on carbon capturing: first substituting fossil resources and materials (steel and concrete) and later releasing the CO2 again. The substitution effect and the additional potential for biomass energy use are then transferred into the quantitative ICARE Energy Model.
To support the interpretation of the results from the ICARE Energy Model regarding winners and losers, the much smaller and very abstract ICARE Game-Theoretical Model looks at two fictional regions. One region is developing (called "elsewhere") and provides raw materials, while the other region is rich (called "here") and imports materials that support technology, including renewable ones for energy. Raw materials can deplete and be substituted by another material, possibly through recycling from anthropogenic stocks.
In both regions, there is economic activity through the production and consumption of material products and services, although the potential for consumption growth is greater in the developing region. Both regions also have jobs, purchasing power, and money creation. The latter takes place only in times of growth and is needed in the model because logically, without money creation, the simulation would reach an equilibrium.
The model runs one hundred abstract time steps. The units for the resources, wealth, purchasing power, etc., are also abstract index values used merely to explore the general logic of economic growth and its dependency on resources and value creation. The parameters to define and explore scenarios are the shift of value creation, recycling, material efficiency, productivity, sufficiency, financial investment activity, and material losses for both regions.
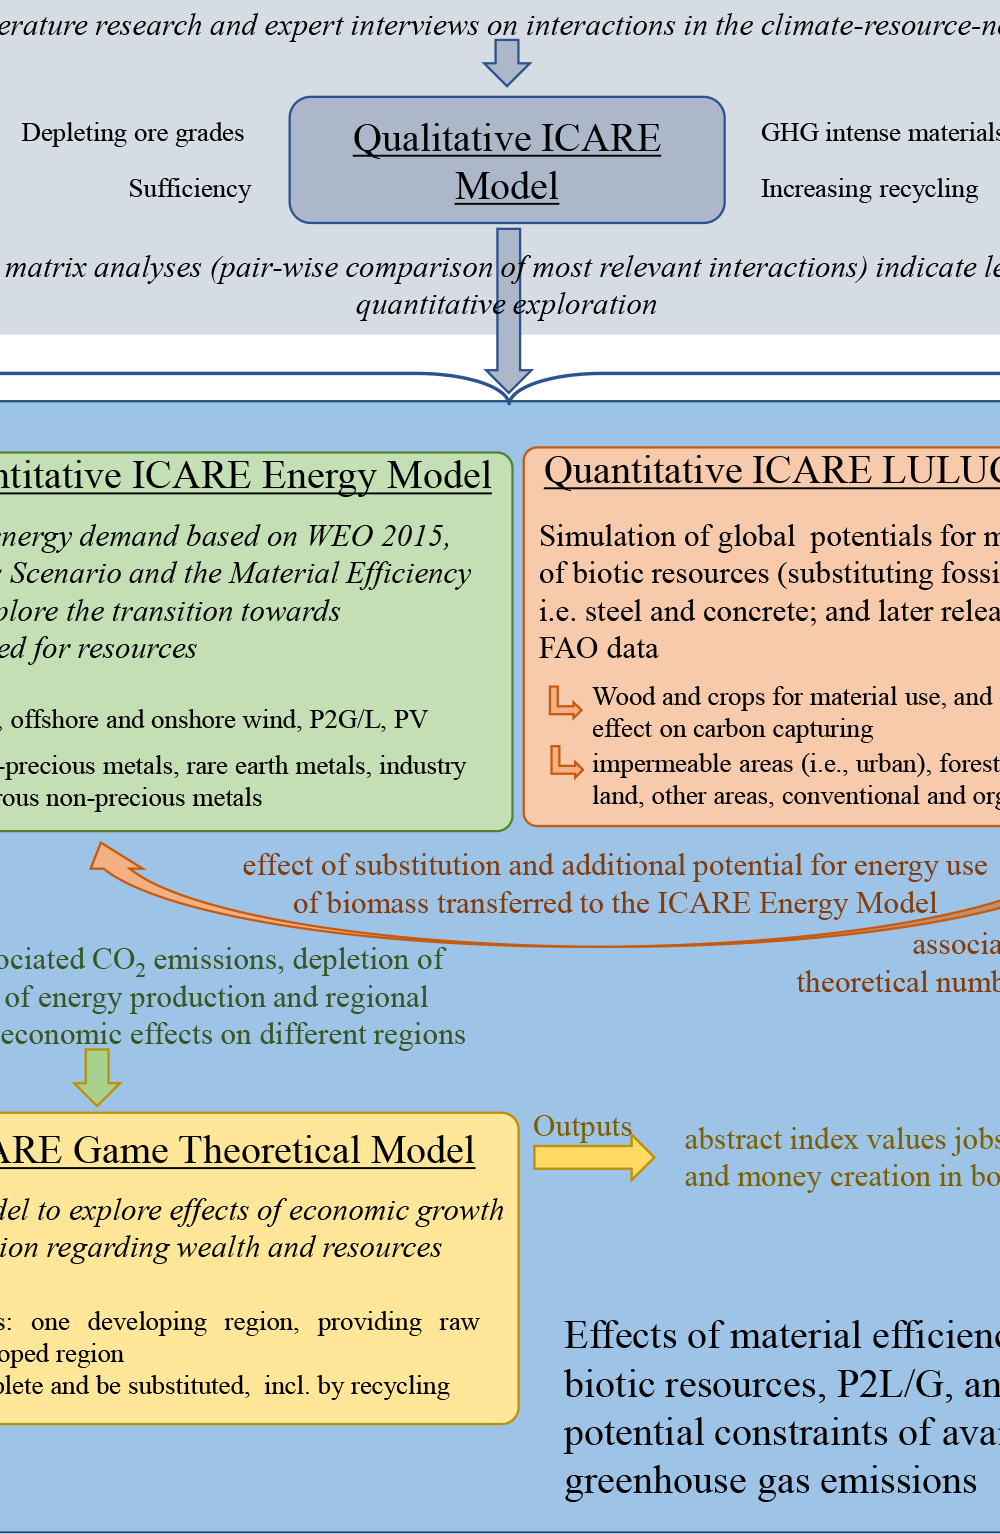
Using the qualitative model, we explored the mechanisms and interactions in the climate-resource-nexus based on literature review and expert interviews (see results published in [3]). Figure 1 shows how, starting from that, we developed three different, interlinked quantitative models to explore the global need for energy, the energy transition and its need for resources. The figure also shows how we added data from the ICARE LULUCF model on the potential of biotic resources and how we used these two models to run more than 15 scenarios. As an extra model, it shows the ICARE Game Theoretical Model that investigated economic effects and shifts in value creation via changes in abstract index values. Comprehensive model documentation is available upon request.
Overview and interplay of qualitative and quantitative ICARE models used for this study
With the ICARE Game-Theoretical Model, we used the Monte-Carlo simulation to find a combination of parameters that upholds material wealth in both regions without any economic collapses from sudden lack of materials, and loss of spending power, etc. A Monte-Carlo simulation was also used with the ICARE LULUCF Model. By trying different combinations of parameters, the model suggests optimal ways to feed the world, provide for non-food biotic resources, and capture as much GHG as possible. The ICARE Energy Model ran a series of concrete scenarios. These scenarios aimed at reaching the target of 100% renewable energy by exploring, among other things, the possible results of changes in material efficiency, biotic resources, and sufficiency. The scenarios also demonstrate pathways for achieving this either through constant or delayed increases in the intensity of renewable energy implementation, the proportions of PV and the degree of electrification also defining the demand for power-to-liquid or -gas (P2L/G), e.g., for synthetic fuels.
Four specific scenarios corresponding to the original study [21] are used to run the models (Table 1).
Overview of scenarios used in the present study
Scenario name* |
Brief scenario description |
Scenario S2: Base scenario |
The world will reach 100% renewables by 2050, with some regions like Africa, South America, or Eurasia starting this transition 5 years later. The net rate of annual renewable energy installations needed to reach the target is set at a high, constant (i.e., unchanging) level. The basis for the energy demand is the "New Policies" scenario from WEO (2015). This is further reduced in a sufficiency approach by 15% for all sectors, assuming maximised electrification of the sectors under the "GreenEe" scenario from the RESCUE study of the German Environment Agency1 [14]. Unlike the WEO, S2 assumes the highest degree of electrification of the transportation, industry, and housing sectors with as little use of synthetic fuels as possible. Wind and solar proportions are adapted accordingly to the different world regions. |
Scenario S5: Material efficiency scenario |
Based on scenario S2 and the WEO's Material Efficiency Scenario (MES), which assumes additional measures like further increased recycling rates for steel and aluminium, lifetime extension, and lightweight construction (also of concrete, see [7], [22]) compared to its New Policies Scenario. S5 overall could further reduce the demand for energy from the industry sector by an additional 9% (resulting in 17% reduction when combined with reasonable measures). |
Scenario S6: Material efficiency and sufficiency combined: |
Based on scenario S5 with a projected maximal material efficiency, which builds on scenario S2 that already assumes 15% sufficiency compared to the WEO scenario. Scenario S6 adds another 20% sufficiency, which could be considered realistic, assuming global lifestyle changes [11], [23], [24]. |
Scenario S8: Material substitution scenario |
Based on scenario S2, scenario S8 examines the potential of increased material and energy use of biotic raw materials. The potential for biotic resources was derived from the ICARE LULUCF Model along two sub-scenarios. Sub-scenario 1: a business-as-usual scenario for current land use against the background of growing population and proliferation of the diet of industrialised countries. Subscenario 2: a modified scenario which considered a halving of food waste, a halving of animal food consumption, conversion of some parts of only extensively used land into arable land and reforestation of 10% globally by 2100. The additional amount of biotic materials from more forest area is then used to substitute steel, concrete and gypsum, decreasing the energy demand from the industry sector. Following the cascading use principle, biotic materials also contribute to energy generation from biomass. |
* Scenario names are based on the original study [21]
The results section first presents the need for resources for the global energy transition, followed by the potential effects of material efficiency and substitution of abiotic for biotic resources. Finally, the results from the game-theoretical modelling of economic growth are shown.
The findings from the four scenarios described above show that the transitions in all scenarios halt the increase of global CO2 emissions from energy use between 2050 and 2055 at a value of around 3,750 gigatons (Gt) of total CO2 emissions (Figure 2). Scenario S6 shows the lowest value at the end of 2050 of around 3,676 Gt. It is followed by scenario S8 with approximately 3,738 Gt, scenario S5 with around 3,740 Gt and scenario S2 with approximately 3,747 Gt. Looking at the total CO2 emissions, the differences between the four scenarios are rather small. All scenarios reach the target of 100% renewable energy; hence the differences in energy demand stemming from the scenario characteristics have little effect on the CO2 emissions.
The total global CO2 emissions from the energy sector and material use of fossil fuels (million tons) in five-year increments from 1990 to 2100
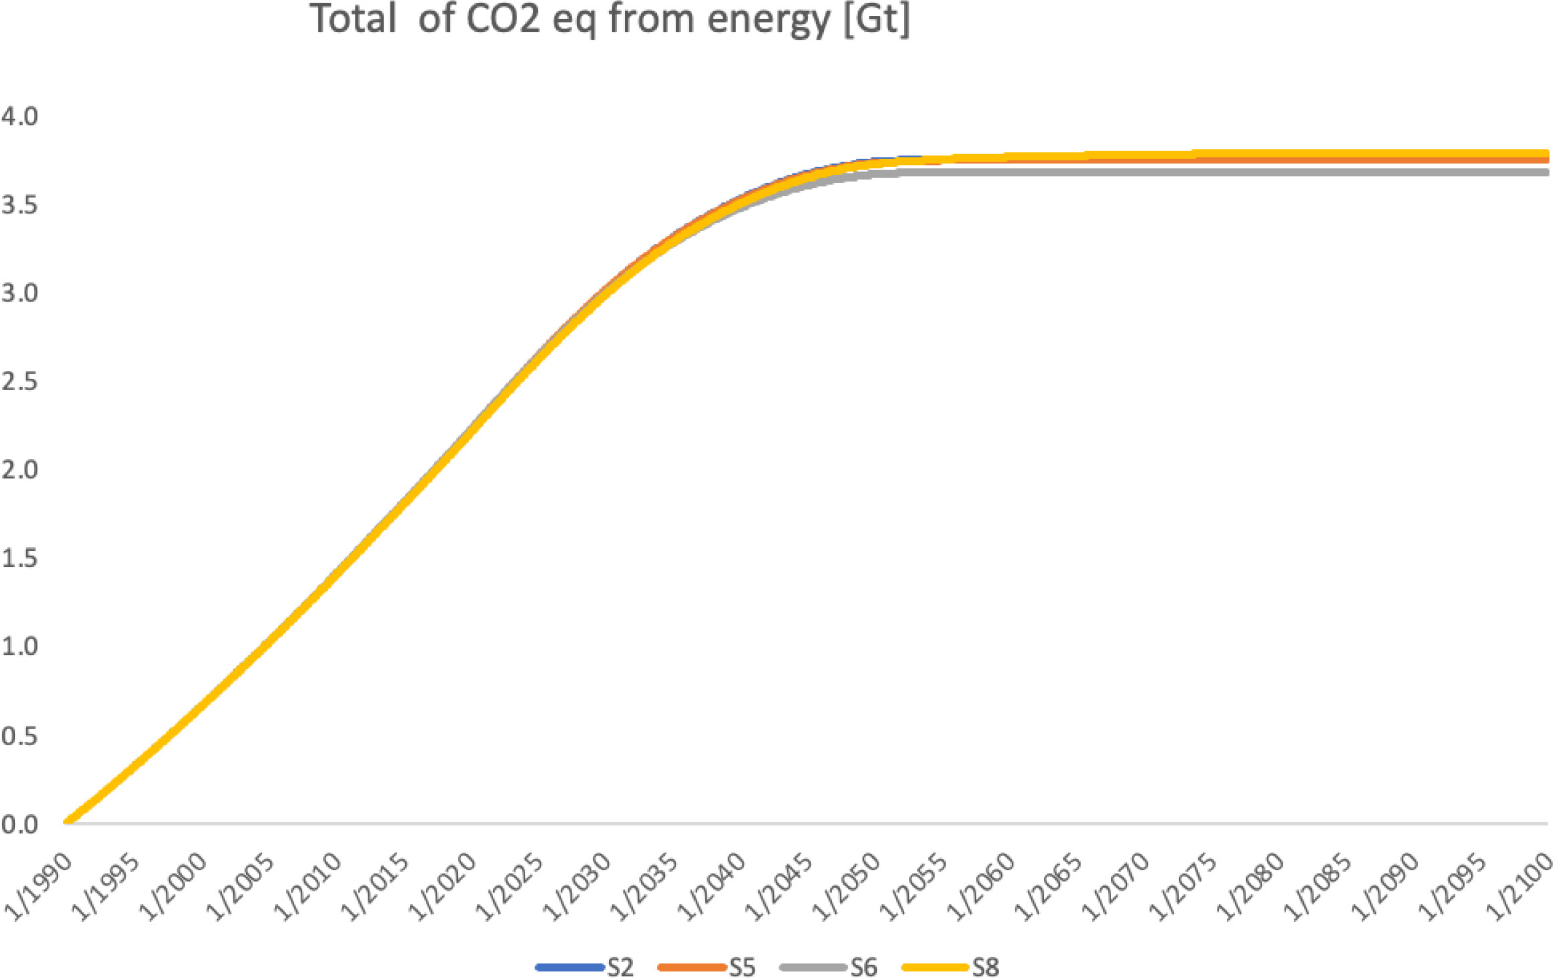
Compared to scenario S2, the material efficiency scenario S5 reduces CO2 emissions by around 7 Gt. The combined material efficiency − sufficiency scenario S6 achieves the largest CO2 emission reductions of more than 70 Gt. Scenario S8 achieves an emission reduction of around 9 Gt compared to scenario S2. It is important to remember that the model looks only at magnitudes as they can be forecasted with the aggregation level of the model. However, the insights for resource efficiency put into perspective the potential of biotic resources in scenario S8, also acting as a carbon sink. Here, material substitution effects and the prolonged lifespan through cascading use of biotic materials with end-of-life energy use lead to roughly the same GHG reduction potential as the material efficiency scenario S5. The end-of-life energy use implies releasing most of the captured carbon as GHG again, but at a later point of time while in the same area, new trees are capturing carbon)
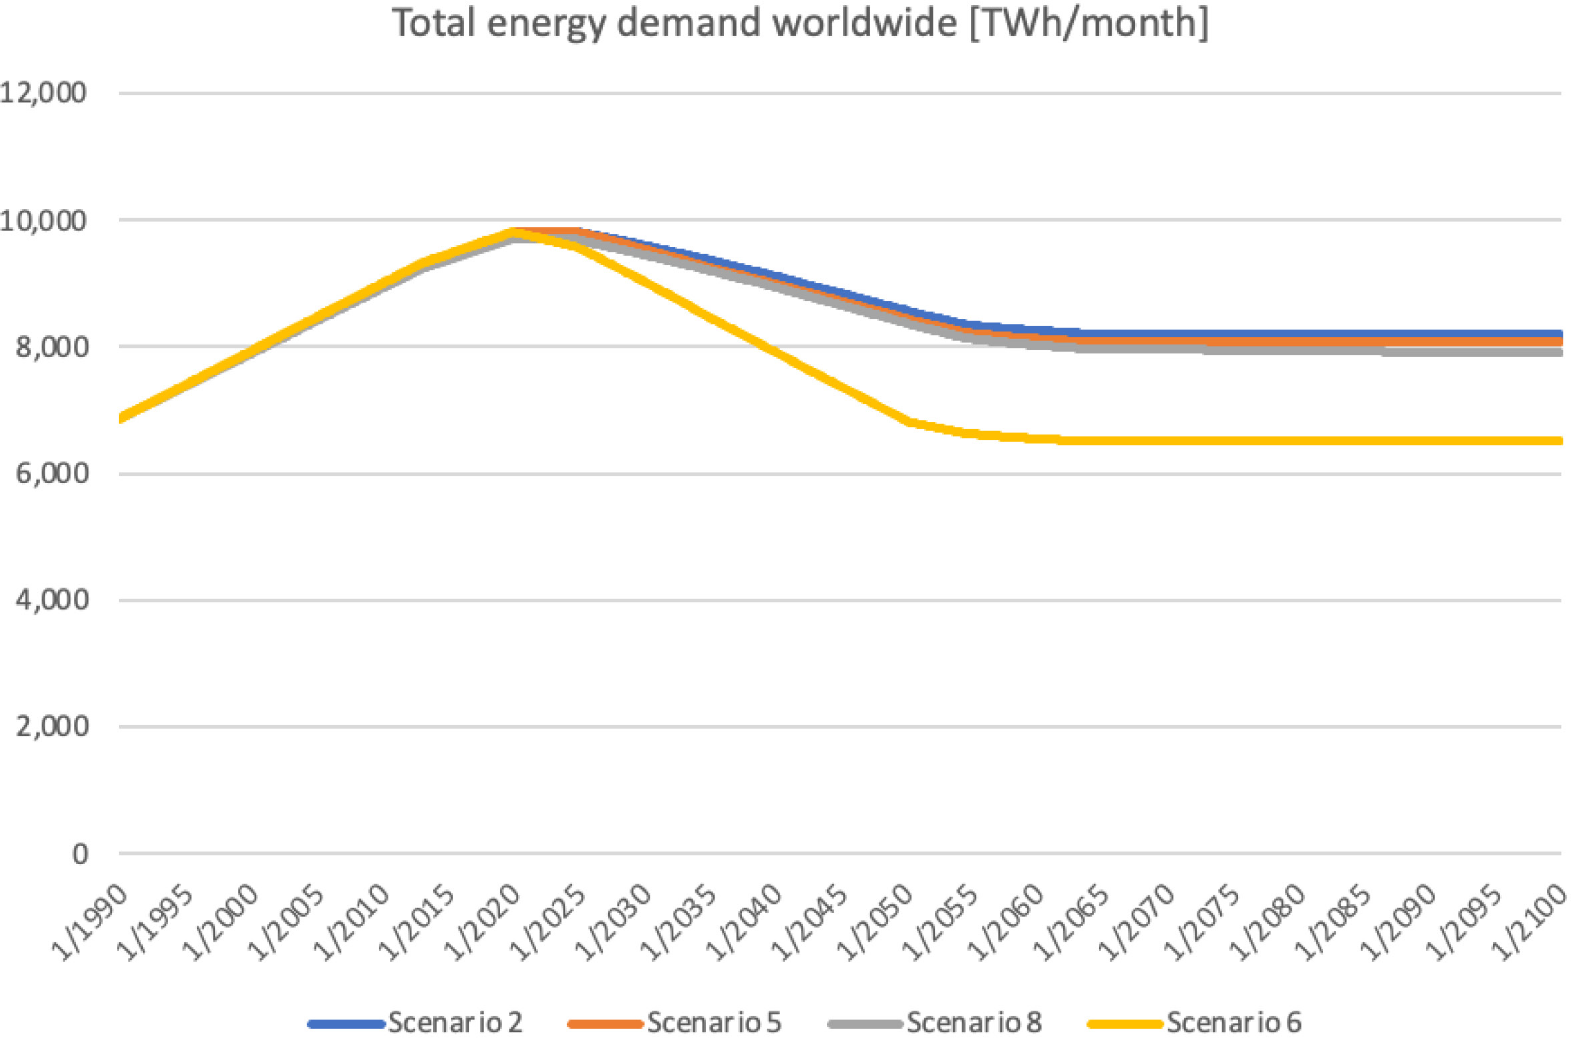
Looking at global total energy demand in terawatt hours (TWh) per month, the models show stagnating energy demand from around 2060 onwards at relatively similar values of around 8,000 TWh for scenarios S2, S5 and S8 (Figure 3). Not surprisingly, the combined material efficiency and sufficiency scenario, which assumes another 20% reduction in energy demand across all sectors, achieves the lowest value of around 6,600 TWh.
The total global monthly energy demand based on the four scenarios (TWh) in five-year increments from 1990 to 2100
One key issue of the renewable energy transition is the demand for certain raw materials associated with renewable energy generation technologies. In this context, the four scenarios described above indicate that there would be enough materials to reach a global transition to renewables by 2050 and continue installations repowering beyond 2100. However, a massive increase in the supply of high-grade copper resources alongside the provision of substantial amounts from recycling is needed to cover the rising demand for copper from the renewable energy transition (Figure 4).
The potential supply of copper (million tons) based on scenario 2, graphed in five-year increments from 1990 to 2100
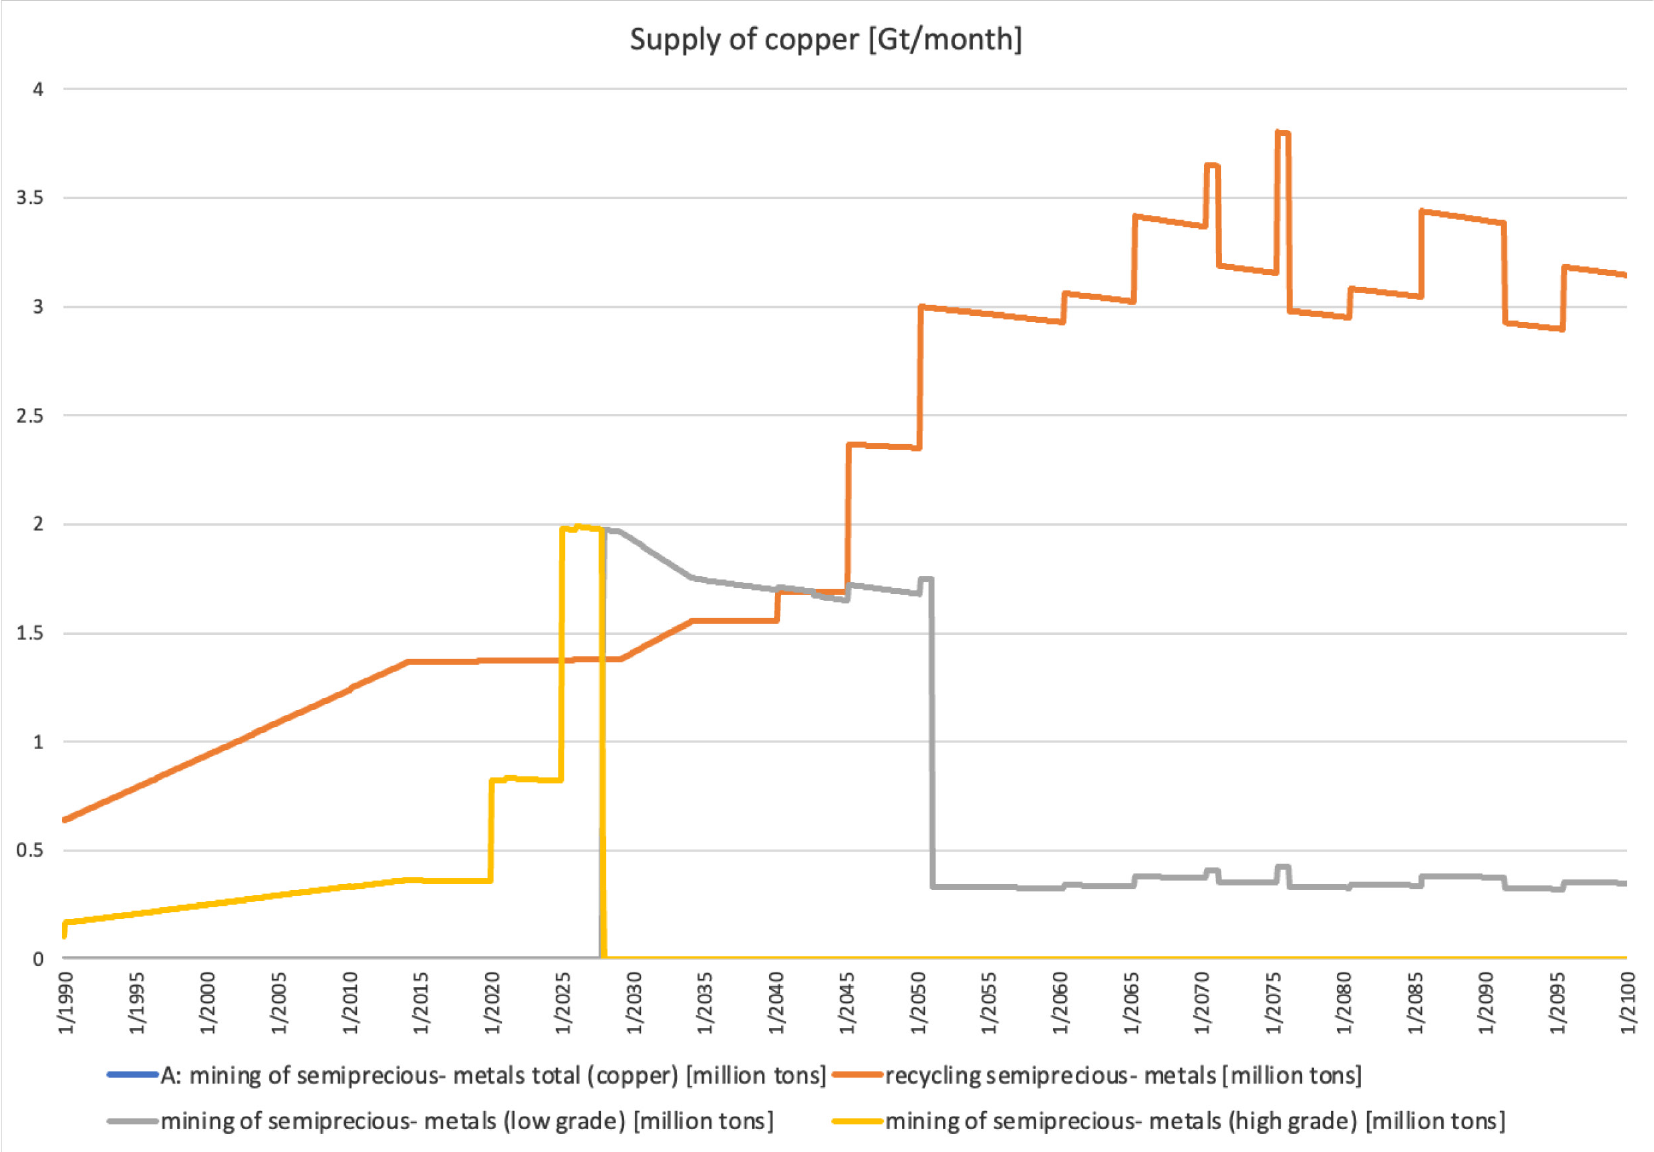
After a few years, these easily accessible high-grade resources would become exhausted, requiring a shift to use low-grade copper resources (known but not yet used sources and with declining grades of copper ore) [25]. By chance, there is no overlap between high-grade and low-grade copper; therefore, the total of mining equals the respective mining, and the blue line in Figure 3 is behind the yellow and the grey line. In reality, however, there is always some mining of low-grade from the same mines providing high-grade copper, but this simplification of either/or is quite common. Copper can be seen as a proxy for raw materials relevant for the renewable energy transition, with other crucial materials having their own but similar capacities [26]–[28].
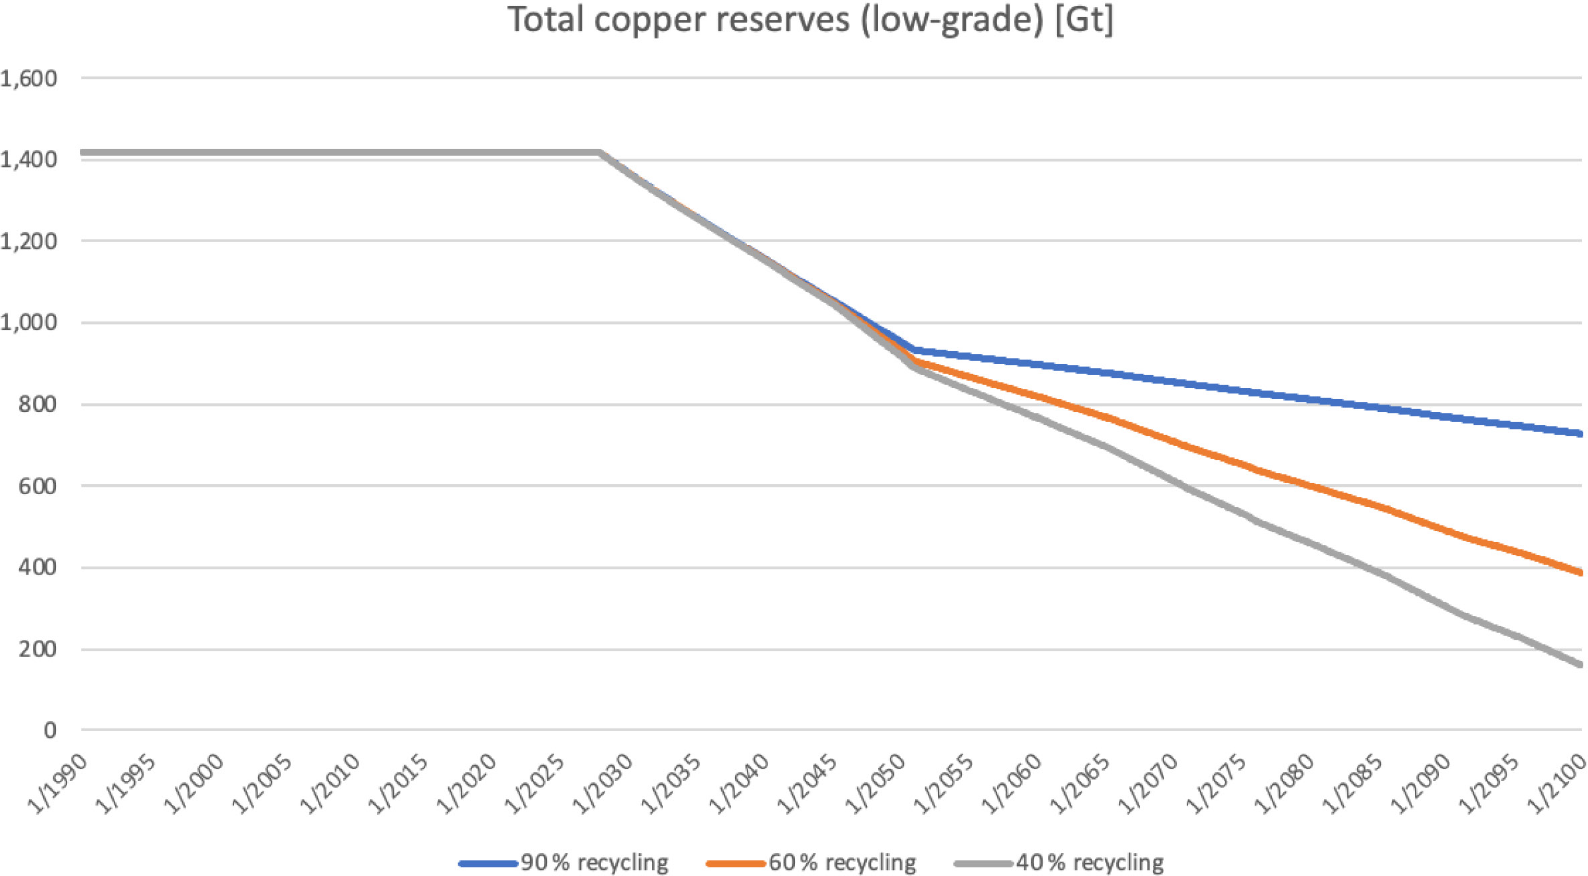
Figure 5 shows the effects of different recycling rates on the availability of known low-grade copper reserves until 2100 – with the highest recycling rate of 90% (assumed in all scenarios) resulting in the largest amounts of known reserves still available. A circular economy enabling 90% or more recycling would require returning most materials from old installations to production facilities. A recycling rate of 60% might work economically until the year 2100. Still, less than 50 years later, assuming the continued repowering of renewable energy, at least for copper, the known sources would be exhausted. A scenario of 60% recycling (Figure 4) results in a decrease of more than 400 million tons from 2050 to 2100, indicating that the remaining 400 million tons available around 2100 would be depleted by 2150.
Total reserves of low-grade copper (million tons) depending on the recycling rate (scenario 2) in five-year increments from 1990 to 2100
While the resources for a global energy transition would be available, another question is whether the economy could provide for all the materials, production capacities and transportation needed for this transition. The needed increase in installations, as Figure 6 shows, would be massive. Once demand rises, at least for a short period, prices will also rise posing the risk that poorer parts of the world will be unable to afford the transition and continue to use their own fossil energy sources.
Likewise, a constraint could arise due to the difference between 'early-adopter' countries that can use high-grade resources and those that start later and must use more expensive low-grade resources. Later, the access to recycled materials would again be easier for the 'early-adopters' since they repower their installations earlier in the simulation and thus obtain recycled materials from the repowered installations.
Global, monthly installation of renewable energy capacities (including repowering) in GWp per month (scenario 2) in five-year increments from 1990 to 2100
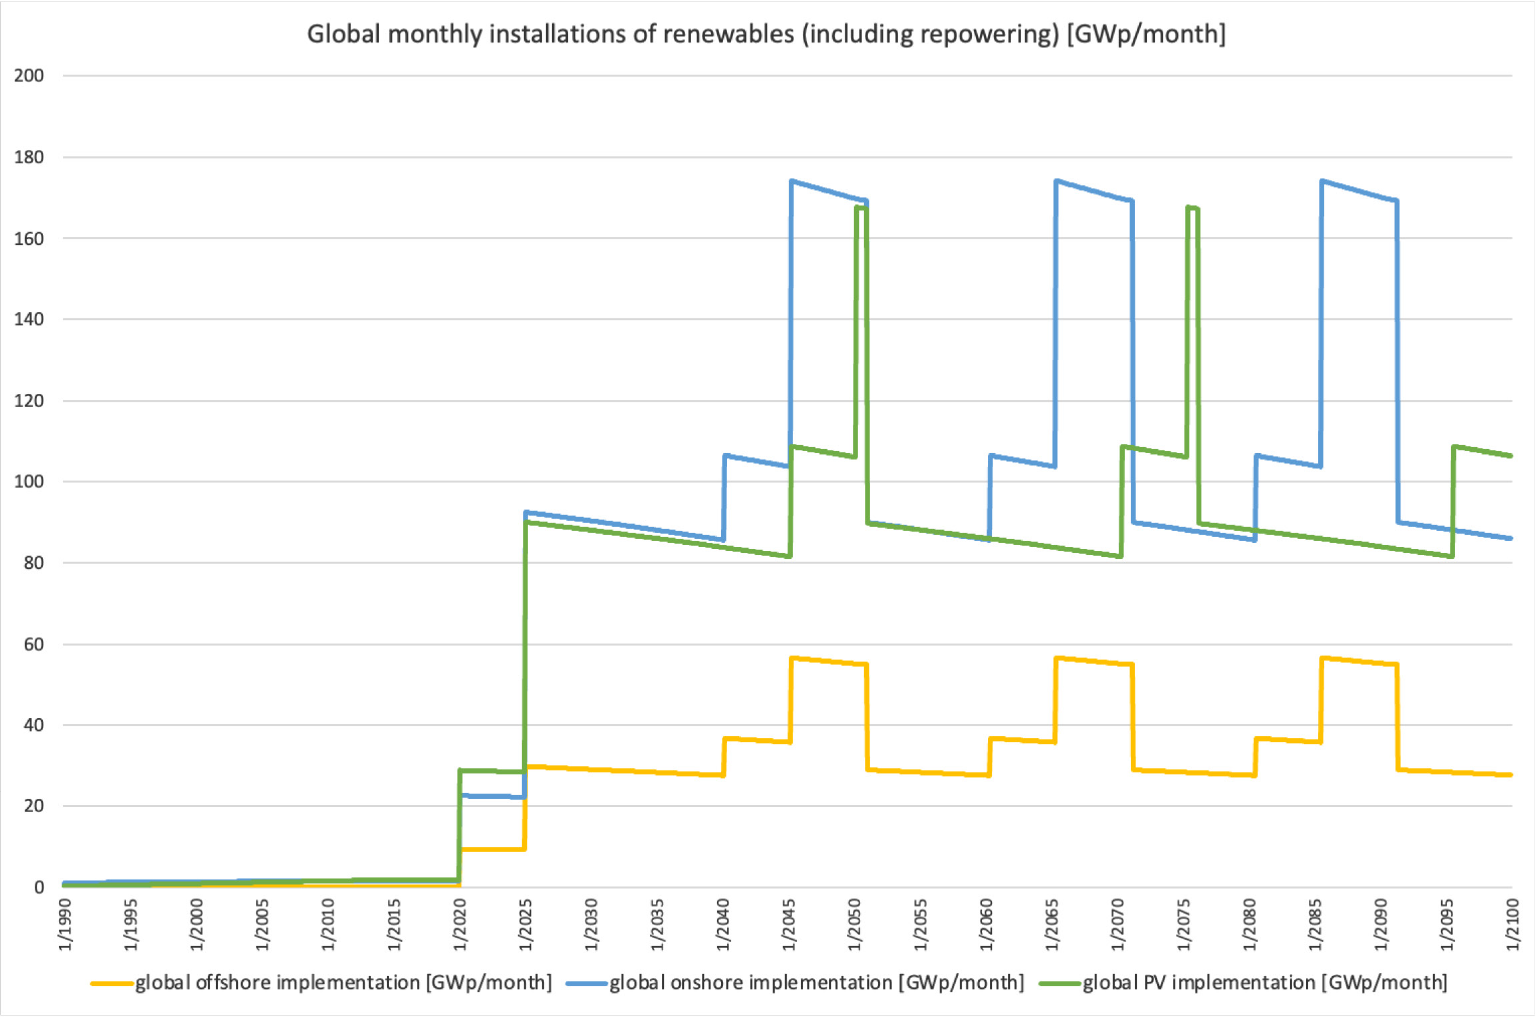
If the whole transition towards reaching the target of 100% renewable energy takes longer than the lifecycle of the respective renewable energy technologies, then the net implementation plus the need for repowering of the first installations would significantly increase, nearly doubling the need for resources. However, this potential doubling of material needs may only last for a couple of years (Figure 6, e.g., between 2045 and 2050), possibly making it difficult for businesses to invest, given a forecasted decrease in demand.
Figure 7 compares the four different scenarios for a 100% renewable energy world by considering North America's need to implement onshore wind capacities, which serves as a proxy for all technologies in all regions. According to IEA (2015) [13], the region has capacity targets set so that the mix of onshore/offshore and PV provides 100% renewable energy for the given energy demand. If demand decreases, the capacities for the mix decrease accordingly. Therefore, if a global change in demand through efficiency (scenario S5), sufficiency (scenario S6), or substitution by biotic resources (scenario S8) becomes possible, the difference can be shown with any of the technologies from any region since everything changes proportionally. There is one exception: the Middle East as a region offers a lower potential for biotic materials compared to the other regions.
Scenario S6 implies a further reduction of demand from all energy-related sectors (production, transportation, housing) through a change of lifestyle (sufficiency). Scenario 8 also implies a form of sufficiency since it requires less food waste and a reduction in animal-based food consumption.
Fostering material efficiency (scenario S5) seems to have a small effect on onshore wind capacity installation. It shows the corresponding need for energy rather than materials; however, this need is just a small part of the overall need from all other sectors. The main reason is that the WEO's forecast of energy demand already considered gains in material efficiency, and scenario 5 only adds some rather sophisticated efforts. The graph must be interpreted considering that it does not show ceteris paribus a constant demand with or without material efficiency, instead indicating a massive increase in demand from global economic growth. However, material efficiency remains important to prevent the constraints explained in the previous section. Also, the model considers a reinforcing feedback loop when less need for materials reduces the need for energy, leading to less need for renewables that, again, reduces the need for materials.
Scenarios 2, 5, 6 and 8 and their corresponding need for installations of renewable energy in five-year increments from 1990 to 2100 based on onshore wind capacity in North America
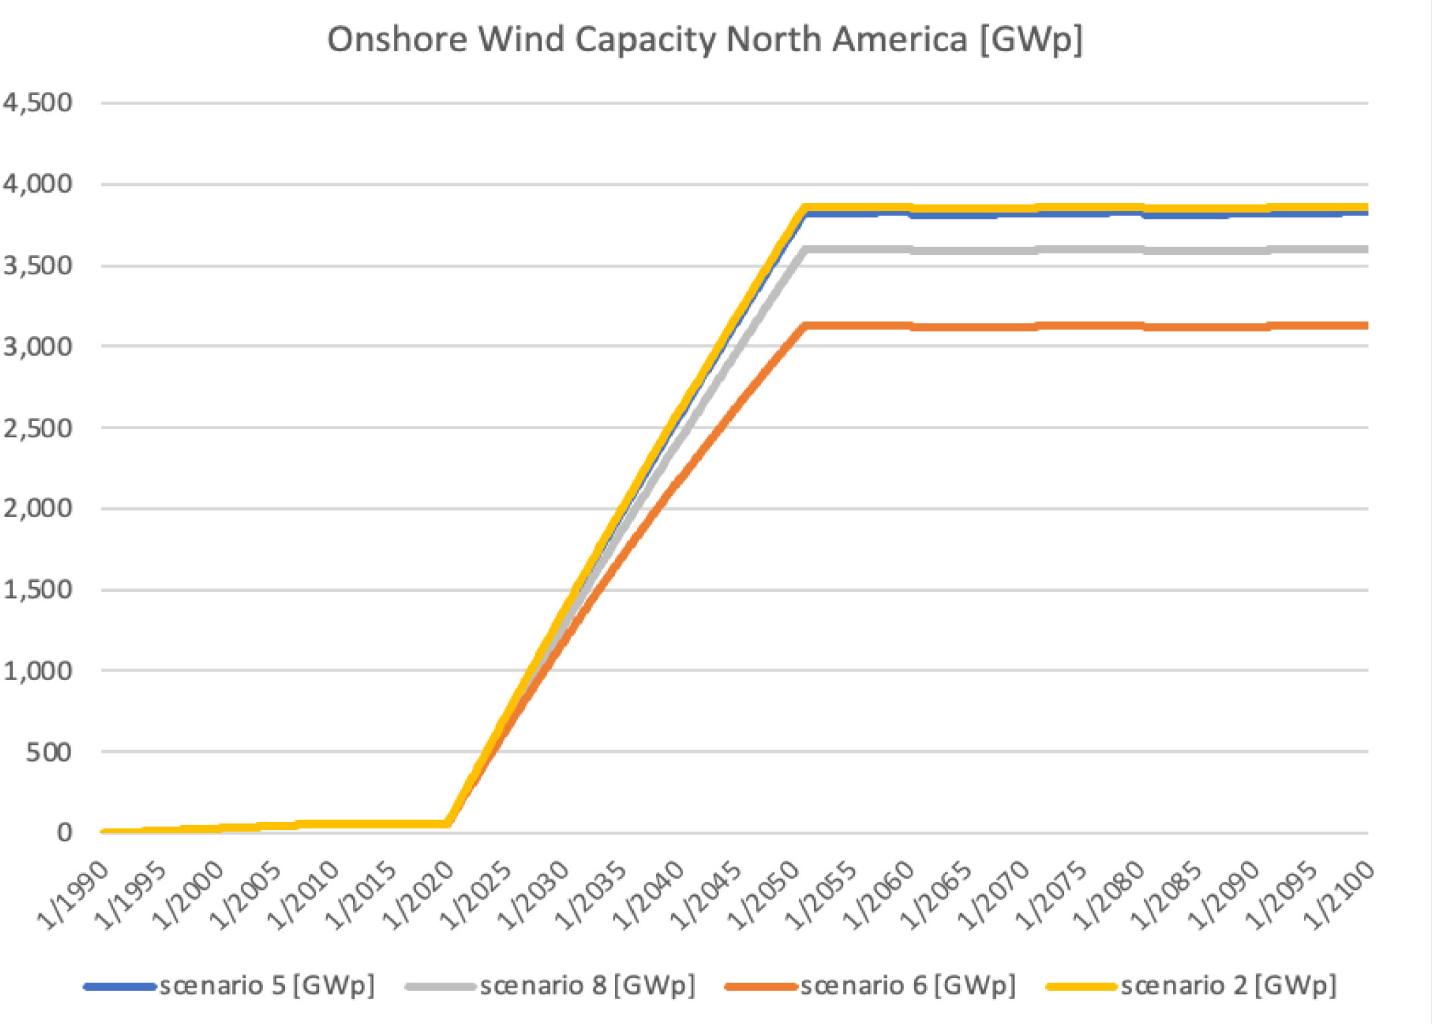
The substitution of biotic resources for parts of the global use of steel, concrete, and gypsum (scenario S8 in Figure 7) would lower the demand for renewable energy installations by roughly 10%. One reason is the substitution of GHG-intensive resources; the other is the end-of-life energy use of biotic materials that increases the renewable energy from biomass and thus reduces the demand for wind and solar energy.
The potential food deficit or surplus (million tons) based on the use of biotic materials with (Potential) or without (Current) changes in diets, food waste and land use
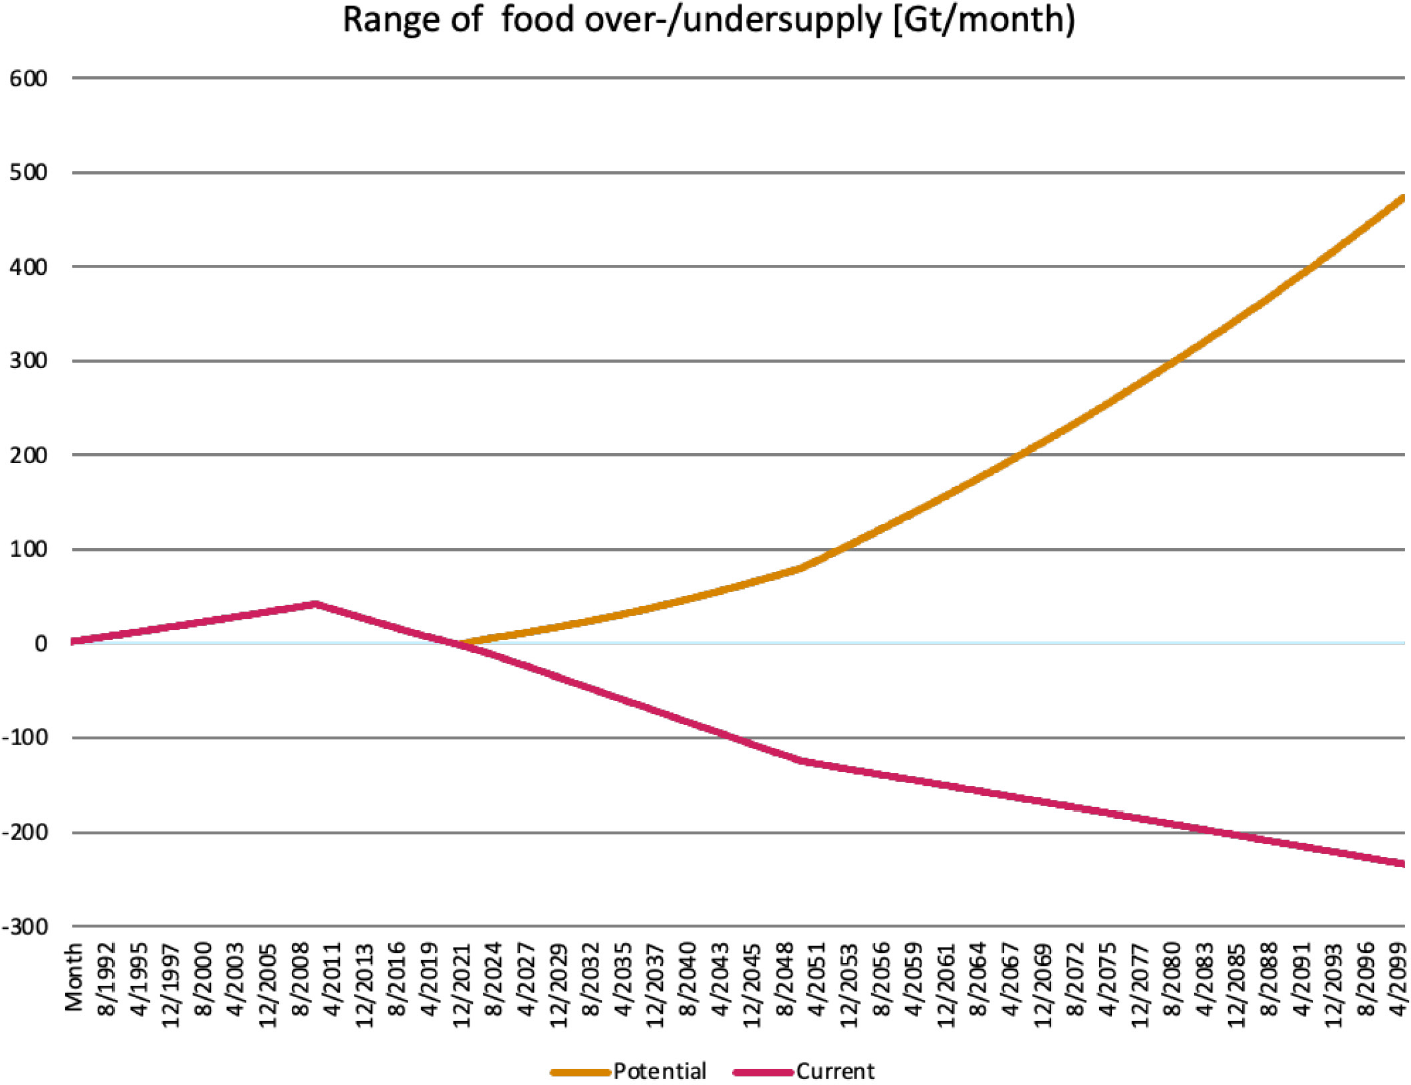
The ICARE LULUCF Model shows that the current use of land and the future demand for food based on today's diets would not allow us to feed the world (Figure 8, Current scenario, i.e., future deficits of food supply). Only by reducing the consumption of animal products (thus needing less area for fodder production), increasing the utilisation of extensively used or unused areas [14], as well as reducing food waste, would create a surplus of food production (Figure 8, Potential scenario). This surplus would then lead to a feasible potential for afforestation and the use of biotic materials in the Potential scenario.
Figure 9 shows a trajectory of the monthly CO2 capture potential of the LULUCF scenario S8. Once the change of land use with less need for areas for fodder production and more afforestation starts (around 2022), differences in the two curves occur.
Net CO2 emissions/capturing from global LULUCF comparing current levels with scenario 8
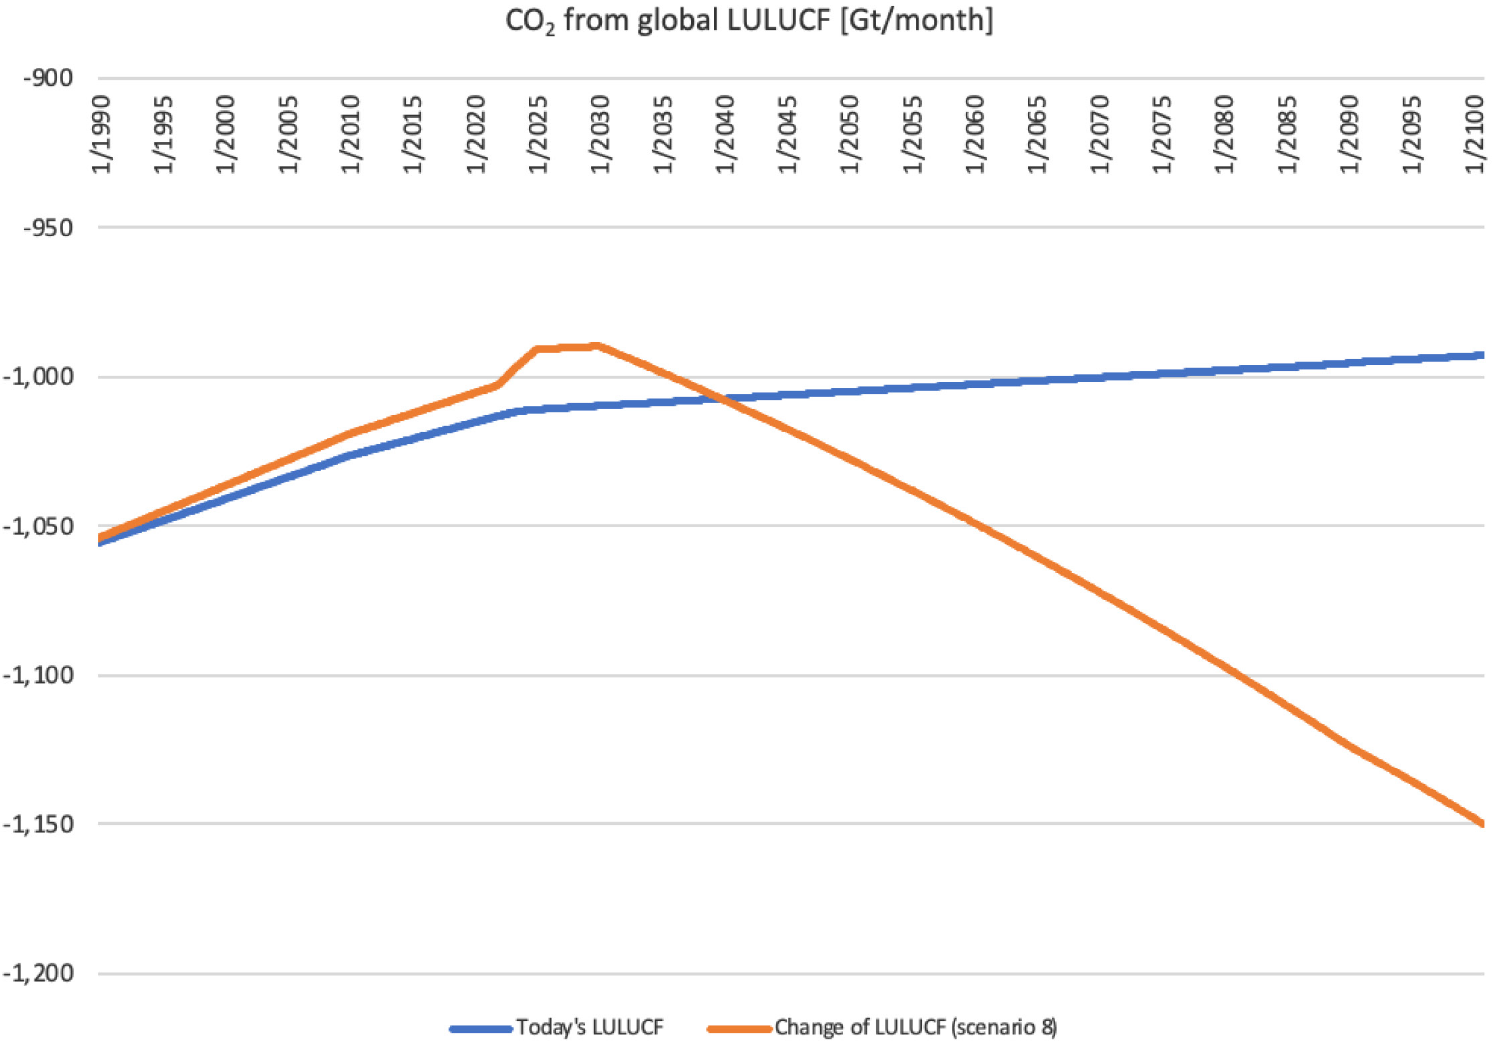
While extending today's LULUCF into the future shows continuously decreasing CO2 sink effects, the changes in LULUCF, as described above, first lead to a decrease in CO2 sink effects through 2030. Afterwards, significant additional sink effects occur that amount to around 1.16 Gt by 2100 – or 0.17 Gt greater emission reduction potential than the 'Today's scenario'. The initial decrease in the sink effect stems from continued deforestation for growing food demand and a continued increase in impermeable land due to the construction of housing and infrastructure, leaving less sink area. The change of function as a carbon sink is possible due to the assumption in scenario 8 of the ICARE Energy Model that not all forest is used for wood production; hence forest area remains to function as a sink.
Even with the assumption of 15% less energy demand globally (sufficiency assumption in scenario S2) compared to the projected energy demand from the WEO, most model simulations (except for scenario S6) reflect a narrative of continued economic growth in most world regions. Only the combined sufficiency and material efficiency scenario S6 with its additional 20% sufficiency could be interpreted as a step towards economic contraction. While Figure 5 showed that, at least for copper, material availabilities would not become a constraint before the year 2100, with unabated consumption, they are likely to become a constraint in the 22nd century. Therefore, fostering a circular economy is crucial to satisfy raw material demands by increasingly recycling the anthropogenic stock.
However, out of the anthropogenic stock of materials, one can only retrieve what becomes available after the average lifecycle of products and structures. So, if the primary material used increases year by year, the world would inevitably face the risk of exhausting virgin raw material reserves while not yet having the quantities of recycled materials needed to satisfy demands. Therefore, material wealth would collapse in the long run even despite increased recycling efforts (Figure 10 using index values and an abstract time scale).
Limits to growth with unequal distribution of value creation
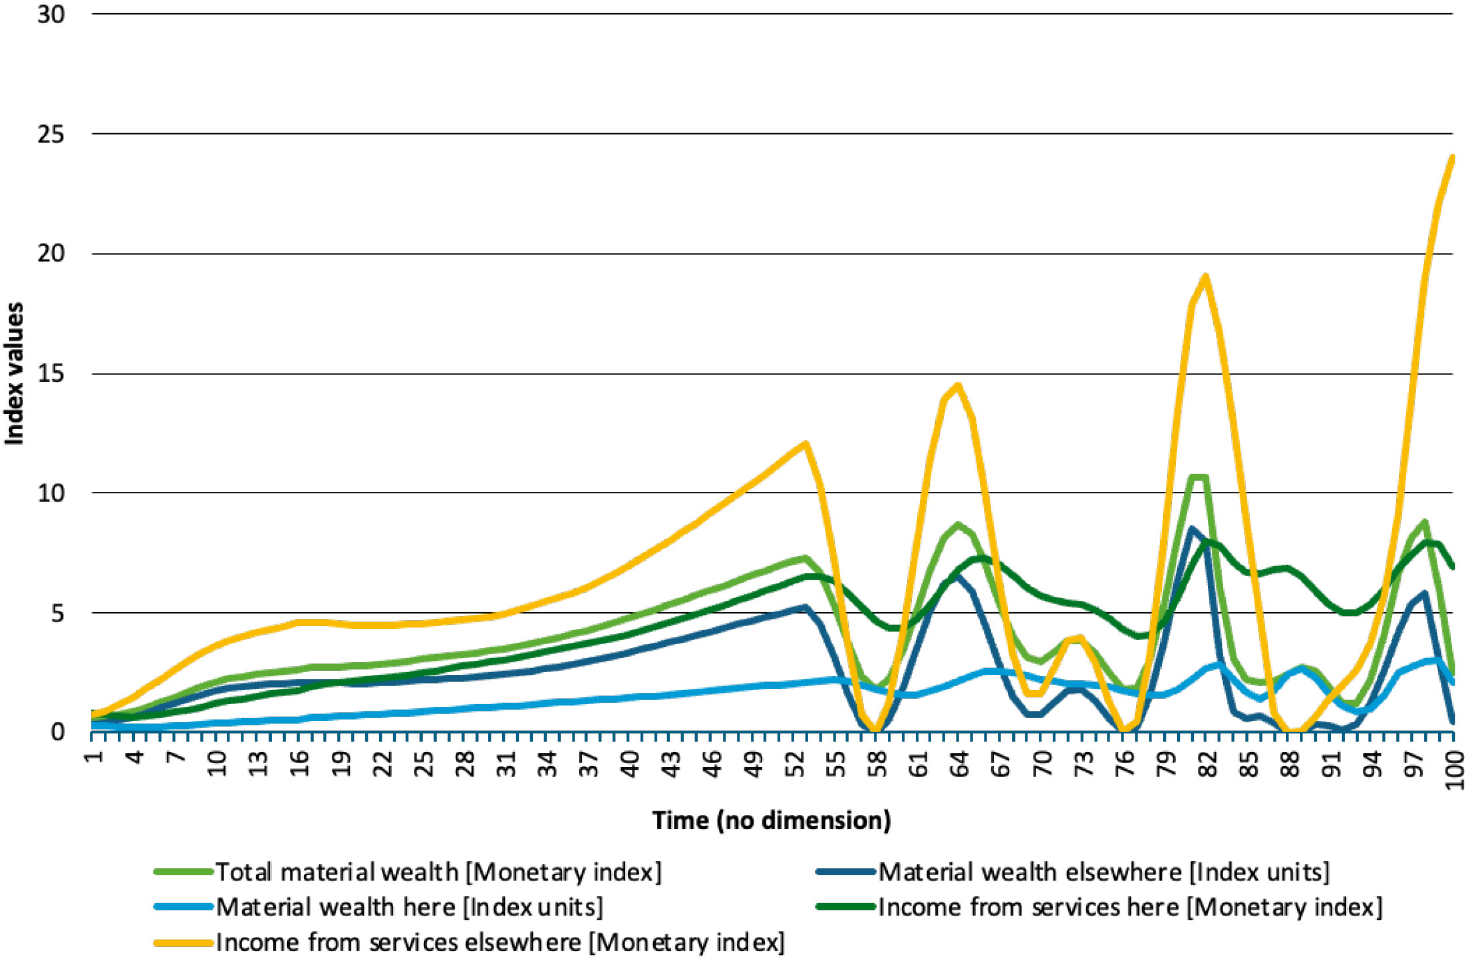
Different scenarios with the ICARE Game-Theoretical Model showed that total material wealth was more stable when value creation was increased through a circular economy in developing countries (producing and exporting virgin materials). Suppose developing countries only provide materials for export to rich countries, which in turn keep these materials for reuse and recycling in their national economies. In that case, developing regions have significantly lower growth potential and value creation. Nonetheless, for companies in developed countries in the short term, it may seem reasonable to maximise value creation, fill their anthropogenic stock with materials and become an exporter of technologies for renewable energy. Hence, international cooperation seems relevant to establishing material production and recycling capacities in a globally just way.
Finally, Figure 10 also indicates that energy supply, or the need for raw materials for renewable energy technologies and associated price increases, could limit the growth of material wealth. In the case of such economic constraints, less energy is produced, and hence energy becomes very expensive, leading to less material consumption because of reduced material needs for energy generation. In turn, this could moderate the growth of material wealth and allow us to enter a circular economy without collapse because of a gap between current material needs and existing anthropogenic material stocks.
Because all four scenarios achieve a 100% renewable energy world with zero GHG emissions in 2050 or 2060, it is the
By reducing GHG emissions directly (avoided or reduced emissions from the production of primary raw materials and resource-efficient goods) or indirectly (reducing the need for energy associated with primary raw materials production);
By supporting the 100% renewable energy transition through increasing the availability of needed secondary raw materials, thus fostering resilience against increasing costs and scarcities of primary raw materials.
In the former context (1), the finding of around 7 Gt CO2 emission reduction effects in 2050 of the material efficiency scenario S5 compared to a baseline with climate action (scenario S2, Figure 2) are of an order of magnitude similar to other studies. For instance, Hatfield-Dodds et al. (2017) [5] arrive at around a 3 Gt reduction in global GHG emissions in 2050 for their Efficiency Plus Scenario. This scenario combines resource efficiency improvements (through technology innovation, raw material taxation and demand changes through green public procurement and regulation) with GHG abatement policies and is compared to the effects of just the GHG abatement settings (the Ambitious Climate scenario). Meyer et al. (2018) [29] find around 2 million Gt reductions in global CO2 emissions in 2050 under a resource-efficient scenario, which assumes 2% annual efficiency improvements in 75 key industry sectors in Germany and – with a time lag – also in other countries.
In the latter context described above (2), potential constraints regarding the availability of materials needed for the renewable energy transition make a case for keeping materials in cycles longer and recovering materials from existing renewable energy installations [17], [26]–[28]. Hence, circular economy approaches are considered a key lever to support the renewable energy transition globally [30] and in different world regions and countries, for instance, Africa and China [31]–[34]. Several raw materials critical for the renewable energy transition are increasingly considered scarce because of depleting high-grade reserves, making them more expensive [26], [28], [35]. Hence, in addition to improving the availability of (secondary) raw materials needed for the energy transition, recycling also brings down costs associated with raw material needs [36]–[38]. Thus, recycling and material substitution could alleviate price shocks and foster capacities to pursue the renewable energy transition. Additionally, recycling and substitution can diversify the material stocks needed for this transition, e.g., from abiotic to biotic, which might also render national economies more resilient and less dependent on imports.
This shows that pathways towards a 100% renewable energy world by around 2050 seem to be most promising when they increase the resilience of regions or countries towards external shocks related to price or import dependency. Not only are circular economy approaches and recycling relevant in this context, but also reductions in overall energy and material needs without compromising global capacities for socio-economic well-being and justice.
Reducing overall energy demand, even if derived from renewable energy, is essential for at least three reasons. First, there are environmental impacts from PV and wind energy generation installations. For instance, PV installations, which are often located in arid or semiarid regions, can negatively affect soil structure, increase soil loss through floods or storms, and impact local biodiversity, e.g., by blocking migration routes [39]. Wind turbines can negatively affect wildlife and humans regarding mechanical and aerodynamic noise and visual impact [39]. However, environmental impacts of renewable energy generation (in particular regarding GHG emissions and land use, but also largely for water consumption) are perceived to be much lower than those of fossil energy generation [39]–[41].
Second, reducing overall energy demand can also mitigate the need for additional renewable energy capacities. These might prove challenging regarding the scale of needed investments in different country contexts (e.g., [42]) and potentially increased raw material prices. Arising from there are potential constraints to the renewable energy transition if the needed increase in capacities becomes technically or economically unrealistic (see, e.g., [43]) or if repowering is hampered by issues of acceptance or changing access to land for renewables (see, e.g. [44]). International policy support should assist countries in transitioning toward renewable energy systems and mitigating raw-material price increases for relevant technologies.
Lastly, and most importantly, only by reducing overall energy demand will it be possible to achieve and maintain atmospheric GHG concentration compatible with a 1.5-degree world. The required concentration is a maximum of 430 ppm, equivalent to a GHG amount of approximately 3,360 Gt by 2100 (with 128 ppm CO2 equaling approximately 1,000 Gt of CO2, see, e.g., [45]–[47]). In December 2021, atmospheric concentrations were already around 417 ppm [48] or approximately 3,258 Gt, leaving only little room for adding further to the stock of CO2 in the atmosphere. None of the four scenarios modelled in this study arrives at a value lower than 3,700 Gt accumulated globally by 2100. Therefore, even greater reductions in energy demand or earlier achievements of 100% renewable energy appear necessary to stay within a 1.5-degree world, in addition to the modelled combined sufficiency and material efficiency scenario (scenario S6 in Figure 2).
An essential pillar of achieving a 1.5-degree world while delivering on global just socio-economic well-being is reducing CO2 emissions associated with human lifestyles (see, e.g., [24]), particularly in the Global North. The ongoing major environmental issues stem from the Western lifestyles of affluent households and individuals, particularly housing, mobility, and food choices (see, e.g., [49]–[52]). Investigating lifestyles for a 1.5-degree world, Akenji et al. (2021) [24] argue that high-income countries need to reduce their carbon footprints, mostly relating to food, housing, and transport, by between 69–82%, while upper- and lower middle-income countries need reductions of 23–50% by 2030. Changes in lifestyles are essential to achieve climate neutrality alongside a 100% renewable energy world because they are needed to "
According to Akenji et al. (2021) [24], lifestyle changes that could achieve such reductions in carbon footprints encompass car-free travelling and transport, minimisation of international flights, vegan, vegetarian or low-carbon protein diets, and renewable energy-based heating and/or cooling. Reduced per capita floor space in housing is also discussed (e.g., [7], [54], [55]).
Therefore, changing lifestyles towards an absolute reduction in the use of energy, land, materials and other natural resources offers great potential to help stay within an environmentally safe and socially just planetary space while ensuring a decent standard of living for humanity [24], [47], [52], [56].
Four different scenarios for achieving a 100% renewable energy world by 2050 were modelled. The model findings show that while a 100% renewable energy world with zero GHG emissions seems feasible, it is important to design a transition pathway that increases the availability of secondary materials for renewable energy generation and fosters value creation in developing countries. In this context, improving recycling is an essential milestone to provide secondary materials and thus reduce the risk of economic constraints related to depleting high-grade raw material reserves (associated with increasing costs). Therefore, material efficiency improvements are an important contribution to 100% renewable energy generation and climate mitigation.
Potentials for GHG emission reductions were greater in material substitution scenarios than in material efficiency scenarios – particularly since substituting abiotic for biotic materials increases sink functions. However, changing diets and reducing food waste are essential to avoid competition between biomass for food vs. material or energy use.
Here, lifestyle changes become relevant, which reduce energy and material demand across different sectors. These reduce GHG emissions to allow staying below 1.5-degree warming. Hence, sufficiency-oriented lifestyle changes are key to reducing energy use and GHG emissions associated with human food, housing, mobility, and product choices. Regarding just and decent living standards worldwide, such lifestyle changes should reduce present inequalities and allow for needed absolute reductions in the Global North while enabling a sustainable catching-up of socio-economic development in the Global South. From a global perspective, these efforts require avoiding an over-reliance on market forces only and creating synergies among paths that improve material efficiency, material substitution, and lifestyle changes. Otherwise, unrestricted free-market policies would make industrialised countries short-term winners and humanity a long-term loser. How the feasible pathways may look like and what mechanisms could be used to forge such international policy requires further investigation to support the needed transition. Helping other countries establish and foster a secondary raw materials economy for domestic use and export should form part of international policy. This trend would allow material efficiency and substitution to lead toward more ambitious GHG emission reductions.
The activities producing the results used for this study were funded by the German Environment Agency (UBA) and the German Environment Ministry (BMU) under FKZ 3718 31 101 0. The authors would like to thank two anonymous reviewers for helping improve the paper and Mr Carl C. Anderson for his thorough language editing.
- , Resource Efficiency and Climate Change: Material Efficiency Strategies for a Low-Carbon Future. Hertwich, E., Lifset, R., Pauliuk, S., Heeren, N. A report of the International Resource Panel, United Nations Environment Programme, 2020
- , Completing the Picture: How the Circular Economy Tackles Climate Change, 2019
- ,
Exploring perspectives on climate-resource-nexus policies: barriers and relevance in different world regions ,J. sustain. dev. energy water environ. syst. ,pp 0 , 2021, https://doi.org/https://doi.org/10.13044/j.sdewes.d9.0408 - , Material Economics, The Circular Economy - a Powerful Force for Climate Mitigation, 2018
- ,
Assessing global resource use and greenhouse emissions to 2050, with ambitious resource efficiency and climate mitigation policies ,Journal of Cleaner Production , Vol. 144 ,pp 403–414 , 2017, https://doi.org/https://doi.org/10.1016/j.jclepro.2016.12.170 - ,
Material efficiency in clean energy transitions , 2019, IEA - ,
Material efficiency strategies to reducing greenhouse gas emissions associated with buildings, vehicles, and electronics—a review ,Environ. Res. Lett. , Vol. 14 (4),pp 43004 , 2019, https://doi.org/https://doi.org/10.1088/1748-9326/ab0fe3 - ,
Leveraging material efficiency as an energy and climate instrument for heavy industries in the EU ,Energy Policy , Vol. 120 ,pp 533–549 , 2018, https://doi.org/https://doi.org/10.1016/j.enpol.2018.05.055 - ,
Links between circular economy and climate change mitigation in the built environment ,Journal of Cleaner Production , Vol. 260 ,pp 121115 , 2020, https://doi.org/https://doi.org/10.1016/j.jclepro.2020.121115 - , Business dynamics: systems thinking and modeling for a complex world, 2000
- , Developing a quantitative model "Sustainable Germany“ – Volume 1: The D3-Model (in German), 2018
- , Critical Chain. Great Barrington, Mass., 2001
- , World Energy Outlook 2015, 2015
- , Pathways towards resource efficiency greenhouse gas neutrality (in German), 2019
- Climate Paths for Germany, https://www.bcg.com/de-de/publications/2018/climate-paths-for-germany-english, [Accessed: 22-March-2022]
- , Entwicklung eines quantitativen Modells „Nachhaltiges Deutschland“ – Band 3: Das D3 EE Modell zur Energiewende und ihren Auswirkungen auf Rohstoffinanspruchnahme und Volkswirtschaft, 2018
- , The Role of Critical Minerals in Clean Energy Transitions, 2021
- ,
Copper demand, supply, and associated energy use to 2050 ,Global Environmental Change , Vol. 39 ,pp 305–315 , 2016, https://doi.org/https://doi.org/10.1016/j.gloenvcha.2016.06.006 - ,
Buildings as a global carbon sink ,Nat Sustain , Vol. 3 (4),pp 269–276 , 2020, https://doi.org/https://doi.org/10.1038/s41893-019-0462-4 - , World agriculture: towards 2015/2030. An FAO perspective, 2003
- , Climate-resource-nexus – exploring interlinkages and policy measures for integrating climate mitigation and resource conservation: Final report of the ICARE project - Interactions between Climate Action and Resource Efficiency
- ,
Building lightweight structures with carbon‐fiber‐reinforced polymer‐reinforced ultra‐high‐performance concrete: Research approach, construction materials, and conceptual design of three building components ,Structural Concrete , Vol. 20 (2),pp 730–744 , 2019, https://doi.org/https://doi.org/10.1002/suco.201700225 - ,
Sufficiency in energy scenario studies: Taking the potential benefits of lifestyle changes into account ,Technological Forecasting and Social Change , Vol. 124 ,pp 126–134 , 2017, https://doi.org/https://doi.org/10.1016/j.techfore.2016.09.013 - , 1.5-Degree Lifestyles: Towards A Fair Consumption Space for All, 2021
- Making the grade: understanding exploration results, https://resourceworld.com/making-grade-understanding-exploration-results/, [Accessed: 22-March-2022]
- ,
Metal supply constraints for a low-carbon economy? ,Resources, Conservation and Recycling , Vol. 129 ,pp 202–208 , 2018, https://doi.org/https://doi.org/10.1016/j.resconrec.2017.10.040 - ,
Energy modeling approach to the global energy-mineral nexus: Exploring metal requirements and the well-below 2 °C target with 100 percent renewable energy ,Applied Energy , Vol. 225 ,pp 1158–1175 , 2018, https://doi.org/https://doi.org/10.1016/j.apenergy.2018.05.047 - ,
Global metal flows in the renewable energy transition: Exploring the effects of substitutes, technological mix and development ,Energy Policy , Vol. 119 ,pp 226–241 , 2018, https://doi.org/https://doi.org/10.1016/j.enpol.2018.04.056 - ,
Contemporary Resource Policy and Decoupling Trends—Lessons Learnt from Integrated Model-Based Assessments ,Sustainability , Vol. 10 (6),pp 1858 , 2018, https://doi.org/https://doi.org/10.3390/su10061858 - ,
Evaluating Barriers, Enablers and Opportunities for Closing the Loop through 'Waste Upcycling': A Systematic Literature Review ,J. sustain. dev. energy water environ. syst. , Vol. 10 (1),pp 1–20 , 2022, https://doi.org/https://doi.org/10.13044/j.sdewes.d8.0367 - ,
Climate change mitigation efficiency of electric vehicle charging infrastructure in China: From the perspective of energy transition and circular economy ,Resources, Conservation and Recycling , Vol. 179 ,pp 106048 , 2022, https://doi.org/https://doi.org/10.1016/j.resconrec.2021.106048 - ,
A review of Africa's transition from fossil fuels to renewable energy using circular economy principles ,Renewable and Sustainable Energy Reviews , Vol. 137 ,pp 110609 , 2021, https://doi.org/https://doi.org/10.1016/j.rser.2020.110609 - ,
Circular economy for clean energy transitions: A new opportunity under the COVID-19 pandemic ,Applied Energy , Vol. 289 ,pp 116666 , 2021, https://doi.org/https://doi.org/10.1016/j.apenergy.2021.116666 - ,
Energy-Cement-Carbon Emission Nexus and its Implications for Future Urbanisation in China ,J. sustain. dev. energy water environ. syst. , Vol. 9 (2),pp 1–15 , 2021, https://doi.org/https://doi.org/10.13044/j.sdewes.d8.0354 - ,
Raw material depletion and scenario assessment in European Union – A circular economy approach ,Energy Reports , Vol. 6 ,pp 417–422 , 2020, https://doi.org/https://doi.org/10.1016/j.egyr.2019.08.082 - ,
Bolstering supplies of critical raw materials for low-carbon technologies through circular economy strategies ,Energy Research & Social Science , Vol. 88 ,pp 102534 , 2022, https://doi.org/https://doi.org/10.1016/j.erss.2022.102534 - ,
Critical raw materials for the energy transition ,European Economic Review , Vol. 141 ,pp 103991 , 2022, https://doi.org/https://doi.org/10.1016/j.euroecorev.2021.103991 - ,
Aluminium for the future: Modelling the global production, market supply, demand, price and long term development of the global reserves ,Resources, Conservation and Recycling , Vol. 103 ,pp 139–154 , 2015, https://doi.org/https://doi.org/10.1016/j.resconrec.2015.06.008 - ,
Environmental Impact of Solar and Wind energy- A Review ,J. sustain. dev. energy water environ. syst. , Vol. 10 (2),pp 1–23 , 2022, https://doi.org/https://doi.org/10.13044/j.sdewes.d9.0387 - ,
Comparing the impacts of fossil and renewable energy investments in Indonesia: A simple general equilibrium analysis ,Heliyon , Vol. 6 (6),pp e04120 , 2020, https://doi.org/https://doi.org/10.1016/j.heliyon.2020.e04120 - ,
A critical review on environmental impacts of renewable energy systems and mitigation strategies: Wind, hydro, biomass and geothermal ,The Science of the total environment , Vol. 766 ,pp 144505 , 2021, https://doi.org/https://doi.org/10.1016/j.scitotenv.2020.144505 - ,
Electricity market impacts of low-carbon energy transition in the Nordic-Baltic region ,J. sustain. dev. energy water environ. syst. ,pp 0 , 2021, https://doi.org/https://doi.org/10.13044/j.sdewes.d9.0407 - ,
Model and application of renewable energy accommodation capacity calculation considering utilisation level of inter-provincial tie-line ,Prot Control Mod Power Syst , Vol. 4 (1), 2019, https://doi.org/https://doi.org/10.1186/s41601-019-0115-7 - ,
Getting more with less? Why repowering onshore wind farms does not always lead to more wind power generation – A German case study ,Renewable Energy , Vol. 180 ,pp 245–257 , 2021, https://doi.org/https://doi.org/10.1016/j.renene.2021.08.056 - ,
Global Carbon Budget 2017 ,Earth Syst. Sci. Data , Vol. 10 (1),pp 405–448 , 2018, https://doi.org/https://doi.org/10.5194/essd-10-405-2018 - , Global Warming of 1.5°C. An IPCC Special Report on the impacts of global warming of 1.5°C above pre-industrial levels and related global greenhouse gas emission pathways, in the context of strengthening the global response to the threat of climate change, sustainable development, and efforts to eradicate poverty, 2018
- , Atmospheric greenhouse gas concentrations
- ,
Trends in Atmospheric Carbon Dioxide , https://gml.noaa.gov/ccgg/trends/, GML, [Accessed: 22-March-2022] - ,
Life-LCA: assessing the environmental impacts of a human being—challenges and perspectives ,Int J Life Cycle Assess , Vol. 25 (1),pp 141–156 , 2020, https://doi.org/https://doi.org/10.1007/s11367-019-01645-3 - ,
Key drivers for unsustainable resource use – categories, effects and policy pointers ,Journal of Cleaner Production , Vol. 132 ,pp 13–31 , 2016, https://doi.org/https://doi.org/10.1016/j.jclepro.2015.02.038 - , Lifestyles, Well-Being and Energy, Global Energy Assessment (GEA), 2012
- ,
Scientists' warning on affluence ,Nature communications , Vol. 11 (1),pp 3107 , 2020, https://doi.org/https://doi.org/10.1038/s41467-020-16941-y - ,
Achievability of the Paris targets in the EU—the role of demand-side-driven mitigation in different types of scenarios ,Energy Efficiency , Vol. 12 (2),pp 403–421 , 2019, https://doi.org/https://doi.org/10.1007/s12053-018-9670-4 - ,
New Conceptions of Sufficient Home Size in High-Income Countries: Are We Approaching a Sustainable Consumption Transition? ,Housing, Theory and Society , Vol. 38 (2),pp 173–203 , 2021, https://doi.org/https://doi.org/10.1080/14036096.2020.1722218 - ,
Energy sufficiency through social innovation in housing ,Energy Policy , Vol. 126 ,pp 287–294 , 2019, https://doi.org/https://doi.org/10.1016/j.enpol.2018.11.026 - ,
A safe and just space for humanity: Can we live within the doughnut? ,Oxfam , 2012, https://doi.org/https://doi.org/10.5822/978-1-61091-458-1_3