


Among the many different biomass materials suitable for bioethanol and biohydrogen production, wastepaper represents the highest ratio of residues in the United States and the second highest in the European Union [1] and is particularly interesting. The main types of paper in municipal solid waste are as follows: 20–25% paperboard, 10–20% newspaper, 8–12% office paper, 5–10% books and magazines and 6–8% paper tissue [2]. Each year in the United Kingdom, around 4.75 Mt of paper and cardboard waste are produced with a recovery/recycling rate of 79% [3], presenting a massive opportunity for energy recovery through hydrogen generation. Thus, this paper will focus mainly on wastepaper and cardboard feedstock for bioethanol production.
Wastepaper falls under the category of lignocellulose biomass (LCB), the most abundant biomass resource on earth, and widely considered a potential feedstock for biofuels production mainly composed of three polymers: cellulose, hemicellulose and lignin, besides ash and extractives [4], [5]. Cellulose consists of glucose and cellobiose as the basic coupling unit and is the most abundant polymer in LCB [4]. Hemicellulose is the second main polymer in LCB and is a short and highly branched polymer of pentoses, hexoses and uronic acids [4]. Finally, lignin, a large and complex molecular structure containing crosslinked aromatic polymers of phenolic monomers, is disadvantageous due to its biodegradation resistance [6].
Due to the varied nature of paper's chemical and mechanical treatments during its production, wastepaper is not a homogeneous matter. As such, wastepaper is composed of many different types of paper with different chemical contents of cellulose, hemicellulose and lignin in its composition [7]. The cellulosic-derived fuel production process consists of four major steps: biomass preparation, pretreatment, hydrolysis, and fermentation [8]. Physicochemical pretreatment is the most common and could be performed under various conditions, such as acid, alkaline, and heat treatments [9]. The selection of the method affects the cost and performance in the subsequent cellulose hydrolysis stage [10]. The pretreatment step is one of the most cost-prohibitive and rate- and yield-limiting steps [11].
From the different methods of producing bioethanol, two common processes are: 1) reducing polymers into monomers (reducing sugars) for easy access to cellulose, 2) fermentation with the help of yeast feeding on the cellulose acquired, to bioethanol (biofuel). At the end of fermentation, the alcohol solution is purified by distillation, which helps achieve pure bioethanol by separating different alcohol solutions [12]. This bioethanol can be used in place of fossil fuels, resulting in improved engine efficiency and reduced greenhouse gas emissions [13]. Furthermore, this biofuel can be used as a primary fuel or additive to enhance gasoline for transportation and as fuel and feedstock in chemical syntheses, such as hydrogen production through catalytic steam reforming [14]. The main challenge in bioethanol production is the cost of production from the lignocellulosic feedstock. Consequently, improving production processes is a key factor in reducing costly operating conditions and developing and commercializing bioethanol [14].
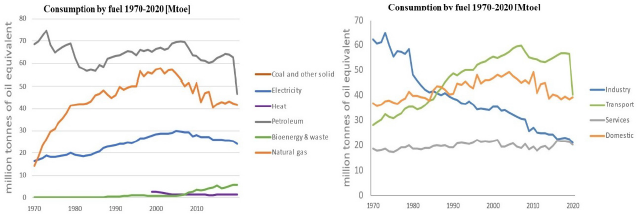
Countries that rely heavily on crops (food sources) are finding that food availability is reducing due to the rising demand for its use for bioenergy production. The annual biofuel demand from the transport industry is rising significantly, as shown in [Figure 1]. Using crops such as corn, maize and sugarcane for feedstock in biofuel production has increased dramatically and competes with the food industry. It has led to higher food costs due to increasing pressure on global agricultural markets [15], and it also results in significantly higher costs for bioethanol production through 1st generation processes [14]. Consequently, alternative feedstocks are being explored and adapted in large-scale production processes for 2nd generation of bioethanol production from waste that has lignocellulosic materials, such as wastepaper, agricultural waste, or sewage. These materials characteristically do not generate food sustainability challenges and do not require substantial areas of land [16]. Second-generation bioethanol production is important for all geographical locations, urban or rural. It is significant for food and energy security, environmental impact, land occupation and cost-effective agricultural development [17].
Bioethanol production from lignocellulosic materials requires opening bundles of lignocelluloses to access the cellulose and hemicellulose polymer chains. This ‘de-chaining’ is achieved through pretreatment. Secondly, the polymers need to be hydrolysed to achieve monomer sugar solutions and, thirdly, sugars need to be fermented to an ethanol solution (mash) by microorganisms. Finally, ethanol needs to be purified and extracted from the mixture (mash) by distillation and dehydration. For a large-scale plant, enzyme production, transportation, steam and electricity generation, cooling and heating are necessary units in bioethanol production from lignocellulosic materials [19].
Bioethanol consumption by sector and fuel between the years 1970 and 2020 [18]
Acid hydrolysis is considered the most feasible for scalable production and the most viable method of bioethanol production for industrial-scale production [20]. Additionally, it produces a higher sugar yield and has good reproducibility compared with other bioethanol production processes [21]. However, degradation substances such as furfural are formed from the breakdown of monosaccharides, which can make the extraction very expensive in equipment and maintenance. Therefore, parameters affecting this, such as pH, residence time, acid and reaction temperature, should be analysed carefully [21]. The acid used in experiments can be dilute or concentrated. Both acid concentrations result in apparatus corrosion. It leads to high equipment costs and, therefore, increasing method/process costs, which limits the wide applicability of this technique.
Concerning energy consumption, enzymatic hydrolysis is quite efficient. It can be carried out at low temperatures to refrain from denaturing the enzymes used and preventing oxidation [22]. However, the cost of complex enzymes makes this process uneconomic and, as a result, not widely commercialised as a method of hydrolysis [22].
Considerably complex but effective software is currently used to calculate energy consumption in bioethanol production processes. However, this type of software is generally very expensive or comes with limited access unless bought as a whole. Therefore, the simplified model presented here provides an overview of the energy expenditure in bioethanol production processes.
This section elaborates on the methods used in this research. The theoretical basis behind the calculations employed in this simplified model is presented first. Then, the model function is described. Finally, the design specifications of the experiments are determined and explained.
On every value chain level, the mass balance technique permits mixing batches of sustainable and non-sustainable products [23]. Physical mixing causes the mixture to lose its unique characteristics. The mass balance calculation must be calculated and monitored throughout time [23]:
(1)
There are several calculation options available:
For a process that uses total mass, with no input, or non-reactive species (hence no temperature change), Generation = 0; Consumption = 0
For steady state operation, Accumulation = 0; the mass balance equation then balances out to: Input = Output.
Equations (2) and (3) show the molar enthalpy and heat balance (where Q is the rate of heat transfer [kJ/s] and ṁ is the molar flowrate [kmol/s]), respectively, for the components in this process. [Table 1] describes the parameters and their corresponding units.
(2)
(3)
By carrying out the mass balance, the mass flow rate will be determined and then used for the energy balance. The energy balance will indicate how much energy [kW] is consumed or released during each reaction. Once the chemical energy consumption has been calculated, it is added to the electrical energy consumption of each process. The processes heavily dependent on the residence time and temperature are the focus. These processes have conditions acquired from electrical equipment, for example, the temperature requirement of 120°C for 0.167 hours, achieved by a 3-kW oven in a lab-based experiment. Apart from behaving as a control volume for the chemical reactions, this oven requires electrical power input. As a result, the overall energy consumption will represent the chemical and electrical energy consumption [23], [24].
Parameters used in Equations (2) and (3) with corresponding units [23], [24]
| Term | Form | Unit |
| Molar enthalpy | h | [kJ/kmol] |
| Enthalpy of formation (reactions) | [kJ/kmol] | |
| Latent heat (phase change) | [kJ/kmol] | |
| Sensible heat transfer | [kJ/kmol] |
The energy consumption can be obtained from the build-up of a mathematical model using MATLAB App Designer, with pre-inputted principal equations, thus avoiding laboratory experiments. The model allows users to interact by changing experimental parameters according to their requirements. Recommended parameters will already have been programmed into the model, with graphical representations comparing energy consumption between the two processes: acid and enzymatic hydrolysis. An explanation of the energy balance of the specific processes follows. These are mainly: acid hydrolysis of cellulose, neutralization, and fermentation energy balances. Finally, the electrical energy consumption calculation is described.
Equations (2) and (3) are used for the energy balance calculations [24]. Heat formation is independent of each reaction; therefore, some terms may not be needed in energy consumption for a process, depending on conditions and consequential products. In the following equations, ṁ refers to molar flowrate [kmol/s].
The reaction occurs in an oven that can be considered as a control volume [24]. The inlet temperature (before the reaction starts) equals the atmospheric temperature at approximately 298 K (25 °C). The outlet temperature is the temperature at which the process takes place, which is 393 K (120 °C). Hydrolysis operates at atmospheric pressure, and all components enter a liquid phase. 100% of the water is vaporised, and all other components (cellulose and sulphuric acid) remain in a liquid phase at the outlet. The boiling points of these components exceed 393 K, so latent reaction and sensible heat are involved [18], [24].
The acid catalyst used in hydrolysis is not consumed during the reaction, and no phase changes occur. Therefore, and equal 0 kJ/kmol.
(4)
where: , therefore ; ṁ − molar flowrate [kmol/s]; T − outlet temperature; .
The water vapour leaves by escaping the oven as steam. This stream, however, is not a reactant and is not used at all, therefore . Enthalpy of vaporisation at the reference temperature is used alongside the sensible heat equation [24]:
(5)
where: [kJ/kmol] is equal to the specific latent heat of water vapour at 298 K, multiplied by the molecular mass (43995.12 kJ/kmol).
The total energy requirement can be calculated using Equation (3). Overall, the energy demand of the chemical reactor is -0.934 kW. The negative Q value denotes that the reactor (oven) is a sink; energy must be removed from the system [24].
The reactants entering the inlet of the reactor are at 298 K, and products leave at 298 K, assuming isothermal operation [24]. No sensible heat or phase changes occur, i.e., and equal 0; however, as the neutralisation reaction generates heat that must be removed, must be considered during the calculations. Overall, the heat Q of the chemical reactor is -0.014 kWh.
The reactants enter at 298 K and are heated to 303 K, where isothermal operation occurs. It is assumed that aerobic fermentation occurs, and the bacteria's metabolic processes are also fully aerobic. The reaction heat can be assumed to be directly proportional to the amount of oxygen consumed by the bacteria during metabolic activities; one mole of oxygen produces 460 kJ/kmol of heat [25]. Furthermore, to support this assumption, a study on metabolic heat produced by industrial bioreactors found that 444 kJ/kmol of heat was produced by biomass [26]. This value is based on the fermentation of cassava, which is currently the most predominant method of producing 1st generation bioethanol. For these calculations, intricate details such as bacteria growth and activity have been taken from the literature looking into 1st generation bioethanol production. The flow rate of oxygen [mol/s] supplied to the oven will be used to calculate the reaction heat [27]:
(6)
where: , [23].
One must supply the latent heat to the reactants to reach the operating temperature. The assumption is that this will be achieved using the previously calculated metabolic reaction heat equal to -1.55 – 10-4 kW. Finally, the overall heat transfer due to chemical reactions in the oven is -1.89 – 10-2 kW. The negative sign denotes that energy must be removed from the system, making it a ‘sink’.
The electrical energy consumption can be obtained after determining the power input and residence time using Eqs. (7) and (8) [18], [24]:
(7)
(8)
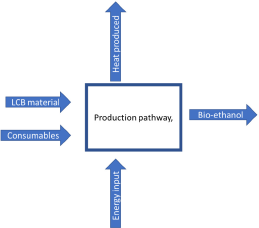
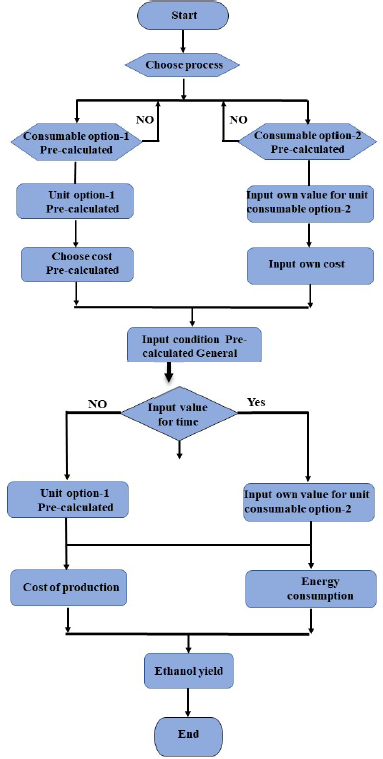
Simulating the outputs of the system represented by the schematic diagram in [Figure 2] requires performing the systematic steps shown in [Figure 3]. The diamond shape denotes the criteria that require decision making. These consist of the changing parameters in the mathematical model where, for example, a user will have the choice between the ‘pre-calculated consumable’ of blended paper and physical pretreatment of paper using a milling disc.
Schematic diagram representing the system modelled
The users will also have the choice to input their own method of physical pretreatment. The flexibility of this model is what allows multiple takes of experiments to happen. After the consumables have been chosen or manually inputted, the unit of each consumable needs to be chosen. The recommended unit has been ‘pre-set’ in the model, but the users can choose their preferred units. The users will then need to select the cost [24]. Once again, they will have the option to select the pre-calculated values or input their own values.
Although the conditions for each stage have been established, their use is not compulsory, for example, constant stirring during pretreatment while heating the paper sludge with a water bath. The model's flexibility allows the user to choose or specify different conditions [24]. The time scale for each process has been given as pre-calculated recommended values; however, the user can change this variable once again. Furthermore, the rated power of the electrical appliances is pre-calculated. Once all the required inputs have been selected/changed, the model calculates bioethanol yield, power consumption and energy consumption of the process.
Computer flow diagram of the model
The desired product is bioethanol, and the processing capacity is determined for maximum production of pure bioethanol. The following assumptions are specified for the experiment design used in this paper:
100% calcium sulphate & water produced in oven 2 is filtered out.
All physical pretreatment units operate under ambient conditions of 20−25 °C and 1 atm.
100% of fibres removed in oven 1.
100% lipids, proteins and ash removed in filtration and pretreatment.
100% water heated in chemical reactor 1 is in the vapour phase at 120°C.
This section presents the results of comparing acid hydrolysis and enzymatic hydrolysis pathways for bioethanol production. These results include energy consumption and cost expenditure. Outputs from this simplified model are also presented to exemplify the user interface. [Table 2] shows the total cost of each process in acid and enzymatic hydrolysis. These values were obtained using the methods described in the previous section. Enzymatic hydrolysis cost expenditure was significantly overwhelming compared to acid hydrolysis due to the complex mixture of enzymes required for sugar fermentation: Cellulase 5A from Bacillus subtilis. This enzyme cost was nearly the cost of the whole acid hydrolysis process. The negative chemical energy consumption values imply that heat must be removed from the process to keep the chemical reactions as natural as possible.
Energy consumption and cost of acid and enzymatic hydrolysis methods per 100 g of lignocellulosic biomass
| Energy expenditure | Cost [£] | ||||
| Chemical [kW] | Electrical [kWh] | Appliance Usage | Consumables | Total | |
| Acid Hydrolysis Pathway | |||||
| Pretreatment | 0.00 | 0.00 | 0.00 | 54.75 | 54.75 |
| Hydrolysis | -0.91 | 0.22 | 0.04 | 56.76 | 56.79 |
| Neutralisation | -0.01 | 0.00 | 0.00 | 54.52 | 54.52 |
| Fermentation | -0.00 | 93.60 | 15.91 | 18.00 | 33.91 |
| Bacterial Activity | -0.02 | 0.00 | 0.00 | 0.00 | 0.00 |
| Distillation | 0.00 | 1.80 | 0.31 | 184.04 | 184.35 |
| Total | -0.95 | 95.62 | 16.25 | 368.07 | 384.32 |
| Enzymatic Hydrolysis Pathway | |||||
| Pretreatment | 0.00 | 0.00 | 0.00 | 228.82 | 228.82 |
| Hydrolysis | 0.00 | 93.60 | 15.91 | 451.75 | 467.66 |
| Neutralisation | 0.00 | 0.00 | 0.00 | 0.00 | 0.00 |
| Fermentation | 0.00 | 46.80 | 7.96 | 18.00 | 25.96 |
| Distillation | 0.00 | 1.80 | 0.31 | 184.08 | 184.39 |
| Total | 142.20 | 24.17 | 882.65 | 906.82 | |
The chemical reactions all occur in a reactor (oven), a closed volume. If the heat is not removed, this may lead to structural damage to microorganisms. However, considering this small-scale experiment in which the produced heat amount was small, no consumables were added to vent off the heat or even capture it. The reason for the model is to adopt the findings for large-scale bioethanol production; thus, this heat can be recycled back into the process to aid the reaction activity, making it a combined heat and power (CHP). The highest energy expenditure in acid hydrolysis was for the hydrolysis process, -0.0915 kW, with neutralisation being the second highest chemical energy-consuming process, -0.0140 kW. As expected, fermentation had the least heat release in the chemical reaction and, therefore, the least chemical energy consumption, having released only-1.82 – 10-2 kW because the mass of the bacteria used for sugar fermentation is negligible. The cost for electrical consumption for a small-scale experiment for acid hydrolysis is £16.25. The rate of heat transfer from the chemical energy is approximately 1 kW. However, changing parameters such as inlet temperature and time of each process, the energy consumption, i.e., cost and rate of heat transfer, both change.
Enzymatic hydrolysis experimental financial expenditure was extremely high due to the cost of the complex enzymes. Even considering only the energy consumption cost, enzymatic hydrolysis is still more expensive than acid hydrolysis due to the extra electricity required, thanks to the fermentation step. Overall, the model in App Designer is an easy and interactive tool, allowing users to calculate the bioethanol yield and energy consumption for a small-scale experiment. The pre-defined calculations programmed into the software disregard any possibilities for human errors, help guide experimentation and decide on the adequate pathway so that optimal parameters can be further concluded through the software by allowing runs/trials to be conducted. Furthermore, it helps indicate where process efficiencies can be improved, and their costs reduced.
Overall, the model in App Designer is an easy and interactive tool, allowing users to calculate the bioethanol yield and energy consumption for a small-scale experiment. This model was used to compare acid and enzymatic hydrolysis under similar conditions. The main conclusions from this research were:
Acid hydrolysis uses 67% of the energy and electricity consumption to produce bioethanol than enzymatic hydrolysis.
Enzymatic hydrolysis is almost 50% more expensive in terms of appliance usage cost due to the fermentation step.
The consumables needed for enzymatic hydrolysis are almost 2.4 times more costly than those for acid hydrolysis due to the expensive and complex enzymes required.
This model helps the operator understand where to improve the process pathways to reduce cost or energy usage, choose pathways, and guide experimentation.
The study was funded by the UKIERI project (Grant Number: DST-UKIERI 18-19-04): Waste to Energy - Low Temperature Combustion of Sustainable Green Fuels. The authors acknowledge the financial support of Programa de Recursos Humanos da Agência Nacional do Petróleo, Gás Natural e Biocombustíveis – PRH-ANP.
- ,
Valorisation of wastepaper using the fibrolytic/hydrogen producing bacterium Ruminococcus albus, Bioresource Technology , Vol. 100 ,pp 5928–5933 , 2009, https://doi.org/https://doi.org/10.1016/j.biortech.2009.06.019 - , Integrated Solid [Waste Management ‘, 1993
- ,
Defra & Government Statistical Service, UK statistics on waste -February 2019 update, Governmental Statistical Service ,pp 1–10 , 2016 - ,
Dark fermentative biohydrogen production from lignocellulosic biomass: Technological challenges and future prospects ,Renewable and Sustainable Energy Reviews , Vol. 117 , 2020, https://doi.org/https://doi.org/10.1016/j.rser.2019.109484 - ,
Recent insights into consolidated bioprocessing for lignocellulosic biohydrogen production, International Journal of Hydrogen Energy ,44 ,pp 14362–14379 , 2019, https://doi.org/https://doi.org/10.1016/j.ijhydene.2019.03.066 - ,
Hydrogen production from biomass using dark fermentation ,Renewable and Sustainable Energy Reviews , 2018, https://doi.org/https://doi.org/10.1016/j.rser.2018.04.043 - ,
Valorisation of wastepaper using the fibrolytic/hydrogen producing bacterium Ruminococcus albus, Bioresource Technology , Vol. 100 ,pp 5928–5933 , 2009, https://doi.org/https://doi.org/10.1016/j.biortech.2009.06.019 - ,
Cellulose solvent-based pretreatment for enhanced second-generation biofuel production: A review ,Royal Society of Chemistry , 2019, https://doi.org/https://doi.org/10.1039/c8se00287h - ,
Additional paper waste in pulping sludge for biohydrogen production by heat-shocked sludge ,Applied Biochemistry and Biotechnology , Vol. 166 ,pp 389–401 , 2012, https://doi.org/https://doi.org/10.1007/s12010-011-9434-5 - ,
Ethanol from lignocellulosic biomass: techno-economic performance in short-, middle-and long-term, Biomass and Bioenergy , Vol. 28 ,pp 384–410 , 2005 - ,
Cellulose solvent-based pretreatment for enhanced second-generation biofuel production: A review ,Royal Society of Chemistry , 2019, https://doi.org/https://doi.org/10.1039/c8se00287h - ,
Optimal fed-batch bioreactor operating strategies for the microbial production of lignocellulosic bioethanol and exploration of their economic implications: A step forward towards sustainability and commercialization ,Journal of Cleaner Production , Vol. 295 , 2021, https://doi.org/https://doi.org/10.1016/j.jclepro.2021.126384 - ,
Analysis of performance parameters of an ethanol fueled spark ignition engine operating with hydrogen enrichment ,International Journal of Hydrogen Energy , Vol. 45 ,pp 5588–5606 , 2020, https://doi.org/https://doi.org/10.1016/j.ijhydene.2019.05.151 - ,
Hydrolysis of lignocellulosic materials for ethanol production: A review ,Bioresource Technology , Vol. 83 , 2002, https://doi.org/https://doi.org/10.1016/S0960-8524(01)00212-7 - ,
Renewable biohydrogen production from lignocellulosic biomass using fermentation and integration of systems with other energy generation technologies ,Science of the Total Environment , Vol. 765 , 2021, https://doi.org/https://doi.org/10.1016/j.scitotenv.2020.144429 - ,
Different pretreatment technologies of lignocellulosic biomass for bioethanol production: An overview ,Energy , Vol. 199 , 2020, https://doi.org/https://doi.org/10.1016/j.energy.2020.117457 - ,
E.& I.S. Department for Business, Energy consumption in the UK 2020 - GOV.UK ,Energy Consumption in the UK (ECUK) 2020 , 2020https://www.gov.uk/government/statistics/energy-consumption-in-the-uk-2020 - ,
Pretreatment and fermentation of lignocellulosic biomass: Reaction mechanisms and process engineering ,Reaction Chemistry and Engineering , Vol. 5 , 2020, https://doi.org/https://doi.org/10.1039/d0re00241k - ,
Oligocellulose from acid hydrolysis: A revisit ,Applied Surface Science , Vol. 537 ,pp 147783 , 2021, https://doi.org/https://doi.org/10.1016/J.APSUSC.2020.147783 - ,
Lignocellulose biorefinery engineering, in: Lignocellulose Biorefinery Engineering , 2015, https://doi.org/https://doi.org/10.1016/b978-0-08-100135-6.00001-6 - ,
Cell wall disruption: A critical upstream process for biofuel production, in: Advances in Feedstock Conversion Technologies for Alternative Fuels and Bioproducts: New Technologies ,Challenges and Opportunities , 2019, https://doi.org/https://doi.org/10.1016/B978-0-12-817937-6.00002-3 - ,
International Sustainability & Carbon Certification, The Mass Balance Approach › ISCC System ,The Mass Balance Approach , https://www.iscc-system.org/about/circular-economy/mass-balance-approach/ - ,
Thermodynamics , 1993, https://doi.org/https://doi.org/10.1007/978-1-349-12466-4_1 - ,
From wastes to functions: A paper mill sludge-based calcium-containing porous biochar adsorbent for phosphorus removal ,Journal of Colloid and Interface Science , Vol. 593 , 2021, https://doi.org/https://doi.org/10.1016/j.jcis.2021.02.118 - ,
Bioprocess engineering principles: Second edition , 2012, https://doi.org/https://doi.org/10.1016/B978-0-12-220851-5.00014-9 - ,
Measurement of metabolic heat in a production-scale bioreactor by continuous and dynamic calorimetry ,Chemical Engineering Communications , Vol. 190 , 2003, https://doi.org/https://doi.org/10.1080/00986440302130 - ,
Novel technique for micronisation of waste paper and implication for bioethanol production ,Nigerian Journal of Engineering , Vol. 24 ,pp 73–80 , 2017https://nje.abu.edu.ng/journals/articles/2017.html#september