


Contemporary growing cities cores of global urbanization continue to concentrate huge resources, both material and non-material, within their borders. More than half of the world's population are presently living in cities, with expectations to reach two-thirds by 2050 [1]. Occupying only 3% of the total area of the globe, cities are the centers for almost 80% of the world's gross product. Global population growth and rising level of consumption have driven the demand for material resources and resulted in fundamental changes in the global socioeconomic metabolism [2]: today cities are also global catalysts for 50% of solid waste and 60 to 80% of greenhouse gas emissions. Urban development is a fundamental change in the structure of human settlements which entails a significant transformation of the environment. Due to key role of cities in the modern world, the problem of their sustainable development is becoming more urgent year to year.
Following the discourse about sustainable development based on the Brundtland Commission's report and the processes in the UN Committee on Environment and Development, a sustainable urban development requires an ambitious policy to limit energy consumption, reduce pollution and protect natural areas to create a comfortable living environment [3]. However, continuous growth of the residential areas in major cities of the world makes it increasingly difficult to bring urban development into an environmentally sustainable framework that is fair in a global perspective.
Increasing aggravation of resource consumption issues in growing cities determined the raising attention to the concept of urban metabolism, which contributes to the development and application of quantitative approaches to assessing urban resource flows [4]. There is a vast growing empirical literature on the resources consumption and economic growth nexus as well as its social and environmental consequences. This includes the methodical basics of benchmarking procedure in a frame of the Sustainable Development of Energy, Water and Environment Systems (SDEWES) Index application [5] and some others, such as a multi-layered indicator set for urban metabolism in megacities, designed for gathering information on its biophysical characteristics and metabolic flows [6]. Large number of papers are also focusing on a wide range of specific aspects of the complex relationship between social and economical activities and sustainability in the cities, such as environmental and social effects of the differentiated carbon tax on production and emissions reduction decisions [7], assessment of potential benefits from investment in renewable energy supply facilities [8], the impact of the new Ambient Air Quality Standards implementation on urban air quality's characteristics [9], consumption choices and per capita carbon dioxide emissions of the different categories of household consumption [10] or city's planning structure and green spaces and their role in urban management [11], [12], etc.
Benchmarking cities across aspects that relate to the sustainable development of energy, water and environment systems requires an integrated approach. As a comprehensive literature overview given in [13] shows, composite indicators that can capture multiple aspects are a useful tool in this respect. However, the literature largely provides examples of benchmarking cities in only one aspect without the use of composite indicators or with a limited scope and/or to a limited sample. This is demonstrated by examples of paramount importance for energy as the complex system for sustainability evaluation [14], increasing importance of assessing an efficiency of the waste collection process [15] or significant economical, social and environmental impacts of transportation as an important dimension of urban sustainability [16].
The task that contributes to solving the problem is to implement resource-efficient initiatives through integrated urban planning. The idea that the urban environment works as metabolic systems has led to a rethinking of how environmental, economic and social factors interact in the urban environment. Currently, the most commonly used definition of urban metabolism is that of C. Kennedy and his colleagues [6]: "the sum total of the technical and socio-economic processes that occur in cities, resulting in growth, production of energy and elimination of waste". Moreover, formal definitions include not only the flows of natural, industrial and urban materials and energy, but also the flows of people and information. Urban metabolism is also framing by political context, affecting the country's commitment to implement the theory into the practice. In this regard, the concept of urban metabolism can be considered as an approach to assess how sustainable is urban development.
The urban metabolism concept (UMC) is not new for the post-Soviet space: a lot of scientific works on the resource intensity of regions and economy sectors, which have much in common with the theory of urban metabolism, are well-known in Russia and CIS countries. The resource intensity concept and its particular indications (carbon intensity, for example) are closely related to the concept of energy efficiency [17], [18]. The energy component as the basic for all capacity indicators can be put forward to match the natural and industrial potentials of the territory. The interpretation of a city phenomenon within the UMC framework varies depending on the central metaphor: the city as an organism or ecosystem. As a comprehensive literature overview given in [13] shows, composite indicators that can capture multiple aspects, contribute to considering a city as an ecosystem. However, most approaches to the integral assessment of interacting flows and reserves do not take into account all the diversity of indicators. Another problem is that direct methods are not suitable to make an accurate quantitative assessment of the trajectory and state of the flow of some components. For example, urban green areas could be measured in terms of area and number of trees [19], but its role in public welfare requires accounting social effects, including not only the intensity of greenhouse gas absorption, but also the satisfaction of recreational needs, aesthetic value and accessibility, especially under modern pandemic restrictions [20].
A very difficult task is to assess the role of urban water bodies in meeting the residents' needs in water functions to maintain the microclimate and the hydrological regime of the territory [21], [22]. In addition, ecosystems are subject to constant changes even without human activity, and the linkage between ecosystem evolution and urban activity is rather uncertain. Moreover, the problems associated with climate change and social inequality are essentially urban in character, that's why ideas of green development are including into researches to be supported by managers and politicians at all levels from municipal to regional and global one [23]. Thus, the development of UMC with attention to three dimensions (social, economic and ecological) is an important step towards a comprehensive assessment of sustainable development.
The composite indicator developed by S. Kılkıs [5] provides an integrated approach to benchmark the sustainable development of energy, water and environment systems in cities. In a number of works, the index was used to compare different cities on their way to sustainable development: prospects for the transition to sustainable development through the achievement of CO2 reduction goals were analyzed using the index on the example of Rio de Janeiro in [13]. The SDEWES index was applied to port cities in the Mediterranean basin [24] metropolitan and/or the most densely populated cities in the Southeast Europe region [5], and some other cities selections around the world [25], [26], [27]. The researches revealed that today the majority of urban areas are still to be mobilized for the vital race to reach CO2 neutrality [28], [29]. One of such cities is Nur-Sultan and is aiming to comply with the commitments of the Republic of Kazakhstan to the UNFCCC in a frame of Nationally Determined Contributions. Achieving such a goal meets global trends, but is fraught with particular difficulties, since it must be combined with a set of 6 priority goals of Kazakhstan listed in the National Survey 2019 [30]. The SDG Goal 8 (Decent Work and Economic Growth) is considered as one of the priorities in this Survey and emphasizes the need to find a balance between economic development and reducing its impact on urban environment in the context of urban metabolism concept.
The method of the Sustainable Development of Energy, Water and Environment Systems (SDEWES) index calculating [31] was used as the basis for a comprehensive assessment of the resource intensity of large cities in this work. The approach allows to compare the level of compliance of the city with the general development trends of the cities in the world, as well as to compare individual characteristics with other cities. In this paper, Nur-Sultan was compared with 21 other major cities, which were selected in accordance to the methodology [32] and data availability. The paper considers cities of various status (not only metropolitan), subject to the only condition for the sample the population of more than 300 thousand people, which would classify the city as large one. The development of Nur-Sultan city the new capital of the Republic of Kazakhstan with population exceeding 1 million – was evaluated by using the SDEWES Index to compare its positions with a set of cities, rated in a number of works on world cities sustainable development [26], [32]. The application of the index can be considered as a suitable methodical approach to highlight the most pressing problems on the path to sustainable development.
The SDEWES Index benchmarks cities based on 7 dimensions, and encourages a multi-disciplinary approach to the issues and challenges of sustainable development [31]. Due to the integral character of SDEWES Index and the fact that each of its dimensions includes indicators with different units of measurement, all of them contain the normalized values of 5 main indicators which are aggregated into an index value. The first three dimensions cover the energy sector, namely Energy Usage and Climate (D1), Penetration of Energy and CO2 Saving Measures (D2) and Renewable Energy Potential and Utilization (D3). The other four dimensions consist of indicators that characterize the environmental situation in cities and the factors that ensure it: Water Usage and Environmental Quality (D4), Emissions and Industrial Profile (D5), Urban Planning and Social Welfare (D6), and R&D, Innovation and Sustainability Policy (D7) (Table 1). Cities with well-rounded and above average performances in multiple dimensions score higher in the SDEWES Index and take place in higher quartiles of the sample.
SDEWES Index Dimensions and Indicators
| Dimensions | |||||||
|---|---|---|---|---|---|---|---|
| D1: Energy Consumption and Climate | D2: Penetration of Energy and CO2-Saving Measures* | D3: Renewable Energy Potential and Utilization | D4: Water and Environmental Quality | D5: CO2 Emissions and Industrial Profile | D6: City Planning and Social Welfare | D7: R&D, Innovation and Sustainability Policy* | |
| INDICATORS | Energy consumption of buildings (MWh) |
Sustainable Energy Action Plan (SEAP)* | Solar energy potential (Wh/m2/ day) | Total domestic water consumption (m3) | CO2 emission of buildings (t CO2) | Accessibility of public transport* | R&D and innovation policy orientation* |
| Energy consumption of transport (MWh) | Combined heat and electricity systems* | Wind energy potential (m/s) | Water quality index* | CO2 emission of transport (t CO2) | Urban form and protected sites* | National patents in clean technologies* | |
| Total energy consumption per capita (MWh/capita) | Energy savings in end-usage (buildings)* | Geothermal energy potential (mW/m2) | Annual PM10 concentration (µg/m3) | Average CO2 intensity (t CO2/ MWh) | GDP per capita (PPP$) | Local public / private universities* | |
| Heating Degree Days (HDD) (day°C) | Density of the public transport network* | Renewable energy for electricity (%) | Ecological footprint (gha/capita) | Number of CO2-intense industries* | Inequality adjusted well-being (HPI)* | National h-index of scientific publications* | |
| Cooling Degree Days (CDD) (day°C) | Efficient system of public streets lighting* | Biofuel share in transport (%) | Biocapacity (gha/capita) | Airport Carbon Accreditation (level)* | Tertiary education rate (%) |
National Target for CO2 emission reduction* | |
*Dimensionless indicators
The compilation of a single index from a large set of indicators usually requires several steps. Different ways of normalization typical for the same research tasks [33], [34], have been used in this project. Equations (1) and (2) show two normalization methods for each indicator (ix.y) for the city Cj using the min-max method (linear scaling). Depending on whether lower or higher values are more desirable, either (1) or (2) equation was used:
(1)
(2)
where:
I normalized value of the indicator;
x dimension number;
y indicator number within a dimension;
Cj jth city;
i input data before normalization
An example of the first case, when lower values are favorable, are CO2 emissions and energy consumption, while normalized data for the number of local universities and electricity saving will be calculated using the formula (2). Equation (3) provides a means of aggregating all normalized values Ix.y in the integral index for the city Cj.
(3)
where:
The SDEWES Index of the jth city is calculated by a double summation. Since each dimension includes five indicators they can be weighted equally, and in this case the weights dimension (αx) will be equal to 0.14. In this case the weights were differentiated for each dimension, depending on its significance: α1 and α5 are 0.22, since they are directly related to energy and CO2 emissions data [25]. Other dimensions weigh is less (αx = 0.11) since they are not directly related to the action plan in a field of sustainable energy development.
Following the general idea of the method proposed in [31], some adjustments were made depending on the availability of data. For example, evaluating process on D1 dimension included calculations of total energy consumption by city's buildings and transport, the results of which have been used later to define the intensity of CO2 emissions for D5 dimension. Also, the lack of available data on some environmental indicators (for D4 dimension) at local level was replenished by national level data, as well as for household water consumption in the same dimension evaluation. The results of these evaluations in detail are given in the section Results and Discussion.
The city of Nur-Sultan has a quite long history, which began in the second half of the XIX century. In 1960th the city became the center of the North Kazakhstan and South Siberian virgin lands development. After the collapse of the Soviet Union the capital of Kazakhstan Republic was transferred from Almaty city to Nur-Sultan. According to the contemporary Strategic Development Plan of Nur-Sultan until 2030 [35], it will be developed on the basis of modern trends in urban planning, with attention to latest achievements in governance and social sphere, as well as environment protection. Moreover, Nur-Sultan is one of the cities in developing countries that has adopted a carbon neutrality target by 2050 [36]. To assess the potential of a city's transition to sustainable development, such aspects as the macroeconomic situation and the national economy trends, resource consumption, the quality of life, the development of urban infrastructure, etc. were taken into account and compared with opportunities within the scope of the SDEWES Index.
Nur-Sultan city is located in typical for Northern Kazakhstan steppe landscape within flat terrain. Such location determines the continental type of climatic conditions, with sudden temperature fluctuations and clearly defined seasons. Unhindered penetration of cold air masses from the Arctic and warm air masses from the deserts of Central Asia causes extreme temperature differentiation: summer heat can reach +40°C, and winter frosts -50°C. Nur-Sultan has a significant potential for solar and wind energy: the total radiation on the horizontal surface varies from 1300 to 1350 kWh/m2/year [37], and the wind energy density index is from 275 to 375 W/m2 at an altitude of 100 m and from 500 to 650 W/m2 at an altitude of 200 m [38]. The status of the Kazakhstan's capital makes the city one of the financial, cultural and business center of the country and the CIS. The city of Nur-Sultan is characterized by an annual increase in the population (Figure 1), both due to natural growth and migration of the population from other regions of Kazakhstan and Central Asia.
Dynamics of the Nur-Sultan city population in 2003-2019 [39]
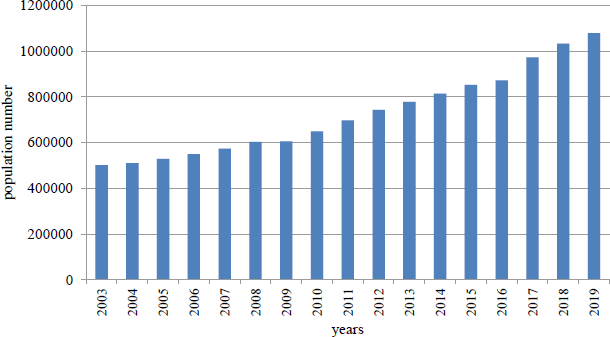
In 2018, the capital became the third city in the country, crossed the millionth milestone [39], and is currently the second city by the number of inhabitants in Kazakhstan.
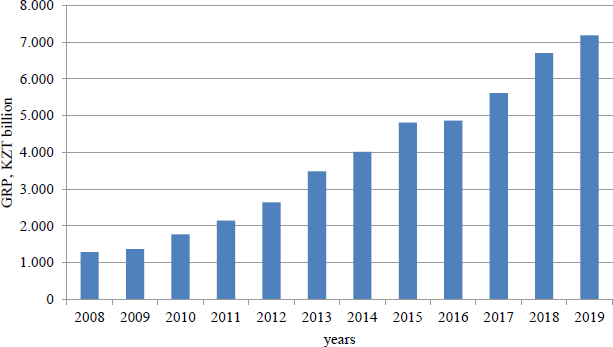
The share of the city's GRP in the GDP of Kazakhstan in 2018 was almost 10%, which corresponds to the 3rd place in the country after the oil-producing Atyrau region at the coast of the Caspian Sea, and the former capital of the country Almaty city. During 10 years (2008-2018), the GRP of the city increased 5 times (Figure 2).
In terms of GRP per capita, Nur-Sultan also occupies the 3rd place in the republic: this indicator is 6,360 thousand tenge (or about $14.9 thousand), which is approximately 2 times higher than the average for Kazakhstan (3,383 KZT thousand) [39].
Dynamics of the GRP of the city of Nur-Sultan, 2008-2019 (KZT billion) [39]
Taking into account the Nur-Sultan city development trends, such as increasing of the population and its well-being, expanding the boundaries of the city and GRP growth, a growth of resources (especially, energy) consumption can be predicted. Until 2016, energy consumption of Nur-Sultan city's facilities exceeded its production by almost 2 times, and the share of local coal extracted from the deposits of Kazakhstan constantly increased in the consumption structure. Today, the share of the coal is near 75% of the total fuel consumed in the city. In 2017, there was a strong decrease in energy consumption to the level of production (7477 million kWh) due to the eve of the International Exhibition EXPO 2017, the theme of which was the energy of the future.
Despite these achievements, Nur-Sultan remains the city with a high level of pollution, of the atmospheric air especially. In 2018, the average concentration of suspended particles (dust) was 2.1 MPC, and nitrogen dioxide - 1.9 MPC [40]. The main sources of these pollutants are motor transport, and the thermal power plants, generating energy through solid fuels burning. The private sector and industrial facilities also make a great contribution. Also, the soil of the city is polluted with heavy metals: exceeding of MPC for copper (Cu) and cadmium (Cd) was noted nearest the area of coal-fired TPP-1 and TPP-2, as well as in the old city center with heavy traffic. According to the annual report of Astana Energy JSC [41], it is planned to gasify totally 13 boilers for both stations by the beginning of the heating period 2022, but these plans are not sufficient to solve the problem of carbon emissions.
To address the issue of Nur-Sultan city's population well-being improvement the SDEWES Index is applicable to identify strengths and weaknesses in the current character of development. The intention of the capital city of Kazakhstan to develop in accordance with sustainability principles is fixed in a number of legislative acts and regulatory documents that form the institutional basis for the city's development [35]. Identification of the most topical issues based on the use of the SDEWES index will actualize the city's policy aimed on achievement of climate goals as well as sustainability in general.
The SDEWES Index is used to benchmark the present performance of the city as a basis to evaluate future directions in targeting more advanced urban system integration [28]. The process of data collection for the main indicators is represented in Table 2.
Data inputs in the framework of the SDEWES Index for Nur-Sultan Municipality
| Dimension (D) | Indicators (i) | Data Inputs | Main References |
|---|---|---|---|
| Energy Usage and Climate (D1) | i1.1 Energy consumption of buildings (MWh) | 18,363,956 | [39] |
| i1.2 Energy consumption of transport (MWh) | 7,205,533 | [39], [42] | |
| i1.3 Total energy consumption per capita (MWh/capita) | 23.7 | [39] | |
| i1.4 Heating degree days (days°C) | 6,332 | [43] | |
| i1.5 Cooling degree days (days°C) | 235 | [43] | |
| Penetration of Energy and CO2 Saving Measures (D2) | i2.1 Sustainable Energy Action Plan (SEAP) | 0.5 | [44] |
| i2.2 Combined heat and electricity systems | 0 | Table 3 | |
| i2.3 Energy savings in buildings | 1 | Table 4 | |
| i2.4 Density of public transport network | 2 | [45] | |
| i2.5 Efficient system of public streets lighting | 1 | [46] | |
| Renewable Energy Potential and Utilization (D3) | i3.1 Solar energy potential (Wh/m2/day) | 3,562 | [37] |
| i3.2 Wind energy potential (m/s) | 6.5 | [38] | |
| i3.3 Geothermal energy potential (mW/m2) | 40 | [47] | |
| i3.4 Renewable energy in electricity production (%) | 0 | [39] | |
| i3.5 Biofuel share in transport (%) | 0 | [45] | |
| Water Usage and Environmental Quality (D4) | i4.1 Total domestic water consumption (m3) | 30.3 | [39] |
| i4.2 Water quality index | 65.6 | [48] | |
| i4.3 Annual PM10 concentration (mg/m3) | 100 | [49] | |
| i4.4 Ecological footprint per capita (gha) | 5.6 | [50] | |
| i4.5 Biocapacity per capita (gha) | 3.6 | [50] | |
| CO2 Emissions and Industrial Profile (D5) | i5.1 CO2 emissions of buildings (t CO2) | 6,216,221 | [39] |
| i5.2 CO2 emissions of transport (t CO2) | 1,880,859 | [45] | |
| i5.3 Average CO2 intensity (t CO2/MWh) | 0.32 | [39] | |
| i5.4 Number of CO2 intense industries | 3 | [39] | |
| i5.5 Airport Carbon Accreditation (level) | 0 | [51] | |
| Urban Planning and Social Welfare (D6) | i6.1 Accessibility of public transport | 0.21 | [45] |
| i6.2 Urban form and protected sites | 1 | Table 4 | |
| i6.3 Gross domestic product per capita (PPP$) | 28,849 | [52] | |
| i6.4 Inequality adjusted well-being (/10) | 7.1 | [53] | |
| i6.5 Higher education rate (%) | 22.7 | [54] | |
| R&D, Innovation and Sustainability Policy (D7) | i7.1 R&D and innovation policy orientation | 1.5 | [52] |
| i7.2 National patents in clean technologies | 1.5 | [55] | |
| i7.3 Local public/private universities | 15 | [55] | |
| i7.4 National h-index | 126 | [56] | |
| i7.5 Reduction target for CO2 emissions (%) | 15 | [57] |
The energy consumption of buildings and transport was calculated according to the data on fuel and energy balance of the Nur-Sultan city [39]. To evaluate the buildings contribution to the total energy balance, the data on the coal volume consumable to generate electric and thermal energy the total volume of fuel needed to produce thermal and electric energy amounted to 3752 thousand tons were used. To assess the transport contribution, the volume of diesel and gasoline motor fuel consumed in the city was calculated. Total sum was interpreted taking into account a coefficient transferring it into TJ, and further into MWh. The data on motor gasoline and diesel consumption, which are 386 thousand tons and 211 tons per year respectively, were taken into account to calculate greenhouse gas emissions from motor vehicles in accordance to the Methodological guidelines [42].
Final assessment for the dimension D1 also included the indicator of energy consumption per capita (i1.3) (4):
(4)
where:
E total energy consumption (MWh);
P(Cj) city population;
Eb energy consumption by buildings (including 1 (municipal buildings); 2 (residential sector); 3 (commercial buildings)) (MWh);
Et energy consumption by transport (including 1 (public); 2 (private); 3 (municipal)) (MWh);
Eg lighting energy consumption (MWh);
Ed industrial energy consumption (MWh).
Under the scope of D1, aspects of climate based on heating and cooling degree days are also considered: Nur-Sultan is found to have 6332 total heating and 235 cooling degree days [43] which is very different with the average: 3358 and 1254 degree days respectively.
The first indicator in this dimension (i2.1) is related to the availability and implementation of an action plan for sustainable energy. The city of Nur-Sultan has an energy efficiency plan supported by the ESMAP (Energy Sector Management Assistance Program) [44]. Depending on the stage of the plan implementation the following points were used: from 0.5 (there is a plan) to 2.0 (the plan is actively implemented, there are results or a new plan has been adopted) [32]. Since the plan for Nur-Sultan city was adopted only in 2017, it has not yet achieved any results, which means that the city receives 0.5 points.
The indicator (i2.2) depends first on an understanding of such characteristics as heat and electricity supply systems (energy conversion and energy source of centralized and individual heat supply), as well as the level of introduction of renewable energy sources (geothermal, solar, waste) into these systems. None of the energy characteristics is evaluated positively (Table 3).
Ancillary data for indicator i2.2
| City | Gas stoves, individual heating systems | TPP on fossil fuels or biogas | Geothermal or solar energy use | Integration of other heat sources (waste et al.) |
|---|---|---|---|---|
| Nur-Sultan | 0 | 0 | 0 | 0 |
The third indicator (i2.3) depends on the availability of energy-efficient buildings in cities - A nearly Zero-Energy Building (nZEB). The national nZEB plan is necessary to receive points, as well as buildings constructed with this technology and an environmental certification of buildings [9]. Since there is no national nZEB plan in Kazakhstan, the only factor for which Nur-Sultan receives a point is the availability and implementation of LEED and BREEAM green certification (Table 4).
Ancillary data for indicator i2.3
| City | National Plan on nZEB | Implementation of nZEB (buildings under construction or already existing) | Buildings with certification LEED, BREEAM |
|---|---|---|---|
| Nur-Sultan | 0 | 0 | + |
The indicator of the public transportation network density (i2.4) is determined by the development of infrastructure for public transport. Today, public transport in the city of Nur-Sultan is represented only by buses, despite most large cities tend to develop metro and tram tracks, which reduce fossil fuel use, and help to avoid traffic congestion. Thus, 2 points were given to Nur-Sultan for the functioning of trams and metro, and 1 point for bus lines. Also, an additional 1 point was awarded for special bicycle lines and bike rental places.
For the last indicator (i2.5), which is effective street lighting, 1 point was awarded for the use of LED lamps, and 2 points if these lamps work on alternative energy sources. In the city of Nur-Sultan, LED lamps are partially used for street lighting, and LED lamps with a brightness control are partially installed in the new city center (Yesil district) [46]. However, alternative energy sources for street lighting are only being introduced in a small part of the city, in this connection Nur-Sultan receives only 1 point.
Indicators of the renewable energy potential (solar (i3.1) and wind (i3.2)) depend on the natural conditions of the city area, which were mentioned above. The data on current share of alternative energy in electricity generation as well as the share of biofuel was received from the Kazakhstan's Committee on Statistics [39]. The potential of geothermal energy was analyzed by the electronic map of geothermal energy produced by ESRI [47].
The water quality index (i4.2) is initially focused on the quality of drinking water, but also considers an overall quality of natural water. The index's calculation is based on the global database of the UN Water Program, which takes into account such water characteristics as dissolved oxygen, pH, total nitrogen and phosphorus content [48]. Air quality (i4.3) is considering only in terms of PM 10 concentration [49]. Since there were no local available data for the ecological footprint (i4.4) and bio-capacity (i4.5), national-level assessments were used [50]. Also, the national indicator of household water consumption per capita (i4.1), reflecting a national water footprint, was taken from the data of the Committee on Statistics [39] and used for calculation of Nur-Sultan city SDEWES Index.
To define the intensity of CO2 emissions (i5.3) the ratio of all CO2 emissions to the total energy consumption of buildings and transport (indicators i1.1 and i1.2) was calculated. The volume of emissions from stationary sources and from transport (i5.1 and i5.2 respectively) were calculated according to the methodological guidelines on greenhouse gas emissions from thermal power plants and from motor transport [42]. The fourth indicator in this dimension (i5.4) shows the number of main industries that emit CO2: the main stationary sources of emissions in Nur-Sultan city are three thermal power plants, using high-sulfur coal with high carbon intensity. The fifth indicator (i5.4) Airport Carbon Accreditation did not contribute to the SDEWES Index of Nur-Sultan city, due to the lack of carbon accreditation of the local airport [51].
The D6 indicators reflect features of the urban structure aimed to provide a well-being of city's residents. The Nur-Sultan city, as well as Almaty and almost all cities designed in Soviet times is a monocentric city [58], and most of its facilities are concentrated in the center. Since a public transport in the city is still poorly developed, this causes quite dense traffic; pedestrian routes are also developed mainly in the city center. Due to significantly low density of population, the city structure of Nur-Sultan is not compact, being composed of new and old districts with various architecture decisions, different density of the road network and green spaces. Given that indicator values range from 1 to 3, where 3 is the most striking example of a compact city and also of highest green spaces share in city's area, Nur-Sultan obtained 1 point for every position, including ecological corridors condition. There are no specially protected areas in Nur-Sultan, so the city receives 1 point for green corridors and a water protection zone of the Ishim River on the border of the city. The indicator i6.2 was calculated as an arithmetic mean of these three characteristics (Table 5).
Ancillary data for indicator i6.2
| Compact Urban Form and Green Spaces | Urban green spaces | Ecological corridors | ||||||
|---|---|---|---|---|---|---|---|---|
| Monocentric city | Polycentric city | Population density, people/m2 | Total score | Green spaces share, % | Total score | Specially protected areas | National parks | Ramsar convention sites |
| + | - | 1407 | 1 | 20 | 1 | 0 | 1 | 0 |
The indicator (i6.1) which is aimed to demonstrate accessibility of public transport was based on the cost of a one-way ticket (90 tenge or about $0.21 at the exchange rate of $1 = 426 KZT). For the last three indicators in this dimension the national values were accepted: GDP by PPP was taken from the global data site [52], the inequality value from the UNEP Report on Human Development of Kazakhstan [53], and the level of higher education from the OECD Report on Kazakhstan [54].
The priority areas in dimension D7 in Kazakhstan are improvements in education, the labor market, social integration, public administration, etc. and also a "green" development promotion. To count achievements in this area the share of R&D expenditures from GDP was taken from the global data site (1 point less than 0.8%; 2 points from 0.8 to 3%; 3 points more than 3%). The first indicator in the area (i7.1) is the arithmetic mean of the area of financing and R&D expenditures. All values were taken for the country.
The indicator i7.2 is related to the number of patents in the field of clean technologies, according to the national data [55]. The number of "green" patents was graded: 1 point less than 2,200; 2 points from 2,200 to 30,000; 3 points more than 30,000. Graduation rate for the share: 1 point less than 2%; 2 points from 2 to 2.5%; 3 points more than 2.5%. The third indicator (i7.3) representing the number of higher institutions (public, private, etc.). The fourth indicator is the Hirsch index (i7.4) and in our case this indicator shows the number of citations of publications in Kazakhstan [56]. The latest indicator in this dimension shows the national target for reducing CO2, which is amounted of 15% by 2030 [57].
The comparison of cities within the SDEWES framework allows concluding about their strong and weak positions in a context of path towards sustainability. Since SDEWES Index is a tool for evaluating systems, that are inherently evolving objects [59], it falls within the UMC principles. Along with this, SDEWES Index is built on diverse indicators that characterize interdependent processes, so its use forms a basis for a comparative analysis. According to one of the most reputable Russian urbanists G.M. Lappo, the comparative analysis corresponds to both traditional methods of geographical research and modern approaches in the field of sustainable development: "Cities are an object that can be said to be intended for comparison" [60]. SDEWES Index therefore seems to be a rather good candidate to develop Multiple Criteria Decision Analysis [59].
The results of the undertaken analysis form a fairly objective picture. According to the normalized indicators values, which were calculated using formulas (1) and (2), Nur-Sultan's position is below the average in the D1 dimension. Nur-Sultan city is ahead of only five cities: Beijing, London, Incheon, Nagoya and Washington, taking the 6th position from the end of the rating. Due to the longest among the comparable cities heating season, depending on a harsher climate, thermal energy composes over 40% of the total energy consumed by buildings in the city of Nur-Sultan. Moreover, such a significant share is explained by an inefficient heating system with high heat losses of buildings. Thus, the number of heating days and energy consumption per capita are the weak positions of Nur-Sultan in the D1 dimension.
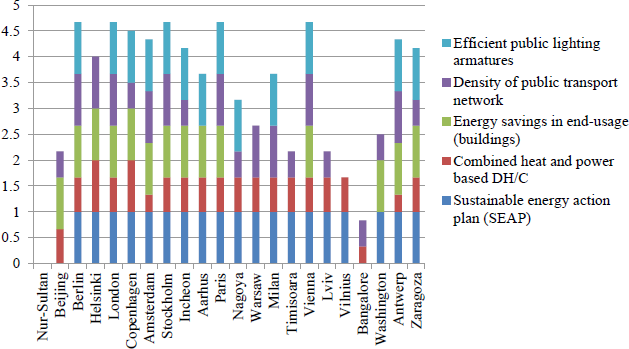
The normalized values of indicators in the D2 dimension of Nur-Sultan city demonstrate weak positions in energy system characteristics: high energy consumption per capita in the city is caused by poor implementation of renewable and energy-saving technologies both in centralized and individual heat supply systems and a preferable use of individual transport by population. The total population of Nur-Sultan (1078 thousand people in 2019) is 3 times less than the population of Berlin and Incheon, and 8 times less than of London and Bangalore. At the same time, energy consumption per capita ranges from 7 (Bangalore) to 19 (Berlin) MWh/person, and for Nur-Sultan this value is almost 24 MWh/person (Figure 3). The high carbon intensity of coal and fuel oil used for power generation in Nur-Sultan is planned to be reduced by gasification in the near future, however this will not solve the problem completely and represents carbon lock-in.
Normalized indicators in the D2 dimension
The D3 dimension shows the potential of renewable energy sources development. The only strong point of Nur-Sultan city in this area is a potential of wind energy (Figure 4), which is almost equally developed as the same potential of cities Helsinki, Copenhagen and Amsterdam.
Normalized indicators in the D3 dimension
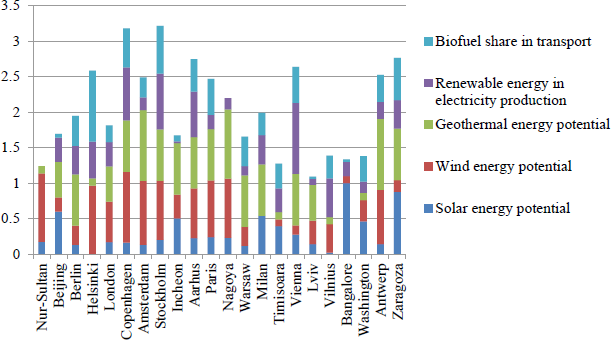
This potential depends on the average wind speed, which ranged from 6.3 to 6.6 m/s in the leading cities listed above. The smallest share of alternative sources in energy production, as well as the minimum share of biofuels in transportation sector belongs to the cities of the post-Soviet space, namely Lviv (~6%) and Nur-Sultan (less than 1%). Since the indicator of household water consumption per capita exceeds the values of other cities by more than 10 units, the water resources use in Nur-Sultan can be described as low-effective. The city has the lowest water quality after Lviv and Timisoara which are also among three anti-leaders in the D3 rating.
The weak position of Nur-Sultan city is also the concentration of pollutants in the air the indicator in D4 dimension, which was estimated by the content of PM10 particles in the atmosphere. By this indicator, Nur-Sultan is second only to cities Beijing (108 microns/m3) and Bangalore (118 microns/m3) due to the use of coal as fuel at the thermal power plants. In other cities of the rating, a larger share in the structure of energy generation is made up of more environmentally friendly options, such as gas-fired thermal power plants, hydroelectric power plants, etc. However, gas-fired thermal power plants will certainly not solve the urgent issue of carbon lock-in and will not support net-zero carbon targets. High PM10 concentrations in Bangalore and Beijing are also explained by heavy traffic. The values of the ecological footprint and bio-capacity of Kazakhstan are close to the average values for many other countries of rating: the consumption of natural resources exceeds the restoring ability of ecosystems. The only exceptions to this indicator are Finland (Helsinki) and Sweden (Stockholm).
In terms of greenhouse gas emissions from stationary sources and motor transport, Nur-Sultan occupies the middle positions by dimension D5 in the rating. CO2 emissions are higher in cities with high number of population and therefore high energy consumption. These are mainly cities with more than 1,700 thousand people, such as Vienna, Warsaw, Paris, Nagoya, Incheon, Berlin, London, Bangalore and Beijing. However, by the volume of emissions per unit of energy generated, Nur-Sultan is third from the end of rating. As to the carbon accreditation of airports, Nur-Sultan do not have it, as well as post-Soviet city Lviv, and some others European cities (Timisoara, Aarhus, Zaragoza), and also the airports of Washington and Nagoya.
The set of indicators for the D6 dimension area includes social welfare indicators that are related to the environmental and economic indicators of urban development. For example, the cities of Nur-Sultan and Lviv have the lowest cost of a ticket for a one-way trip by public transport after Bangalore. The weakest position of Nur-Sultan in this area is the urban form and protected sites: the population is distributed extremely unevenly throughout the territory and its density is significantly less than in other cities at the rating. The area of green spaces of the city is also rather small, and most of the city's services are provided only in the central part, while public transport is not popular due to its low efficiency. This situation is the result of uneven development of the city in XX and XXI centuries due to fundamental changes in the administrative status.
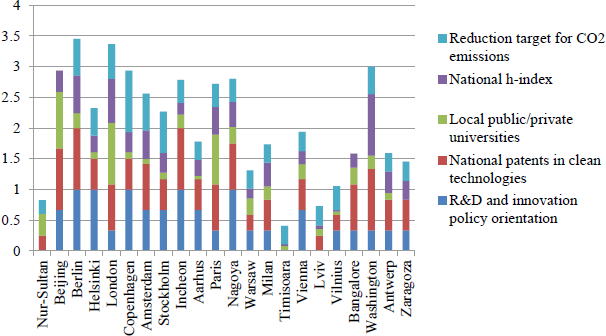
By GDP per capita Kazakhstan exceeds only three countries: China, Ukraine and India. The indicator of well-being and the percentage of the population with higher education in Kazakhstan are also less than the average value: according to the first indicator, Kazakhstan is closer to Poland (7.1), and according to the second to Ukraine (more than 20%). Indicators in the D7 dimension allow comparing the level of scientific and technological development and achievements in the field of sustainability (Figure 5).
The city of Nur-Sultan is close to the cities of Eastern Europe (namely Lviv, Vilnius and Timisoara). Ukraine, Romania and Kazakhstan have weak positions in the indicator of R&D policy orientation due to the small share of GDP (less than 1%) for R&D expenses. Expectedly, Kazakhstan also has the lowest Hirsh index. The number of patents for green technologies in Kazakhstan is higher than could be expected, as the country has recently been stimulated to improve the energy sector development. This indicator in Kazakhstan is similar to the same one of Ukraine. In terms of the number of local institutions of higher education, Nur-Sultan occupies quite high position due to the fact that there are many universities with different specializations.
Normalized indicators in the D7 dimension
The analysis of Nur-Sultan positions in the rating of totally 22 cities revealed its strengths and weaknesses of the development, taking into account resource intensity and other environmental and economic indicators important for sustainability. If to compare the positions of Nur-Sultan with the average values, the main trend coincides with other cities in energy consumption and greenhouse gas emissions. However, Nur-Sultan continues to grow, and the situation may worsen, that is the reason why the changes in the energy sector efficiency are absolutely necessary.
Based on the results of the SDEWES Index, all the cities were assigned to 4 groups in accordance to [31]: the lower 25% is characterized to contain the "Challenged Cities" that face challenges in three and more dimensions. The cities that take place in the second quartile at the lower 25-50% of the sample continue to be in need for strategic approaches to address remaining challenges, namely "Solution Seeking Cities." Above the median value, the "Transitioning Cities" are characterized to have certain strengths at the top 50-75% of the sample, while the "Pioneering Cities" at the top 25% of all cities have strengths in multiple dimensions (Table 6).
Cities rating by SDEWES Index
| Rating | Cities groups | Cities | Total score |
|---|---|---|---|
| 1 | Pioneering Cities | Stockholm | 3.848 |
| 2 | Copenhagen | 3.804 | |
| 3 | Helsinki | 3.660 | |
| 4 | Amsterdam | 3.472 | |
| 5 | Transitioning Cities | Paris | 3.364 |
| 6 | Vienna | 3.331 | |
| 7 | Berlin | 3.266 | |
| 8 | Aarhus | 3.233 | |
| 9 | Milan | 3.202 | |
| 10 | London | 3.170 | |
| 11 | Antwerp | 3.164 | |
| 12 | Solution Seeking Cities | Zaragoza | 3.142 |
| 13 | Incheon | 3.060 | |
| 14 | Vilnius | 2.904 | |
| 15 | Warsaw | 2.725 | |
| 16 | Nagoya | 2.707 | |
| 17 | Challenged Cities | Bangalore | 2.639 |
| 18 | Timisoara | 2.628 | |
| 19 | Washington | 2.595 | |
| 20 | Lviv | 2.514 | |
| 21 | Nur-Sultan | 2.078 | |
| 22 | Beijing | 1.750 |
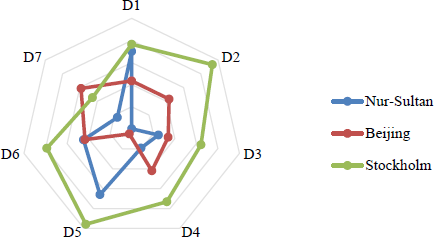
Comparing the Nur-Sultan positions to the leader and outsider of the rating Stockholm and Beijing (Figure 6), respectively the only similar position can be defined for Stockholm and Nur-Sultan: due to harsh climate both cities are close in the field of energy consumption (D1). At the same time, Nur-Sultan and Beijing have similar positions in the field of urban planning and social welfare (D6). Despite Stockholm is an absolute leader in almost all areas, the most significant feature of Beijing is strong positions in the scientific field (D7), which can lead to improvement the environmental situation in China, and strengthening positions in all other fields in a future.
The SDEWES indexes of Nur-Sultan, Beijing and Stockholm cities
The comparison of Nur-Sultan city positions with post-Soviet cities in the rating, the similar trends are obvious for all the dimensions of the index (Figure 7).
The SDEWES indexes of post-Soviet cities
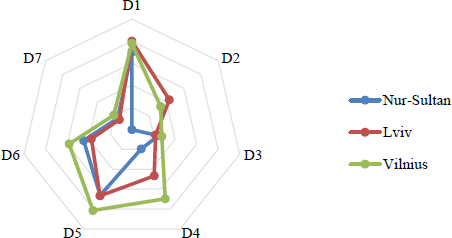
Since Lithuania is part of the European Union from 1990th beginning, its capital city Vilnius included to "Solution Seeking Cities" is focused to address remaining challenges. The strengths of Vilnius city are dimensions D4, D5, D6. Nur-Sultan and Lviv (Ukraine) are both assigned to the group of the "Challenged Cities" that face challenges in three and more dimensions. A noticeable gap between Nur-Sultan and Lviv cities is in the dimensions D2 and D4 energy efficiency and a state of environment. The strengths of both Lviv and Vilnius cities in the D2 area are caused by implementation of the energy efficiency plans, and by common adherence to the European trends. The gap of Nur-Sultan in the area D4 is caused by high water consumption and a significantly worse quality of atmospheric air due to use of coal as a main fuel.
Large cities are often compared with the "engines" of development of the countries as a whole, because they determine the development trends of other cities. The results of research presented in this paper confirms that in most cases large cities are a reflection of both the situation in the country and its development trends. The larger cities accumulate huge country's resources financial, labor, information, etc. the effective use of which determines the future development of the country and of the world.
Within the framework of urban metabolism concept, a SDEWES Index can be considered as a great opportunity for urban sustainability studying. The growth of urban areas all over the world has promoted transmission of resources and, especially, of energy within the urban systems. Therefore, identifying strengths and weaknesses of current state of city's development is extremely important for integrated and sustainable development at the municipal and regional levels.
The calculated SDEWES Index, as a composite indicator, can be used to evaluate and to compare cities strengths and weaknesses by multiple criteria. In a case of Nur-Sultan the results are useful for the city's integration into the race to net-zero targets achievement. In order to avoid failures on this way, the city's government must be focused on energy and CO2-saving measures, rising renewable energy potential and water and environment quality, and development of research, innovations and sustainability policy.
SDEWES Index demonstrates that the efficiency of using resources depends a lot on the planning structure of the city, its transport network and many other social and economic factors of the urban space development. Further development of this approach within the concept of urban metabolism brings to large perspectives to manage sustainable development.
This research was performed according to the Development program of the Interdisciplinary Scientific and Educational School of M.V. Lomonosov Moscow State University «Future Planet and Global Environmental Change».
- , https://www.un.org/development/desa/publications/2018-revision-of-world-urbanization-prospects.html
- ,
Transitions in sociometabolic regimes throughout human history ,Social Ecology ,pp 63-92 , 2016, https://doi.org/https://doi.org/10.1007/978-3-319-33326-7_3 - ,
Urban Planning and Sustainable Development ,European Planning Studies , Vol. 9 (4),pp 503-524 , 2001, https://doi.org/https://doi.org/10.1080/09654310120049871 - ,
Urban metabolism: A review of research methodologies ,Environmental Pollution , Vol. 178 ,pp 463-473 , 2013, https://doi.org/https://doi.org/10.1016/j.envpol.2013.03.052 - ,
Sustainable development of energy, water and environment systems index for Southeast European cities ,Journal of Cleaner Production , Vol. 130 ,pp 222-234 , 2016, https://doi.org/https://doi.org/10.1016/j.jclepro.2015.07.121 - ,
Developing a multi-layered indicator set for urban metabolism studies in megacities ,Ecological Indicators , Vol. 47 ,pp 7-15 , 2014, https://doi.org/https://doi.org/10.1016/j.ecolind.2014.07.039 - ,
Production and emissions reduction decisions considering the differentiated carbon tax regulation across new and remanufactured products and consumer preference ,Urban Climate , Vol. 40 ,pp 100992 , 2021, https://doi.org/https://doi.org/10.1016/j.uclim.2021.100992 - ,
Economic evaluation of renewable energy systems for the optimal planning and design in Korea - a case study ,Journal of Sustainable Development of Energy, Water and Environment Systems , Vol. 6 (4),pp 725-741 , 2018, https://doi.org/https://doi.org/10.13044/j.sdewes.d6.0216 - ,
Spatio-Temporal Differences and Driving Forces of Air Quality in Chinese Cities ,Journal of Resources and Ecology , Vol. 7 (2),pp 77-84 , 2016, https://doi.org/https://doi.org/10.5814/j.issn.1674-764x.2016.02.001 - ,
Relating emissions of carbon to characteristics of consumption in India ,Journal of Sustainable Development of Energy, Water and Environment Systems , Vol. 6 (2),pp 255-275 , 2018, https://doi.org/https://doi.org/10.13044/j.sdewes.d5.0185 - ,
Applying a Place Making Sustainable Centres Framework to Transit Activated Corridors in Australian cities ,Journal of Sustainable Development of Energy, Water and Environment Systems , Vol. 10 (2),pp 1-23 , 2022, https://doi.org/https://doi.org/10.13044/j.sdewes.d8.0360 - , , Assessing the Value of Urban Green Infrastructure Ecosystem Services for High-Density Urban Management and Development: Case from the Capital Core Area of Beijing, 2021
- ,
Application of the sustainable development of energy, water and environment systems index to world cities with a normative scenario for Rio de Janeiro ,Journal of Sustainable Development of Energy, Water and Environment Systems , Vol. 6 (3),pp 559-608 , 2018, https://doi.org/https://doi.org/10.13044/j.sdewes.d6.0213 - ,
Modeling of energy system sustainability index ,THERMAL SCIENCE , Vol. 9 (2),pp 3-16 , 2005, https://doi.org/https://doi.org/10.2298/TSCI0502003A - ,
Assessing the collection of Urban solid wastes: A step towards municipality benchmarking ,Water, Air, and Soil Pollution: Focus , Vol. 4 (4-5),pp 397-409 , 2004, https://doi.org/https://doi.org/10.1023/B:WAFO.0000044813.50757.a7 - ,
Urban sustainable transportation indicators for global comparison ,Ecological Indicators , Vol. 15 (1),pp 115-121 , 2012, https://doi.org/https://doi.org/10.1016/j.ecolind.2011.09.010 - , 1994, Ros.ekon.akad.PublCo
- ,
Renewable Energy Development in the Context of Green Economy: the Experience of Kostanay Region (Kazakhstan), Bulletin of the Volgograd State University ,Bulletin of Volgograd State University Series 3. Economics. Ecology , (4),pp 94-103 , 2016, https://doi.org/https://doi.org/10.15688/jvolsu3.2016.4.8 - ,
IoT Monitoring of Urban Tree Ecosystem Services: Possibilities and Challenges ,Forests 2020, Vol. 11 , Vol. 11 (7),pp 775 ,pp 775 , 2020, https://doi.org/https://doi.org/10.3390/f11070775 - ,
Human Dimensions of Urban Blue and Green Infrastructure during a Pandemic. Case Study of Moscow (Russia) and Perth (Australia) ,Sustainability 2021, Vol. 13, Page 4148 , Vol. 13 (8),pp 4148 , 2021, https://doi.org/https://doi.org/10.3390/su13084148 - ,
Water bodies an urban microclimate: A review ,Modern Applied Science , Vol. 9 (6),pp 1-12 , 2015, https://doi.org/https://doi.org/10.5539/mas.v9n6p1 - ,
Ecosystem service assessments in water policy implementation: An analysis in urban and rural estuaries ,Front Mar Sci , Vol. 6 , 2019, https://doi.org/https://doi.org/10.3389/fmars.2019.00183 - ,
Greendevelopment challenges within the environmental management framework ,Journal of Environmental Management , Vol. 277 ,pp 111477 , 2021, https://doi.org/https://doi.org/10.1016/j.jenvman.2020.111477 - ,
Composite index for benchmarking local energy systems of Mediterranean port cities ,Energy , Vol. 92 (Part 3),pp 622-638 , 2015, https://doi.org/https://doi.org/10.1016/j.energy.2015.06.093 - ,
Adapting the SDEWES Index to Two Hungarian Cities ,Hungarian Journal of Industry and Chemistry , Vol. 45 (1),pp 49-59 , 2018, https://doi.org/https://doi.org/10.1515/hjic-2017-0008 - ,
Data on cities that are benchmarked with the sustainable development of energy, water and environment systems index and related cross-sectoral scenario ,Data in Brief , Vol. 24 ,pp 103856 , 2019, https://doi.org/https://doi.org/10.1016/j.dib.2019.103856 - ,
Benchmarking the sustainability of urban energy, water and environment systems and envisioning a cross-sectoral scenario for the future ,Renewable and Sustainable Energy Reviews , Vol. 103 ,pp 529-545 , 2019, https://doi.org/https://doi.org/10.1016/j.rser.2018.11.006 - ,
Transition towards urban system integration and benchmarking of an urban area to accelerate mitigation towards net-zero targets ,Energy , Vol. 236 ,pp 121394 , 2021, https://doi.org/https://doi.org/10.1016/j.energy.2021.121394 - ,
A Nearly Net-Zero Exergy District as a Model for Smarter Energy Systems in the Context of Urban Metabolism ,Journal of Sustainable Development of Energy, Water and Environment Systems , Vol. 5 (1),pp 101-126 , 2017, https://doi.org/https://doi.org/10.13044/j.sdewes.d5.0136 - ,
Voluntary National Survey of Kazakhstan - Institute on Economic Researches ,Voluntary National Survey of Kazakhstan , 2019https://economy.kz/en/Celi_ustojchivogo_razvitija/Nacionalnyj_otchet/ - ,
, https://sdewes.org/sdewes_index.php - ,
Sustainable Development of Energy, Water and Environment Systems (SDEWES) Index for policy learning in cities ,Innovation and Sustainable Development , Vol. 12 (1/2),pp 87-134 , 2018, https://doi.org/https://doi.org/10.1504/IJISD.2018.10009938 - ,
Applicationof a hybrid Entropy-McKinsey Matrix method in evaluating sustainable urbanization: A China case study ,Cities , Vol. 42 (PB),pp 186-194 , 2015, https://doi.org/https://doi.org/10.1016/j.cities.2014.06.006 - ,
Aholistic low carbon city indicator framework for sustainable development ,Applied Energy , Vol. 185 ,pp 1919-1930 , 2017, https://doi.org/https://doi.org/10.1016/j.apenergy.2016.03.041 - , https://adilet.zan.kz/kaz/docs/P060000113_
- , https://climateaction.unfccc.int/Actors/Countries/89
- , http://atlassolar.kz/
- , https://globalwindatlas.info/area/Kazakhstan
- , https://www.gov.kz/memleket/entities/stat?lang=en
- , 2018, https://kazhydromet.kz
- , 2021, http://astana-energy.kz/ru/
- Republic of Kazakhstan, 2010, https://kzgov.docdat.com/docs/19/index-3368795.html
- , 2019, http://pogoda-service.ru/
- , 2020, https://esmap.org/
- , 2020, https://www.gov.kz/memleket/entities/nur-sultan-uad?lang=en
- , , Municipal Energy Efficiency Plan for the City of Astana, 2017
- , https://www.arcgis.com/apps/MapJournal/index.html?appid=b57e3c81aec34231a099c719360b5cd7
- , https://www.numbeo.com/pollution/in/Astana-Nur-Sultan-Kazakhstan
- ,
, Air pollution in Astana: analysis of recent trends and air quality monitoring system , 2018, https://doi.org/https://doi.org/10.1016/j.matpr.2018.07.086 - , https://data.footprintnetwork.org/?_ga=2.176480674.608977098.1639154374-964425411.1639154374#/
- , https://airportco2.org/
- , https://knoema.com/
- , http://hdr.undp.org/en/content/national-human-development-report-2019-kazakhstan
- ,
Education Policy Outlook 2019: Working Together to Help Students Achieve their Potential ,OECD iLibrary , https://www.oecd-ilibrary.org/sites/e765dfb7-en/index.html?itemId=/content/component/e765dfb7-en - , https://kazpatent.kz/en
- , , SJR - International Science Ranking
- , https://www.kz.undp.org/content/kazakhstan/ru/home/sustainable-development-goals.html
- ,
Thegreen space as a driver of sustainability in Post-Socialist urban areas: The case of Almaty City (Kazakhstan) ,BELGEO , (4), 2018, https://doi.org/https://doi.org/10.4000/belgeo.28865 - ,
Multiple criteria decision analysis theory and tools for the SDEWES index ,Journal of Sustainable Development of Energy, Water and Environment Systems , Vol. 8 (4),pp 654-677 , 2020, https://doi.org/https://doi.org/10.13044/j.sdewes.d7.0315 - , , The geographer's sight (in Russian), 2012