


The sustainable economic development of a country is only possible through the well-planned and efficient use of locally available natural resources, such as solar, wind, and hydraulic energy and biomass [1], [2]. Solar energy is a promising and abundant renewable energy source for electricity generation, either via direct conversion of solar radiation using photovoltaic (PV) technology or via thermal energy using concentrated solar power (CSP) technologies [3], [4]. However, the solar potential depends on several meteorological and atmospheric parameters. Clouds are considered the leading cause of the reduction of solar irradiation. While under clear sky conditions, aerosols strongly influence solar irradiation [5].
Aerosols are a mixture of tiny solid and liquid particles suspended in the atmosphere. Aerosols include mineral dust, windblown dust, volcanic ash, haze, fog, fire smoke, sea salt, and particulate pollution from natural and anthropogenic activities. Aerosol optical depth (AOD) is a key parameter that reflects the optical characteristics of aerosols; it represents the degree to which aerosols inhibit light transmission through scattering and absorption phenomena [6].
Reliable information on aerosols is limited due to their high spatial and temporal variability. AOD data can be measured at the ground level using sun photometers such as the Aerosol Robotic NETwork (AERONET). Although AERONET provides high accuracy AOD information compared to satellite data, its spatial coverage is still very limited. However, worldwide many studies were devoted to assessing satellite products such as Moderate Resolution Imaging Spectroradiometer (MODIS) against ground measurements from AERONET to be used as alternatives to ground measurements.
Various studies evaluated the impact of AOD and, more precisely, the effect of soiling on solar production [7], [8], but the impact of AOD on solar radiation has rarely been assessed. Some scientists have discussed the significant effect of aerosols on decreasing downward shortwave radiation at the ground leading to a decrease in available solar energy.
Li et al. [9] estimated the reduction rate of PV production from 20% to 25% in China using global horizontal irradiance (GHI) data from a satellite database and PV production data from a model. Kosmopoulos et al. [10] evaluated dust's impact on the Mediterranean's solar energy. A 5-day Saharan dust storm in 2015 reduced the PV production to 40−50% and CSP by 80−90%. Neher et al. [11] evaluated the impact of atmospheric aerosols on a single PV module in Niamey. They found an average decrease of 14% during clear sky days and up to 48% during a dust storm.
For instance, Xia et al. [12] found that the reduction in instantaneous direct shortwave surface irradiance per unit of AOD is 404.5 W/m2. Approximately 63.8% of this reduction is offset by diffuse horizontal irradiance (DHI) increase. Therefore, increasing AOD by one unit decreases 146.3 W/m2 in overall surface irradiance.
The Intergovernmental Panel on Climate Change (IPCC) has shown the global radiative effect of aerosols estimated at 0.5 W/m2 [13]. In contrast, the instantaneous direct radiative forcing can reach 129 W/m2on the West African coast. Drame et al. [14] performed a case study on the influence of aerosols on available solar energy. The results showed a 10% and 28% decrease for GHI and DNI, respectively. The authors estimated the overall radiative effect of aerosols at 0.5 W/m2.
Guleria et al. [15] have quantified the impact of aerosol transport on surface solar radiation using satellite products in the northwestern Indian Himalayas. The authors concluded that aerosols significantly reduce incoming solar radiation and substantially increase lower atmospheric warming.
Conceiçao et al. [16] found that AOD can be useful to determine aerosols' effect on irradiance and as an important parameter for monitoring dust transport events. Cordero et al. [17] reported that AOD could also be used to estimate the effect of soiling on the performance of PV technology. Prasad et al. [18] used dust AOD from different satellite databases to determine the loss of energy production due to dust accumulation in Austria.
Given the importance of aerosols on the attenuation of solar irradiation and to joining the various studies conducted worldwide on this topic, this paper provides a case study regarding the impact of AOD on the attenuation of solar irradiance in Morocco. This study examines the impact of AOD at 550 nm on the GHI and DNI collected from ground-based weather stations at two sites in Morocco. Since ground-based AOD measurements are unavailable for the study sites, MODIS satellite data served as an alternative to the ground measurements. Before using the MODIS satellite database, it was validated with six AERONET sites available in Morocco. Subsequently, to evaluate the impact of AOD, GHI and DNI loss rates for horizontal and normal radiation at the top of the atmosphere are introduced. The assessment assumes clear sky conditions only to eliminate the effect of clouds.
The results obtained in this study could be of importance for future solar projects in the semi-arid and Saharan climates [19]. To the authors' knowledge, no research of this kind has been conducted under these climate conditions.
The MODIS satellite database was first validated against the AERONET ground measurements to be used subsequently to evaluate the impact of AOD on solar radiation. Then, aerosols were categorised to determine the dominant aerosol types in each location. Finally, the impact of the AOD on solar irradiance was evaluated using GHI and DNI data collected from two meteorological stations and aerosols data from MODIS.
This study considered two aerosol data sources. AERONET provides ground-based AOD measurements, while MODIS estimates AOD from satellite radiometers.
AERONET is a global network of sun photometers established by the National Aeronautics and Space Administration (NASA) and extensively developed by other partner agencies, institutes, and universities worldwide [20]. This program aims to assess the optical properties of aerosols and validate satellite retrievals of aerosol optical properties. AERONET observations can be used as reference values to verify and evaluate the accuracy of the satellite products since the measurements employed CIMEL CE-318 sun photometers [21].
Solar extinction measurements are taken with a high spatial resolution (15 min) in the wavelength range of 340 nm to 1640 nm. AERONET contains three levels of AOD quality: Level 1.0 (unfiltered raw data), Level 1.5 (clouds filtered), and Level 2 (quality assured) [22]. High-accuracy aerosol data at 500 nm wavelength from Level 2 of version 3 were used for MODIS validation.
AERONET lacks AOD products at 550 nm. Since AERONET provides the Angström exponent (AE) values, the estimation of AOD at 550 nm employed AERONET AOD at 500 nm and 440 nm wavelengths using the following equation that relates AOD at the desired wavelength (λ) and AOD at the reference wavelength (λ0) [23].
(1)
MODIS is one of the first satellite-based passive radiometers, part of NASA's Earth-observing system (EOS) program designed to retrieve aerosols over land and ocean. MODIS provides large-scale geophysical data sets such as atmospheric, oceanic, and terrestrial information based on 36 spectral channels with a temporal resolution of 1–2 days [24]. MODIS level 2 (MOD04_L2) provides aerosol parameter data with a spatial resolution of 10 ×10 km [25]–[27]. This analysis used aerosol products from MOD04_L2.
Two sites with distinct climate types in Morocco, where high-performance ground-based radiation measurements are available, enable us to investigate aerosols' impact on solar irradiance components. The irradiance data come from high-precision ground-based meteorological stations installed at Green Energy Park (GEP, Benguerir) and Tantan.
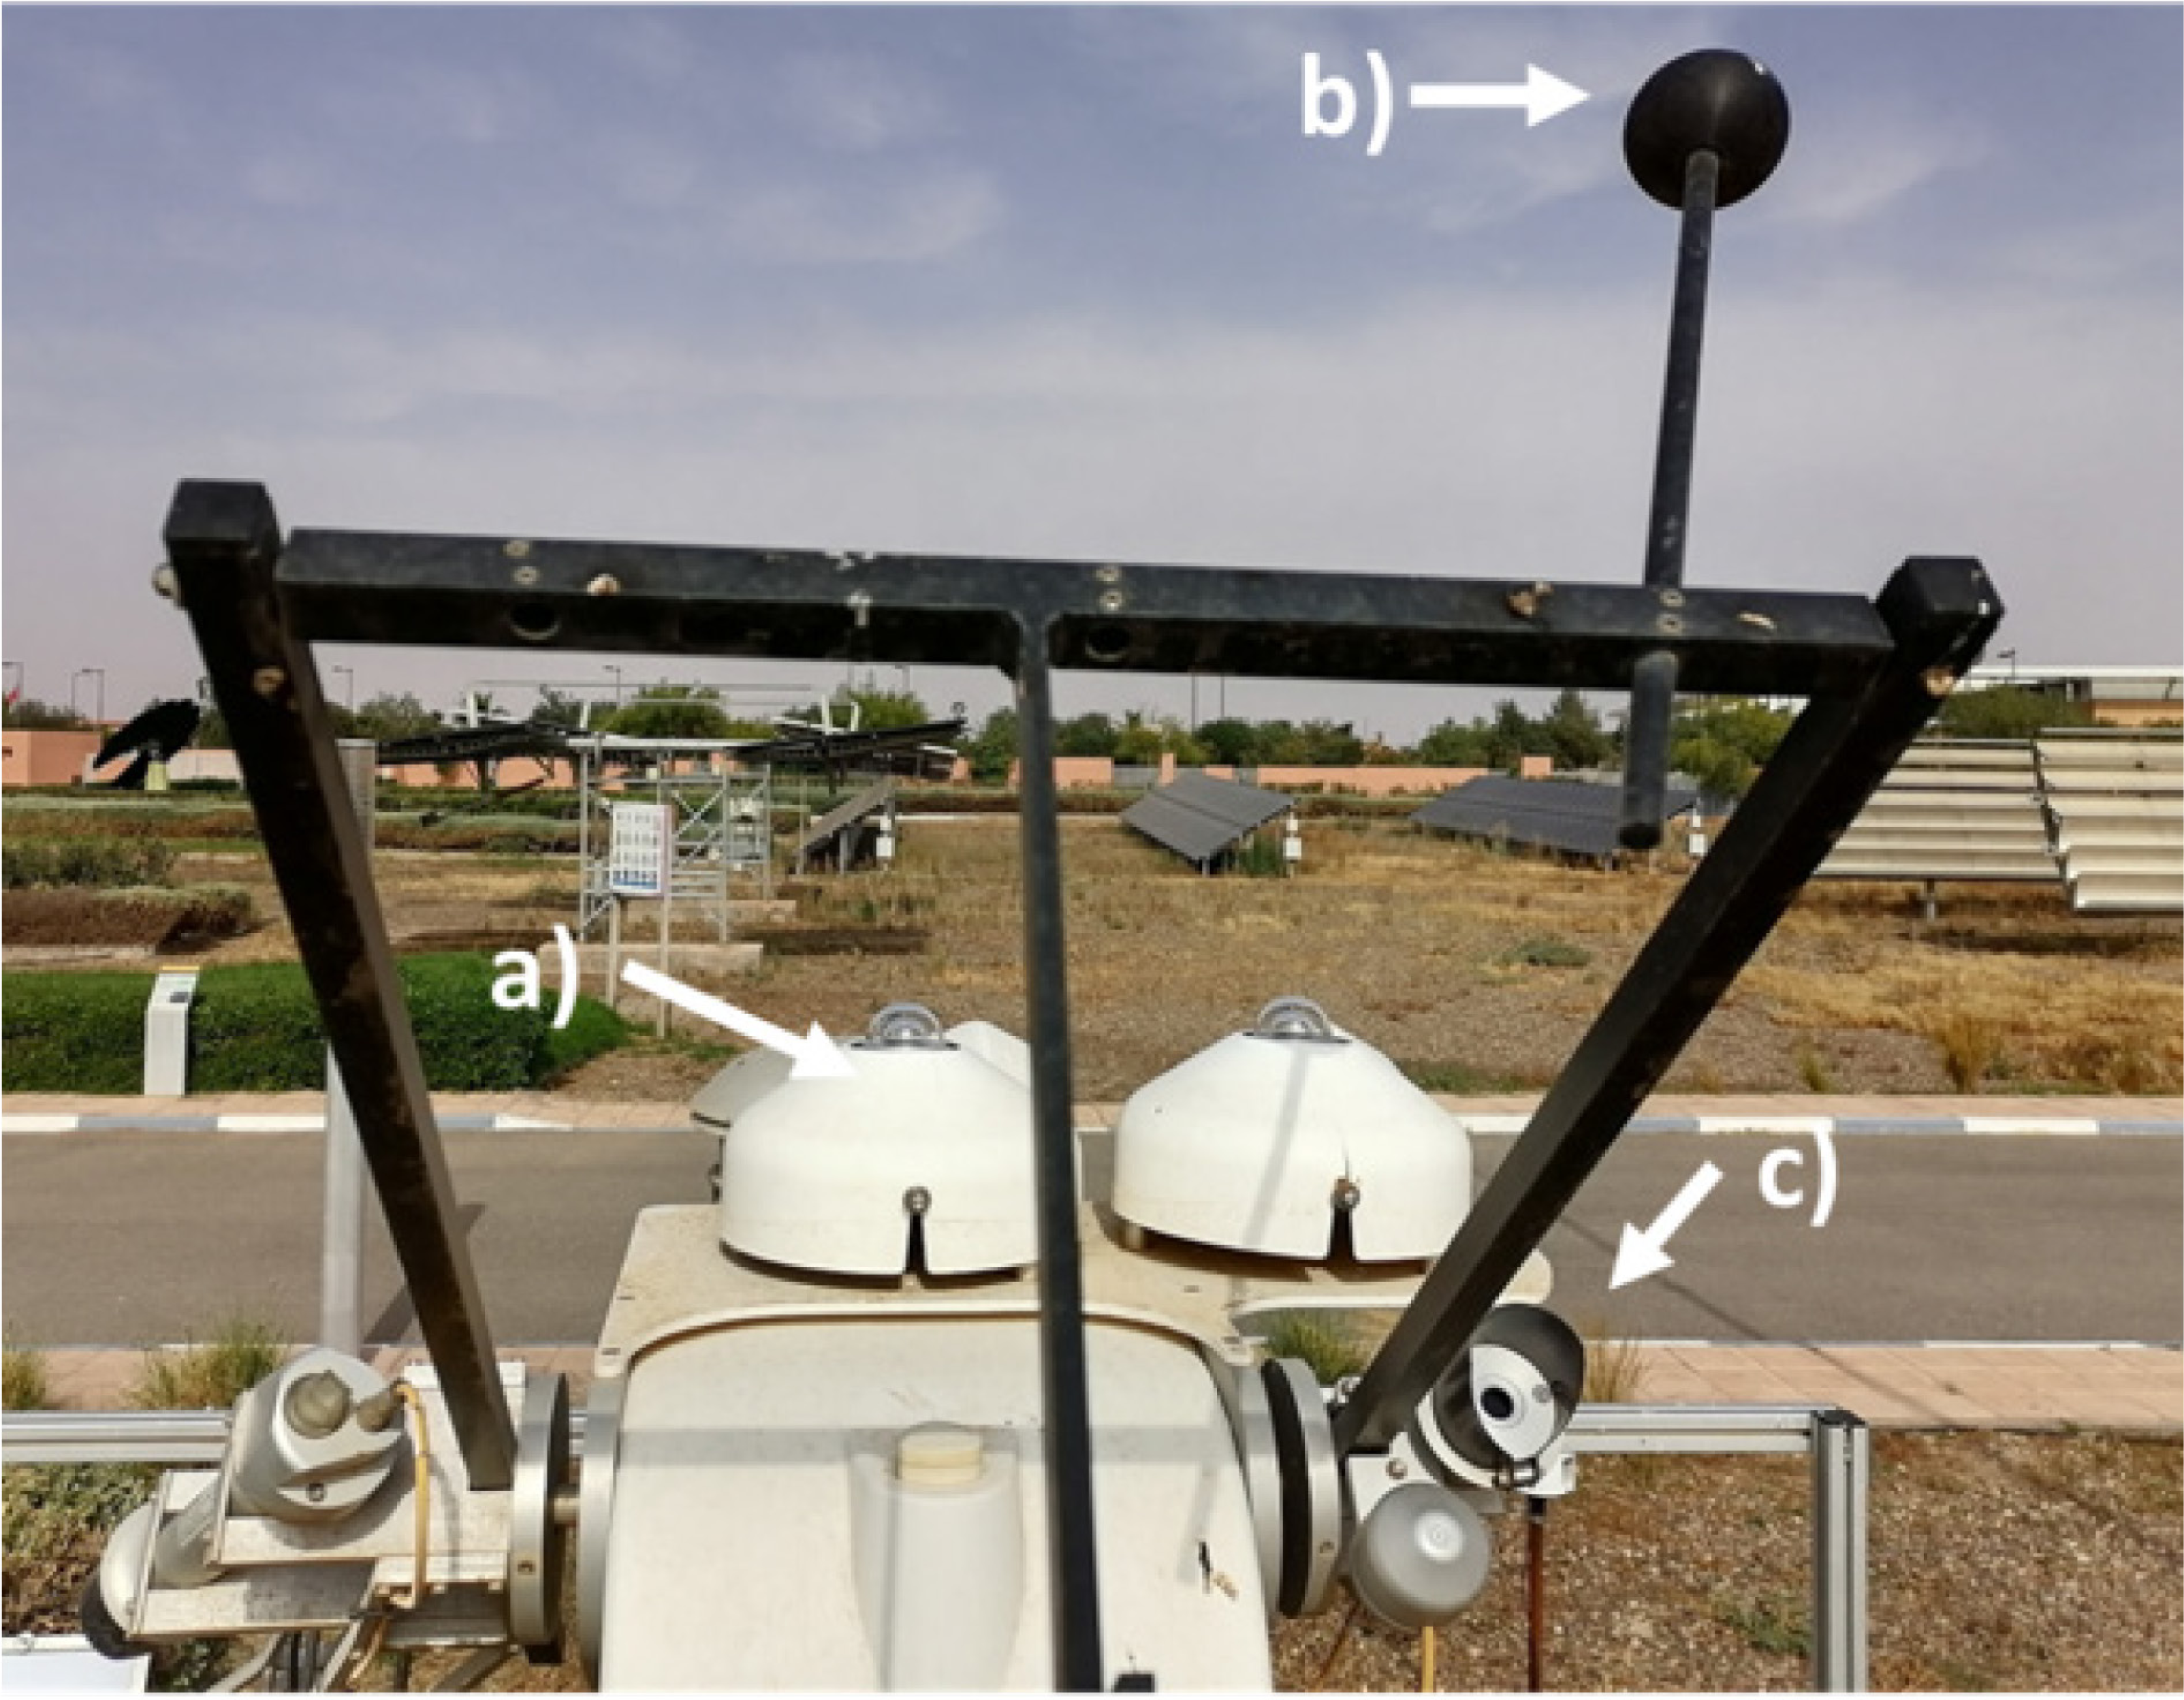
The weather stations are equipped with high-performance sensors to measure GHI, DHI, and DNI. GHI measurement uses a Kipp&Zonen CMP21 pyranometer classified in the highest possible ISO pyranometer performance category [28]. The sensors are characterized by a broad spectral bandwidth from 310 nm to 2800 nm, with a response time of < 1 s [29]. A similar pyranometer measures DHI by blocking the direct irradiance with an opaque ball placed above the instrument. The DNI is measured using a Kipp&Zonen CHP1 (first-class) pyrheliometer characterized by a spectral band from 200 nm to 4000 nm and a response time of 1 s [30]. The sensors are mounted on an automatic sun tracker Kipp&Zonen SOLYS 2 to maintain the instrument's alignment with the solar disk [31]. Figure 1 illustrates the sensors used to measure the three components of solar radiation installed at the site of Benguerir as an example. Table 1 presents the irradiance component measured and the sensors used.
Example instrumentation at the Benguerir site: Kipp&Zonen pyranometer CMP21 (a); a shading ball for DHI measurement (b); Kipp&Zonen pyrheliometer CHP1 (c)
Meteorological station sensors
Parameter |
Instrument |
Spectral range[nm] |
Accuracy |
|---|---|---|---|
GHI, DHI |
Kipp&Zonen pyranometer |
200 to 4000 nm |
Expected daily uncertainty (in the clean state) = ±2% Response time (95%) < 5 s |
DNI |
Kipp&Zonen pyrheliometer CHP1 |
310 to 2800 nm |
Expected daily uncertainty (in the clean state) = ±1% Response time (95%) = 5 s |
As already mentioned, the first aim of this study is to validate aerosol data from MODIS products using ground AOD measurements from the AERONET network over Morocco. Daily AOD values from MODIS and AERONET at 550 nm were compared for validation. The validation relied on the best-known statistical indicators: the Root Mean Square Error (RMSE), the Mean Bias Error (MBE), and Correlation Coefficient (CC). According to the studies [32], [33] and after several validations of MODIS against ground measurements worldwide, the authors confirmed that eq. (5) defines the expected error (EE) of MODIS relative to AERONET. For valid AOD data, the requirement is that 66% of the data fall within the EE envelope [34].
(2)
(3)
(4)
(5)
where and are the covariance and the variance, respectively. In our case, x represents the AOD measured from AERONET.
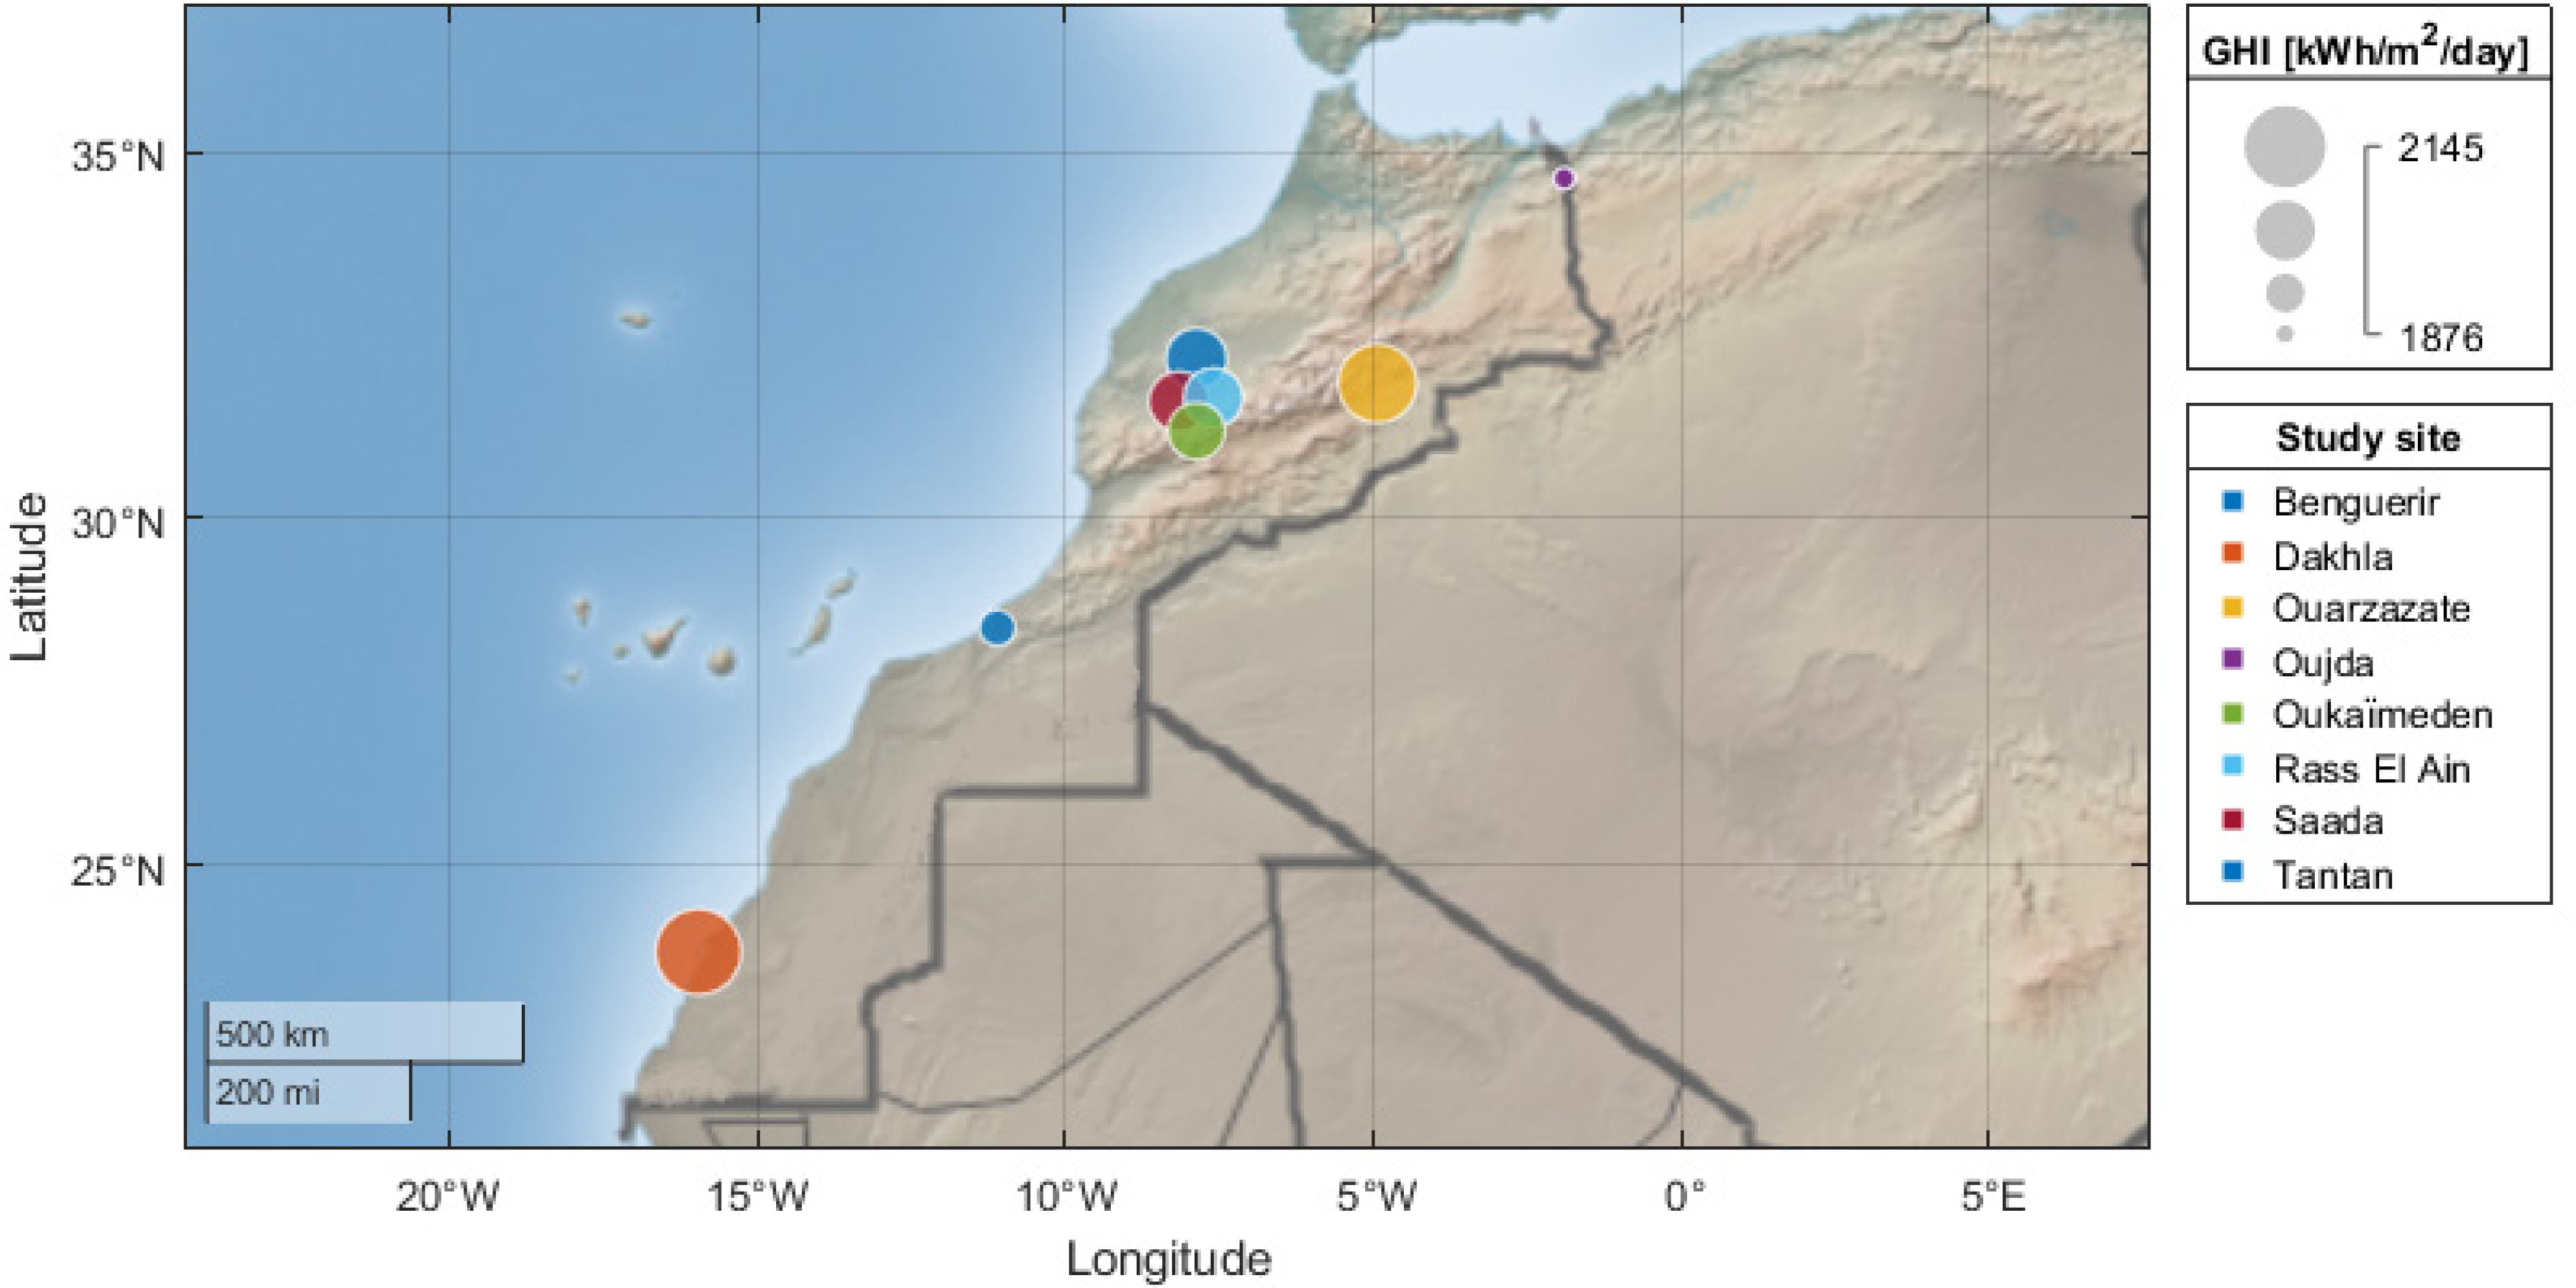
The Morocco case study evaluated aerosols' impact on solar radiation attenuation. Morocco's geographical location has significant solar potential and is characterized by predominantly clear sky conditions [35], [36]. The country is susceptible to high aerosols and suffers from Saharan desert dust episodes and sandstorms [16]. The AERONET network has six sites in Morocco that will be used to validate MODIS. Figure 2 shows the Morocco map with the location of Moroccan AERONET sites. The diameter of bubbles refers to the annual GHI values estimated by Solargis [37]. Table 2 lists all six AERONET sites distributed in Morocco, the period available for each site, and the climate type of each location. The AERONET sites in Morocco are characterized by different climate types, enabling a more comprehensive validation of the MODIS aerosol data. Benguerir and Tantan sites are not part of the AERONET networks but will help investigate AOD's impact on solar radiation, as these sites possess ground meteorological stations. Tantan (28.49°N, 11.32°W, 75 m) is in the south of Morocco, near the seashore on the Atlantic coast. Tantan has a hot desert climate (BWh) with a hot and long summer and a short, cold, and dry winter. Benguerir (32.12° N, 7.94°W, 450 m) is located in the mid-south of Morocco and has a BSh climate that is semi-arid, dry with a high insolation rate.
The geographical location of the AERONET study sites where the size of the bubbles corresponds to the intensity of the annual average of GHI estimated by Solargis [37]; Tantan and Benguerir are not part of the AERONET network
Geographic information and time range of available data at AERONET sites
AERONET site |
Latitude |
Longitude |
Time range |
Climate type |
|---|---|---|---|---|
Ouarzazate |
30.92°N |
6.91°W |
02/2012 − 06/2015 |
BWh |
Saada |
31.62°N |
8.15°W |
01/2012 − 09/2018 |
BSh |
Oujda |
34.65°N |
1.89°W |
01/2011 − 03/2016 |
BSk |
Dakhla |
23.71°N |
15.95°W |
01/2002 − 12/2014 |
BWh |
Ras El Ain |
31.67°N |
7.59°W |
03/2006 − 07/2007 |
BSh |
Oukaimden |
31.20°N |
7.86°W |
01/2009 − 12/2009 |
BSh |
Tantan |
28.49°N |
11.32°W |
01/2017 − 12/2020 |
BWh |
Benguerir |
32.12°N |
7.94°W |
01/2017 − 12/2020 |
BSh |
This section presents the findings obtained during the study. First, the results of the MODIS validation by AERONET are presented, and then the AOD classification results are displayed. Finally, the impact of the AOD on solar radiation is examined.
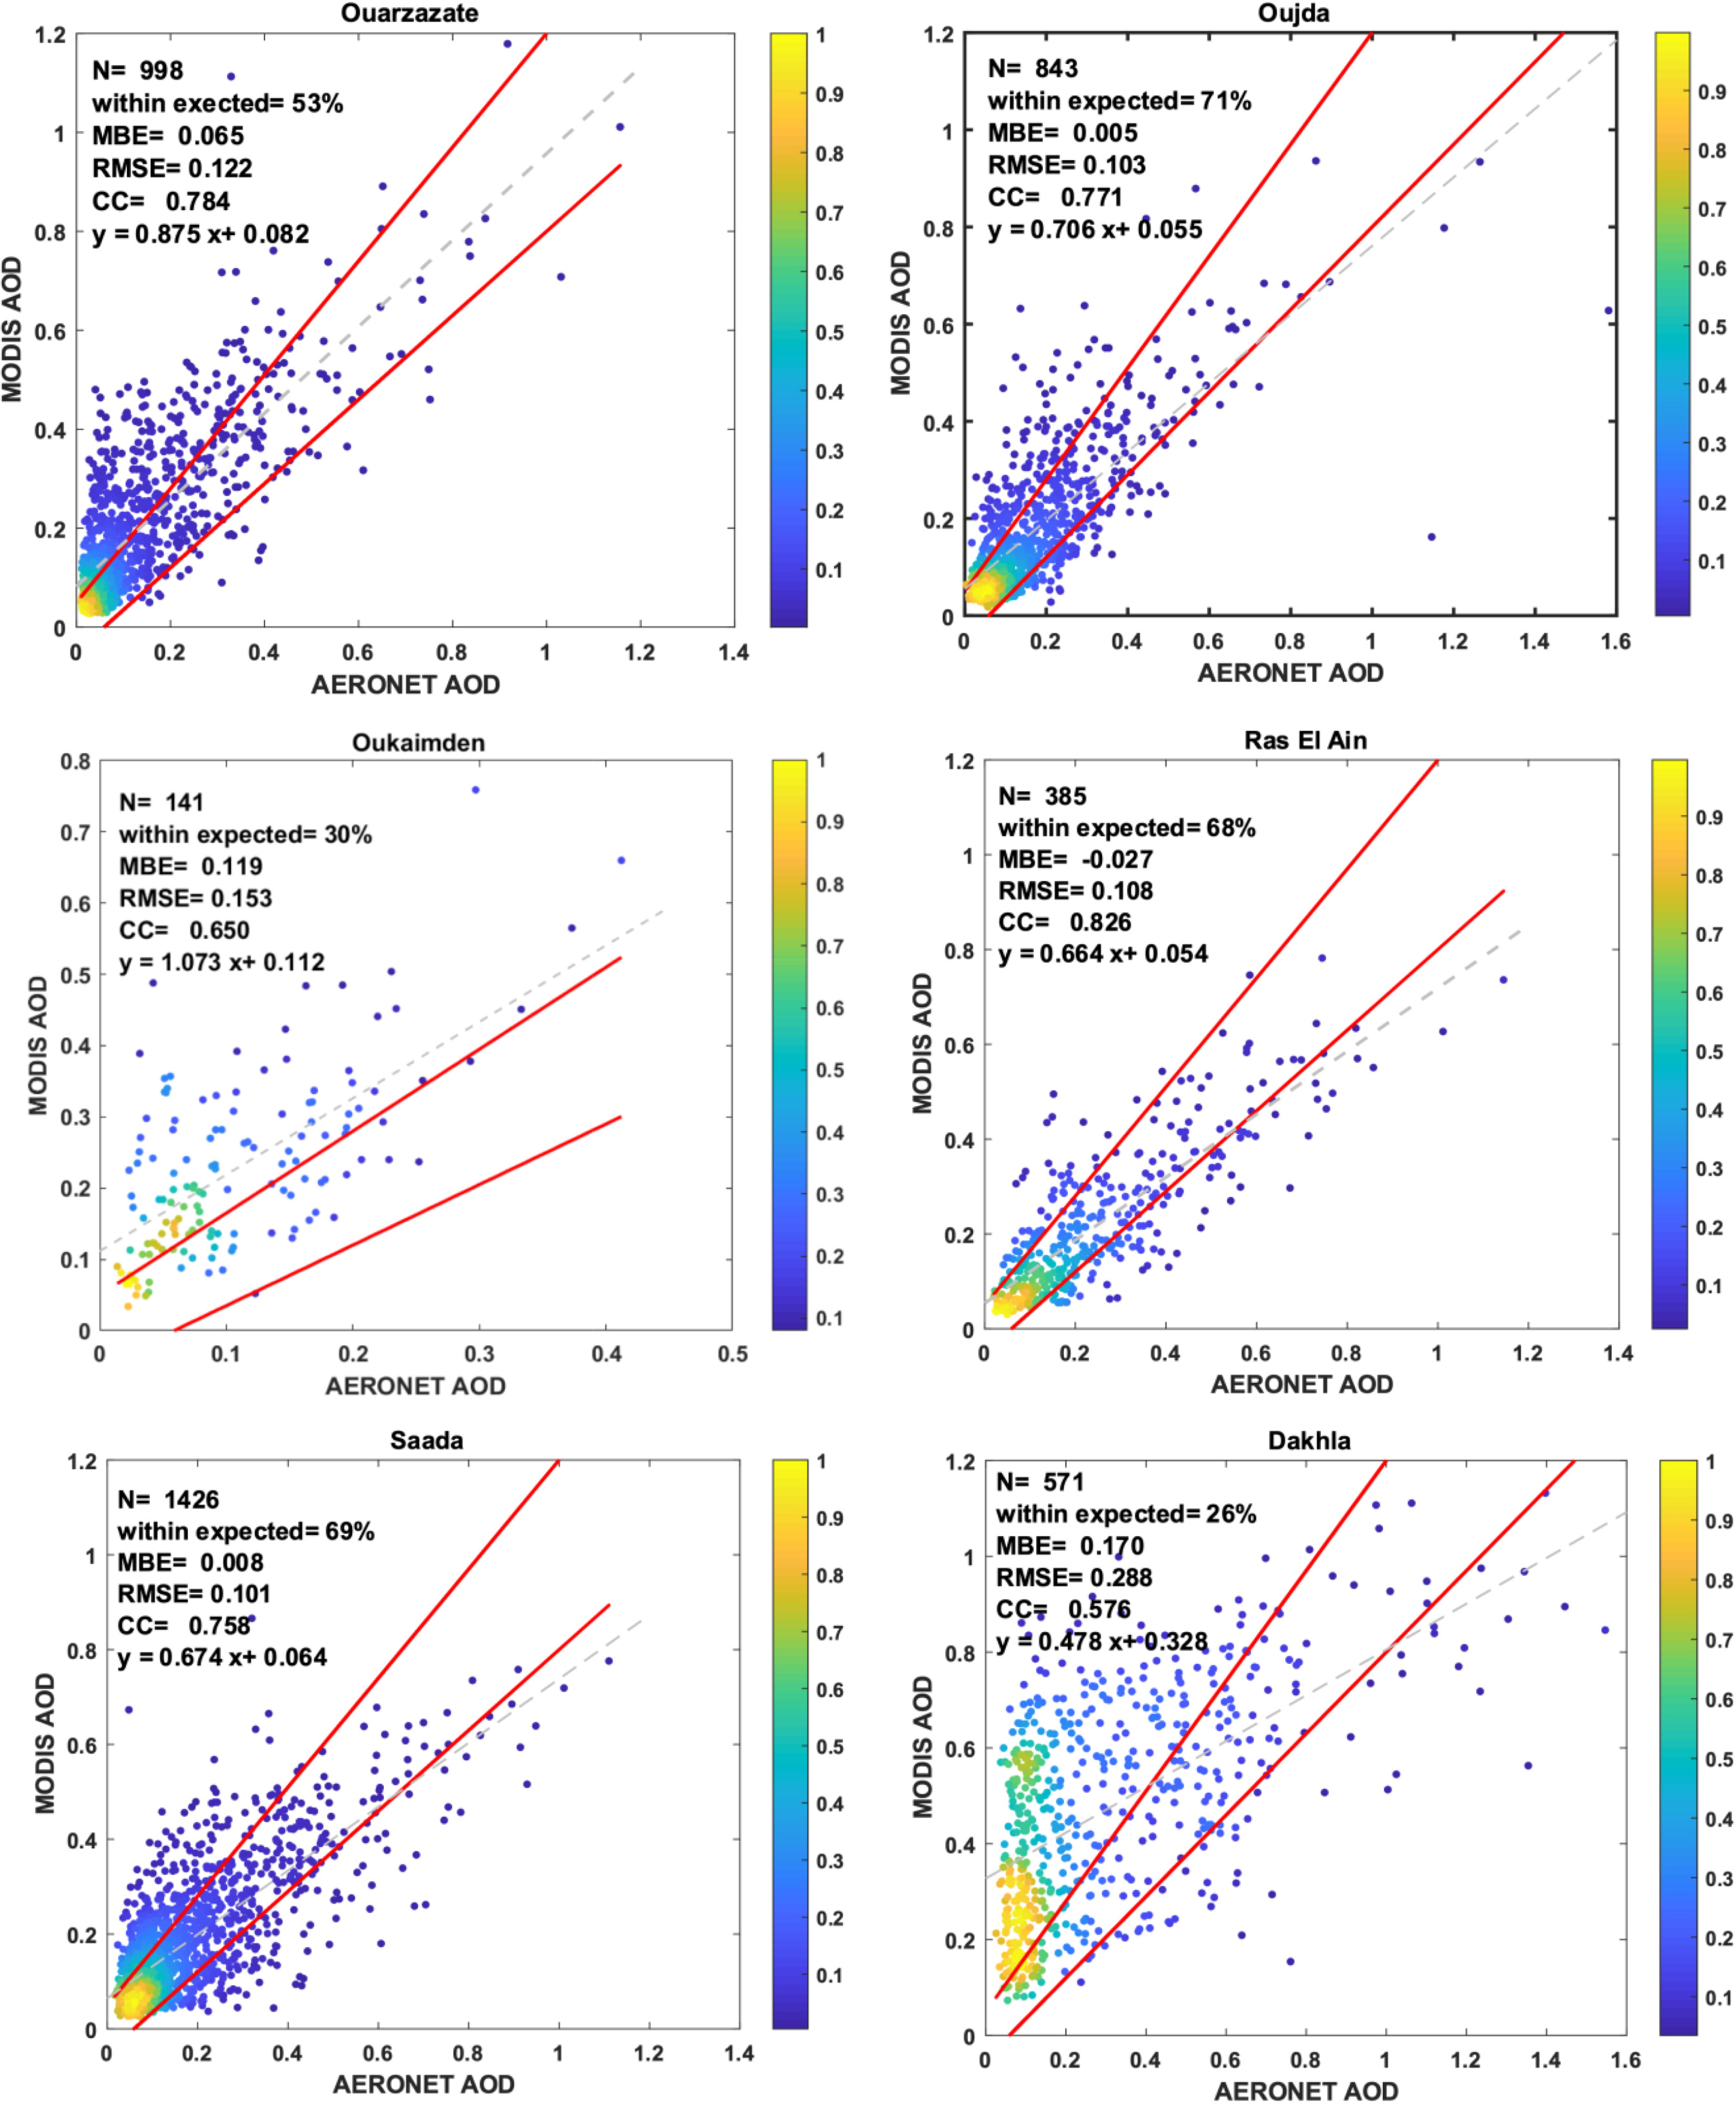
Figure 3 displays the density scatter plots between the daily average of MODIS and AERONET AOD at 550 nm. The dotted line shows the linear regression of the scatterplots represented by y-equation, and the two red lines represent the envelope of the expected error for MODIS. Table 3 represents the comparison results. For Oujda, Saada, and Rass El Ain sites, the outcome is that more than 66% of data points fall within the EE envelope with values of 71%, 69%, and 68%, with high correlation coefficients of 0.77, 0.75, and 0.82 and low MBE values of 0.005, 0.009, and −0.02, respectively. For Ouarzazate, although the correlation is 0.78, the percentage of values within EE is only 53%. For this site, MODIS overestimates AERONET with 44% of points outside the EE with an MBE of 0.06. Despite these errors, the performance of MODIS can still meet the requirements. For the Oukaimden site, only a few points were available, which makes MODIS validation challenging. Here, a large percentage of data is below the EE with a considerable error value of 0.11 and a low correlation coefficient of 0.65, implying MODIS does not perform well enough. In the case of the Dakhla site, a large percentage of data fell below the EE (65%), with a high MBE (0.17) and a low correlation coefficient (0.57). Moreover, MODIS cannot capture the variability of ground-based AOD. According to previous studies, the errors between MODIS and AERONET can be mainly due to the following reasons: aerosol model assumptions (0−20%), instrument calibration (2−5%), and pixel selection (0−10%) [38]. Except for the Oukaimden and Dakhla sites, the statistical performances show that MODIS AOD retrieval is relatively satisfactory over the AERONET study sites.
Validation results of AOD MODIS by AOD AERONET at 550 nm
Site |
#N |
MBE |
RMSE |
CC |
|---|---|---|---|---|
Ouarzazate |
998 |
0.065 |
0.122 |
0.78 |
Oujda |
843 |
0.005 |
0.103 |
0.77 |
Oukaimden |
141 |
0.119 |
0.153 |
0.65 |
Ras El Ain |
385 |
-0.027 |
0.108 |
0.82 |
Saada |
1426 |
0.009 |
0.101 |
0.76 |
Density scatters plot between daily AOD from AERONET and MODIS at 550 nm for all six AERONET sites over Morocco; the two red lines represent the envelope of the expected error (EE) for MODIS, and the dotted grey line represents the regression result
The classification of aerosol types is of great importance for climate modelling [39] as it improves the accuracy of aerosol radiative impact assessment. In this section, each site's aerosol classification was performed to identify the region's prevalent aerosol type. The classification uses the relationship between the AOD and the Angström exponent to indicate the size of AOD particles by setting threshold values where each group represents an AOD type. This classification builds on previous studies [40], [41] to define the appropriate thresholds for each type of AOD.
The selected threshold values are as follows:
clean continental (CC): AOD < 0.2 with AE > 1.0
clean marine (CM): AOD < 0.2 with AE < 0.9
anthropogenic/burning (AB): AOD > 0.3 with AE > 1.0
coarse/dust (CD): AOD > 0.6 with AE < 0.7.
The remaining cases not belonging to any of the above groups are characterized as mixed types (Mix) or indeterminate aerosols.
Scatter plots between AOD at 550 nm and Angström exponent of 440−870 nm and various aerosol types
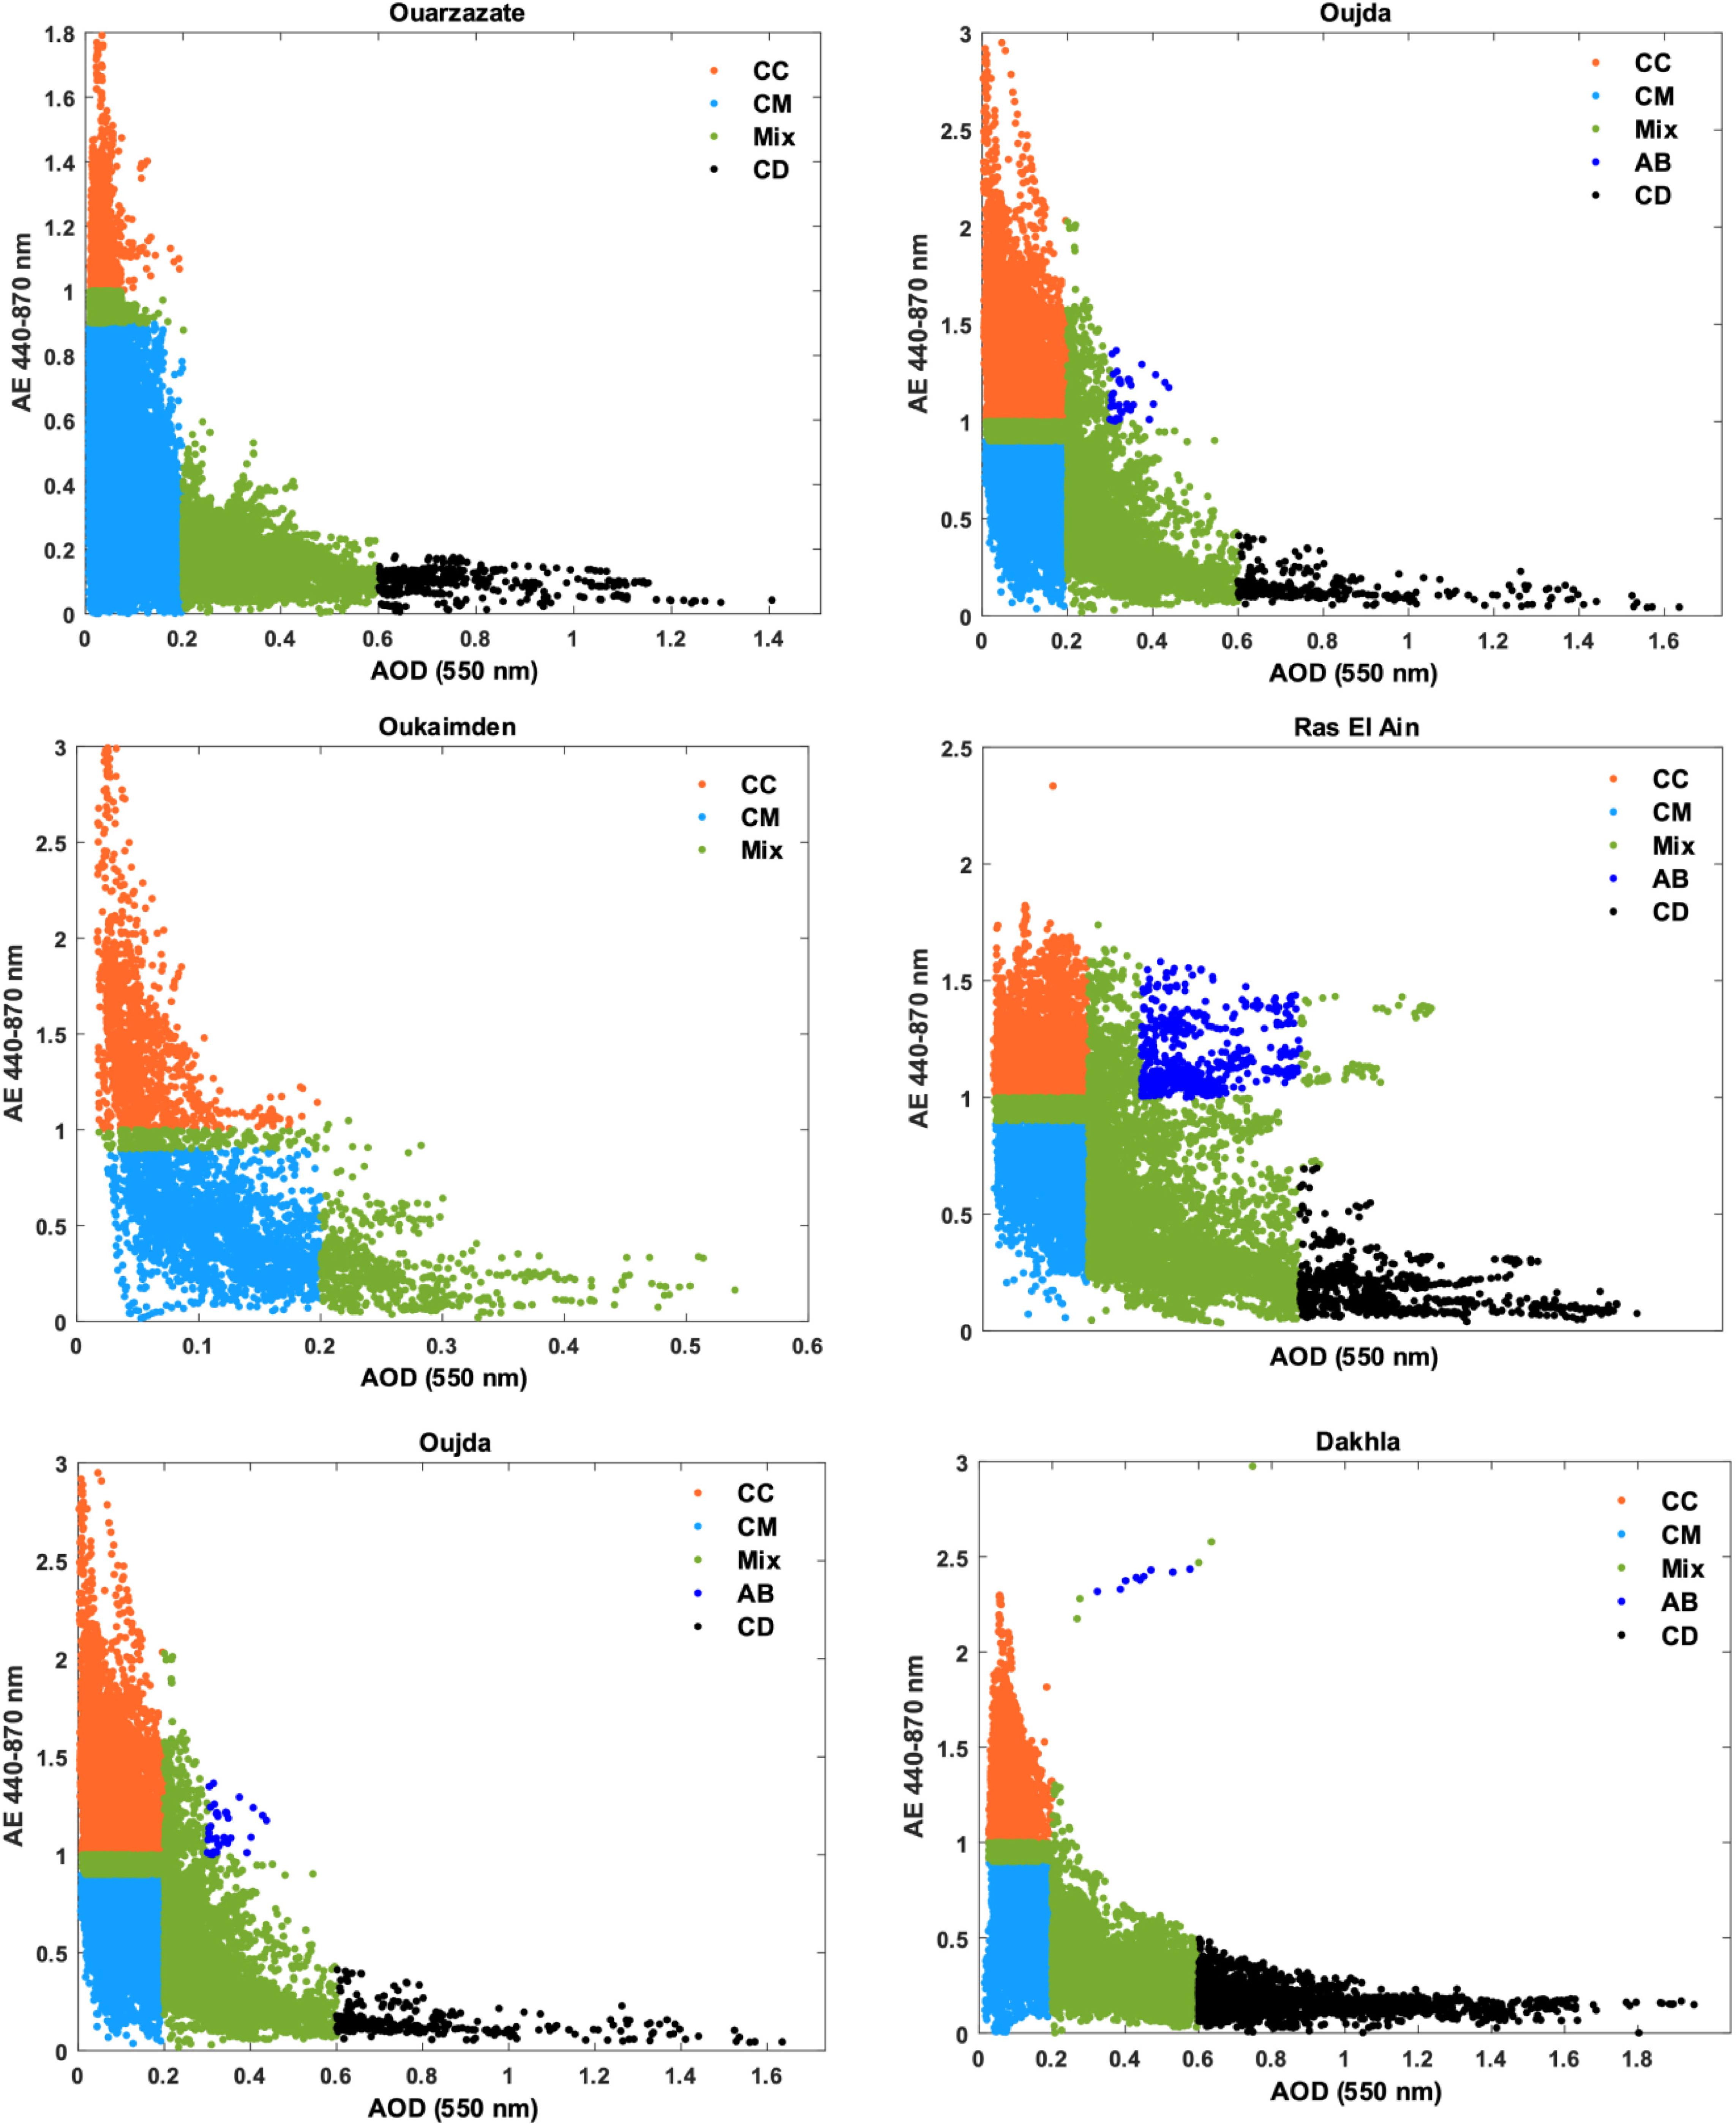
Figure 4 shows scatter plots between AOD at 550 nm and Angström exponent of 440−870 nm, indicating various aerosol types' contribution for each AERONET site. It was found that every type of aerosol makes contributions with different values for each site.
The graphs show that the dominant aerosol types at most sites are CM (35%−73%) and MIX (32%−50%). On the other hand, CD (1%−12%) and AB (0%−4%) are the least frequent types. The most significant percentage of AOD of CM type was recorded for the Ouarzazate site with a percentage of 73%, Oukaimden (51%), Saada (51%), and Dakhla (36%). In comparison, the lowest contribution was recorded at the Rass El Ain site (23%). MIX aerosols are present in large percentages at Rassel Ain (50%) and Saada (32%). For the site of Oujda, CC (32%), CM (35%), and MIX (33%) aerosol types are present with nearly equal contributions: The largest percentage of CD (12%) was recorded at the Dakhla site. In contrast, only small percentages of CD (1%−5%) are present for the other sites. The contribution of aerosols type AB is absent in most sites, except for Rass El Ain, where a contribution of 4% was observed.
The purpose of validating MODIS with AERONET ground-based measurements was to exploit its data to investigate the impact of AOD on solar irradiance. The validation was done using solar irradiance measurements available in Tantan and Benguerir sites. As depicted in Figure 5, the study sites are located in a region with high AOD at 550 nm averages, especially during May, June, July, and August.
Monthly AOD from MODIS [42]
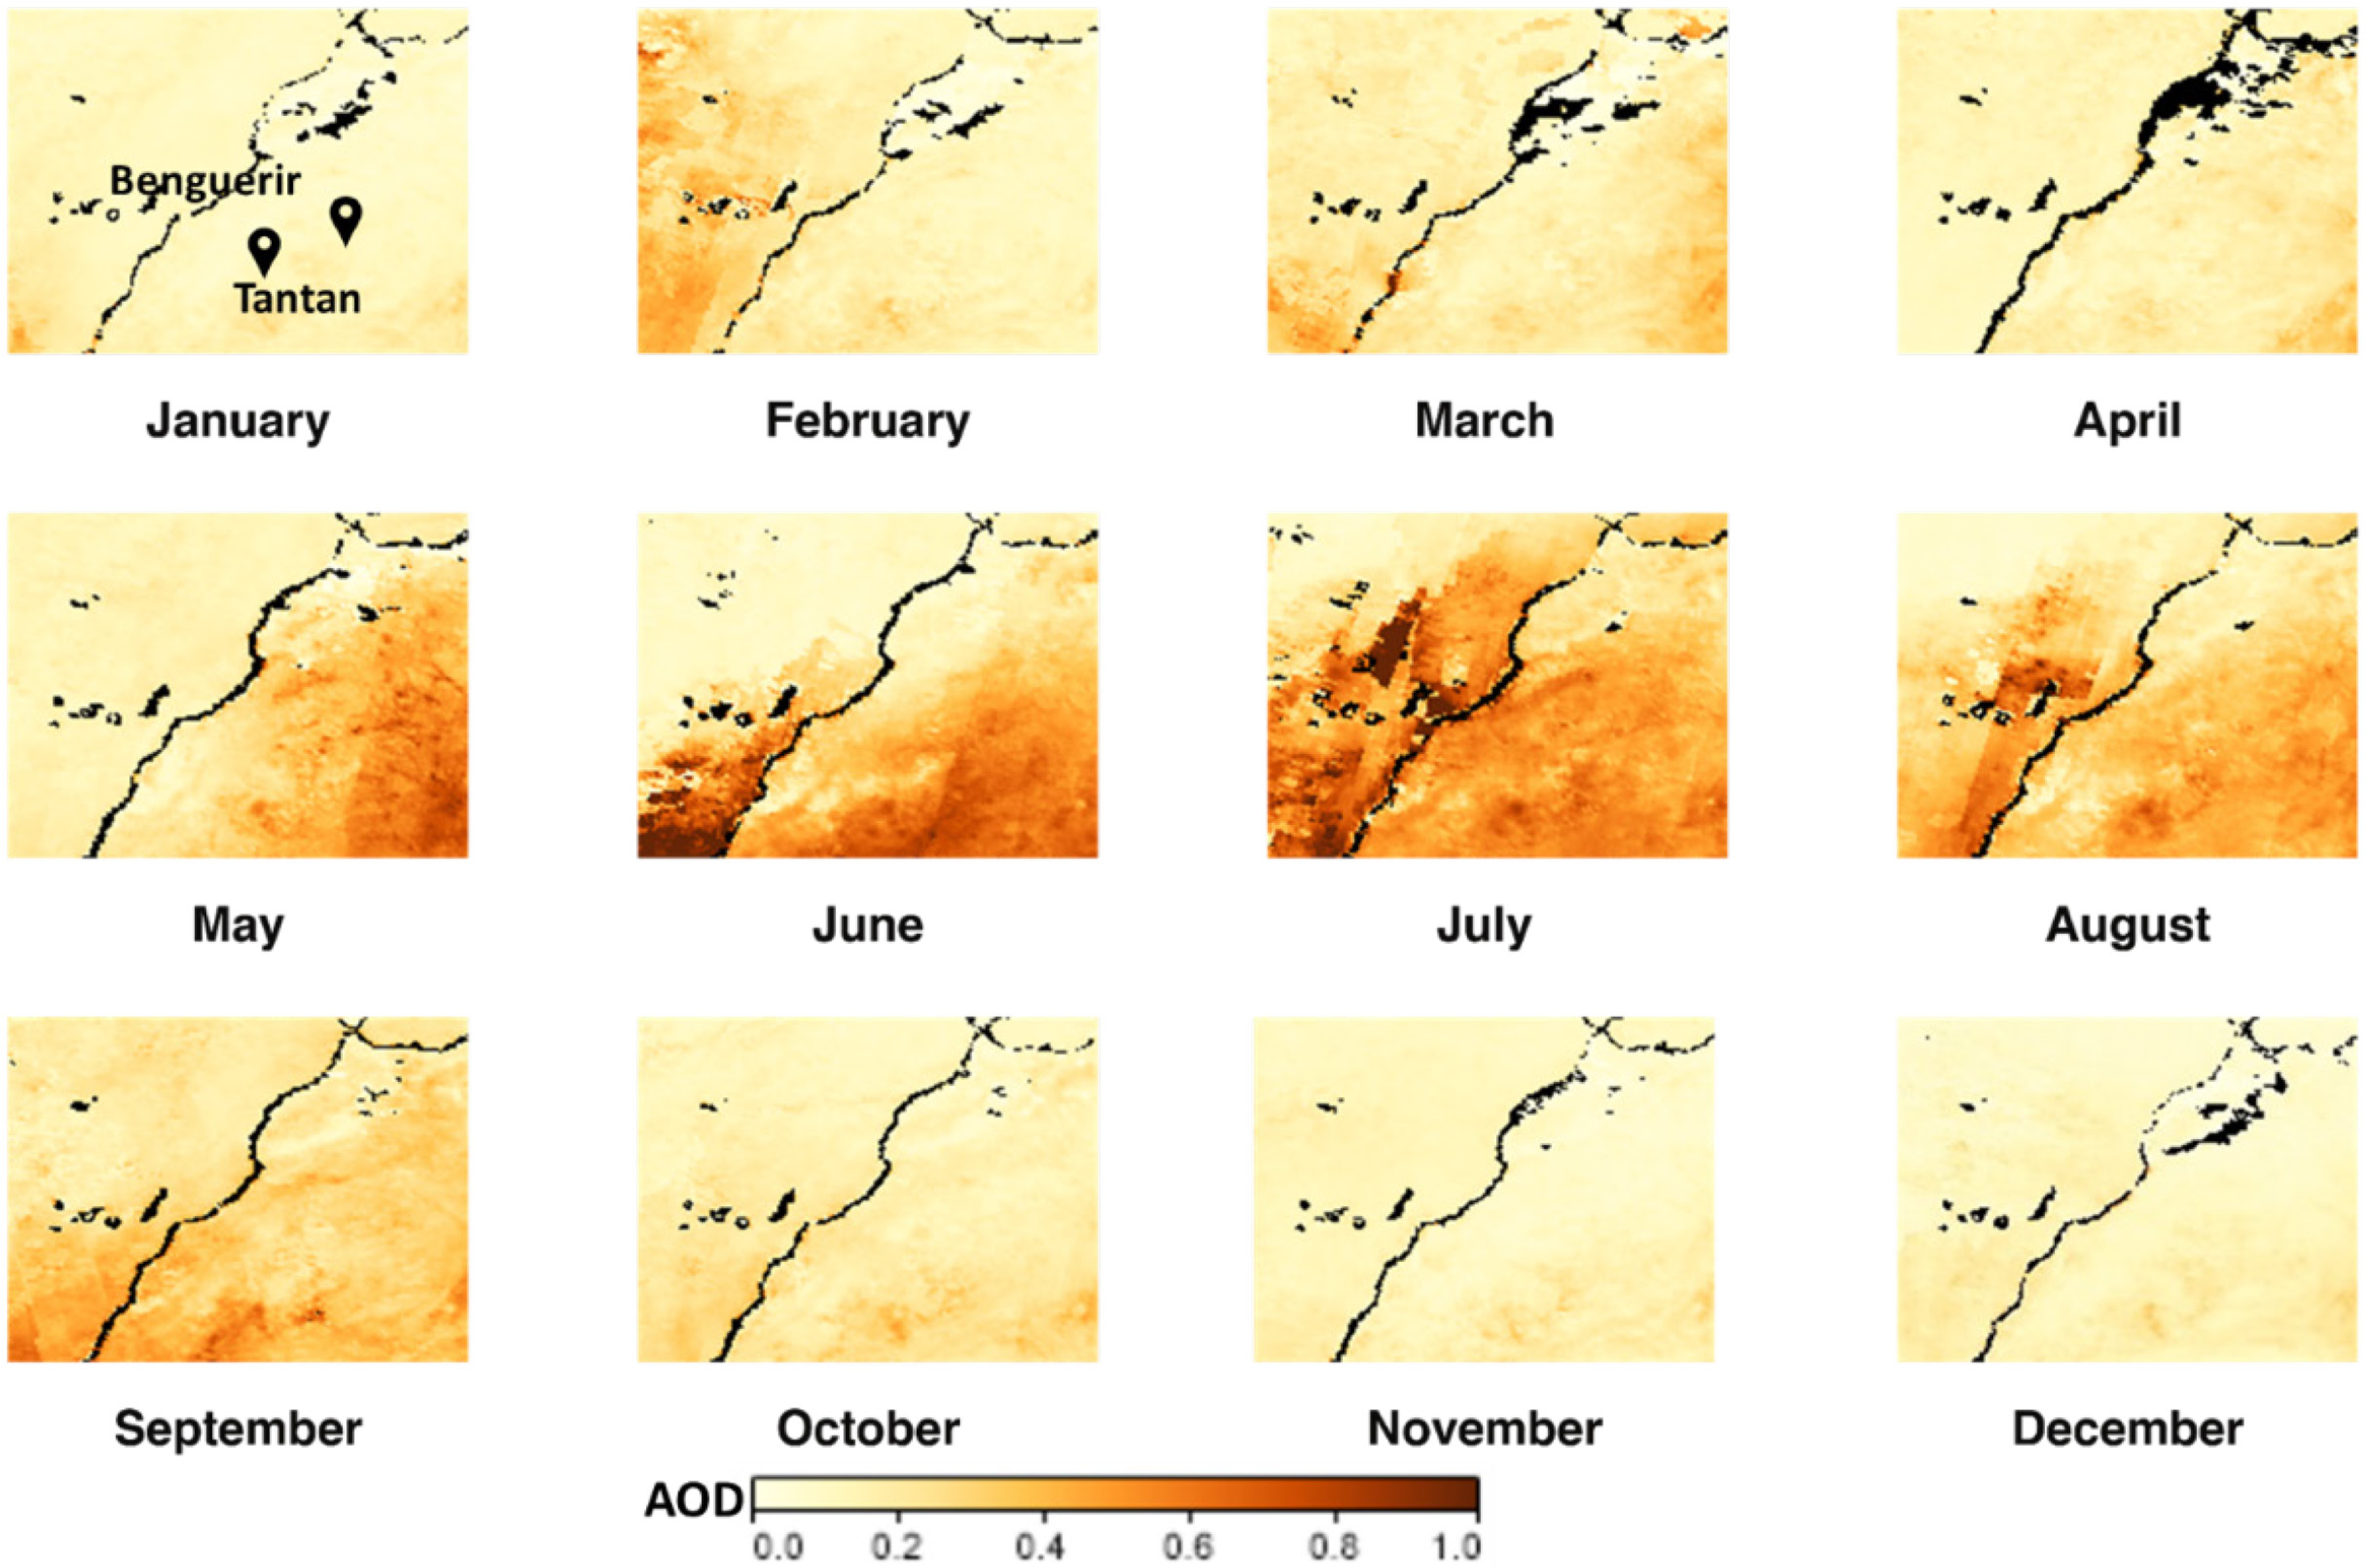
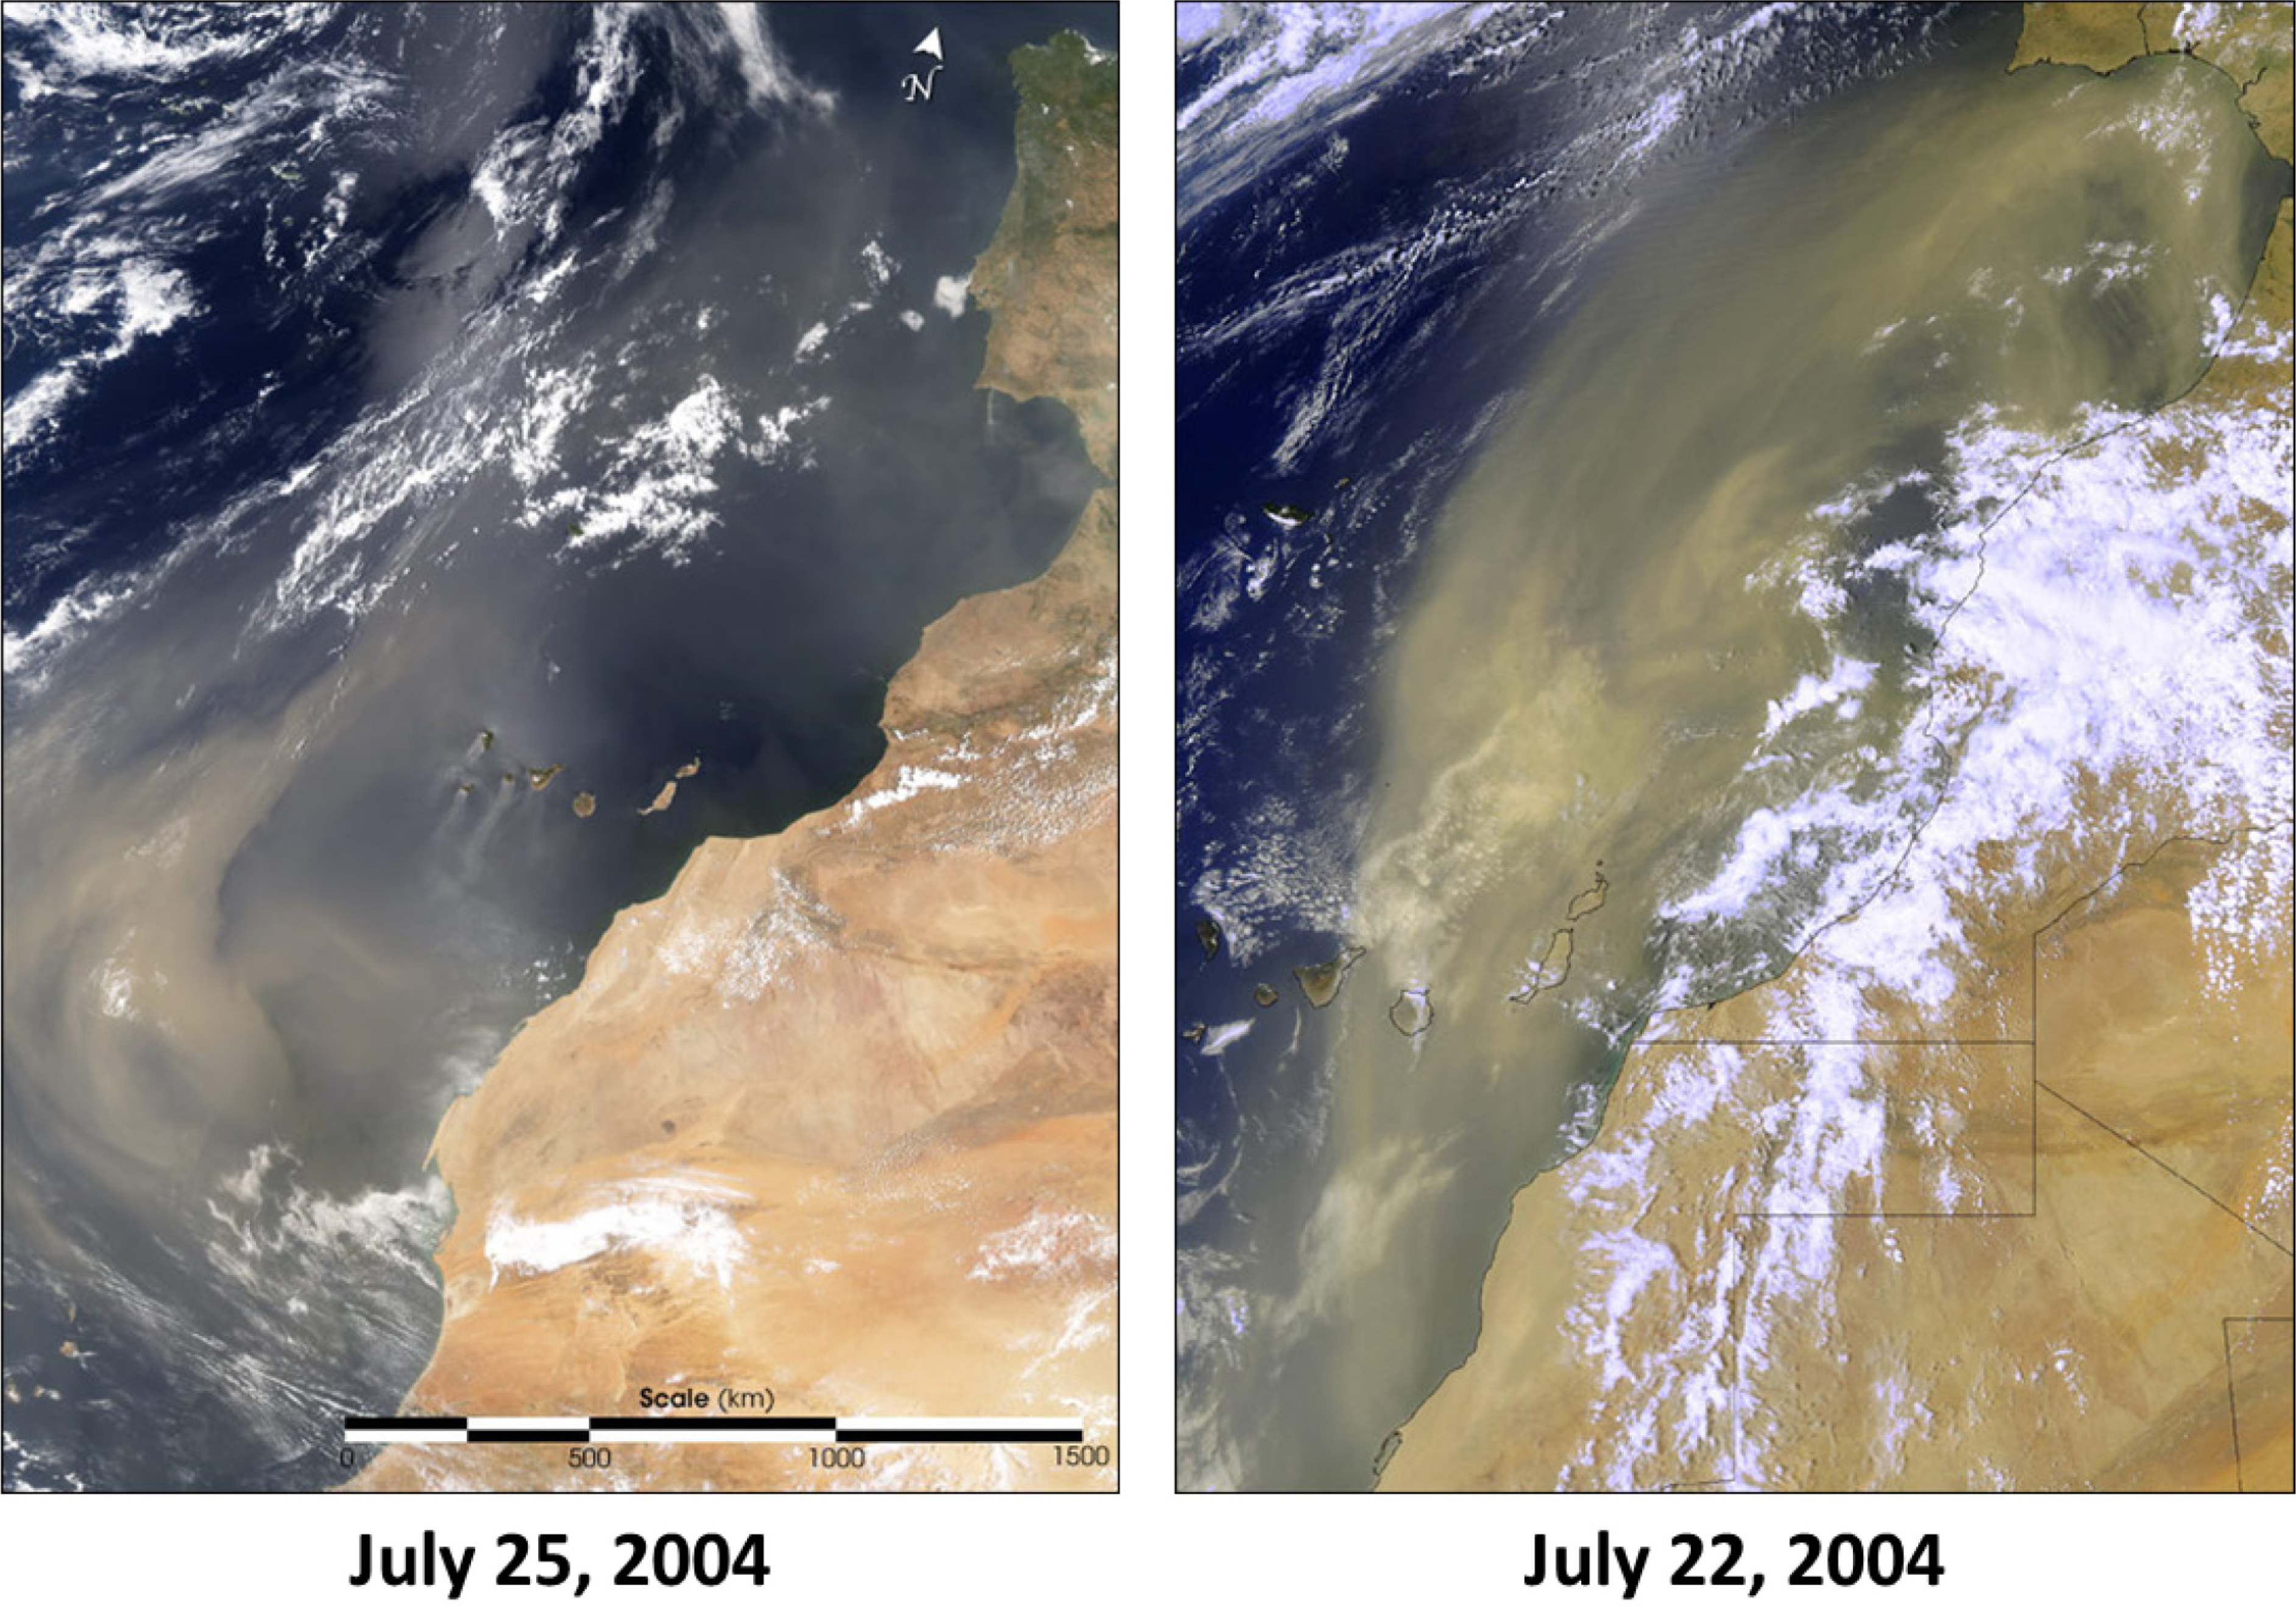
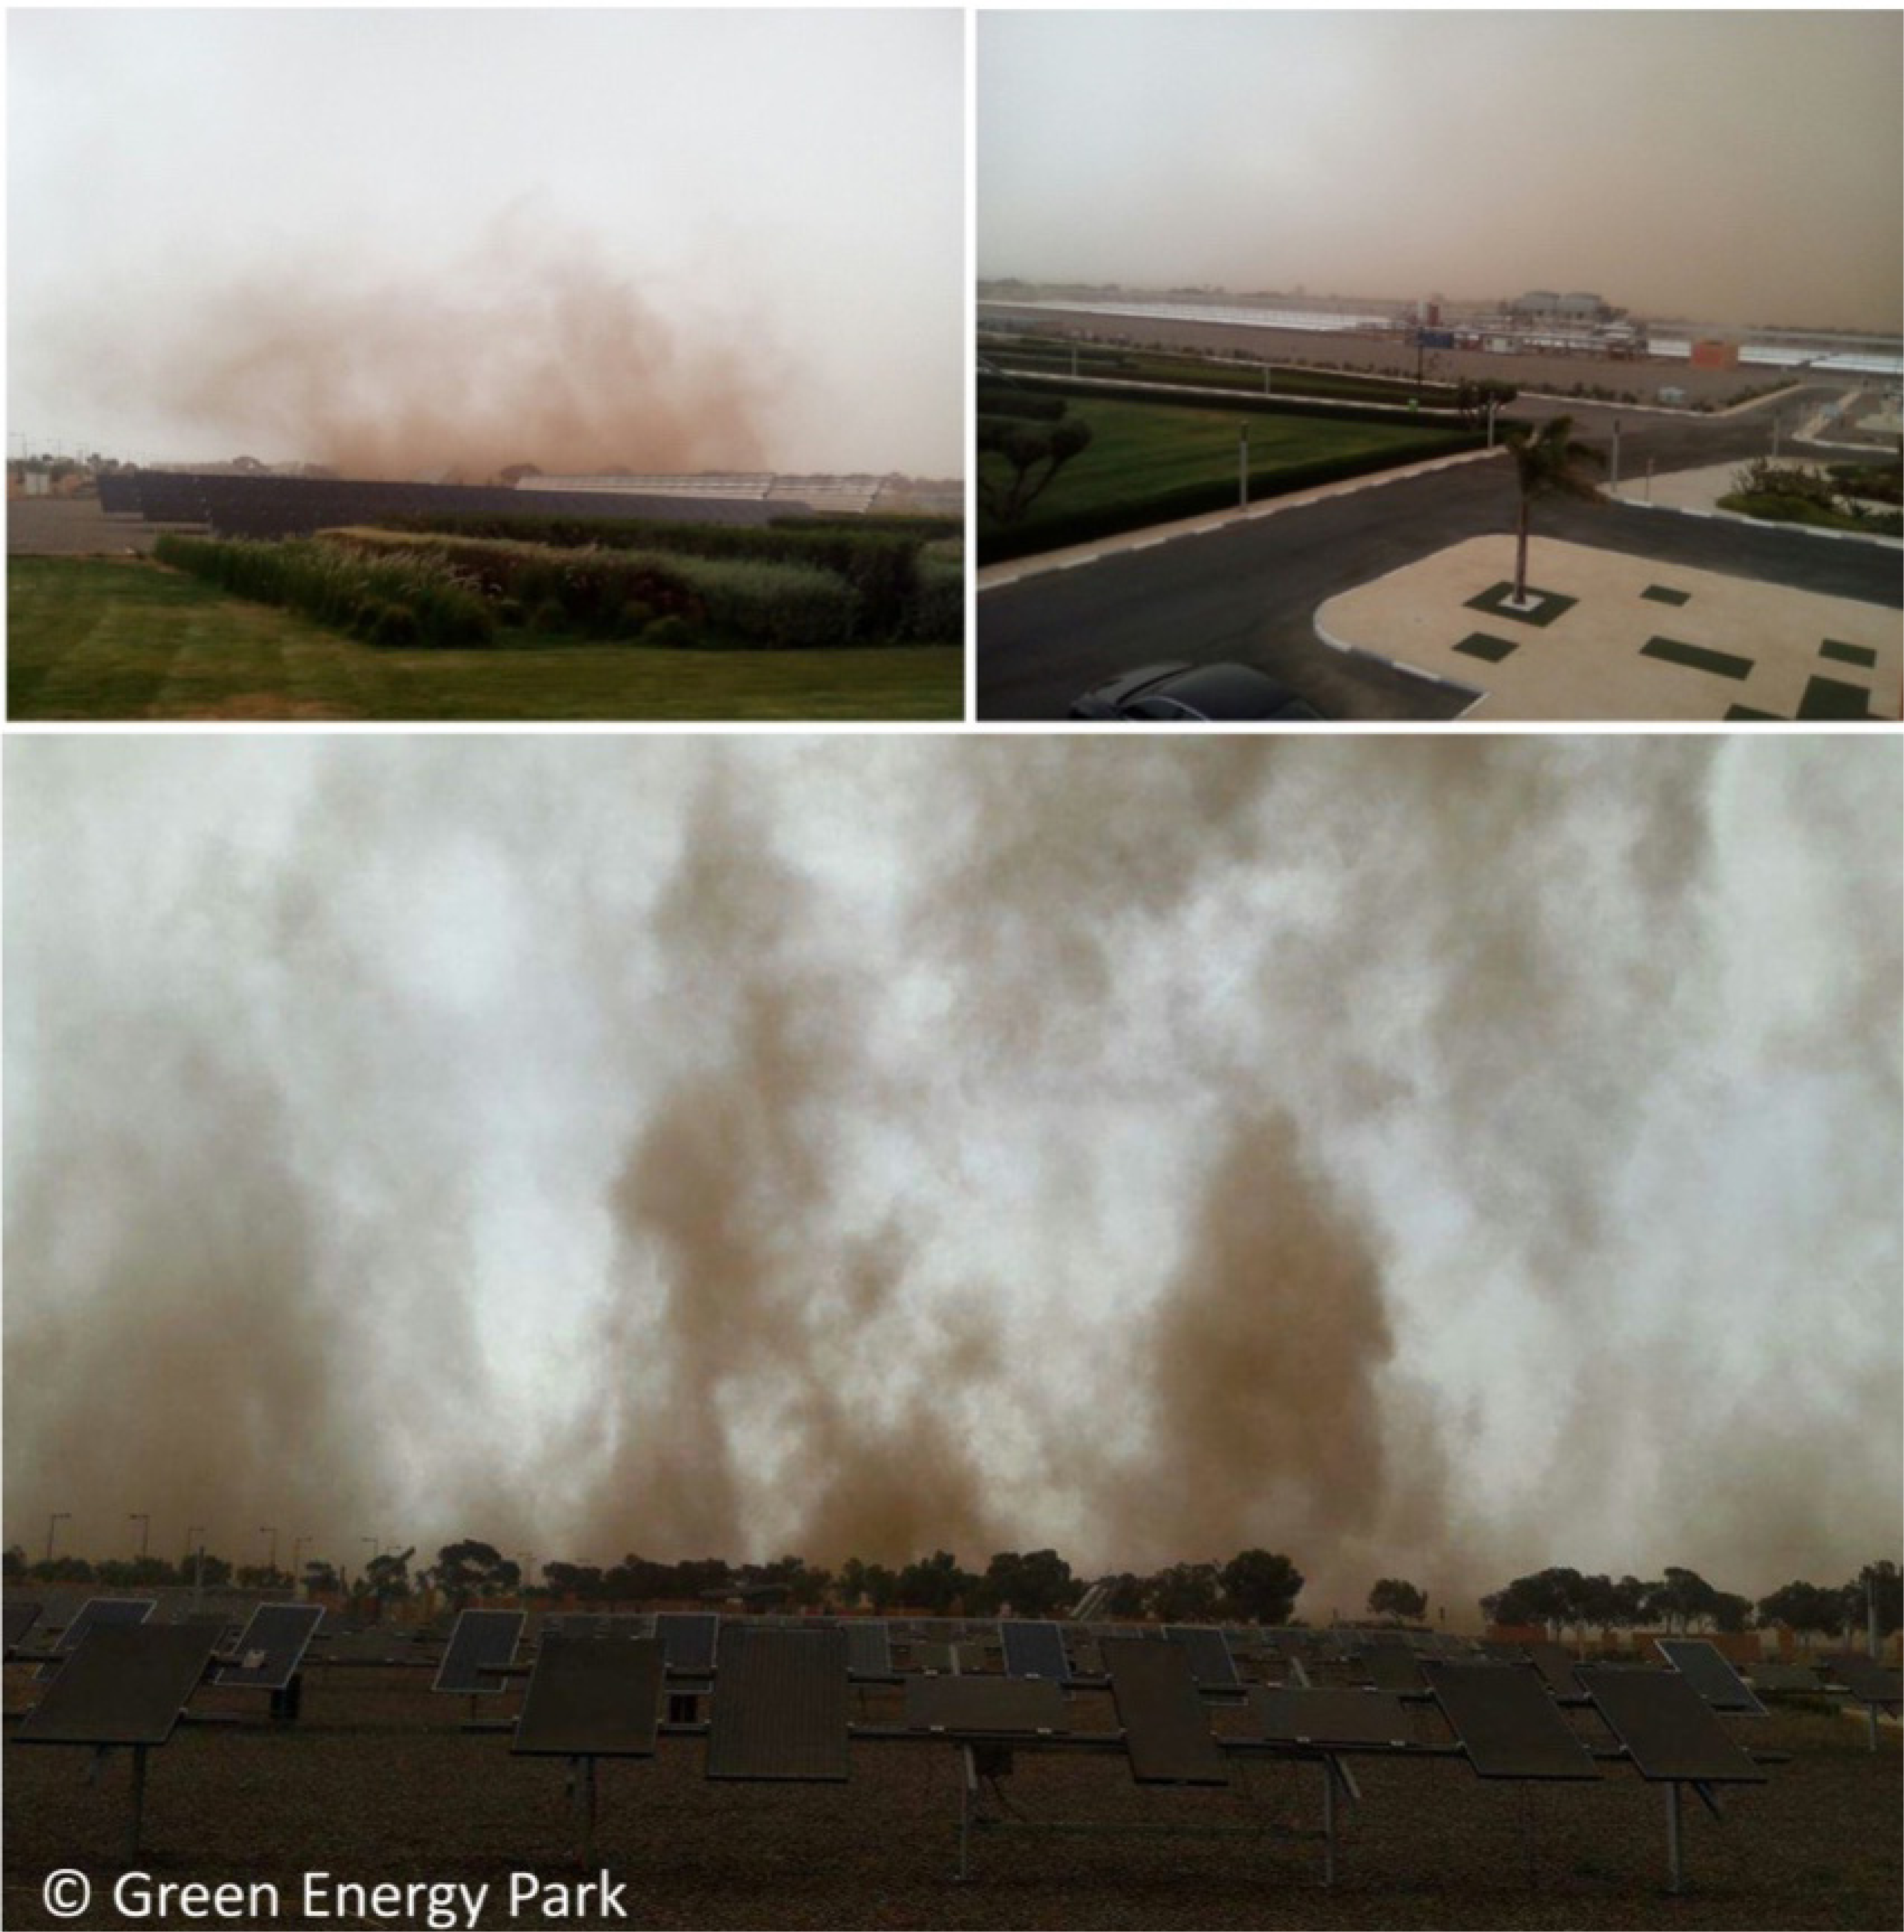
Figure 6 represents the monthly variations of AOD for the two sites from 01/01/2017 to 31/12/2020, collected from MODIS [42], while Table 4 represents the seasonal patterns of AOD for each station. Figure 6 and Table 4 show a high AOD in summer and a low AOD in winter and fall for both stations. The AOD values are very high in the Tantan site in summer, with a value of 0.50, which can be explained by the phenomena of transport of aerosols from the desert to the west (Figure 7). While for the same summer, the AOD is 0.22 for Benguerir. The minimum AOD value appears in autumn with a value of 0.17 for the Tantan site and 0.11 for the Benguerir site. Figure 7 shows a large plume of African desert dust blowing westward over the Atlantic Ocean of the Moroccan coast and arcing northeastward to the Canary Islands in the eastern Atlantic [43]. Figure 8 displays pictures taken at the Green Energy Park (Benguerir) during a dust storm. In summer, cloudy conditions are rare in Morocco, and aerosols may have a crucial role in attenuating the solar radiation that reaches the earth's surface. The effect of aerosols resides not only in the attenuation of solar radiation. They are also responsible for the performance degradation of PV panels and the decrease of CSP mirrors reflectance that directly affects the energy production.
Monthly variability of AOD value at 550 nm at Benguerir (left) and Tantan (right)

Seasonal values of AOD 550 at Benguerir and Tantan
|
Winter |
Spring |
Summer |
Autumn |
|---|---|---|---|---|
Benguerir |
0.11 |
0.17 |
0.22 |
0.11 |
Tantan |
0.22 |
0.33 |
0.50 |
0.17 |
Dust/aerosol transport to the Canary Islands from the Sahara (image from MODIS [43])
Real pictures taken at the Green Energy Park (Benguerir, Morocco) during a dust storm on 21 and 22 April 2018
Solar irradiance is sensitive to various meteorological parameters. In addition to solar geometry parameters such as solar zenith angle, clouds represent the major factor attenuating solar radiation. However, atmospheric aerosols mainly affect solar irradiance in regions with low cloud cover and predominantly clear skies, such as Morocco [5].
Under clear skies, atmospheric aerosols are considered the most important factor affecting solar radiation. Depending on their chemical and physical properties, they scatter and/or absorb solar radiation. Aerosols tend to decrease the DNI and increase the DHI. Since the GHI is the sum of the two components, it is less impacted when compared to DNI. Therefore, technologies using GHI such as PV are more advantageous than those using DNI like solar thermal or concentrated PV.
Photovoltaic and thermal power production strongly correlate to GHI and DNI, respectively. This study aims to evaluate the impact of AOD on these two components of solar irradiance using one-year data for each site (Benguerir and Tantan). The study period for Benguerir is from 01/01/2020 to 31/12/2020, while for Tantan, the data cover the period between 01/01/2017 and 31/12/2017. Irradiance data were collected from ground-based weather stations, while AOD data for the same periods came from MODIS.
The assessment of the impact of AOD considers only clear sky days. Such days are selected using the clear sky index Kt defined by the ratio between the GHI and the GHIcls under clear sky conditions, see eq. (6). GHIcls values are obtained from the clear sky model McClear [44]. Clear days correspond to a Kt > 0.7 [45], [46].
(6)
Loss coefficients are defined to calculate the loss percentage of the irradiance caused by aerosols. For GHI, the loss coefficient LGHI is calculated according to global irradiance at the top of the atmosphere TOA. For DNI, the loss coefficient LDNI is calculated according to the extraterrestrial radiation on a normal plane E0. TOA and E0 are obtained from the SODA portal [47]. The loss percentages for GHI and DNI are represented by the equations below:
(7)
(8)
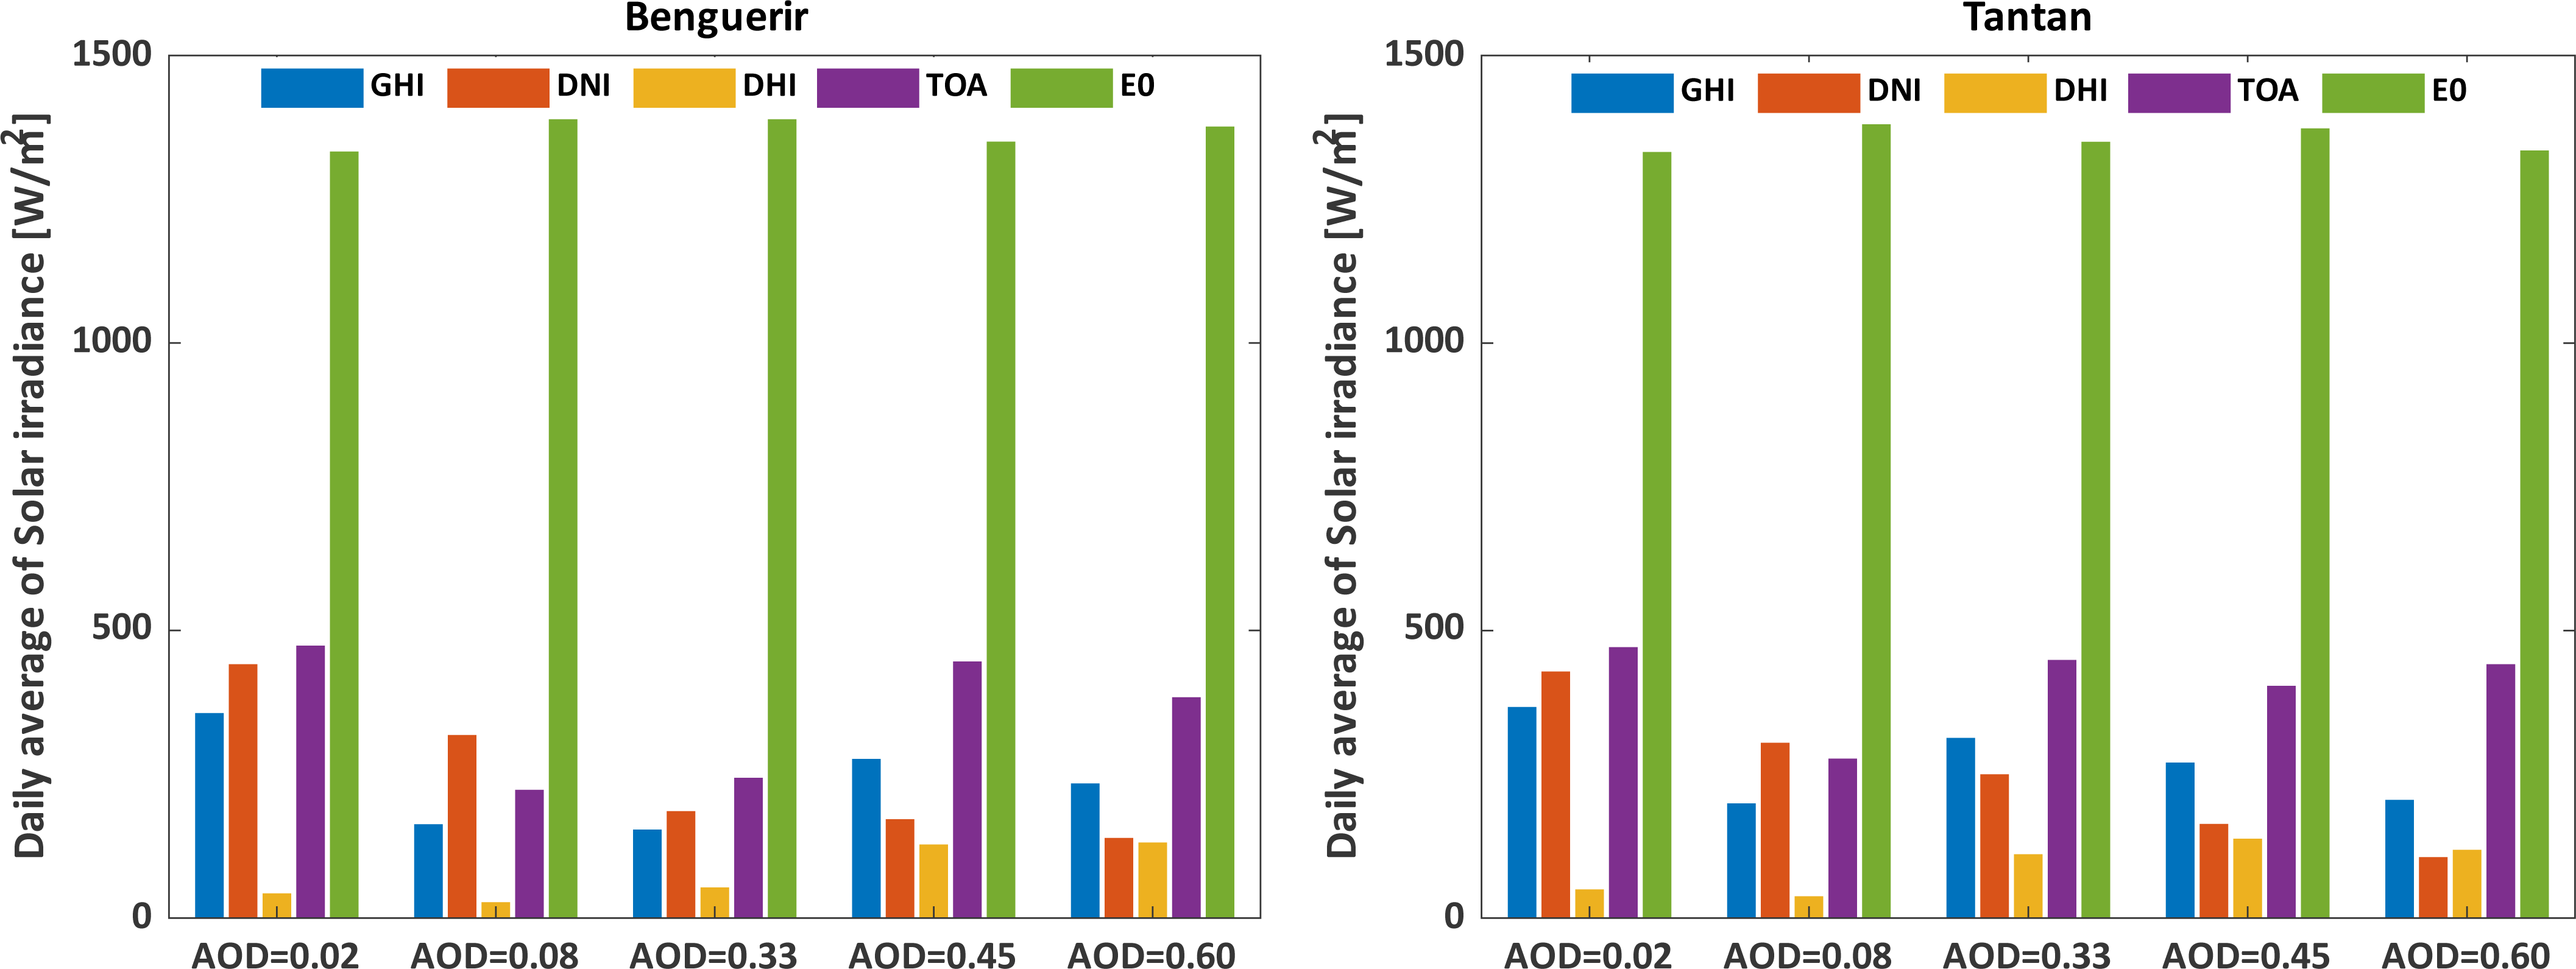
Figure 9 shows the variation of daily averages of GHI, DNI, and DHI according to different AOD values. An important feature is that the magnitude of the irradiance varies considerably with the AOD value. DNI is the most impacted component by AOD; its value decreases with the increase of aerosol content in the atmosphere, while DHI increases with the increase of AOD values. The GHI also decreases with increasing AOD but is less affected due to the compensation effect than the DNI. For the Benguerir site, the DNI decreases from 440 W/m2 to 137 W/m2, the GHI from 345 W/m2 to 232 W/m2 for AOD values of 0.02 to 0.6, respectively. Similar trends appear in the Tantan site: the DNI increases from 427 W/m2 to 104 W/m2, the GHI from 365 W/m2 to 204 W/m2, and the DHI increases from 48 to 117 for an AOD of 0.02 and 0.6, respectively.
Variations of solar irradiation components according to the AOD value under clear days for Benguerir and Tantan
For a deep characterization of AOD's impact on solar radiation, Figure 10 illustrates the losses rate values calculated from eq. (7) and eq. (8) for both DNI and GHI. Indeed, the results described in Figure 10 and Table 5 show that the loss rate of DNI is higher than that of GHI. The minimum loss values for DNI are 67.89% and 66.95% at AOD = 0.02 for Tantan and Benguerir sites, respectively. In contrast, the maximum values reach 92.15% and 89.97% for the AOD value of 0.6 for Tantan and Benguerir, respectively. In the case of GHI, at a low AOD value of 0.02, the losses are 22.14% for Tantan and 24.85% for Benguerir. For a higher AOD value of 0.6, the losses of GHI are 53.61% for Tantan and 39.18% for the site of Benguerir. The main conclusion is that DNI and GHI decrease with increasing aerosol content in the atmosphere while DHI increases with increasing AOD values.
The percentage of GHI and DNI loss due to AOD for Benguerir and Tantan
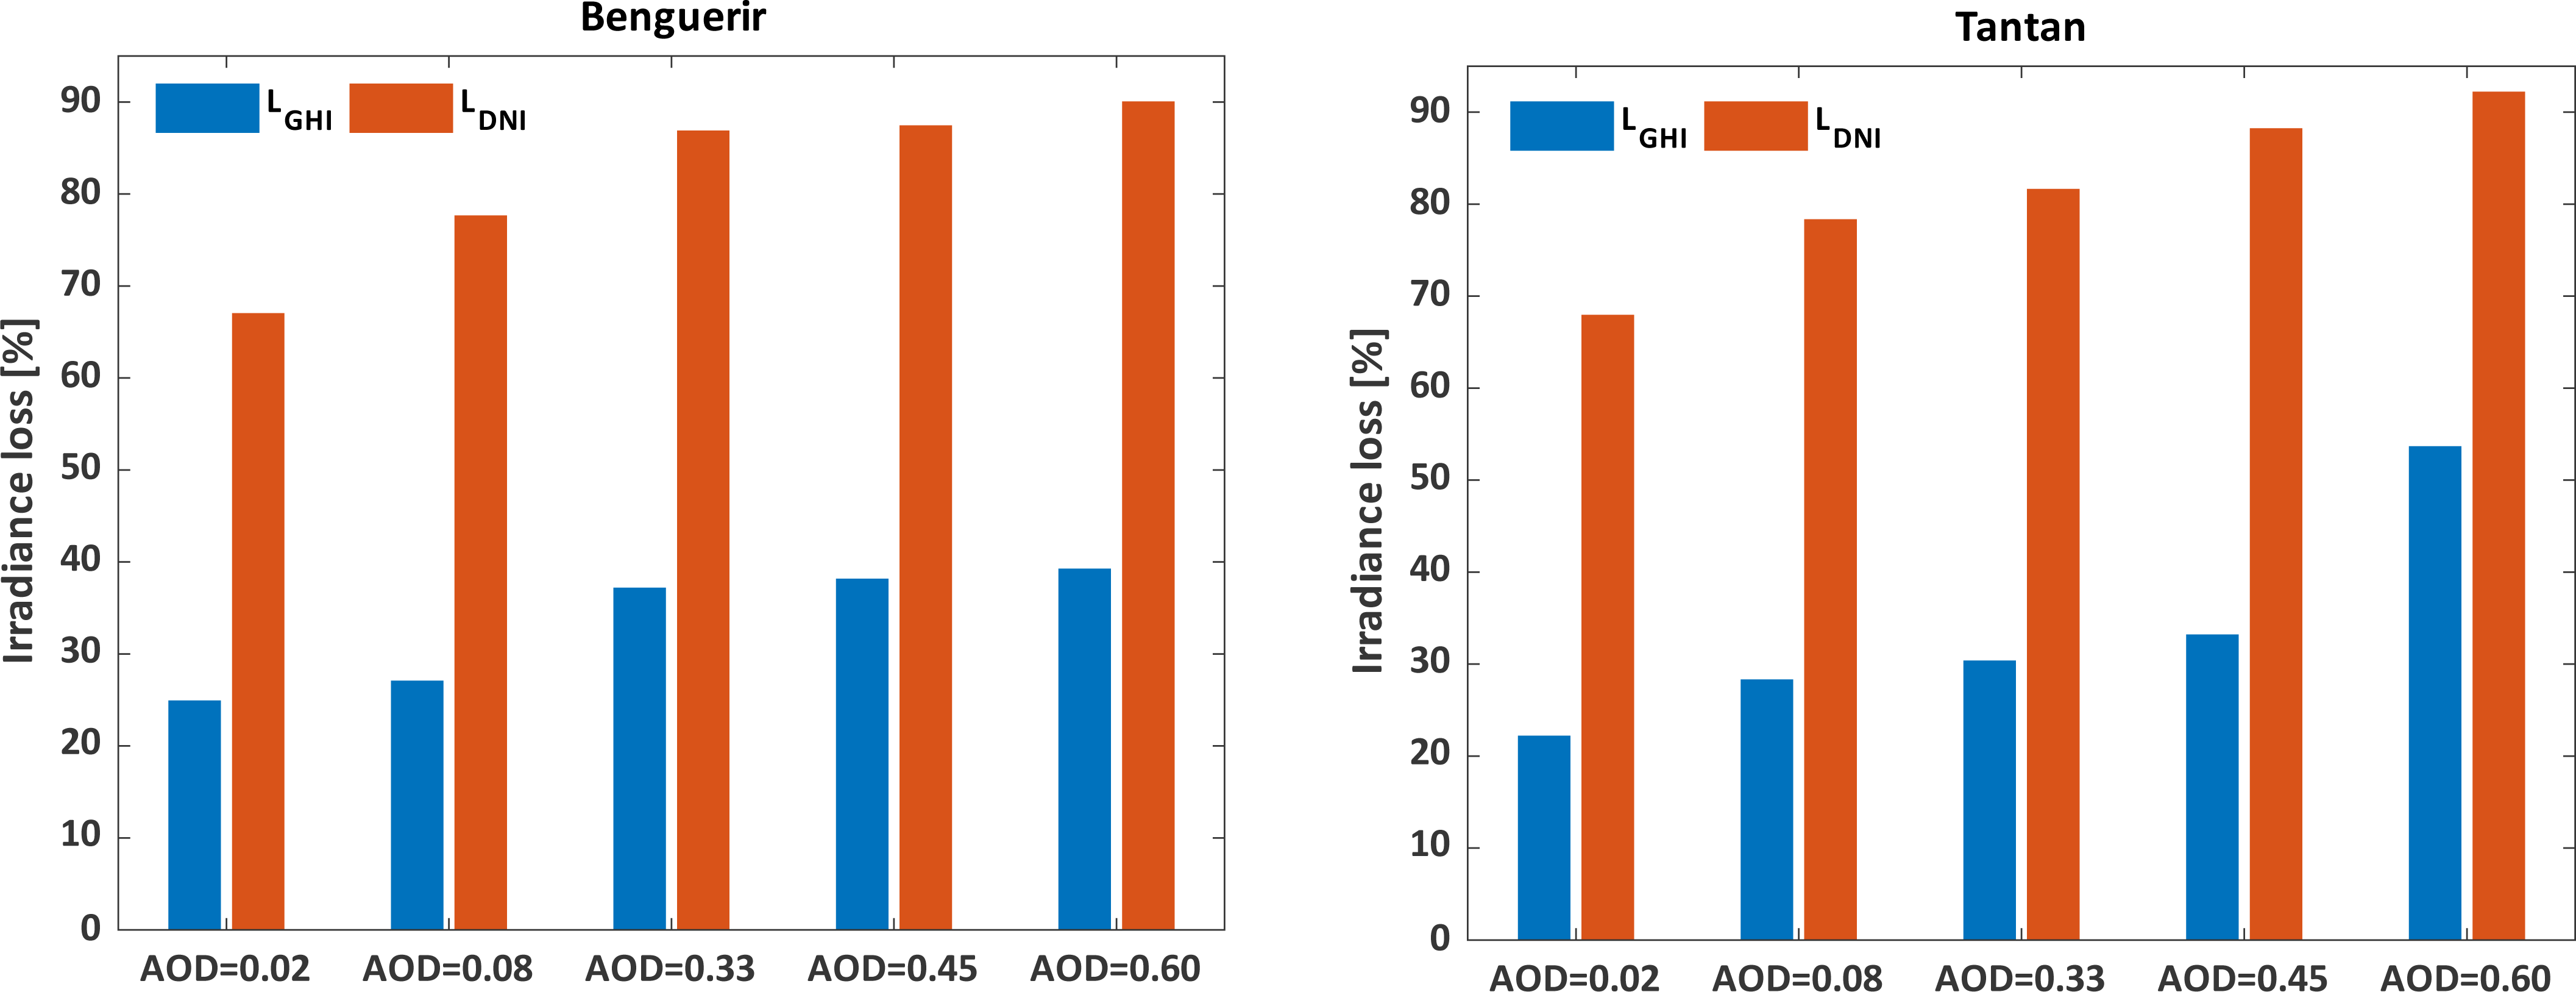
GHI and DNI loss percentage according to top atmosphere irradiance
|
Tantan |
Benguerir |
||
|---|---|---|---|---|
AOD |
LGHI |
LDNI |
LGHI |
LDNI |
[-] |
[%] |
[%] |
||
0.02 |
22.14 |
67.89 |
24.85 |
66.95 |
0.08 |
28.25 |
78.27 |
27.01 |
77.58 |
0.33 |
30.30 |
81.57 |
37.11 |
86.82 |
0.45 |
33.15 |
88.17 |
38.09 |
87.37 |
0.60 |
53.61 |
92.15 |
39.18 |
89.97 |
Despite the great solar potential in various locations worldwide, the presence of aerosol particles significantly affects the available solar energy depending on their size, composition, and location morphology.
This study had two main objectives. Firstly, the MODIS aerosol product was validated using measurements collected from the Sun photometer from AERONET for six stations in Morocco. Secondly, MODIS data were used to evaluate AOD's impact on clear sky solar irradiance using solar radiation data collected from two ground-based meteorological stations in Morocco. MODIS validation results showed a good correlation between MODIS and AERONET AODs with a correlation coefficient greater than 0.75. More than 66% of points fell within the expected error limits at most sites. The best estimation results of MODIS compared to AERONET AOD were observed in Oujda, Saada, Rass El Ain, and Ouarzazate stations, with the most significant values of correlation ranging between 0.75 and 0.82 and the lowest RMSE ranging between 0.10 and 0.12. Aerosol classification showed that CM (35%−73%), Mix (29%−50%), and CC (13%−31%) aerosols are the dominant types throughout the study sites.
In contrast, CD (1%−12%) represents the least frequent aerosol type, while AB is almost absent in all sites except for the Rass El Ain site with a percentage of 4%. Then AOD data from MODIS were used to evaluate the impact of AOD on solar radiation. From the analysis, one can conclude that DNI and GHI are reduced under the influence of AOD rates in the atmosphere: for a high AOD value, the DNI loss reaches 89.97%, and GHI loss reaches 53.61%. As for the DHI, it increases strongly under the influence of AOD. Finally, this work could be used as a preliminary analysis when investigating the impact of particle deposition on photovoltaic panels and thermal concentrators. However, it is impossible to extrapolate the results to other regions because aerosols vary and are strongly related to local conditions.
The recommendation for future research is to assess the impact of aerosols on solar radiation in other geographic locations. It would be promising that a future study examines other types of aerosols by performing a sensitivity analysis to determine what kind of aerosol impacts solar radiation attenuation most significantly.
The authors express their gratefulness to Green Energy Park, the research platform of IRESEN (Research Institute in Solar Energy and New Energies).
AE |
Ångström exponent |
|
AOD |
Aerosol Optical Depth |
|
AOD at the desired wavelength |
||
AOD at the reference wavelength |
||
CC |
Correlation Coefficient |
|
cov |
covariance |
|
DHI |
Diffuse Horizontal Irradiance |
[W/m2] |
DNI |
Direct Normal Irradiance |
[W/m2] |
E0 |
Extraterrestrial radiation on a normal plane |
[W/m2] |
EE |
Expected Error |
|
GHI |
Global Horizontal Irradiance |
[W/m2] |
GHIcls |
Global horizontal irradiance under clear sky conditions |
[W/m2] |
Kt |
Clear sky index |
|
LDNI |
DNI loss coefficient |
[%] |
LGHI |
GHI loss coefficient |
[%] |
MBE |
Mean Bias Error |
|
#N |
Number of samples |
|
RMSE |
Root Mean Square Error |
|
TOA |
Global irradiance at the top of the atmosphere |
[W/m2] |
Greek letters |
||
desired wavelength |
[nm] |
|
reference wavelength |
[nm] |
|
variance |
||
Abbreviations |
||
AB |
Anthropogenic/Burning |
|
AERONET |
Aerosol Robotic NETwork |
|
BSh |
Hot Semi-arid climate |
|
BSk |
Cold Semi-arid climate |
|
BWh |
Hot desert climate |
|
CC |
Clean Continental |
|
CD |
Coarse/Dust |
|
CM |
Clean Marine |
|
CSP |
Concentrated Solar Power |
|
EOS |
Earth observing system |
|
GEP |
Green Energy Park |
|
IPCC |
Intergovernmental Panel on Climate Change |
|
MOD04_L2 |
MODIS Level 2 |
|
MODIS |
Moderate Resolution Imaging Spectroradiometer |
|
NASA |
National Aeronautics and Space Administration |
|
PV |
Photovoltaic |
|
- ,
A transition strategy from fossil fuels to renewable energy sources in the Mexican electricity system ,Journal of Sustainable Development of Energy, Water and Environment Systems , Vol. 6 (1),pp 47–66 , 2018, https://doi.org/https://doi.org/10.13044/j.sdewes.d5.0170 - ,
Impact of renewable energy expansion to the balancing energy demand of differential balancing groups ,Journal of Sustainable Development of Energy, Water and Environment Systems , Vol. 6 (4),pp 784–799 , 2018, https://doi.org/https://doi.org/10.13044/j.sdewes.d6.0215 - ,
Mainstreaming commercial CSP systems: A technology review ,Renewable energy , Vol. 140 ,pp 152–176 , 2019, https://doi.org/https://doi.org/10.1016/j.renene.2019.03.049 - ,
Experimental Performance Assessment of Vertically Installed SolarThermal Collectors ,Journal of Sustainable Development of Energy, Water and Environment Systems , Vol. 8 (4),pp 692–700 , 2020, https://doi.org/https://doi.org/10.13044/j.sdewes.d7.0287 - ,
Reducing uncertainties in large-scale solar resource data: the impact of aerosols ,IEEE Journal of Photovoltaics , Vol. 8 (6),pp 1732–1737 , 2018, https://doi.org/https://doi.org/10.1109/jphotov.2018.2869554 - , Atmospheric aerosols, Atmospheric Aerosols, 2015
- ,
Effects of atmospheric dust deposition on solar PV energy production in a desert environment ,Solar Energy , Vol. 164 ,pp 94–100 , 2018, https://doi.org/https://doi.org/10.1016/j.solener.2018.02.010 - ,
Soiling impact on energy generation of high concentration Photovoltaic power plant in Morocco ,pp 234–238 , 2016, https://doi.org/https://doi.org/10.1109/irsec.2016.7983994 - ,
Reduction of solar photovoltaic resources due to air pollution in ChinaProceedings of the National Academy of Sciences , Vol. 114 (45),pp 11867–11872 , 2017, https://doi.org/https://doi.org/10.1073/pnas.1711462114 - ,
Dust impact on surface solar irradiance assessed with model simulations, satellite observations and ground-based measurements ,Atmospheric Measurement Techniques , Vol. 10 (7),pp 2435–2453 , 2017, https://doi.org/https://doi.org/10.5194/amt-10-2435-2017 - ,
Impact of atmospheric aerosols on photovoltaic energy production Scenario for the Sahel zone ,Energy Procedia , Vol. 125 ,pp 170–179 , 2017, https://doi.org/https://doi.org/10.1016/j.egypro.2017.08.168 - ,
Significant reduction of surface solar irradiance induced by aerosols in a suburban region in northeastern China ,Journal of Geophysical Research: Atmospheres , Vol. 112 (D22), 2007, https://doi.org/https://doi.org/10.1029/2006jd007562 - , Climate change 2001: the scientific basis, Contribution of working group I to the third assessment report of the intergovernmental panel on climate change, 2001
- ,
Impacts of aerosols on available solar energy at Mbour, Senegal ,Journal of Renewable and Sustainable Energy , Vol. 4 (1),pp 013105 , 2012, https://doi.org/https://doi.org/10.1063/1.3682078 - ,
Impact of aerosol on surface reaching solar irradiance over Mohal in the northwestern Himalaya, India ,Journal of Atmospheric and Solar-Terrestrial Physics , Vol. 108 ,pp 41–49 , 2014, https://doi.org/https://doi.org/10.1016/j.jastp.2013.12.002 - ,
A comparative study of soiling on solar mirrors in Portugal and Morocco: preliminary results for the dry season , Vol. 2126 (1),pp 220001 , 2019, https://doi.org/https://doi.org/10.1063/1.5117760 - ,
Effects of soiling on photovoltaic (PV) modules in the Atacama Desert ,Scientific reports , Vol. 8 (1),pp 1–14 , 2018, https://doi.org/https://doi.org/10.1038/s41598-018-32291-8 - ,
Dust cycle and soiling issues affecting solar energy reductions in Australia using multiple datasets ,Applied Energy , Vol. 310 ,pp 118626 , 2022, https://doi.org/https://doi.org/10.1016/j.apenergy.2022.118626 - ,
Kingdom of the Sun: a critical, multiscalar analysis of Morocco’s solar energy strategy ,Energy Research & Social Science , Vol. 51 ,pp 20–31 , , https://doi.org/https://doi.org/10.1016/j.erss.2018.12.012, May 2019 - Aerosol Robotic Network (AERONET) Homepage, https://aeronet.gsfc.nasa.gov/, [Accessed Oct. 26, 2021]
- ,
AERONET—A federated instrument network and data archive for aerosol characterization ,Remote sensing of environment , Vol. 66 (1),pp 1–16 , 1998, https://doi.org/https://doi.org/10.1016/s0034-4257(98)00031-5 - ,
Accuracy assessments of aerosol optical properties retrieved from Aerosol Robotic Network (AERONET) Sun and sky radiance measurements ,Journal of Geophysical Research: Atmospheres , Vol. 105 (D8),pp 9791–9806 , 2000, https://doi.org/https://doi.org/10.1029/2000jd900040 - ,
On the atmospheric transmission of sun radiation and on dust in the air ,GeografiskaAnnaler , Vol. 11 (2),pp 156–166 , 1929, https://doi.org/https://doi.org/10.1080/20014422.1929.11880498 - ,
Comparison of aerosol products retrieved from AERONET, MICROTOPS and MODIS over a tropical urban city, Pune, India ,Aerosol and air quality research , Vol. 13 (1),pp 107–121 , 2013, https://doi.org/https://doi.org/10.4209/aaqr.2012.04.0102 - ,
A satellite view of aerosols in the climate system ,Nature , Vol. 419 (6903),pp 215–223 , 2002, https://doi.org/https://doi.org/10.1038/nature01091 - ,
Relationship between surface reflectance in the visible and mid‐IR used in MODIS aerosol algorithm‐theory ,Geophysical Research Letters , Vol. 29 (23),pp 31–1 , 2002, https://doi.org/https://doi.org/10.1029/2001gl014492 - ,
The Collection 6 MODIS aerosol products over land and ocean ,Atmospheric Measurement Techniques , Vol. 6 (11),pp 2989–3034 , 2013, https://doi.org/https://doi.org/10.5194/amt-6-2989-2013 - ISO 9060, 2018, https://www.iso.org/obp/ui/#iso:std:iso:9060:ed-2:v1:en, [Accessed Sep. 22, 2020]
- CMP21- Kipp&Zonen, https://www.kippzonen.com/Product/14/CMP21-Pyranometer#.X1YSF3lKiM8, [Accessed Sep. 07, 2020]
- Improved accuracy and reliability with CHP 1 Pyrheliometer - Kipp&Zonen, https://www.kippzonen.com/Product/18/CHP1-Pyrheliometer#.YN7Ul-hKiM8, [Accessed Jul. 02, 2021]
- SOLYS2 sun tracker - Kipp&Zonen, https://www.kippzonen.com/Product/20/SOLYS2-Sun-Tracker#.YkV_IG7P1hE, [Accessed Mar. 31, 2022]
- ,
Validation of MODIS aerosol optical depth retrieval over land ,Geophysical research letters , Vol. 29 (12),pp MOD2-1 , 2002, https://doi.org/https://doi.org/10.1029/2001gl013205 - ,
The MODIS aerosol algorithm, products, and validation ,Journal of atmospheric sciences , Vol. 62 (4),pp 947–973 , 2005, https://doi.org/https://doi.org/10.1175/JAS3385.1 - ,
Global evaluation of the Collection 5 MODIS dark-target aerosol products over land ,Atmospheric Chemistry and Physics , Vol. 10 (21),pp 10399–10420 , 2010, https://doi.org/https://doi.org/10.5194/acp-10-10399-2010 - ,
Validation of surface solar irradiances estimates and forecast under clear-sky conditions from the CAMS McClear model in Benguerir, Morocco , Vol. 2126 (1),pp 190005 , 2019, https://doi.org/https://doi.org/10.1063/1.5117702 - ,
Intra-day Variability Quantification from Ground-based Measurements of Global Solar Irradiance ,generations , Vol. 11 ,pp 12 , 2020, https://doi.org/https://doi.org/10.20508/ijrer.v10i4.11308.g8042 - © Solargiss.r.oSolargis :: iMaps., https://solargis.info/imaps/, [Accessed Aug. 05, 2021]
- ,
Validation of MODIS derived aerosol optical depth over the Yangtze River Delta in China ,Remote Sensing of Environment , Vol. 114 (8),pp 1649–1661 , 2010, https://doi.org/https://doi.org/10.1016/j.rse.2010.02.015 - ,
MISR aerosol optical depth retrievals over southern Africa during the SAFARI‐2000 dry season campaign ,Geophysical Research Letters , Vol. 28 (16),pp 3127–3130 , 2001, https://doi.org/https://doi.org/10.1029/2001gl013188 - ,
Trends in aerosol optical properties over Eastern Europe based on MODIS-Aqua ,Geoscience Frontiers , Vol. 11 (6),pp 2169–2181 , 2020, https://doi.org/https://doi.org/10.1016/j.gsf.2020.03.014 - ,
Aerosol climatology and discrimination of aerosol types retrieved from MODIS, MISR and OMI over Durban (29.88°S, 31.02°E), South Africa ,Atmospheric Environment , Vol. 117 ,pp 9–18 , 2015, https://doi.org/https://doi.org/10.1016/j.atmosenv.2015.06.058 - Aerosol Optical Thickness (1 month - Terra/MODIS) | NASA, 2022, https://neo.gsfc.nasa.gov/view.php?datasetId=MODAL2_M_AER_OD&year=2020, Apr. 12[Accessed Apr. 12, 2022]
- MODIS Web, https://modis.gsfc.nasa.gov/gallery/, [Accessed Apr. 12, 2022]
- , McClear: a new model estimating downwelling solar radiation at ground level in clear-sky conditions
- ,
The ECMWF ensemble prediction system: Methodology and validation ,Quarterly journal of the royal meteorological society , Vol. 122 (529),pp 73–119 , 1996, https://doi.org/https://doi.org/10.1002/qj.49712252905 - ,
Overcast sky conditions and luminance distribution in Hong Kong ,Building and Environment , Vol. 39 (1),pp 101–108 , 2004, https://doi.org/https://doi.org/10.1016/j.buildenv.2003.06.001 - HOME - www.soda-pro.com, http://www.soda-pro.com/, [Accessed Aug. 30, 2021]