


Within the decarbonization and total electrification strategies of the European Union (EU) with 100% renewables, labyrinth type of earth-to-air heat exchangers (EAHE) in energy-smart greenhouses and green buildings is attracting broader attention [1]. Although they seem highly energy efficient in terms of their high coefficient of performance, they are responsible for nearly-avoidable emissions in proportion to the exergy mismatch between the electrical fan power demand and the thermal power exergy recovered. This leads to the hypothesis that EAHE technology may be responsible for carbon dioxide (CO2) emissions if an exergy-rational design and operation schema is not developed and implemented. For practical purposes, unit exergy of electrical power is taken to be one kW/kW, despite the unpractical correspondence to a reference temperature of zero Kelvin.
On the other hand, thermal exergy recovered in the labyrinth is usually in the order of 0.1 kWexergy/kWenergy. Therefore, these applications must be collectively modeled and rated with respect to thermodynamics' first and second laws, starting from the original energy source and ending after leaving the greenhouse. For example, where and how the fan electricity comes from must be questioned.
Previous studies in the literature neglected exergy destructions and considered only the first law. On the other hand, besides labyrinth heat exchangers, solar PV systems used for reducing the carbon footprint of greenhouses may not adequately respond to the same issue because all renewable energy systems still carry similar emissions responsibilities in the absence of fossil fuels. Solar photovoltaic-thermal (PVT) systems may be more responsive to the problem if any low-temperature, on-site heat demand is present. In this respect, Nayak and Tiwari carried out experimental and numerical analyses to predict the performance of a solar PVT collector integrated with a greenhouse in the climatic conditions of Delhi, India. However, their exergy analysis of the photovoltaic (PV) - equipped greenhouse showed quite a low second-law efficiency of 4% [2]. They extended their research to PV-operated labyrinth use for greenhouses for different climatic conditions in India [3]. The first law- coefficient of performance (COP) is 10.42 (7.67 kW/0.763 kW). Another study revealed the significance of using heat pipes in greenhouses by replacing electrically operated pumps and fans [4]. O. Ozgener and L. Ozgener [5] presented a case study about an experimental greenhouse. The outdoor air is pre-heated in an underground labyrinth air-to-air heat exchanger system. They carried out experiments during the shoulder season in October in the Aegean region. They observed an average greenhouse heating capacity, QH of 7.67 kW, with an air temperature lift of 6 K. Power demand, PFAN of the electric fan motor is 0.736 kW. According to the graphical data of O. Ozgener and L. Ozgener [5], the outdoor air intake to the labyrinth and the greenhouse supply air temperatures Tin and Tsup are 20 °C (293 K) and 26 °C (299 K), respectively. These values give a thermal exergy gain, EXH, of 0.15 kW/kW, according to the ideal Carnot cycle. See eq. (1) [6]:
(1)
For the known supply and return temperatures in a closed system, the reference environment temperature, Tref, is replaced by Tin.
The difference between EXE and EXH will be responsible for nearly-avoidable ΔCO2 emissions responsibility in the stock due to the need for externally offsetting the exergy destruction by someone, somewhere, sometime, probably by some use of fossil fuels at a power plant and then transmitted to the greenhouse. This emissions responsibility instead of savings proves the hypothesis of this research. The destroyed power exergy, at a ratio of 0.59 kW/0.736 kW, is 79.7% of the supply exergy. The ratio of EXH to EXE gives an exergy efficiency of 20% (0.15 kW/0.74 kW), excluding parasitic exergy destructions. Hepbasli [7] reported that the exergy efficiency is 19.18% for the same experimental greenhouse, which is in good agreement. However, even such a simple exergy efficiency definition does not reveal the corresponding CO2 emissions responsibility, showing that a more comprehensive yet straightforward model is needed to relate the second law directly to the emission responsibilities.
To avoid ingress of bacteria grown in the underground labyrinth, dust, particulate matter, airborne viruses, and insects to the greenhouse or building interiors [8], a closed air loop separated by a heat exchanger [9],[10], and or active filtering may be necessary. These measures increase the fan power required. Therefore, careful optimization concerning air quality versus power consumption may be necessary. At any rate, the exergy of the power demand of fans and other ancillaries must be less than the thermal exergy recovered from the underground labyrinth, as given in eq.(2). Furthermore, the air quality may be indexed to the level of the particulate matter in terms of PM2.5 and its health risk equivalence to the CO2 emissions through the function (f) [11], which allows optimizing the air quality versus power exergy demand.
Eq. (2) is about the balance between the CO2 equivalency of particulate ingress at an airflow rate of V (the first term), CO2 emissions due to electricity supply from a central power plant to satisfy the additional power demand, ΔPFAN, which is the second term. This term excludes nearly-avoidable exergy destructions at the plant. The third term is the CO2 emissions savings indexed to an on-site natural gas boiler with a unit CO2 content of cK = 0.2 kg CO2/kWh (for natural gas) and average boiler efficiency, ηb of 0.85. ΔTHE+F corrects the third term for sensible heat according to the temperature drop across the heat exchanger and filters if they are present. This correction assumes that the flow rates are the same. On hourly basis, the result must be less than zero, indicating that the sum of emissions savings is more than its CO2 emissions responsibility (PEF=2.5):
(2)
Air quality requirements further increase the exergy gap between the fan motor and the heat (or cold) recovered in the labyrinth. It might be possible to eliminate the primary fan power demand by introducing natural air circulation through a sloped duct between the labyrinth beneath the greenhouse and the greenhouse roof or between a multi-story building [12]. Rotta [13] investigated the seasonal thermal storage capability of underground tunnels. These tunnels may accumulate heat in summer and utilize that heat in winter, thereby cooling the underground for the next cooling season. Rotta identified seven design parameters. These are namely; 1- inlet, outlet, and mean temperature of the heat transfer fluid (air), 2- thermal power storage or use in the labyrinth, 3- thermal energy, 4 and 5- thermal losses and storage efficiency, 6- Specific storage capacity, and 7-thermal stresses. However, this study, likewise most of the others cited below, did not consider the exergy concept. S. Song et al. [14] have discussed the effectiveness of labyrinth systems in their paper concerning an educational facility in South Korea. They experimented in an existing college building equipped with a labyrinth system. They identified two cases: the outdoor air entering the air handler units on the ground level and the outdoor air entering the air handlers after passing through the labyrinth system. They have calculated the construction cost of the labyrinth systems. After their seasonal measurements, they concluded that the first law peak loads (including the latent loads) for the cooling and the heating seasons were reduced by 47.6% and 41.2%, respectively. A payback period of 12.1 years was estimated. With the Covid-19 Pandemic, 100% outdoor air, year-round, became an essential part of the measures to be taken to minimize the virus spread. This necessity increased the ventilation rates and fresh air intake, resulting in a significant increase in heating and cooling loads, especially in large buildings like airport terminals, hospitals, and shopping centres. Nevertheless, the downside of labyrinth systems, especially in greenhouses hospital buildings, is that outdoor air quality downstream of the labyrinth is a concern. The upside of the issue is that labyrinth systems in a detached position may be retrofitted to existing buildings. Marmion et al. [15] have considered a basement labyrinth system for a conceptual 200-bed an acute-care hospital with a water-based thermal mass instead of a conventional concrete-mass labyrinth. They concluded that the labyrinth with natural/hybrid ventilation increased energy (quantity) savings from 60% to 80%.
Rim et al. [16] compared different alternatives for the labyrinth system with 412.68 m2 concrete underground space for maximum heat transfer efficiency. COP changed between 1.920 and 1.925, according to the length of the labyrinth walls. They considered three cases and further investigated the effect of the internal shape in four case studies, which showed a COP range between 2.0 and 2.5. They concluded that the highest COP values were during the summer months due to larger temperature differences across the labyrinth. Misra et al. have investigated the effect of the humidity of the soil on the energy and exergy efficiency of underground tunnel types of heat exchangers [17]. Their field studies have shown that the exergy efficiency decreases sharply with the pipe length and stabilizes around 49% after a pipe length of 25 m. They have also determined that wet soil yields higher exergy efficiency [17].
Today, the annual energy consumption of the food industry in the EU countries is about 17% of the total consumption [18]. Poorer countries spend more energy than EU countries, while global average energy consumption also increases [19]. Although it seems a relatively small percentage among other sectors, with higher levels of water consumption and increasing global temperature despite several first-law measures, agriculture is responsible for large amounts of CO2 emissions. However, statistics show that agriculture had only 3.2% of final energy consumption in the EU in 2018. Agriculture's final energy consumption share was highest in the Netherlands (8.1%) [20]. Ever-increasing atmospheric anomalies further enhance agricultural losses, thus increasing agricultural energy consumption to offset the product and greenhouse losses, which tend to be unrecoverable with the current insurance plans. Therefore, more resilient, energy-smart, and robust greenhouses are becoming necessary. Although energy systems are improving for greenhouses, the techniques in use are not exergy-rational, like labyrinth systems and ventilation units [21]. The higher the exergy rationality, the higher the food quality is due to energy and cost savings, which may be allocated to R&D activities, better fertilizers, and technical improvement. The Netherlands is one of the most successful countries in these respects. Therefore, this study aims to develop exergy-based design criteria and hints for better greenhouse performance that faces already `energy-smart` greenhouses like in the Netherlands. This paper takes the challenge of developing and rating `exergy-smart` greenhouses.
A new greenhouse design model was developed to investigate the hypothesis in a practical setting. The primary objective is to utilize solar energy and ground heat in the most efficient and, more importantly, in the highest rational exergy management efficiency, ψR, which leads to minimum CO2 emission responsibility. Figure 1 shows the design. For a greenhouse to be green, the REMM efficiency, ψR, must be greater than 0.7, defined earlier for green buildings and cities [22]. Another objective of this design against global warming is to achieve nearly-zero carbon greenhouse (nZCGH) and nearly-zero exergy greenhouse (nZEXGH) status [23]. The nearly zero-carbon greenhouse has an annual Environmental Development Ratio, EDR equal to or greater than 0.80. EDR is based on the exergy of heat QHX and power consumption EX. ƩCO2 is the total attributable emissions responsibility:
(3)
0.63 kg CO2/kWh is the reference value [23]. If there is an active CCS (Carbon capture and storage) system, the capture amount is subtracted after reducing it by the CO2 equivalent power consumed for CCS, namely CCSnet. In this case, EDR may be equal to or greater than one if CCSnet exceeds the greenhouse emission responsibility:
(4)
General layout of the all-DC, Exergy-Smart Green House System, nZEXGH; nZCGH, CCS: Carbon Capture and Storage
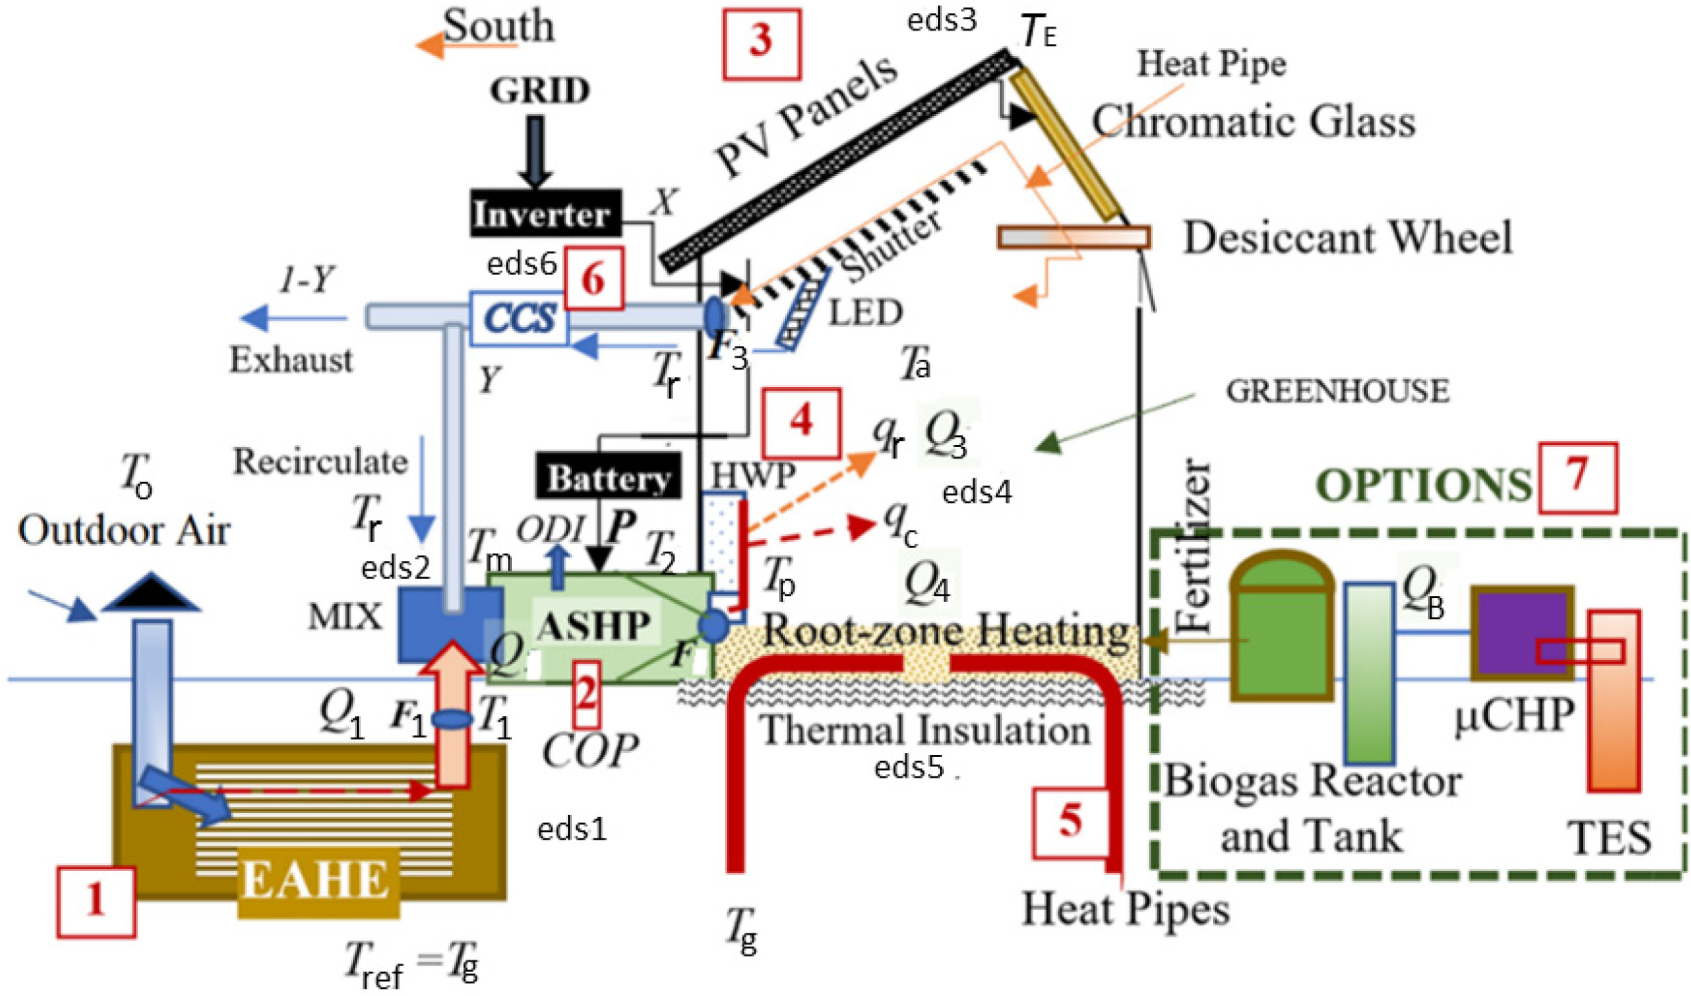
Nearly zero Exergy Greenhouse (nZEXGH) provides at least 80% of its total exergy of heat and power consumption annually by itself. The greenhouse operates on DC power, except using an inverter for the grid AC power converter during emergencies only. Other expected features of nZCGH and nZEXGH are summarized below:
Uneven span maximizes the PV surface area on the south-facing side of the roof. PV panels are 60% transparent with an average power generation efficiency of 15%. Several ongoing research and development activities apply PV technology to greenhouse roofs, like Organic Photovoltaics (OPV), without compromising plant growth [24]. These PV panels may also help passive cooling the greenhouse in hot climates by night radiation to the sky during summer. Capillary type of heat pipes sandwiched to the transparent PV panels serve night radiation by absorbing heat from the indoors through the desiccant wheel and transferring it to the PV panels, radiating heat back to the sky. On hot summer daytimes, PV cells need cooling. Then, the same heat pipes transfer heat to the desiccant wheel to thermally charge for dehumidification, which often coincides with the hot weather. PV cells supply power for the desiccant wheel. In cold climates, a mechanical shutter system may isolate the greenhouse from cold outdoor temperatures to reduce the heat losses from the roof. The top glass of the PV panels may be tempered with electric wires for ice protection and snow melting in severe conditions. This design also represents the advantages of decoupling latent and sensible loads in the greenhouse. Duct sizes and fan loads are reduced by assigning the most sensible loads to the radiant soil heating system through the embedded heat pipes (subject to a maximum temperature for root zone heating) and the panel wall heating. Better humidity control is achieved. In the cooling mode, the system reverses and presents similar advantages.
EAHE uses heat pipes between the supply and return-air conduits to reduce the fan power demand. The configuration is similar to the HWP heater (see Figure 3).
On the north side, the chromatic glass layer automatically adjusts the sunlight at pre-determined intensities according to the solar insolation, brightness, plant growth characteristics, and indoor thermal requirements for minimum thermal loads.
In hot climates, PVT panels should be preferred. Heat may be seasonally stored in a second TES unit with heat pipes for winter use in supplementary root-zone heating and ice or snow melting in the immediate surroundings of the greenhouse.
Irrigation is getting more critical with global warming and increasing drought. Hybrid power-and-heat wind turbines, coupled with this greenhouse concept and the on-site hydrogen economy, help reduce and make the irrigation power demand greener.
The system is an all-air, closed-cycle with an air source heat pump and fans.
The cut-off control of labyrinth operations saves fan exergy demand.
CO2 captured from the CCS system used in heat pumps mitigates the ODP.
There are six distinct components and one option:
Earth-to-Air Heat Exchanging (EAHE) Labyrinth (Figure 1),
Air Source Heat Pumps (ASHP), Two in Series Cascade (Figure 1),
PV Panels and or PVT (Figure 1),
Hybrid Wall Panel, with Heat Pipes and Porous Air Wall (Figure 1 and Figure 3),
Root-Zone Heating with Buried Heat Pipes,
Carbon Capture and Storage Unit, CCS,
A Set of Options, Comprising micro-CHP, Biogas reactor, and TES.
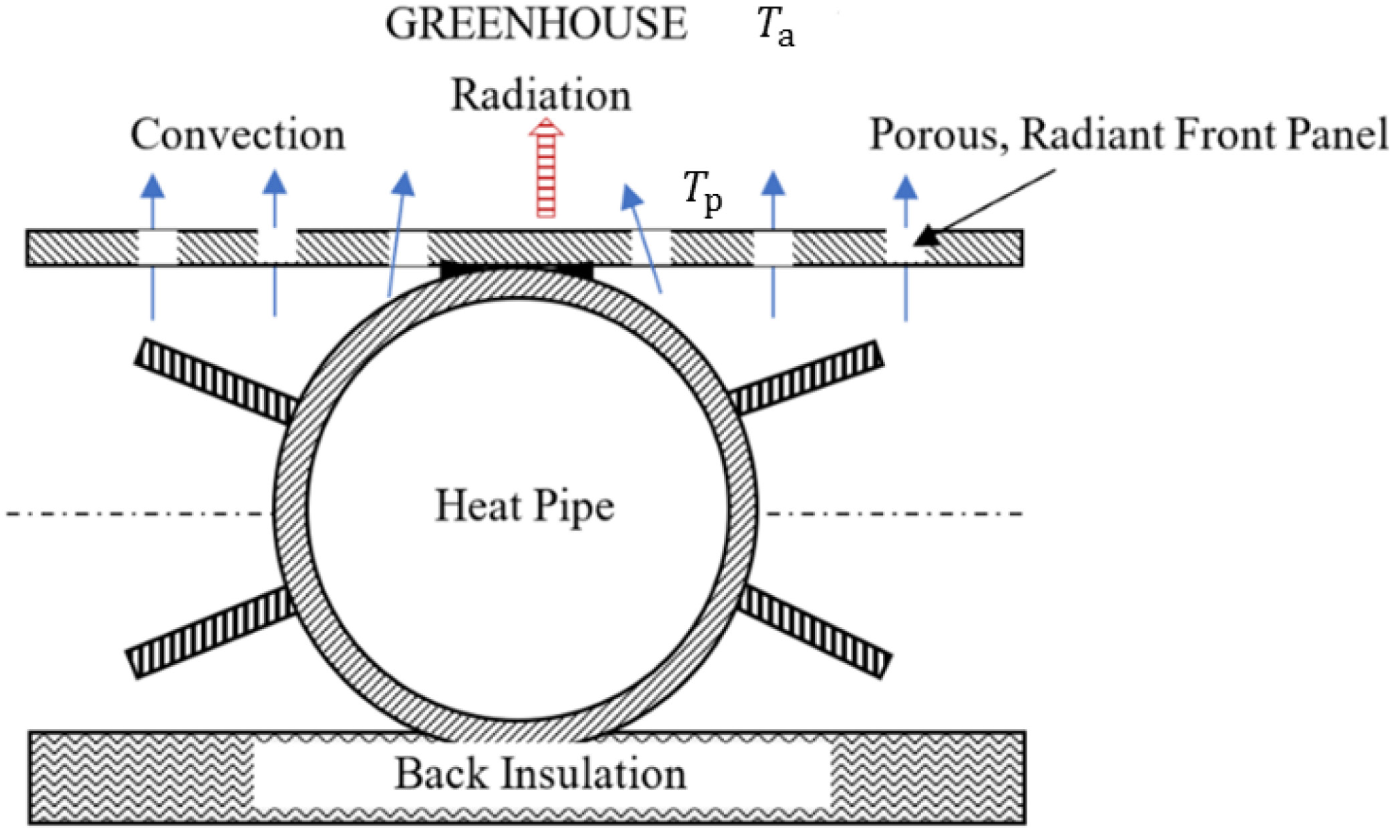
Heat pipes in the air-to-air HWP distribute heat or collect cold (sensible cooling) to or from indoors by increasing the radiant porous panel surface to enhance the radiant component of heat transfer over a larger surface area. This approach enables heating or cooling at lower-exergy air temperatures from the ASHP, which improves its COP.
Sectional top view of the Radiant Wall Panel [25]
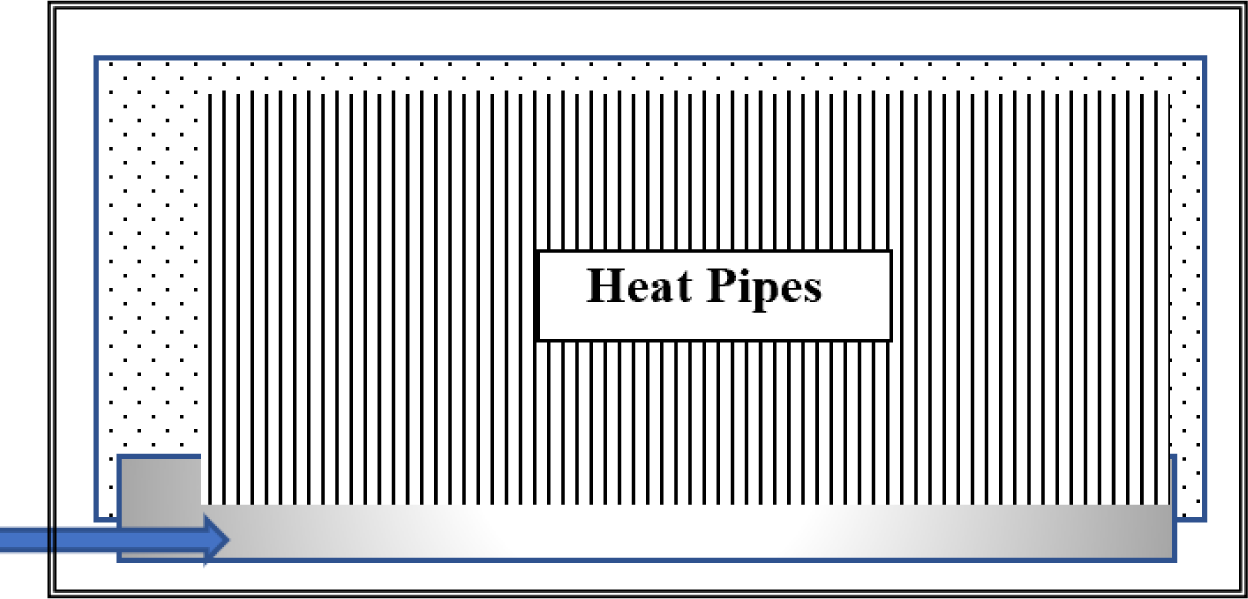
Back-side cut-away view of the Heat-Pipe Wall Panel (HWP) adopted from [25]
This model is based on the Rational Exergy Management Efficiency, ψR. It identifies the major exergy destructions [22], predicts the CO2 emissions responsibility, and calculates the EDR. An earlier model for ERV systems in green buildings was adopted for greenhouse labyrinth systems with or without heat pumps [26].
According to the Rational Exergy Management Model (REMM), at small temperature differences in low-temperature applications below 100 °C (373 K), both versions of ψR represents the rationality of the exergy utilization efficiency, ψR, for useful work. Figure 4 is a solar PV panel, which generates electric power upstream. The absorbed solar heat by the PV panel downstream is rejected to the ambient, and the corresponding thermal exergy is destroyed. Due to the electrical power, QE, that the PV panel generates, CO2 emissions from the stock are proportionately reduced because the power demand in the sector from the grid, which may be using some fossil fuels, is reduced (-CO2). On the other hand, the PV panel misses the opportunity of utilizing the thermal exergy corresponding to rejected heat and causes exergy destruction. This destruction is offset in the sector at the expense of a mix of fossil fuels and renewables, causing avoidable emissions +ΔCO2 in a proportion of the unit exergy destroyed (εdes1). This term is positive because it adds emissions responsibility to the carbon budget. The net savings or emissions of CO2 depends on the difference between them. If +ΔCO2 (emissions responsibility) is greater than -CO (savings), then the PV panel will be responsible for emissions rather than savings. This condition may be avoided if PV the system is replaced by a PVT system, which cools the PV cells and captures most of the heat absorbed for useful work. Then, the frame temperature, TE, is reduced to T`E, and the rated PV efficiency is maintained at high temperatures while thermal power is generated. REX is the exergy-based power mix of renewables:
(5)
For multiple (n) exergy destruction points in a complex system:
(6)
Exergy destruction by a PV cell, εdes1
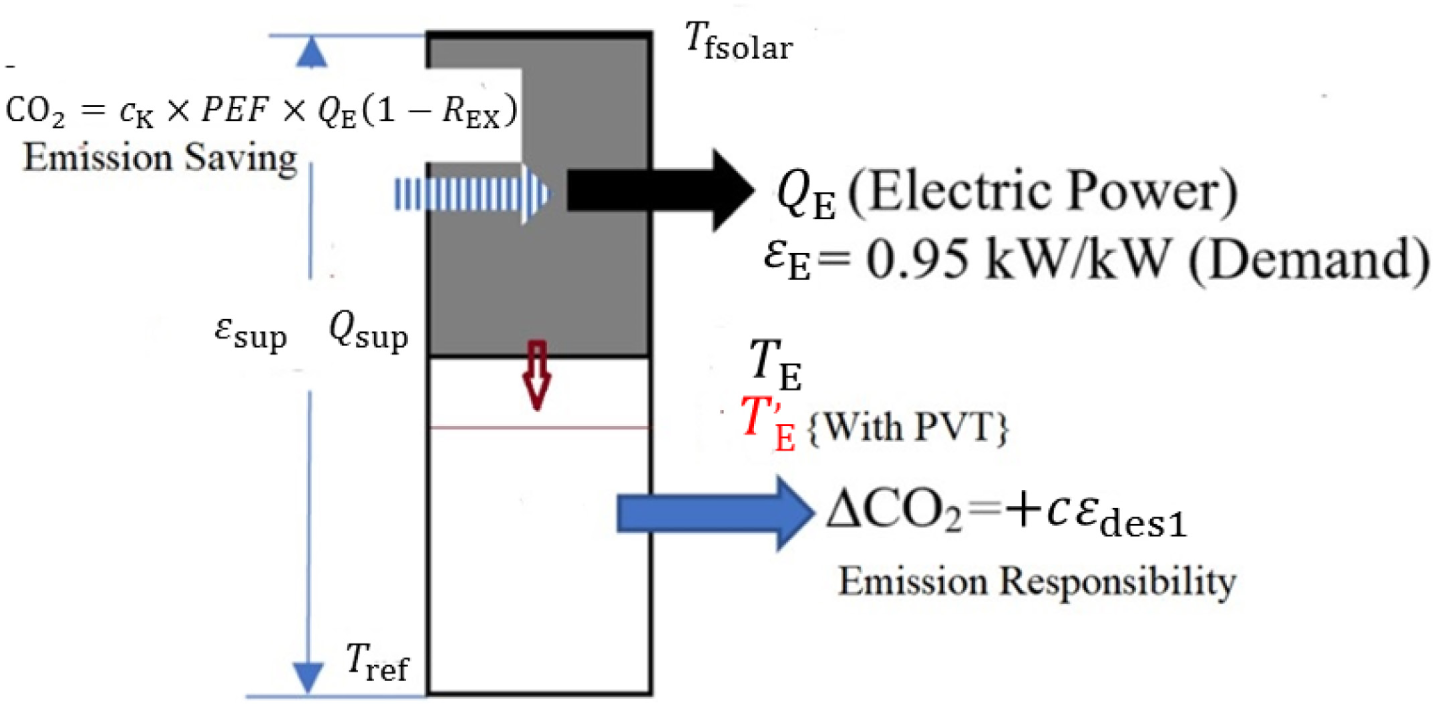
Here, QE is equal to Qsup × ηPV. Based on natural gas, the multiplier (c) is 0.27 kg CO2/kWh. The multiplier (cK) also has the same value based on natural gas power plants. PEF is the primary energy ratio, whose EU average is 2.5 (Fuel to plug). The reference temperature, Tref, is 283 K in heating and 273 K in cooling. Tfsolar is the Carnot cycle-equivalent solar source temperature at insolation, In, normal to the panel surface. 1360.6 W/m2 is the Total Solar Radiation (TSI):
(7)
There are two major exergy supplies to the greenhouse (Figure 1): the labyrinth (EAHE) providing or extracting heat from the greenhouse and the PV panels providing electrical power. The labyrinth thermal power, Q1, has unit exergy, εH of (1-To/T1). Then the following equation solves Ʃεsup:
(8)
(9)
Then the REMM Efficiency ψR is solved provided that εdes or Ʃεdes and εsolar are calculated. ψR predicts ΔCO2, proportional to (1-ψR).
The labyrinth thermal power is subject to the following cut-off conditions, whichever comes first, to avoid fan power consumption above thermal gain. Cut-off conditions are given below.
(10)
(11)
Referring to Figure 1, there are five major exergy demands and six exergy destructions:
(12)
Parasitic exergy destructions are neglected, like the chromatic glass, desiccant wheel, and in-the-ground heat pipes (εdes5 = 1-Tpg/Tg~0):
(13)
(14)
(15.a)
(15.b)
(16)
(17)
Natural root-zone heating or cooling capacity, Q4, with heat pipes using the ground heat has little control possibility. Therefore, the major control for optimum heating and cooling capacity is made by adjusting T2 and F2 for the supply of Q3:
(18)
(19)
(20)
(21)
(22)
Here, QB is the biogas fuel supply. A biogas generator supplying fuel to a micro-CHP unit with ηH and ηE replaces CO2 from the emissions stock. This supply is corrected with the unit exergy of biogas (0.75 kW/kW) and natural gas (0.87 kW/kW). The last term represents the fuel savings according to EU 2004/8/EC Directive. 0.85 is the reference efficiency for separate thermal power generation, and 0.52 is the reference electric power generation efficiency. Fuel-saving is indexed to a PEF of 2.5 for the grid.
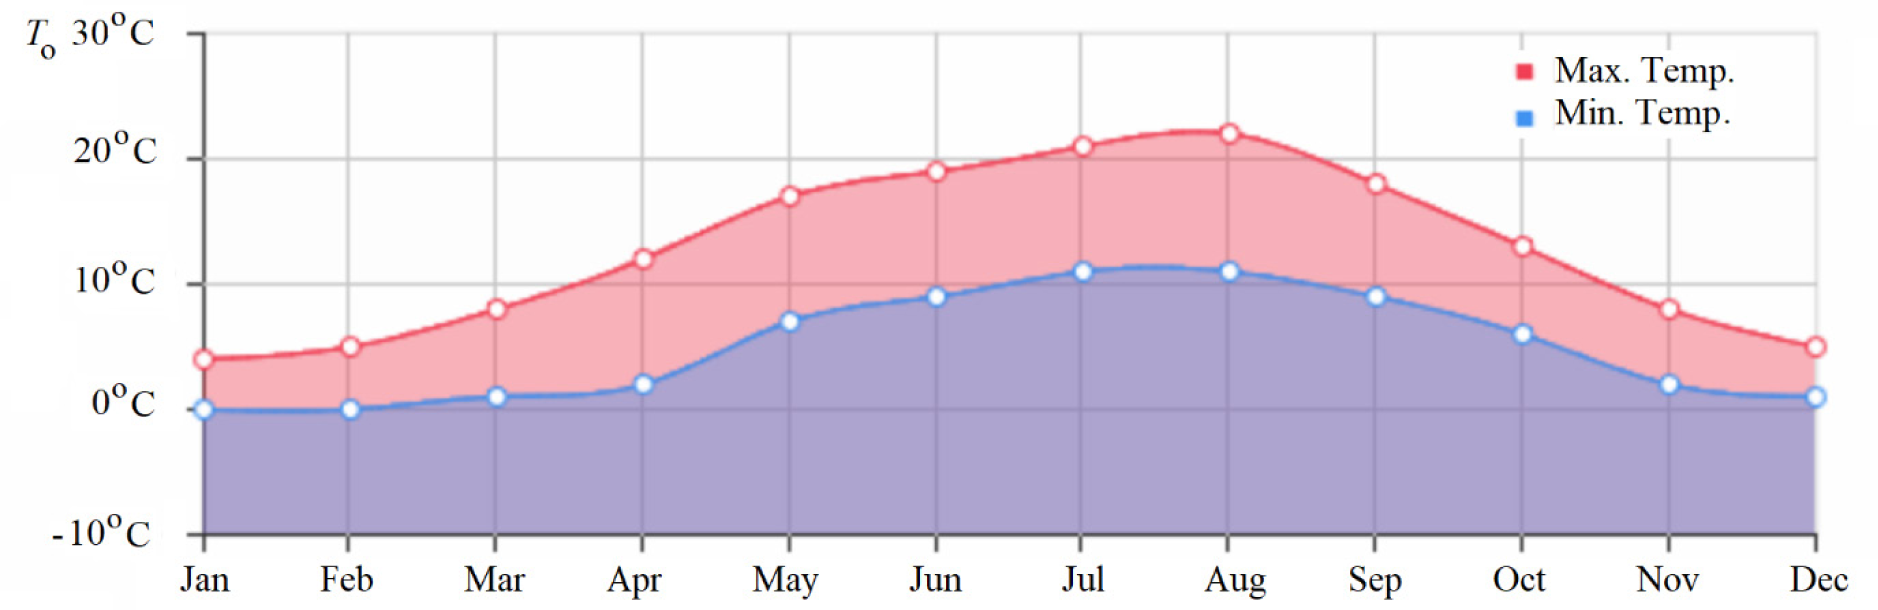
The new greenhouse design is parametrically investigated for the climatic conditions of the city of Zwolle in the Netherlands. January is the coldest month, with an average high temperature of 4.6 °C and an average low of 0.9 °C (Figure 5). Hourly lowest temperature decreases down to -8 °C. While Zwolle has a moderately cold climate, the solar intensity is low. Figure 6 shows the monthly-average sun hours in Zwolle [28].
Monthly average outdoor temperatures in Zwolle, the Netherlands [27]
Monthly average sun hours in Zwolle [28]
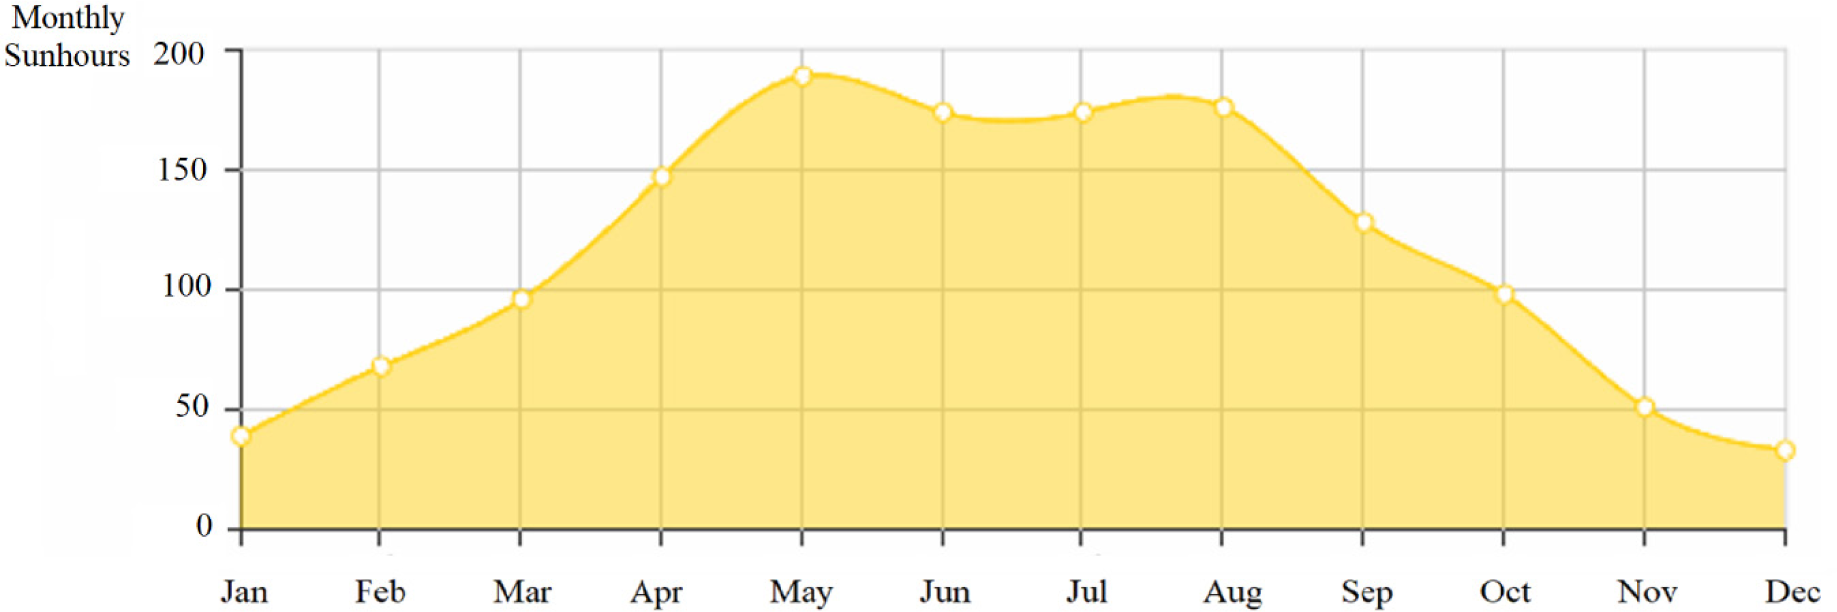
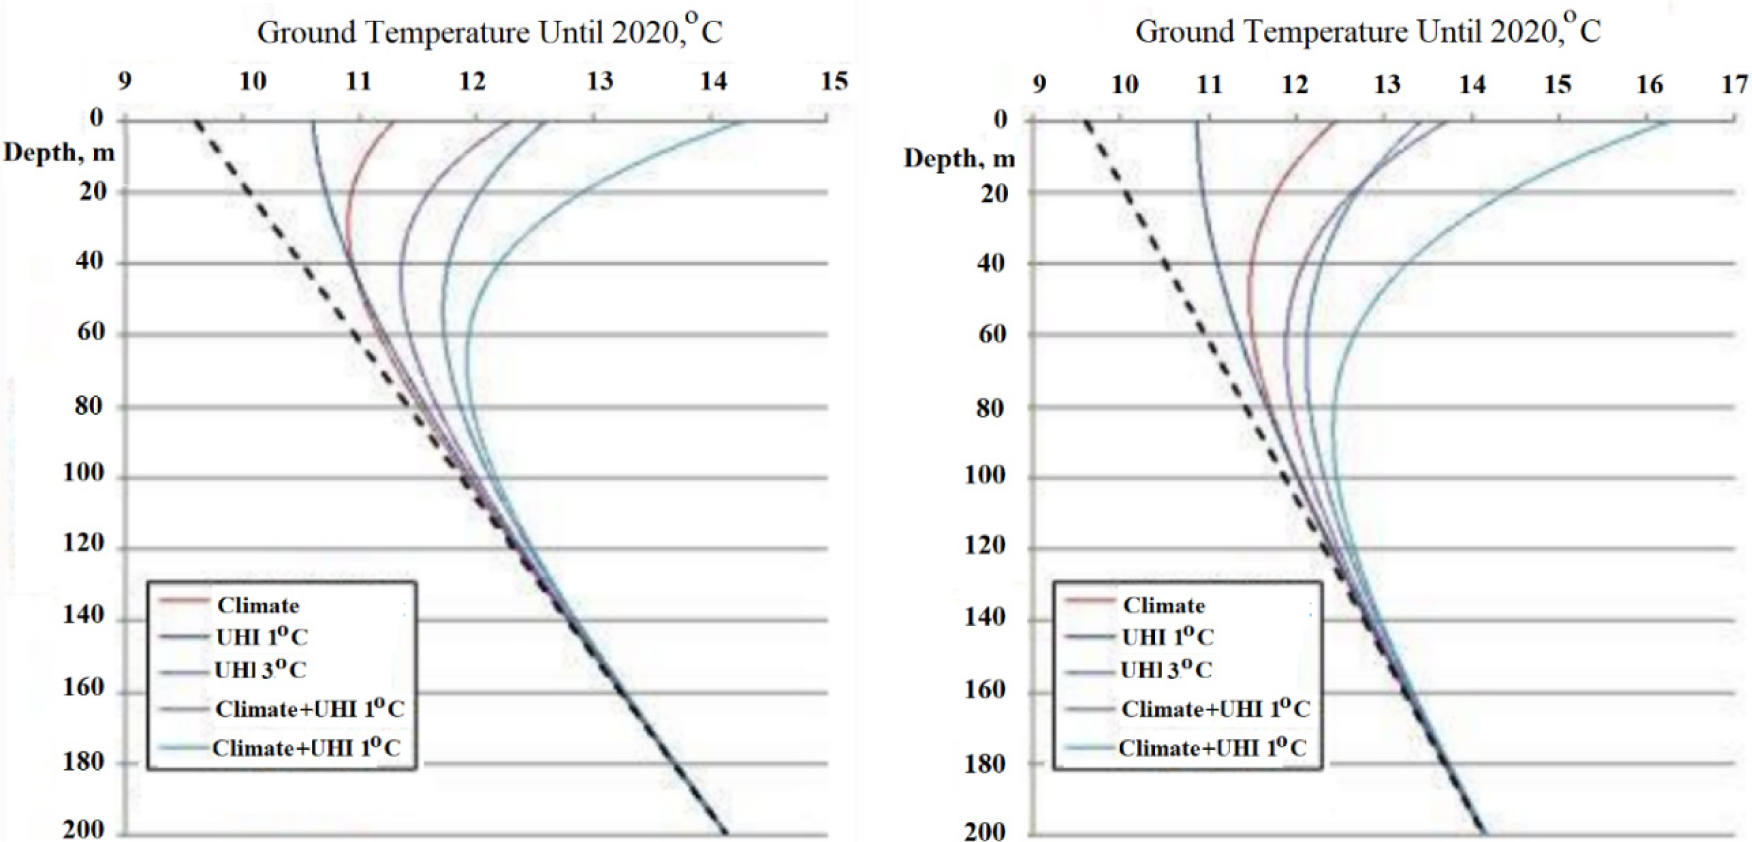
Figure 7 shows that the ground temperature close to the surface for labyrinth applications is gradually increasing primarily due to the urban heat island effect (UHI) and climate change. The slow city concept, which nears cities to agriculture, is essential from this perspective. On the other hand, the minor advantage of increasing the number of labyrinth applications near and in the cities, both in buildings and greenhouses with seasonal thermal storage, may reduce the UHI and provide thermal energy. If only climate change is considered for labyrinth applications, the ground temperature close to the surface, Tg may be taken at 11°C (284 K). Considering the UHI, Tg may be assumed to be 2 K higher (286 K). To demonstrate the model, three variables, namely, To (Representing Climate), Tg (Representing Urban Connection and the Future Trends), and ((Representing Plants Grown), were parametrically varied to investigate their effects on the greenhouse performance.
Variation of the ground temperature with depth, climate change, and urbanization - the dotted line is for the period before 1900 [29]
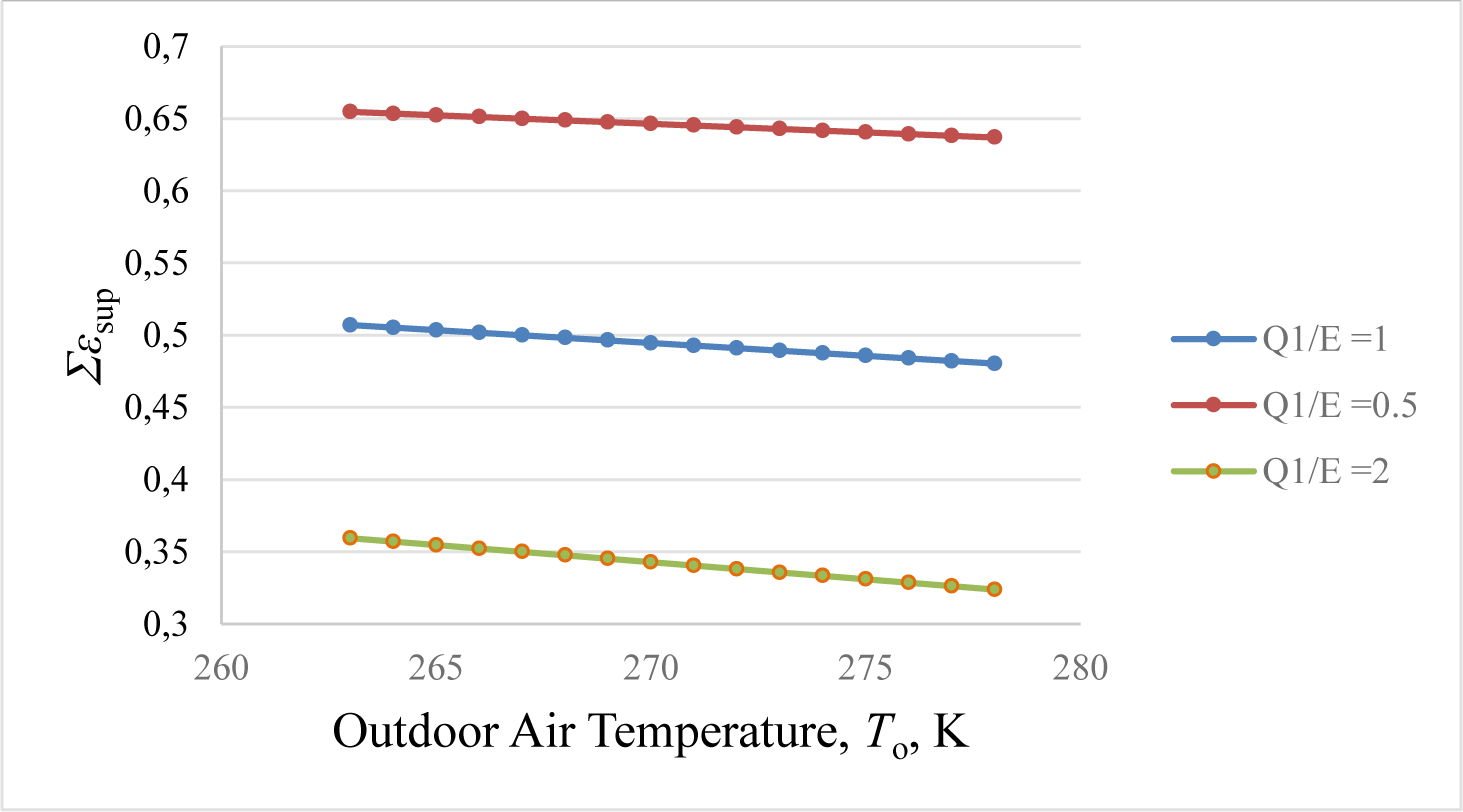
The effect of the climate represented by the dry-bulb design outdoor temperature, To varies between -10 °C (263 K) and +5 °C (278 K). The EAHE efficiency and Tg are assumed to be constant. Only εdes1 and εdesF1 change with To. Figure 8 shows their variation for different Q1/E ratios that also affect ψR. Therefore, the same graph may also be interpreted for ΔCO2. Figure 8 shows that supply exergy decreases with outdoor temperature increase because it approaches the ground temperature, 285 K. A critical parameter is the (Q1/E) ratio, which changes with climatic conditions and the outdoor temperature. Supply exergy decreases by increasing the (Q1/E) ratio because the unit power exergy is higher than unit thermal exergy.
Change of Σεsup with To and (Q1/E) ratio: T1 is fixed (exit temperature from EAHE)
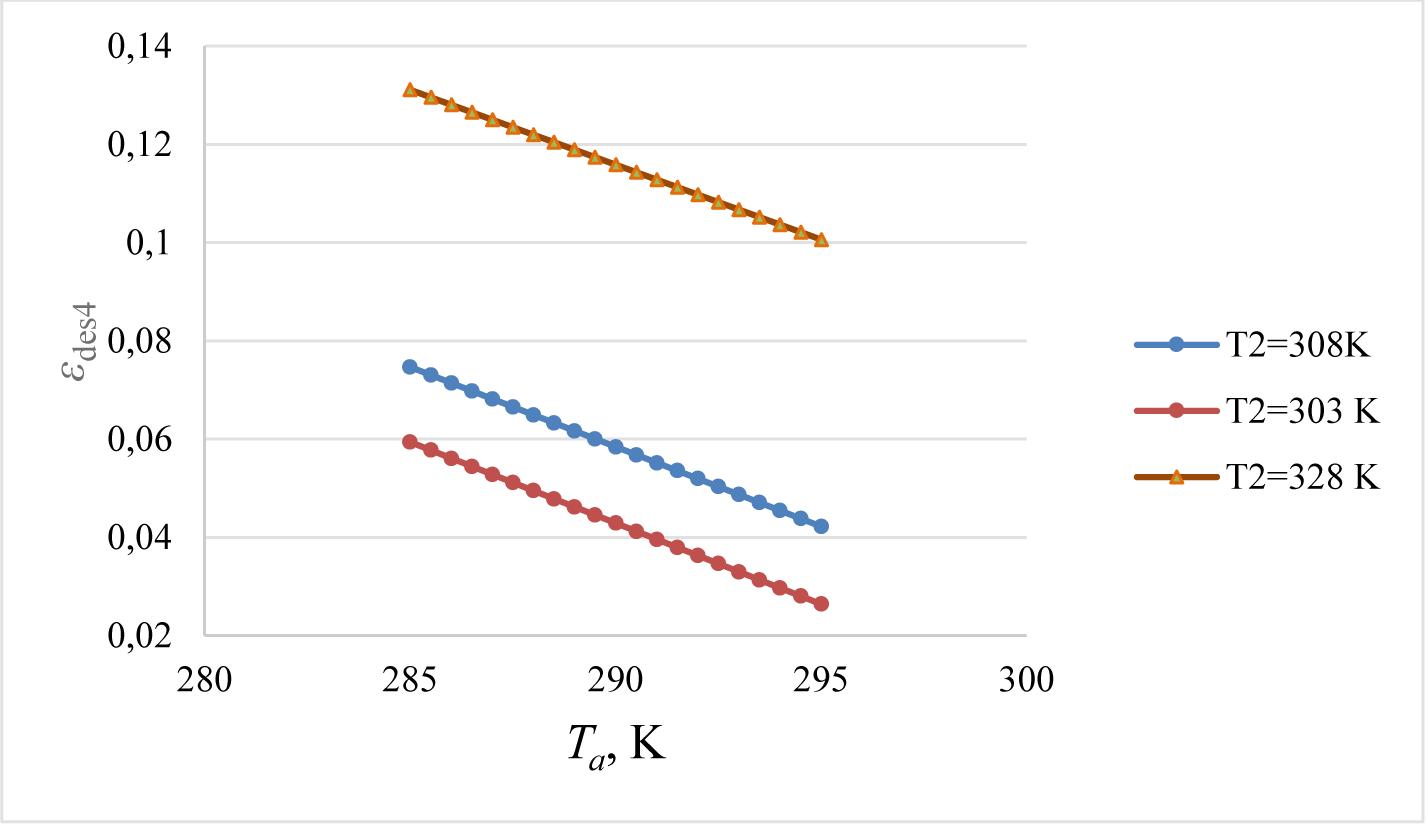
Indoor design temperature is complicated and largely depends on the production. Some vegetables, like tomatoes, require a two-zone temperature gradient. One of them is the root-zone temperature. According to this concept design, root-zone heating is independently accomplished by ground heat pipes. Root-zone heating also has natural convection and radiation heat transfer components from the surface to the indoors and plants. Convection heat transfer from the root zone surface helps adjust the indoor air temperature. The air temperature is primarily adjusted by the heat-piped, air-to-air forced-convection, and thermal radiation types of hybrid wall panels. These vertically positioned heat pipes have a low profile. Figure 8 shows that at different (Q1/E) ratios, supply exergy decreases by the outdoor temperature for a given EAHE exit temperature, T1, meaning that less unit thermal exergy, εH is necessary. This relationship also decreases the fan power of EAHE. Figure 9 shows the typical variation of εdes4, assuming that the fan exergy destruction remains constant in the limited operational range. T2 depends on the COP value of ASHP. Therefore, Figure 9 shows solutions for different T2 values that correspond to different COP values during operation. Higher the greenhouse indoor air temperature, exergy destruction decreases with higher supply air temperatures from ASHP [30], [31]. With an increase in the supply air temperature for a given outdoor air temperature, the COP of the heat pump decreases.
Variation of εdes4 with Ta and T2 (Heat Pump Supply Air Temperature)
A parametric study was carried out to demonstrate the outdoor temperature (To) effect on ψR and CO2 emissions responsibility in winter, with the following inputs and the given equations above. To is varied between 265 K and 285 K.
The following data were used as a case study. Q1/E = between 7 and 4; Tg=293 K; Tgp=291 K; T1= 285 K (fan motor heat included in winter); a=290 K; Tm= 301 K; TE= 315 K; Tp=305 K; Tr=298 K (with solar heat gain).
This result shows that even in cold weather, the exergy rationality is greater than 0.7, indicating that the greenhouse design is green by definition:
This emissions rate is very low, even without a CCS unit. For example, an on-site natural gas boiler (0.87 kW/kW) with ηb= 0.85 is responsible for direct and nearly-avoidable emissions with the following rate:
The emission responsibility of the boiler is about sixty-five times higher. Direct emissions responsibility arises if grid power is partly used for the heat pumps and fan motors. If the CCS system and Option 7 in Figure 1 are absent:
If the total heat pump compressor and three fan power demand is four kWh as a reference, and X = 0.7, In = 0.8 kW/m2, Ap is 30 m2, PV is 0.20, then the unit emissions responsibility due to the grid power demand is 1.94 kg CO2/kWh. This calculation shows that the analysis of an optimal greenhouse size, which affects power demand, heat losses, or gains and, at the same time, increases solar panel area to minimize the CO2.
Figure 10 is about the effect of To and the Q/E ratio on ψR, which is less than one. Certain high Q/E cases (cases 7 and 6) have cut-off outdoor temperatures at higher outdoor temperatures like in spring or autumn. Otherwise, ?R values tend to exceed one superficially. This condition is not thermodynamically possible. Such a limitation indicates that the Q/E ratio must be dynamically controlled during operation depending upon the outdoor temperature and solar insolation. The latter may not be practically controlled on a fixed roof, and the size of the PV installation is also fixed. Therefore, the only practical control is bypassing some sections of EAHE, reducing the fan power demand (Labyrinth Control). Another option may be to feed the surplus power to the grid if the greenhouse is connected to a grid (Grid Control).
Another design hint is that the size of the EAHE (Q/E) is also important at the design stage. For example, if a larger EAHE size is selected and few solar panels are used, at (Q/E) = 11.4, ψR approaches one, and the ΔCO2 term decrease to zero. On the other hand, if EAHE is eliminated like Q/E = 0, ψR stays at 0.95. Therefore, either a large EAHE is required, or a large set of solar PV panels must be installed (limited by the greenhouse size). Considering the construction cost of EAHE, including embodiments and solar panel cost, an optimal Q/E may be determined between these extreme cases.
Heat pumps are responsible for ΔCO2, and care must be paid for their sustainability ranking. The new exergy-based heat pump performance metric, HPF to be maximized in the heating mode, shows that the temperature range for exergy-rational operation is relatively limited. By definition, HPF is given by the following equation:
(23)
The effect of To and the Q/E ratio on ψR
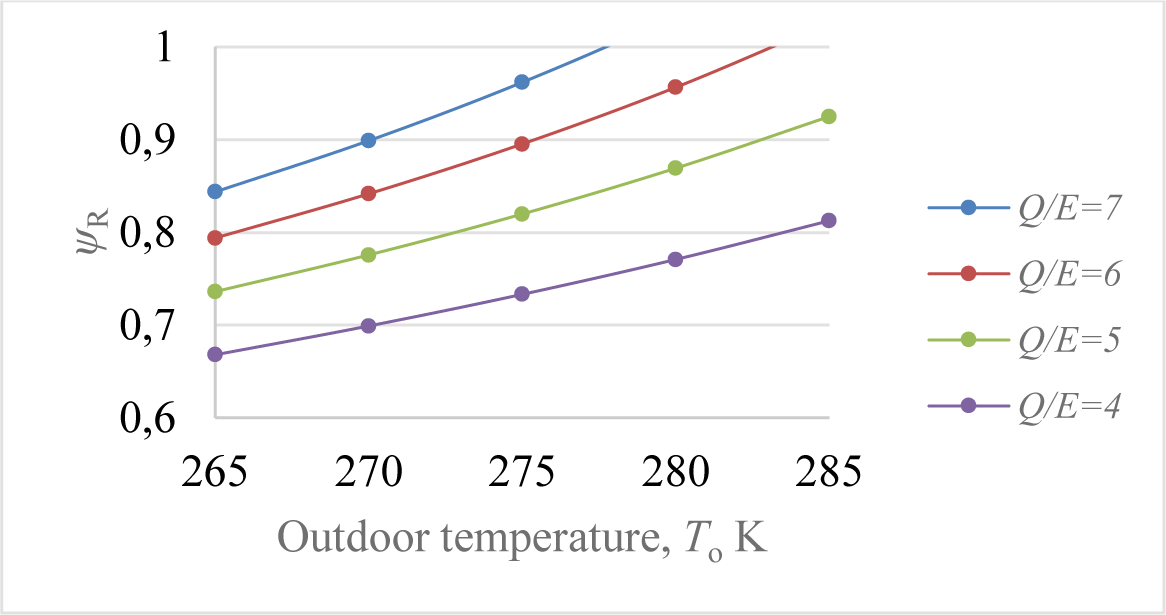
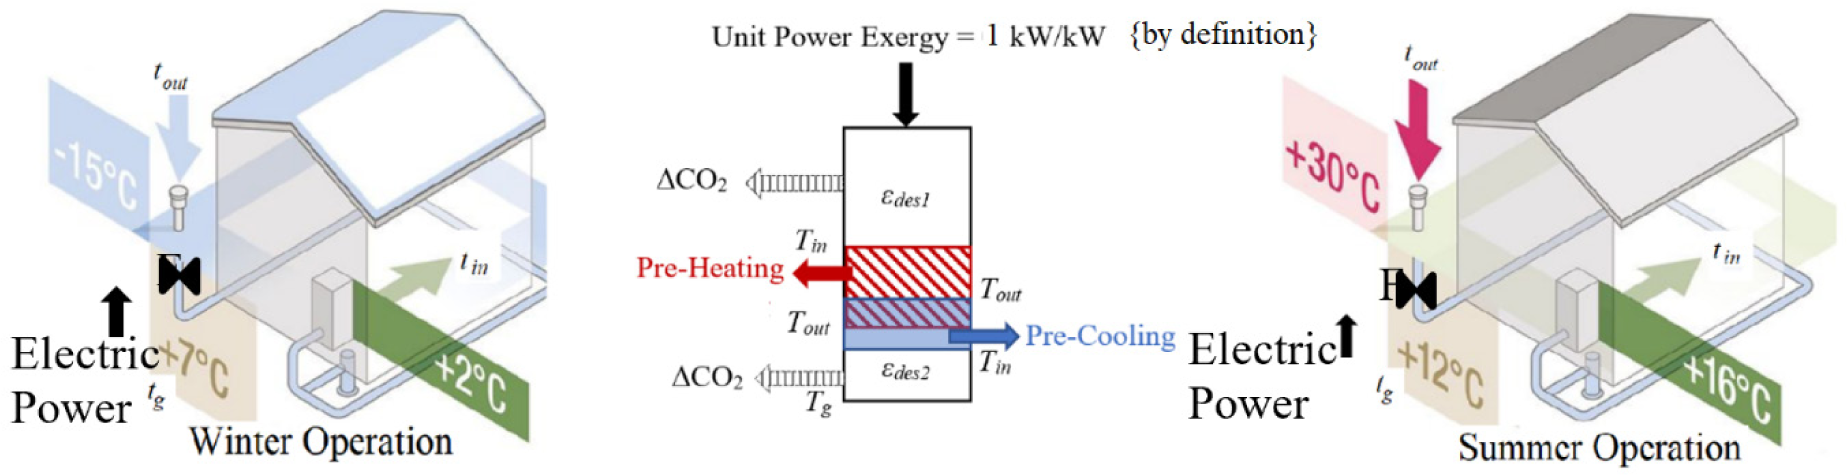
Figure 11 shows a labyrinth system for outdoor air pre-heating or pre-cooling for a building [32]. These systems are known as energy-efficient and environmentally friendly with high COP values. For this statement to be accurate and true, the electric power exergy input for the air-circulating fan(s) in the labyrinth must be much less than the thermal power exergy (supply/extraction) for a positive unit exergy gain. If, for example, the winter outdoor temperature tout is -15 °C (258 K), and the pre-heated air supply temperature, tin, is +2 °C (275 K), then for a thermal output of QH=1 kWH, the fan power must be less than 0.065 kWE:
(24)
If PFAN is 0.25 kWE (electric power) per kWH of heat QH (thermal power) in winter, exergy destruction in the following amount takes place:
This destruction is responsible for nearly-avoidable CO2 emissions. If the total fan power is supplied by the roof-mounted PV panels, then REX is 1. At the same time, they remove CO2 in proportion to the heat or cold they provide:
(25)
(26)
A Labyrinth System Representation that recognizes the Fan Power Required and Exergy Destructions [32] (detailed from the original)
The responsibility of the labyrinth for direct CO2 emissions in a proportion of the annual electrical energy demand, RFAN from the grid for annual preheating or precooling is:
(27)
If electric power is supplied by on-site solar energy systems (PV or PVT), PEF is one. The third emissions component is the nearly-avoidable emissions in the power plant, which destroys exergy downstream the power generation in the form of heat.
(28)
Figure 11 and Table 1 prove the hypothesis that this labyrinth system is responsible for 0.541 kg CO2 for each kWh of air preheating, proving the hypothesis.
Another way of using a labyrinth is cooling a solar greenhouse in the summer months, as experimentally reported by Ozgener [33] In this application, 0.736 kW is the electric power demand of the fan for a precooling capacity of 4.36 kW for summer design conditions. The outdoor air temperature is 40 °C (313 K), and it is precooled in the labyrinth to 25 °C (298 K), corresponding to a COP of 5.9. However, exergy-based COP, namely COPEX, is less than one:
According to eq. (24), the exergy of the fan power should not exceed the exergy of the thermal power supply 0.0504 × 4.36 kW = 0.219 kW. The installed fan capacity is more than three times this limit. Therefore, there is exergy destruction, Exdes in terms of destroyed power exergy:
Here, a positive sign indicates that this application is responsible for positive CO2 emissions concerning the environment.
Breakdown of total CO2 emissions responsibility of the labyrinth (Figure 11)

Irrespective of whether the electric power comes from the grid or an on-site PV system, these systems are responsible for exergy destructions. For example, the exergy destruction of a PV system is explained in Figure 4. At the same time, this labyrinth saves 4.36 kW of cooling, which otherwise should be accomplished by an electrically operated chiller with a COP of 3. In this case, the net CO2 savings is calculated by considering the electric power demand of the chiller to be satisfied by PV panels:
At this design capacity, the net CO2 savings concerning a reference of grid power supply by a natural-gas thermal power plant with ψR = 0.45 is:
The negative sign indicates that this system saves direct CO2 emissions from the power plant. Alternatively, normalizing to 1 kW of cooling:
Here, PEF is 2.5. 0.2 kg CO2/kWh is the unit CO2 content of natural gas (cK). Therefore, the labyrinth is responsible for 0.49 kg CO2 emissions in the sector per hour of operation at design conditions and saves only 0.50 kg CO2 emissions from the carbon stock. The net savings is almost nil. This sample result shows that the unit exergy difference between electric power (0.95 kW/kW) and quite a low unit thermal exergy of heat involved in a labyrinth is a crucial design and rating factor to be considered in theory and practice.
As shown in Figure 12, wind and solar energy may be harvested on a single wind-turbine tower [34]. PVT panels that can track the sun on the tower are cooled by embedded heat pipes connected to a hydronic collector in each panel. Surplus electric power is stored in a pressurized air tank inside the tower. Heat may be seasonally stored for the use of nearby farms and greenhouses. At the same time, agricultural land is spared by eliminating the land area occupied by PV panels on the ground.
Hybrid wind turbine -PVT system concept for a Dutch farm and a greenhouse
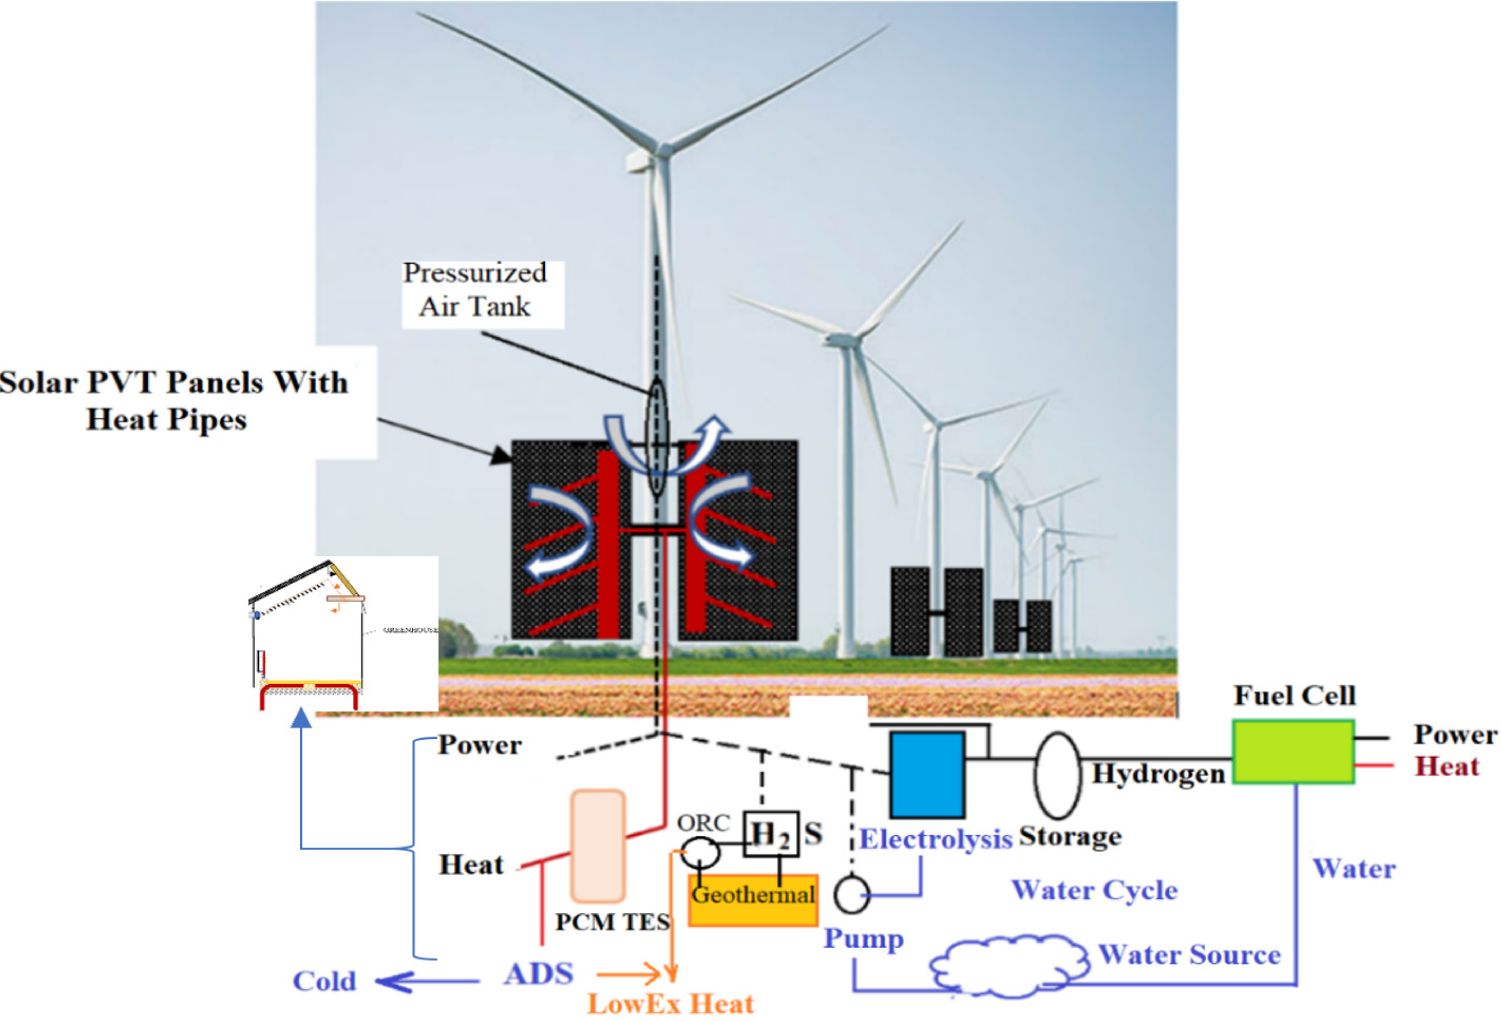
The concept of retrofitting existing wind farms by utilizing the turbine towers with PVT panels that track the sun and generate heat, power, and cold (by adsorption cooling machines, ADS) downstream will support greenhouses without any fossil fuel.
Then the wind turbine system becomes a solar trigeneration system with mechanical energy storage within the turbine tower. The hydrogen economy couples the trigeneration system generating energy and water nexus. The thermal (heat and cold) and electrical power output may be fed to the greenhouse, as described in Figure 1.
Collocating the greenhouse and the farm will also help the utilization of biogas generated at the farm in the greenhouse as fuel. Shallow geothermal, a prime interest of the EU strategists, may also be utilized. Then almost all renewable resources above and below the ground will be collected and integrated.
This paper has transformed the exergy concept into a more practical, understandable, and innovative front with a wider horizon for new sustainable decarbonization strategies involving renewable energy systems and equipment. New metrics have been developed to distinguish between exergy-rational and non-rational applications, like Energy-recovery ventilation (ERV) units. Another example of non-rationality is a one-step solar labyrinth for food drying in a cabinet [34]34]. In their prototype, the authors claimed a heat output of 3.29 kW at a temperature difference of 35 K (32 °C-67 °C) and used a 0.75 kW electric fan motor. Although this system seems energy rational (the first law) with a COP of 3.29/0.75 = 4.39, the exergy-based COP (COPEX) is only 0.21, less than one. This second result means that the exergy difference between heat and power was ignored, which is common in the industry. Unless this ignorance is eliminated, the Paris agreement targets seem almost impossible.
The agriculture and the food industry need to be integrated with cities and their surroundings such that agriculture, animal farming, built environment, mobility, and other sectors are optimally connected. Such a coupling will allow them to implement holistically conceptualized solutions to decouple global warming from human needs and activities by utilizing widely available low-temperature and renewable energy sources in the vicinity. However, mobilizing widely available low-temperature renewable sources and waste heat in the sector requires new exergy-based metrics, which have been provided in this paper. The greenhouse model presented in this paper is compatible with low-temperature district energy systems, the fifth-generation district energy (5 DE), with the same fundamental model leading to slow cities that produce their food using renewable energy. The concept may be expanded to green cities, low-exergy cities, and 100% renewable heating and cooling (100% RHC) [35]. The case study for a Dutch farm and greenhouse has confirmed that labyrinth type of ground heat exchanging design and operation needs exergy-based analysis with a careful look at exergy rationality. Otherwise, so-called green applications may be responsible for CO2 emissions in the sector. The same is true during operation, requiring a sophisticated control system to maximize the thermal exergy gain with minimum or zero-carbon responsibility, based on the outdoor and greenhouse interior conditions.
- ,
Physical and hybrid modelling techniques for earth-air heat exchangers in reducing building energy consumption: Performance, applications, progress, and challenges ,Solar Energy , Vol. 216 (1-2),pp 274-294 , 2021, https://doi.org/https://doi.org/10.1016/j.solener.2021.01.022 - ,
Energy and Exergy Analysis of Photovoltaic/Thermal Integrated with a Solar Greenhouse ,Appl Energy , Vol. 2010 (87), , https://doi.org/https://doi.org/10.1016/j.enbuild.2008.05.007 - ,
Energy and Exergy Analysis of Photovoltaic/Thermal Integrated with a Solar Greenhouse ,Energy and Buildings , Vol. 40 ,pp 2015-2021 , 2008, https://doi.org/https://doi.org/10.1016/j.enbuild.2008.05.007 - ,
Simulation Model of a Greenhouse with A Heat-Pipe Heating System ,Applied Energy , Vol. 93 ,pp 268-276 , 2012, https://doi.org/https://doi.org/10.1016/j.apenergy.2011.12.069 - ,
Determining The Optimal Design of a Closed Loop Earth to Air Heat Exchanger for Greenhouse Heating by Using Exergo Economics ,Energy and Buildings , Vol. 43 (4),pp 960-965 , 2011, https://doi.org/https://doi.org/10.1016/j.enbuild.2010.12.020 - ,
An exergetic approach to the age of universe ,International Journal of Exergy , Vol. 15 (1), 2014, https://doi.org/https://doi.org/10.1504/IJEX.2014.065108 - ,
Low Exergy Modelling and Performance Analysis of Greenhouses Coupled to Closed Earth-To-Air Heat Exchangers (EAHEs) ,Energy and Buildings , Vol. 64 ,pp 224-230 , 2013, https://doi.org/https://doi.org/10.1016/j.enbuild.2013.05.012 - , , Sustainability in Energy and Buildings, 2009
- ,
Betonkernkühlung mit Zuluft, Besser konditionieren mit weniger Energieverbrauch ,Heizung Lüftung/Klima Haustechnik , Vol. 3 ,pp 47-52 , 2002 - , , Erfahrungen aus einem Rekord-Sommer - Kiefer Luft
- ,
The Relationship Between Climate Emergency, Pandemics, and Buildings ,BRIQ , Vol. 2 (3),pp 61-68 , 2021 - , , BREEAM Outstanding Label for The International Research Institute, Energy Academy, 2021
- ,
The Thermal Energy Storage Potential of Underground Tunnels Used as Heat Exchangers ,Renewable Energy , 2021, https://doi.org/https://doi.org/10.1016/j.renene.2021.05.076 - ,
Effectiveness of A Thermal Labyrinth Ventilation System Using Geothermal Energy: A Case Study of An Educational Facility in South Korea ,Energy for Sustainable Development , Vol. 23 ,pp 150-164 , 2014, https://doi.org/https://doi.org/10.1016/j.esd.2014.07.008 - ,
Large Dynamic Thermal Labyrinth: A Step Towards Net Zero Energy Use in Acute Care Hospitals ,ACEEE Summer Study on Energy Efficiency in Buildings , Vol. 13 ,pp 215-216 , 2012 - ,
Application of Thermal Labyrinth System to Reduce Heating and Cooling Energy Consumption ,Energies (Basel) , Vol. 2762 , 2018, https://doi.org/https://doi.org/10.3390/en11102762 - ,
Field Investigations to Determine the Thermal Performance of Earth Air Tunnel Heat Exchanger with Dry and Wet Soil: Energy and Exergetic Analysis ,Energy and Buildings , Vol. 171 ,pp 107-115 , 2018, https://doi.org/https://doi.org/10.1016/j.enbuild.2018.04.026 - ,
Energy use in the EU food sector : state of play and opportunities for improvement ,Publications Office , 2015, https://doi.org/https://doi.org/10.2790/266295 - , , 2017
- ,
- , , X-Air Sustainable Greenhouse Solution [White paper], 2021
- ,
Energy System Analysis of a Pilot Net-Zero Exergy District ,Energy Conversion and Management , Vol. 87 ,pp 1077-1092 , 2014, https://doi.org/https://doi.org/10.1016/j.enconman.2014.05.014 - ,
Net-Zero Solar Buildings, What Are They and What They Should Be ,Energy , Vol. 256 ,pp 124442 , 2022, https://doi.org/https://doi.org/10.1016/j.energy.2022.124442 - ,
Prototype Semi-Transparent Photovoltaic Modules for Greenhouse Roof Applications ,Biosystems Engineering , Vol. 122 ,pp 62-73 , 2014, https://doi.org/https://doi.org/10.1016/j.biosystemseng.2014.04.003 - ,
Energy Benefits of Heat Pipe Technology for Achieving 100% Renewable Heating and Cooling for Fifth-Generation ,Low-Temperature District Heating Systems, Energies (Basel) , Vol. 14 (5398), 2021, https://doi.org/https://doi.org/10.3390/en14175398 - ,
Exergy-Optimum Coupling of Heat Recovery Ventilation Units with Heat Pumps in Sustainable Buildings ,J. sustain. dev. energy water environ. syst. , Vol. 8 (4),pp 815-845 , 2020, https://doi.org/https://doi.org/10.13044/j.sdewes.d7.0316 - , , Weather & Climate, Climate in Zwolle (Overijssel)
- , , Weather & Climate, Average Monthly Hours of Sunshine in Zwolle (Overijssel), 2021
- , Aquifer Thermal Energy Storage in the Netherlands, a research programme (2010-2012) Archieving More With Underground Thermal Energy Storage, Extended English summary of a report by the Dutch research programme MMB (Meer Met Bodemenergie), 2019
- ,
Rationalization and Optimization of Heating Systems Coupled to Ground Source Heat Pumps ,ASHRAE Transactions , Vol. 106 (2),pp 818-822 , 2000 - ,
High-Efficiency Heat Pumps for Low-Temperature Lift Applications ,12th IEA Heat Pump Conference , 2017 - , , REHAU, Awadukt Thermo
- ,
A Review on The Experimental and Analytical Analysis of Earth to Air Heat Exchanger (EAHE) Systems in Turkey ,Renewable and Sustainable Energy Reviews , Vol. 15 (9),pp 4483-4490 , 2011, https://doi.org/https://doi.org/10.1016/j.rser.2011.07.103 - , , Development of Labyrinth Type Solar Thermal Energy System, 2019
- ,
The Black Sea: A Sea of Energy, Prosperity, and Peace ,BRIQ , Vol. 2 (2),pp 58-69 , 2021