


In recent years the impacts caused by human activities have been noticed, manifesting in above-average temperatures and scarcity of natural resources [1]. There is global concern about the generation of waste and the pollution they generate in various environments. Among the waste materials that generate the most interest because they can be used as a source of green energy in different applications are the agricultural ones [2]. The growing interest in clean energy, the implementation of sustainability and the development of ecological processes have stimulated the search for alternative products that reduce the effects of non-renewable resources [3].
Biomass residues involve various material types, such as agricultural and forestry residues, which can cause environmental problems if not properly disposed of [4]. Lignocellulosic biomass, composed mainly of hemicellulose (20-35%), cellulose (35-50%) and lignin (14-26%), is the potential residue material to obtain high-value products [5], [6]. Biomass residues are generally stems and leaves, corn stover (stalks, husk and cob, leaves), rice husk, wheat straw, and sugarcane bagasse [7].The biorefinery concept arose at the end of the 1990s to value biomass and guarantee its cycle’s fulfilment. The concept was stimulated by the decrease in fossil fuels and the expanding use of renewable biomass. The developments are classified into three phases (I, II, and III), depending on the number of raw materials, technologies, and obtained products. Phase III involves using a set of technologies to obtain various by-products from biomass [7]. It is a scheme for transforming biomass of plant origin into value-added products that replace non-renewable chemical resources and energy sources [8]. The use of new sustainable biomass for the generation of biofuels is a line of study of renewed interest in the last decade due to food safety and production costs [9]. Cho et al. [10] define biorefinery as a sustainable facility coupling various conversion technologies to obtain environmentally and economically sustainable products such as biofuels and energy.
Groups of chemical process industries have existed in the world for more than a decade within a territorial area with public services, divisions, and transportation. Such an area is called an “industrial park” [11]. However, they do not have control of their waste, and the infrastructure and public services are not shared in the best way [11], [12]. Given this panorama, industrial ecology links nature and industry to innovate in industrial processes, establishing a dynamic to imitate natural ecosystems [13]. It is the principle of an eco-industrial park, defined as a group of interconnected industries seeking environmental well-being and better use and exploitation of resources [11]. Its main objectives are reusing treated wastewater, guaranteeing emissions control and sustainable energy use [14].
Nowadays, with all the damages suffered by the planet Earth and to avoid greater global warming, it is important to evaluate the sustainability and circular economy of the processes, highlighting the environmental and safety aspects to guarantee no or little damage to the environment. Implementing circular economy practices allows sustainably using resources that impact the environment where the processes are carried out [15]. All processes must consider safety [16]; the inherent safety index (ISI) is used for these cases. Regarding environmental analysis, the WAR algorithm features an environmental indicator known as PEI that denotes the potential environmental impacts of a process, including eight environmental impact categories: Human Toxicity by Ingestion (HTPI), Human Toxicity by Exposure (HTPE), Aquatic Toxicity (ATP), Terrestrial Toxicity (TTP), global warming (GWP), ozone depletion (ODP), Photochemical Oxidation (PCOP) and acidification (AP). Weight factors can be assigned to each of these categories (optional). The WAR software returns the PEI of the chemicals present in a scenario if released into the environment [17]. Therefore, this paper outlines the simulation and analysis of two potential routes of integrated biorefineries to obtain high-value-added products where the possible implementation of an eco-industrial park is evaluated for the interaction of the two developed scenarios.
Two biorefinery scenarios were simulated in the Aspen Plus software, considering the crop’s productivity, the composition of the biomasses, and experimental yields. Operating conditions and basic data, such as routes and technologies used in the simulation, were established after a literature review. The design and simulation of the processes described below consider the productive sector, the desired products, and transport logistics.
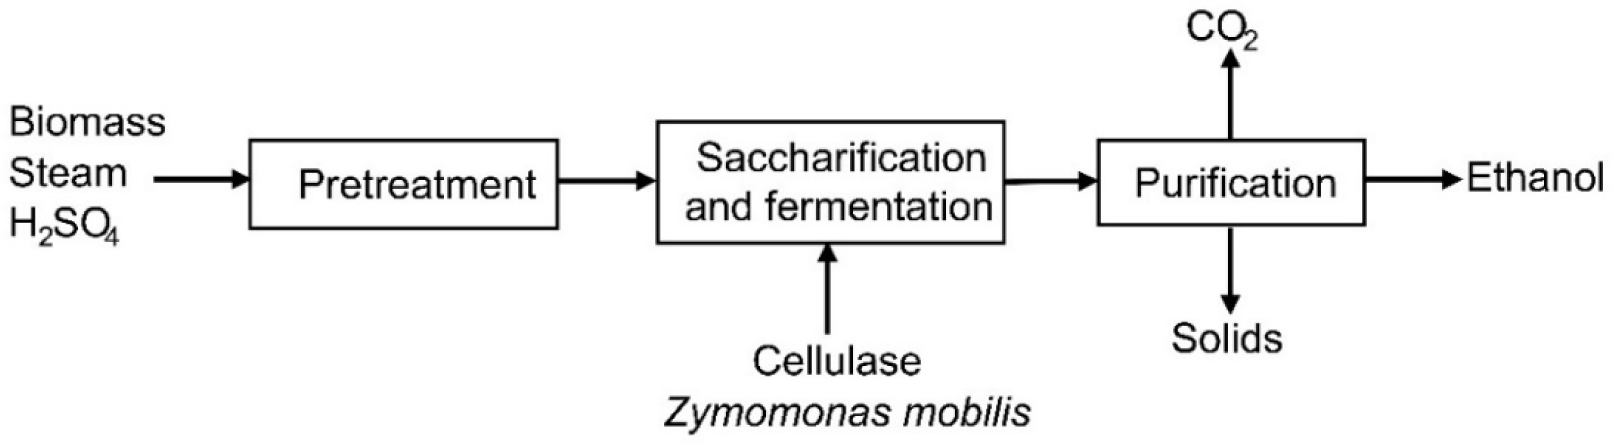
The process simulation considers three stages: a pretreatment, where the fractionation of lignocellulosic biomass takes place; a simultaneous saccharification and fermentation stage, where the sugars are converted into ethanol through biological treatment; and an ethanol purification process [18]. The fluids package used in the simulation was the NRTL with Henry components since this method is recommended for liquid phase reactions and azeotropic alcohol separation [19].
The raw material is pretreated in a rotary mill. Next, a pretreatment with acid hydrolysis was simulated [19]. In the first reactor, hemicellulose is hydrolyzed [20]. An exchanger is used to heat the mixture that enters the reactor. A second reactor was designed to make cellulose accessible for enzymatic hydrolysis. In the simultaneous saccharification and fermentation stage, cellulose breaks down into hexoses and pentoses [21]. Ethanol is then produced using the yeast Zymomonas mobilis. The two reactors involved in this process stage were simulated as stoichiometric reactors. The purification stage was simulated as a sequence of distillation towers. Figure 1 represents the block diagram of the process.
Block diagram for ethanol production
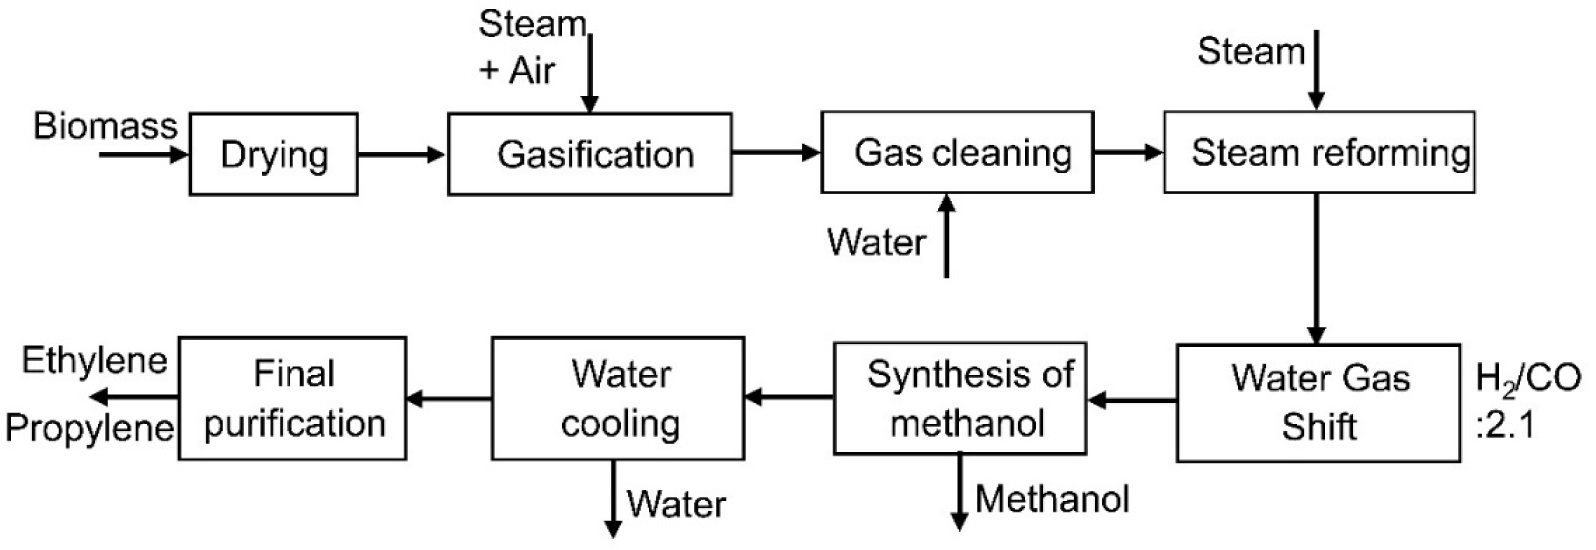
The methanol, propylene, and ethylene production process simulation was divided into eight stages: pretreatment, gasification, gas cleaning, steam reforming, methanol synthesis, methanol to olefins transformation, water cooling, and final purification [22]. The simulation employed Peng-Robinson thermodynamic package with the Boston-Mathias mixture rule (PR-BM), widely used in studying various industrial processes for non-polar or moderately polar component mixtures [23]. The biomass is dried; next, the gasification stage with two reactors was simulated, and then, in the steam reforming stage, synthesis gas is produced, favouring methanol production. Subsequently, the water-gas shift stage was simulated as an equilibrium reactor. The methanol synthesis occurs in an equilibrium reactor. Next, the gas passes through columns, part of the methanol leaves as a product, and the other evaporates and is superheated [24]. In the water-cooling stage, most water is removed [25]. Finally, the purification stage was simulated with two separation towers. Figure 2 represents the block diagram of the process.
Block diagram to produce methanol, propylene and ethylene
The energy integration of the two biorefinery scenarios was carried out to generate topology alternatives that can reduce energy consumption for each process. The optimization procedure requires simulation data for each biorefinery to perform energy integration through pinch analysis, thermal management, and resource conservation strategies. The commercial software LINGO was used for both integrations [26] that required identifying the hot and cold streams of the process to determine the heat exchange loads of the process streams in the temperature ranges [27].
The safety profiles of the biorefinery scenarios were estimated through a global analysis of the process designed and simulated in Aspen Plus. The three main stages were: pretreatment of lignocellulosic biomass, saccharification, and simultaneous fermentation. The inherent safety index (ISI) was estimated to evaluate and quantify the risks inherent to the simulated biorefinery scenarios. ISI is calculated by adding the chemical safety index (ICI) and the process safety index (IPI) [28], as shown in eq. (1):
(1)
The chemical safety index (ICI) in eq. (2) includes aspects based on the chemistry of the process:
(2)
Where the chemical interaction and corrosiveness are expressed as IINT, max and ICOR, max. In this and subsequent equations, the subscript ‘max’ indicates that the index was calculated as the maximum value possible.
From a safety point of view, the more exothermic the chemical reactions, the more dangerous they are. Therefore, to estimate the indexes IRM, max and IRS, max (standing for the heat of the main and side reaction, respectively) it was necessary to know the enthalpy (∆Hr) released by the total reaction mass in each process considering the standard heat of formation (Hf) of reactants and products employing eq. (3):
(3)
The flammability (IFL), explosiveness (IEX) and toxicity (ITOX) sub-indices are part of the dangerous substances sub-indices and are calculated based on the characteristics of each substance present in the process. Corrosivity assesses how corrosive a substance is to the equipment material that contains it. For its part, the process safety index (IPI) in eq. (4) incorporates process conditions such as pressure (Ip), temperature (IT), equipment safety (IEQ), process structure (IST) and inventory (II):
(4)
The pressure and temperature sub-indices are defined based on the operating conditions of each stage of the processes, considering that very high or very low temperatures and pressures are more susceptible to risks of loss of containment due to fractures, cracks or leaks caused by accessories. The inherent safety index (ISI) calculation considers the worst case that can happen [28].
The environmental evaluation of the biorefinery scenarios was developed using the free software WAR GUI. It employs a waste reduction algorithm where the environmental impact of each process scenario is evaluated simply from its energy consumption. The main objective is to minimise environmental and human health effects in the preliminary process design stage [29]. WAR GUI requires data on the input, output and waste streams, with their respective compositions, in addition to the energy consumption of the process [MJ/h] defining the energy source, whether coal, gas or oil. For this analysis, the PEI estimate was made with the weight factors of each impact category equal to 1 to have a globalised notion of environmental impact.
The integrated process of the biorefineries was optimised to show an alternative to the eco-industrial park between the two scenarios. A synthesis of the symbiotic network allowed the assessment of interconnection alternatives. Applying the CHO methodology proposed by Noureldin and El-Halwagi maximised the use of internal mass sources and minimised the use of external ones during the analysed process [30]. A chemical reaction to deliver the C, H, and O was synthesised. Finally, process optimisation using LINGO software determined the exchange of technologies routes for the eco-industrial park.
The two biorefinery scenarios were simulated using lignocellulosic residues from corn and oil palm. The feed for each biorefinery was 127,875 t/year of oil palm residues, respectively 51,507 t/year of corn residues.
Main raw material and products streams for Scenario 1
| Raw material (corn residues) | |
|---|---|
| Total mass flow [kg/day] | 141,018.6 |
| Cellulose [% w/w] | 36.4 |
| Galactan [% w/w] | 0.5 |
| Xylan [% w/w] | 25.0 |
| Arabinan [% w/w] | 3.1 |
| Lignin [% w/w] | 17.5 |
| Ashes [% w/w] | 9.3 |
| Protein [% w/w] | 1.6 |
| Starch [% w/w] | 6.6 |
| Products | |
| Total mass flow [kg/day] | 42,711.2 |
| Water [% w/w] | 5.9 |
| Ethanol [% w/w] | 90.4 |
| Carbon dioxide [% w/w] | 3.7 |
Main raw material and product streams for Scenario 2
| Raw material (palm oil residues) | ||
|---|---|---|
| Total mass flow [kg/day] | 317,608.1 | |
| Proximal analysis [%] | ||
| Moisture | 35.00 | |
| Fixed carbon | 9.07 | |
| Volatile Material | 86.05 | |
| Ashes | 4.88 | |
| Elemental analysis [%] | ||
| Ashes | 4.88 | |
| Carbon | 41.40 | |
| Hydrogen | 5.44 | |
| Nitrogen | 1.14 | |
| Sulfur | 0.63 | |
| Oxygen | 46.51 | |
| Product | Mas flow [kg/day] | Concentration [% w/w] |
| Methanol | 2,168.6 | 99.50 |
| Propylene | 3,862.1 | 97.87 |
| Ethylene | 2,868.5 | 90.89 |
Energy integration for ethanol production (Scenario 1) and methanol, ethylene, and propylene (MPE) production (Scenario 2) was performed as follows:
Hot and cold streams in the ethanol production scenario
| Stream name | Massflow × specific heat [kJ/(s∙K)] | Supply temperature [K] | Target temperature [K] | Enthalpy change [kW] |
|---|---|---|---|---|
| H1 | 12.8 | 375.1 | 308.2 | -856.8 |
| H2 | 44.0 | 391.2 | 385.5 | -249.7 |
| H3 | 856.7 | 394.5 | 387.3 | -6,175.7 |
| H4 | 9.2 | 351.9 | 211.4 | -1,294.8 |
| C1 | 4.3 | 373.2 | 463.2 | 386.6 |
| C2 | 1.2 | 298.2 | 333.2 | 40.8 |
| C3 | 5.4 | 298.2 | 483.2 | 994.5 |
| C4 | 9.0 | 374.2 | 483.2 | 980.9 |
| C5 | 1.0 | 298.2 | 318.2 | 20.2 |
| C6 | 13.6 | 308.2 | 323.2 | 203.9 |
| C7 | 15.9 | 310.3 | 373.2 | 997.1 |
| C8 | 1,171.4 | 391.9 | 394.5 | 3,043.2 |
| C9 | 2.3 | 385.1 | 386.1 | 2.4 |
The hot streams and cold streams required 8,577.0 kW of cooling and 6,669.6 kW of heating power from utilities to achieve their energy requirements. Using pinch methodology, the power requirements could be reduced to 6,710.0 kW and 4,802.7 kW for cooling and heating, respectively. The results represent a reduction in energy consumption of 21.8% and 28.0%.
Hot and cold streams in the MPE production scenario
| Stream name | Massflow × specific heat [kJ/(s∙K)] | Supplytemperature [K] | Targettemperature [K] | Enthalpy change [kW] |
|---|---|---|---|---|
| H1 | 582.0 | 1,285.2 | 523.2 | -4,435.8 |
| H2 | 32.9 | 524.9 | 313.2 | -6,966.8 |
| H3 | 18.9 | 523.2 | 308.2 | -4,059.6 |
| H4 | 1.1 | 717.7 | 398.2 | -346.5 |
| H5 | 1.8 | 384.7 | 310.2 | -130.9 |
| H6 | 0.3 | 502.2 | 283.2 | -73.3 |
| H7 | 70.1 | 427.9 | 406.2 | -1,525.5 |
| H8 | 85.9 | 94.3 | 85.0 | -800.9 |
| C1 | 128.1 | 298.2 | 343.2 | 5,766.4 |
| C2 | 10.6 | 367.6 | 1,103.2 | 7,769.0 |
| C3 | 15.0 | 308.3 | 523.2 | 3,222.2 |
| C4 | 1.4 | 358.2 | 623.2 | 365.7 |
| C5 | 103.5 | 125.2 | 132.4 | 746.8 |
Hot and cold streams required 18,339.3 kW and 17,870.1 kW of power to attain their energy demands. Again, using pinch methodology, the cooling and heating power needs could be reduced to 2,320.0 kW and 1,851.3 kW, respectively. The results represent a reduction in energy consumption of 87.3% and 89.6%.
The estimation of the inherent safety index (ISI) was carried out for each biorefinery scenario.
The enthalpies were calculated for each reaction in the acid hydrolysis and fermentation stages to estimate the heat indexes of the main and secondary reactions. The most exothermic main reaction is the conversion of glucose to ethanol, occurring in the saccharification and simultaneous fermentation reactor with a heat of 385,000 J/kg. Therefore, its heat index is 1 as the reaction is slightly exothermic.
Inherent safety index of the ethanol production process
| Comments | Score | |
|---|---|---|
| Chemical safety index (ICI) | ||
| Heat of the main reaction | Ethanol production – 385,000 J/kg | 1 |
| Heat of the side reaction, max | Acetic acid formation – 998,000 J/kg | 2 |
| Flammability, Toxic exposure, Explosiveness, max | Ethanol – H2SO4 - Glycerol | 6 |
| Corrosiveness | Stainless steel | 1 |
| Chemical interaction | H2SO4 with organic acids and combustible material | 4 |
| ICI | 14 | |
| Process safety index (IPI) | ||
| Inventory | 5.0594 kg/s | 2 |
| Process temperature, max | 463.15 K | 1 |
| Process pressure, max | 1,300 kPa | 1 |
| Equipment safety | High-risk reactors | 3 |
| IPI | 7 | |
| ISI | 21 |
Acetic acid and lactic acid formation are secondary reactions that occur in the fermentation stage. The maximum value of the heat of the reaction is 998,000 J/kg required to produce acetic acid, so its score is 2 as it is a moderately exothermic secondary reaction.
The most dangerous materials in this process were ethanol and sulfuric acid (H2SO4). The sum of their flammability, explosiveness, and toxicity indices reaches the maximum score of 6. Ethanol has the highest flammability index as it has a flash point below 288.15 K, being easily flammable. The sulfuric acid and glycerol have a toxicity index of 5 and 4, which could generate adverse health effects due to toxicity in the event of a leak or unwanted release. Stainless steel is the construction material for the process equipment. The corrosivity subindex equals 1, reflecting the corrosivity of the chemical substances involved in each stage of the process and their interactions. For example, the interaction of sulfuric acid with organic acids can cause oxidation resulting in the formation of gases and heat.
Concerning the process safety sub-indices, the maximum inventory in the process is 18,250 kg, considering one hour as residence time in most equipment pieces; therefore, a score of 2 is obtained. On the other hand, the maximum temperature and pressure of the process are 463.15 K and 1,300 kPa, occurring in the acid hydrolysis reactor, whose score would then be 1 for the corresponding sub-indices. The safety subindex of the equipment is scored with a value of 3 due to the presence of high-risk reactors for acid hydrolysis and simultaneous saccharification and fermentation. An ISI of 21 is obtained for this scenario by adding the chemical and inherent safety indexes.
The main reaction that presents the maximum heat reaction is the extremely exothermic methanol synthesis reaction with 4,002,000 J/kg; therefore, a score of 4 is reached. On the other hand, the water-gas shift reaction simulated to adjust the H2/CO molar ratio before the synthesis of methanol presents a heat of reaction of 895,000 J/kg, scored with 2 being a moderately exothermic reaction.
Inherent safety index of the methanol, propylene, and ethylene (MPE) production process
| Comments | Score | |
|---|---|---|
| Chemical safety index (ICI) | ||
| Heat of the main reaction | Methanol production – 4,002,000 J/kg | 4 |
| Heat of the side reaction, max | Water-gas shift – 895,000 J/kg | 2 |
| Flammability, Toxic exposure, Explosiveness, max | CO – H2S | 8 |
| Corrosiveness | Stainless steel | 1 |
| Chemical interaction | H2S with combustible material | 4 |
| ICI | 19 | |
| Process safety index (IPI) | ||
| Inventory | 4.056 kg/s | 2 |
| Process temperature, max. | 1,373.15 K | 4 |
| Process pressure, max | 1,300 kPa | 3 |
| Equipment safety | High-temperature & -pressure reactors | 3 |
| IPI | 12 | |
| ISI | 31 |
Regarding the dangerousness of the chemical substances in this scenario, carbon monoxide (CO) and hydrogen sulfide (H2S) are the components with the most dangerous chemical properties in the event of a disturbance or emergency. Carbon monoxide is flammable, the difference between the upper and lower explosive limits is 61.7, and the maximum permissible exposure limit is 25 ppm (TLV). The maximum sum of this scenario’s flammability, toxicity and explosiveness sub-indices is 8.
Due to the nature and physicochemical characteristics of all the substances involved in this scenario, the construction material required to avoid severe corrosion would be stainless steel, so this subindex has a score of 1. The most dangerous chemical interaction evidenced in all these scenarios is the undesired reaction of hydrogen sulfide with fuel material (lignocellulosic biomass). When occurring in contact with water, it can yield flammable hydrogen gas, so this index is scored with a maximum value of 4.
The process conditions, such as temperature and pressure in this scenario, reach high values, especially in the steam reforming stages where the synthesis gas is obtained; therefore, the process temperature subindex reaches its maximum value of 4. As for pressure, the highest value in the process occurs in the methanol synthesis stage with 9,000 kPa, classifying with a score of 3. For the subindex equipment safety, the highest score is 3 considering the presence of equipment that handles very high temperatures and pressures and is more prone to fire and explosion hazards in the event of a process failure, mainly in the biomass gasification and steam reforming stages. In short, adding the chemical safety index and the inherent safety index, an ISI of 31 is obtained for this scenario. A process is considered high risk from an ISI greater than 24, so one can say that the ethanol production process is considerably safer than the methanol, propylene, and ethylene production process.
Environmental impact was considered to assess the proposed scenarios and to compare their sustainability profiles. Figure 3 shows the Potential Environmental Impact Index (PEI/h) of the two biorefineries evaluated and the respective impact categories. The PEI/h index for Scenario 2 is higher than for Scenario 1, mainly because the input and output mass flows of Scenario 2 are representatively higher.
Total potential environmental impact index for the two biorefinery scenarios
For Scenario 1, the main environmental concerns are photochemical oxidation (PCOP), human toxicity by ingestion (HTPI), and terrestrial toxicity (TTP). The potential for smog formation or photochemical oxidation (PCOP) has an impact of 1,600 PEI/h, mainly associated with traces of volatile organic components generated by the burning or oxidation of substances in this scenario, such as organic acids, methanol, and glycerol. In addition, the HTPI and TTP for this scenario present an index of 669 PEI/h, which is associated with the formation of furfural and organic acids generated as unwanted products in the saccharification and fermentation reactions. Simultaneously, furfural is toxic if ingested, and its vapour, being heavier than air, can dissipate through the soil, contaminating it. The presence of sulfuric acid in this scenario directly impacts the category of human toxicity by exposure/inhalation (HTPE) in case this chemical is released into the environment, causing damage to human health such as irritation of the respiratory tract, burns, blindness, nausea, among others.
Scenario 2, handling larger masses, presents higher environmental impact index (PEI/h) values, mainly in the aquatic toxicity (ATP) category. This result is mainly attributed to the discharge of streams with acid. Hydrogen sulfide has a high impact in the acidification category (AP) because its atmospheric emission can cause acid rain. The categories of toxicity by ingestion (HTPI) and terrestrial toxicity (TTP) generate an index of 3,840 PEI/h directly related to the presence of ammonia. This unwanted product turns out to be serious if released excessively, causing skin burns, lung problems, and blindness, among other adverse effects. The potential for smog formation also influences the environmental impact of this scenario, generating 1,120 PEI/h, which is mainly related to the volatile components generated by burning fossil fuels present in this scenario, such as ethylene, propylene, butene, and pentene.
After simulation, the energy integration, and safety and environmental analysis of the two biorefineries (Scenario 1 and Scenario 2), one can propose the interaction between processes to increase productivity and to look for a reduction in energy consumption. The proximity between the processes allows the collection of raw materials and the viability of companies for national and international environmental adaptations [31]. The implementation of the eco-industrial park allows the development of the competitiveness of intermediate sectors, such as obtaining plastics, agrochemicals, and paints through interconnection with products such as ethylene, ethanol, methanol, and propylene. This strategy allows generating value-added products to achieve the cluster’s capability potential involving the circular economy.
CHOSYN methodology was applied to propose a network between the ethanol and MPE processes as an eco-industrial park alternative. For the optimisation, several compounds of interest identified for the interaction between the biorefineries were carbon dioxide, water, hydrogen, ethylene, carbon monoxide, ethanol, and methanol. Figure 4 shows the scheme for the eco-industrial park with the two biorefineries and the intermediate reactions pathway.
Eco-industrial park for ethanol-MPE production
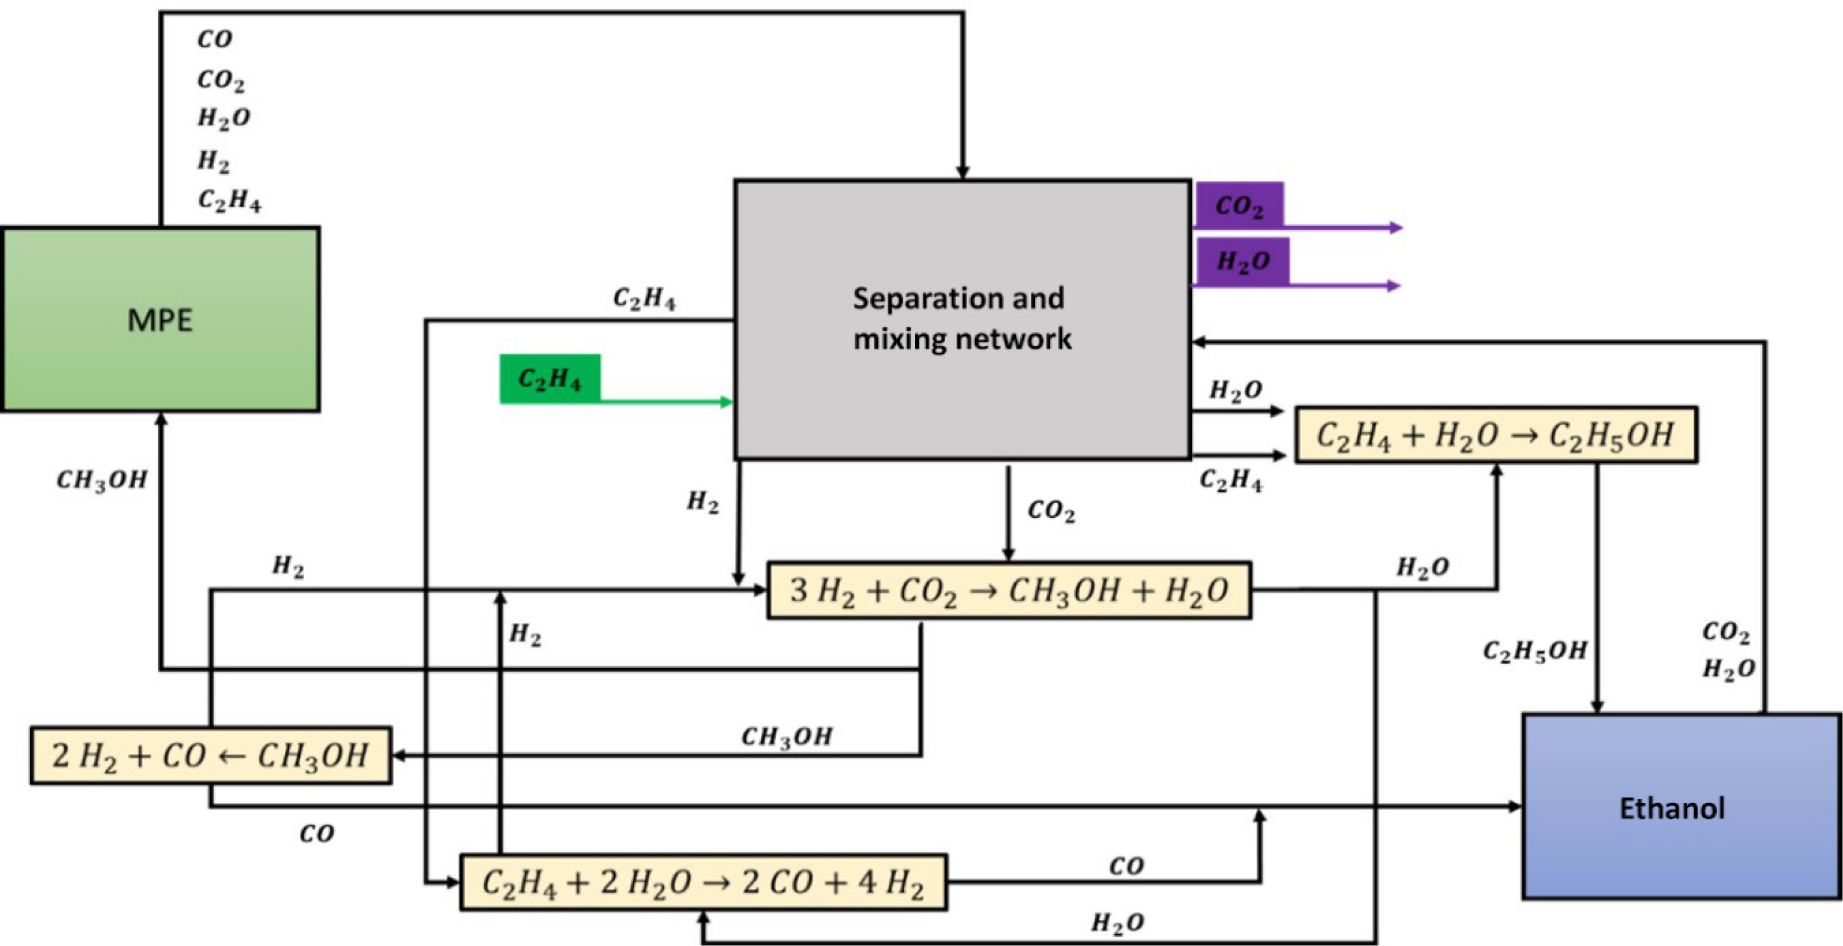
The interaction between processes through the eco-industrial park network shows the potential connections that can reduce emissions and by-products and obtain high-value products with interest for both industries.
It is possible to achieve eco-industrial parks that successfully connect biorefineries' needs and opportunities to increase the cluster’s global productivity and reduce energy requirements, emissions, and raw materials. It represents an opportunity to improve the competitiveness of intermediate sectors because these productive chains stimulate the creation of new companies, boosting the economy and good practices.
The simulation of two potential biorefinery routes to obtain ethanol (Scenario 1) and methanol, propylene, and ethylene (Scenario 2), obtaining 90% w/w ethanol in Scenario 1, and 99.5 %w/w methanol, ethylene at 90.89 %w/w and propylene with a concentration of 97.87 %w/w in Scenario 2. In the ethanol production process, due to excess heat discharge to cooling utilities, the potential to reduce heating and cooling energy consumption was greater for route 2 by more than 60% for both utilities. Concerning security profiles, the route 1 process is inherently more secure. Regarding the environmental analysis, Scenarios 1 and 2 present chemical substances that have an environmental impact, where Scenario 2 is the one that generates the greatest environmental impact due to the complexity of its production. Finally, it is necessary to re-evaluate the design of Scenario 2, emphasizing the recovery of vents and effluents of unwanted products into the environment and optimizing production. Implementing the industrial eco-park makes it possible to take full advantage of the cluster’s capacities, involving the circular economy through the interconnection of substances such as ethylene, ethanol, methanol, and propylene.
The authors acknowledge the Universidad de Cartagena for their support in developing this research (Act 041-2019 and 041-2021).
| Cv | cold streams | |
| Hf | standard heat of formation | [J/kg] |
| ΔHr | reaction enthalpy | [J/kg] |
| Hu | hot streams | |
| I | index | |
| ICI | chemical safety index | |
| IPI | process safety index | |
| ISI | inherent safety index | |
| Subscripts and superscripts | ||
| COR | corrosiveness | |
| EQ | equipment safety | |
| EX | explosiveness | |
| FL | flammability | |
| I | inventory | |
| INT | chemical interaction | |
| ST | process structure | |
| T | temperature | |
| TOX | toxicity | |
| f | formation | |
| max | maximum value possible used to calculate indexes | |
| p | pressure | |
| r | reaction | |
| u | hot stream number | |
| v | cold stream number | |
| Abbreviations | ||
| AP | Acidification Potential | |
| ATP | Aquatic Toxicity Potential | |
| CHO | Carbon-Hydrogen-Oxygen | |
| CHOSYN | Carbon-Hydrogen-Oxygen Symbiosis Network | |
| GWP | Global Warming Potential | |
| HTPE | Human Toxicity by Exposure | |
| HTPI | Human Toxicity by Ingestion | |
| MPE | Methanol, Propylene and Ethylene | |
| NRTL | Non-Random Two-Liquid | |
| ODP | Ozone Depletion Potential | |
| PCOP | Photochemical Oxidation Potential | |
| PEI | Potential Environmental Impacts | |
| PR-BM | Peng-Robinson with Boston-Mathias mixture rule | |
| TLV | Threshold Limit Value | |
| TTP | Terrestrial Toxicity Potential | |
| WAR | WAste Reduction | |
- ,
Challenges and opportunities in assessing sustainability during chemical process design ,Current Opinion in Chemical Engineering , Vol. 26 ,pp 96–103 , 2019, https://doi.org/https://doi.org/10.1016/j.coche.2019.09.003 - ,
An analysis of liquid-biofuel production potential from agricultural residues and animal fat (case study: Khuzestan Province) ,Journal of Cleaner Production , Vol. 204 ,pp 819–831 , 2018, https://doi.org/https://doi.org/10.1016/j.jclepro.2018.09.031 - ,
Seawater-based biorefineries: A strategy to reduce the water footprint in the conversion of lignocellulosic biomass ,Bioresource Technology , Vol. 344 ,pp 1–18 , 2022, https://doi.org/https://doi.org/10.1016/j.biortech.2021.126325 - ,
Biomass potential from agricultural waste for energetic utilization in Greece ,Energies , Vol. 12 ,pp 1–20 , 2019, https://doi.org/https://doi.org/10.3390/en12061095 - ,
Complete conversion of lignocellulosic biomass into three high-value nanomaterials through a versatile integrated technical platform ,Chemical Engineering Journal , Vol. 428 ,pp 1–14 , 2022, https://doi.org/https://doi.org/10.1016/j.cej.2021.131373 - ,
The potential use of lignin as a platform product in biorefineries: A review,” Renewable and Sustainable Energy Reviews , Vol. 138 ,pp 1–24 , 2021, https://doi.org/https://doi.org/10.1016/j.rser.2020.110688 - ,
Opportunities, recent trends and challenges of integrated biorefinery: Part i ,Renewable and Sustainable Energy Reviews , Vol. 43 ,pp 1427–1445 , 2015, https://doi.org/https://doi.org/10.1016/j.rser.2014.11.092 - ,
Biorefinery: Ensuring biomass as a sustainable renewable source of chemicals, materials, and energy ,Biomass and Bioenergy , Vol. 39 ,pp 1–4 , 2012, https://doi.org/https://doi.org/10.1016/j.biombioe.2010.12.042 - ,
Model for Energy Consumption and Costs of Bioethanol Production from Wastepaper ,Journal of Sustainable Development of Energy, Water and Environment Systems , Vol. 10 (4),pp 1–11 , 2022, https://doi.org/https://doi.org/10.13044/j.sdewes.d10.0431 - ,
Bioconversion of biomass waste into high value chemicals ,Bioresource Technology , Vol. 298 ,pp 1–12 , 2020, https://doi.org/https://doi.org/10.1016/j.biortech.2019.122386 - ,
Roles of geospatial technology in eco-industrial park site selection: State–of–the-art review ,Journal of Cleaner Production , Vol. 309 ,pp 1–14 , 2021, https://doi.org/https://doi.org/10.1016/j.jclepro.2021.127361 - ,
A causal eco-industrial park hierarchical transition model with qualitative information: Policy and regulatory framework leads to collaboration among firms ,Journal of Environmental Management , Vol. 292 ,pp 1–14 , 2021, https://doi.org/https://doi.org/10.1016/j.jenvman.2021.112735 - ,
Unfolding eco-industrial parks through niche experimentation: Insights from three Italian cases ,Journal of Cleaner Production , Vol. 239 ,pp 1–12 , 2019, https://doi.org/https://doi.org/10.1016/j.jclepro.2019.118069 - ,
Eco-industrial park (EIP) development in Viet Nam: Results and key insights from UNIDO’s EIP project (2014-2019) ,Sustainability (Switzerland) , Vol. 11 (17),pp 1–23 , 2019, https://doi.org/https://doi.org/10.3390/su11174667 - ,
Evaluating Barriers, Enablers and Opportunities for Closing the Loop through ‘Waste Upcycling’: A Systematic Literature Review ,Journal of Sustainable Development of Energy, Water and Environment Systems , Vol. 10 (1),pp 1–20 , 2022, https://doi.org/https://doi.org/10.13044/j.sdewes.d8.0367 - ,
Inherent safety index module (ISIM) to assess inherent safety level during preliminary design stage ,Process Safety and Environmental Protection , Vol. 86 ,pp 113–119 , 2008, https://doi.org/https://doi.org/10.1016/j.psep.2007.10.016 - ,
The waste reduction (WAR) algorithm: Environmental impacts, energy consumption, and engineering economics ,Waste Management , Vol. 20 (8),pp 605–615 , 2000, https://doi.org/https://doi.org/10.1016/S0956-053X(00)00047-7 - ,
Design strategies for sustainable biorefineries ,Biochemical Engineering Journal , Vol. 116 ,pp 122–134 , 2016, https://doi.org/https://doi.org/10.1016/j.bej.2016.06.009 - ,
Pretreatment methods of lignocellulosic biomass for anaerobic digestion ,AMB Express , Vol. 7 (1),pp 1–12 , 2017, https://doi.org/https://doi.org/10.1186/s13568-017-0375-4 - ,
Integrated Biorefinery from Corn Waste Biomass : A Case Study in the North of Colombia ,International Journal of ChemTech Research , Vol. 11 (01),pp 33–40 , 2018, https://doi.org/https://doi.org/10.15446/ing.investig.v40n2.82539 - ,
Ethanol Production from High-Solid SSCF of Alkaline-Pretreated Corncob Using Recombinant Zymomonas mobilis CP4 ,Bioenergy Research , Vol. 6 (1),pp 292–299 , 2013, https://doi.org/https://doi.org/10.1007/s12155-012-9256-5 - ,
Integration of biomass gasification with a Scandinavian mechanical pulp and paper mill - Consequences for mass and energy balances and global CO2 emissions ,Energy , Vol. 44 (1),pp 420–428 , 2012, https://doi.org/https://doi.org/10.1016/j.energy.2012.06.013 - , Thermodynamic and experimental study of the supercritical water reforming of model compounds contained in the bio-oil aqueous fraction” (in Spanish), Master Thesis, Department of Chemical and Environmental Engineering, 2016
- , Process integration study of biomass-to-methanol (via gasification) and methanol-to-olefins (MTO) processes in an existing steam cracker plant, Master Thesis, Department of Energy and Environment, Chalmers University of Technology, 2013
- , Process Design and Simulation of Propylene and Methanol Production through Direct and Indirect Biomass Gasification, Master Thesis, 2016
- ,
Optimal biorefinery product allocation by combining process and economic modeling ,Chemical Engineering Research and Design , Vol. 86 (7),pp 800–808 , 2008, https://doi.org/https://doi.org/10.1016/j.cherd.2008.03.004 - ,
Introduction to Sustainability, Sustainable Design, and Process Integration ,Sustainable Design Through Process Integration ,pp 1–14 , 2012, https://doi.org/https://doi.org/10.1016/b978-1-85617-744-3.00001-1 - , Inherent safety in process plant design,” PhD Thesis, Technical research center of Finland, 1999
- Waste Reduction Algorithm: Chemical Process Simulation for Waste Reduction, https://www.epa.gov/chemical-research/waste-reduction-algorithm-chemical-process-simulation-waste-reduction, [Accessed Feb. 01, 2022]
- ,
Synthesis of C-H-O Symbiosis ,AIChE Journal , Vol. 64 (4),pp 1242–1262 , 2015, https://doi.org/https://doi.org/10.1002/aic.14714 - ,
Industrial Eco-parks, a Sustainable Development Option for the Regional Productive Sector ,Acta Nova , Vol. 2 ,pp 452–458 , 2003