


Since the 1960s, research on environmental protection and planning has focused on establishing that responsibility for the solutions to environmental problems lies largely in the personal responsibility of the individual citizens and their behaviour and habits as well as their political and social actions. Stapp et al. [1] proposed major objectives environmental education should develop to satisfy the need for educated and conscious citizens, and they are: (i) a clear understanding of human position in nature as an inseparable part; (ii) a broad understanding of the environment (both natural and artificial); (iii) understanding of problems and possible solutions; and (iv) development of the attitude towards environmental protection and preservation. The proposal included an interdisciplinary approach and student-centred activities to enable students to become active citizens with knowledge and tools for political action.
Hillygus [2] emphasised the significance of a civic skills curriculum, part of which could also be learning about environmental protection and enhancing political participation. However, later research showed the need to reassess Stapp’s ideas on what a proper way of teaching environmental protection should correspond to. Kopnina [3] emphasised the importance of social inclusion as a main factor in teaching environmental issues. Duvall and Zint [4] postulated the significance of adult role models, especially parents, in adopting knowledge on similar topics. Khan [5], inspired by critical theory and its notable authors, proposed a whole new model of education called Eco pedagogy. Kam & Palmer [6] indicated the role of institutional education as one of the main forces in further enrolling in political action.
Duvall & Zint [4] found that other factors, including parents’ involvement and communication with their children, community involvement and hands-on approach to resolving local issues, could also positively affect expected educational outcomes. Jickling & Wals [7] presented different environmental education models calling – with some caution – for a heuristic approach to building the “environmental thought and action”.
Glasman & Albarracín [8] found that attitudes formed on consistent one-sided information that is easily recalled strongly affect future behaviour. Hart & Nolan [9] identified teachers’ and students’ attitudes and children’s ideas to be the main predictors of successful environmental education. Meanwhile, the world has changed significantly in some past decades.
Since 2015 [10], most people in developed countries use to acquire knowledge of the world around them through digital sources. The percentage of users getting the news through various social network sites is steadily on the rise [11], with YouTube and Facebook among the most popular, considering all demographic groups [10] and TikTok leading as a main news source for Americans under 30 [11].
Two out of three social network sites primarily feature video content, and Facebook and Instagram lately prioritise video formats in user newsfeeds. Another phenomenon rising concurrently with the ascent of social media and the usage of smartphones is the growth of amateur content creation and sharing [12]. Many users record their everyday activities, often in video blogs and/or live blogging [13], and these trends are also observable in formal, non-formal and informal education [14].
Brame [15] found three important elements to be considered for the successful use of video in education: (i) cognitive load; (ii) student engagement; and (iii) active learning with connectivity to the content as an element important for all mentioned factors. La Belle [16] defined informal education as a “lifelong process by which every person acquires and accumulates knowledge, skills, attitudes and insights from daily experiences and exposure to the environment”, and Tan [17] emphasised YouTube as a perfect channel for informal learning and knowledge sharing when used with caution and supervision. Several cases explore the effectiveness of educational videos in informal environments considering topics related to STEM.
Hsin and Cigas [18] found increased student engagement and grades after introducing short educational videos into math and science lectures. Smith [21] showed that engaging with video production while learning about chemistry empowers students and provides greater satisfaction. Hunsinger et al. [19] highlighted that although videos come in many forms and formats, they could be observed as short movies, especially if they are made professionally or with a tendency to meet aesthetic and narrative values. In that sense, a movie is a medium that does not always have to be artistic, but neither a mere mechanical reproduction of reality itself but a combination of all of those elements, from camera angle to other technical aspects of movie production to the story itself. As Arnheim [20] explained in his pivotal study of the relatively new medium, a movie is a product of various techniques of elements variation not only on a shot level but at a level of a single thumbnail.
In the 19th and early 20th centuries, the movie was the fine art of silent moving images. With the movie’s development, the scenes are “broken” into several shots of different lengths and plans, and later the camera’s movement was added to increase the drama. For the audience not to watch the movie in complete silence, pianists or organists were often engaged, and even the whole orchestra performed the music that accompanied the action. In the early 1920s, most movies came with a prepared musical notation or with all the movie music for large-scale movies [21].
Most of the research on short online videos focuses on the narrative and content part of the movies following some of Arnheim’s typologies [22]. Still, certain authors offer a different approach to movie analysis. Muller & Tan [23] saw movies through (i) discourse level; (ii) object level; (iii) image level; and (iv) physical level. The “father” of statistical analysis of movie styles, Barry Salt, proved by manual measurements that there is a pattern that repeats itself, depending on the era in which the movie is made, but also on the personal characteristics of each author [24].
Salt considered that the simplest and very effective way to detect a pattern is to measure the length of the frame. The movie's rhythm is achieved by alternating frames of different content and changing the length of each frame. Shorter shots, characteristic of action movies, have a high rhythm and affect emotions. In comparison, longer shots act slower but are more realistic because they show the course of the action or call for contemplation and deeper understanding. More than 80% of information is received by man through sight, which makes the eye one of the most important sensory organs [25].
Hollander emphasised the importance of colour in the movie, which can be used to manipulate the visual experience and the drama, directly influencing the viewer’s emotions [26]. There are different colour systems [27], and the most common are the additive colour system RGB (Red-Green-Blue), the subtractive colour system RYB (Red-Yellow-Blue), and the CMYK colour system (Cyan-Magenta-Yellow-Black). Computer monitors, television sets, and movie theatres use an RGB system. The subtractive colour system is commonly used in the fine arts.
Most artists recognise red, yellow, and blue as primary colours. These primaries are pure colours that cannot be created by mixing other colours. In the print industry, cyan, magenta, yellow and black are the primary colours, corresponding to the CMYK Colour System. This article focuses on two elements of the movies: shot (frame) length and colour.
Although the Ishikawa Diagram is a tool for analysis to discover the root cause of a problem (it is a cause-and-effect diagram [28]), it will be used in this paper to show the complexity of the movie system. The diagram shown in Figure 1 was developed as a knowledge-based model according to Systems Theory.
The main division of the Basic elements of the movie is into the Audio and Visual part (or the movie's cause). Human perception is divided into tactile, auditory, and visual. The movie’s sound (Audio part) is divided into music, noise, and speech. In contrast, the image (Visual part) is divided into Camera angles, Camera movement, Scale of the plans,and Movie frame. The Movie frame (length and colours of the RGB spectrum) is the part that will be analyzed in this paper using the cinemetrics method.
Ishikawa diagram

Two main data sets were collected and observed for the research: the frame length and colour composition statistics. Both data sets were analyzed by appropriate statistical tests and associated with corresponding elements of the movie narrative, further explained in the results and discussion section.
There are three basic ways to achieve rhythm in the movie. These are the movement of the camera itself, the montage-rhythmic change of frames, and the movement (rhythmic content) achieved within the camera. The camera’s movement guides the viewers’ interest and follows the events in the scene. The rhythm of the movie editing is achieved by changing frames of different content and changing the length of each frame. Shorter shots, characteristic of the action movie, have a high rhythm and affect emotions, while longer shots act slower but are more realistic because they show the action in its course [29].
Movement within the frame can be rhythmically shaped by the arrangement of objects and persons within the frame, their mutual relations, interactions, movements, etc. This movement can be further emphasised by music, noises, or human speech, which are also an essential part of the movie’s rhythmic structure. Frame length statistics were made for a short feature movie, “Let’s Recycle” by Swachh Bharat Mission. In 2016, the movie won the MTV Junkyard Film Festival Award for Best Short Film and the Suchitwa Mission Think Clean Festival. The analysis of the length of the movie’s frames is shown in Table 1.
The frame length of the movie “Let’s Recycle”
t [min] |
Δt [min] |
t [min] |
Δt [min] |
t [min] |
Δt [min] |
t [min] |
Δt [min] |
t [min] |
Δt [min] |
|---|---|---|---|---|---|---|---|---|---|
0.01 |
|
0.28 |
0.02 |
0.46 |
0.01 |
1.01 |
0.02 |
1.34 |
0.02 |
0.03 |
0.02 |
0.30 |
0.02 |
0.47 |
0.01 |
1.03 |
0.02 |
1.35 |
0.01 |
0.05 |
0.02 |
0.31 |
0.01 |
0.49 |
0.02 |
1.04 |
0.01 |
1.39 |
0.04 |
0.36 |
0.05 |
0.50 |
0.01 |
1.07 |
0.03 |
1.41 |
0.02 |
||
0.38 |
0.02 |
0.52 |
0.02 |
1.10 |
0.03 |
1.43 |
0.02 |
||
0.18 |
0.02 |
0.40 |
0.02 |
0.53 |
0.01 |
1.13 |
0.03 |
1.48 |
0.05 |
0.20 |
0.02 |
0.42 |
0.02 |
0.54 |
0.01 |
1.15 |
0.02 |
1.50 |
0.02 |
0.22 |
0.02 |
0.44 |
0.02 |
0.57 |
0.03 |
1.20 |
0.05 |
1.52 |
0.02 |
0.26 |
0.04 |
0.45 |
0.01 |
0.59 |
0.02 |
1.24 |
0.04 |
The frame length function depending on the duration of the movie, illustrated in Figure 2, is:
(1)
The frame length as a function of the “Let’s Recycle” movie duration

The coordinates of the vertex of the parable (1) are:
(2)
The position of the vertex of the parable is halfway through the movie in the 0.7294 min of the movie duration. It is the turning point when the action starts to calm down.
Another illustrative example is the short movie “Warning”. It won the storytelling category of the sustainable filmmaking event The Outlook for Someday and was also recognised as the Rangatahi filmmaker of the year in the 2017 Māoriland Film Festival. The analysis of the length of the movie’s frames is shown in Table 2.
The frame length of “Warning”
t [min] |
Δt [min] |
t [min] |
Δt [min] |
t [min] |
Δt [min] |
t [min] |
Δt [min] |
t [min] |
Δt [min] |
|---|---|---|---|---|---|---|---|---|---|
0.10 |
|
0.50 |
0.10 |
1.26 |
0.30 |
1.57 |
0.30 |
2.57 |
0.30 |
0.19 |
0.18 |
0.51 |
0.10 |
1.30 |
0.40 |
1.59 |
0.20 |
3.01 |
0.40 |
0.27 |
0.80 |
0.52 |
0.10 |
1.32 |
0.20 |
2.23 |
0.24 |
3.04 |
0.30 |
0.32 |
0.50 |
1.06 |
0.14 |
1.36 |
0.40 |
2.26 |
0.30 |
3.09 |
0.50 |
0.40 |
0.80 |
1.14 |
0.80 |
1.50 |
0.14 |
2.31 |
0.50 |
3.27 |
0.18 |
0.48 |
0.80 |
1.20 |
0.60 |
1.53 |
0.30 |
2.51 |
0.20 |
3.54 |
0.27 |
0.49 |
0.10 |
1.23 |
0.30 |
1.54 |
0.10 |
2.54 |
0.30 |
- |
- |
The frame length function depending on the duration of the movie, illustrated in Figure 3, is:
(3)
The coordinates of the vertex of the parable (2) are:
(4)
The frame length as a function of the “Warning” movie duration

The position of the vertex of the parable is 3/5 through the movie in the 2.2908 min of the movie duration. It is the turning point when the action starts to calm down.
The colour in the movie can be used for manipulation that accentuates the visual experience and the drama. Computer monitors, television sets, and movie theatres use the most common additive colour system RGB (Red-Green-Blue).
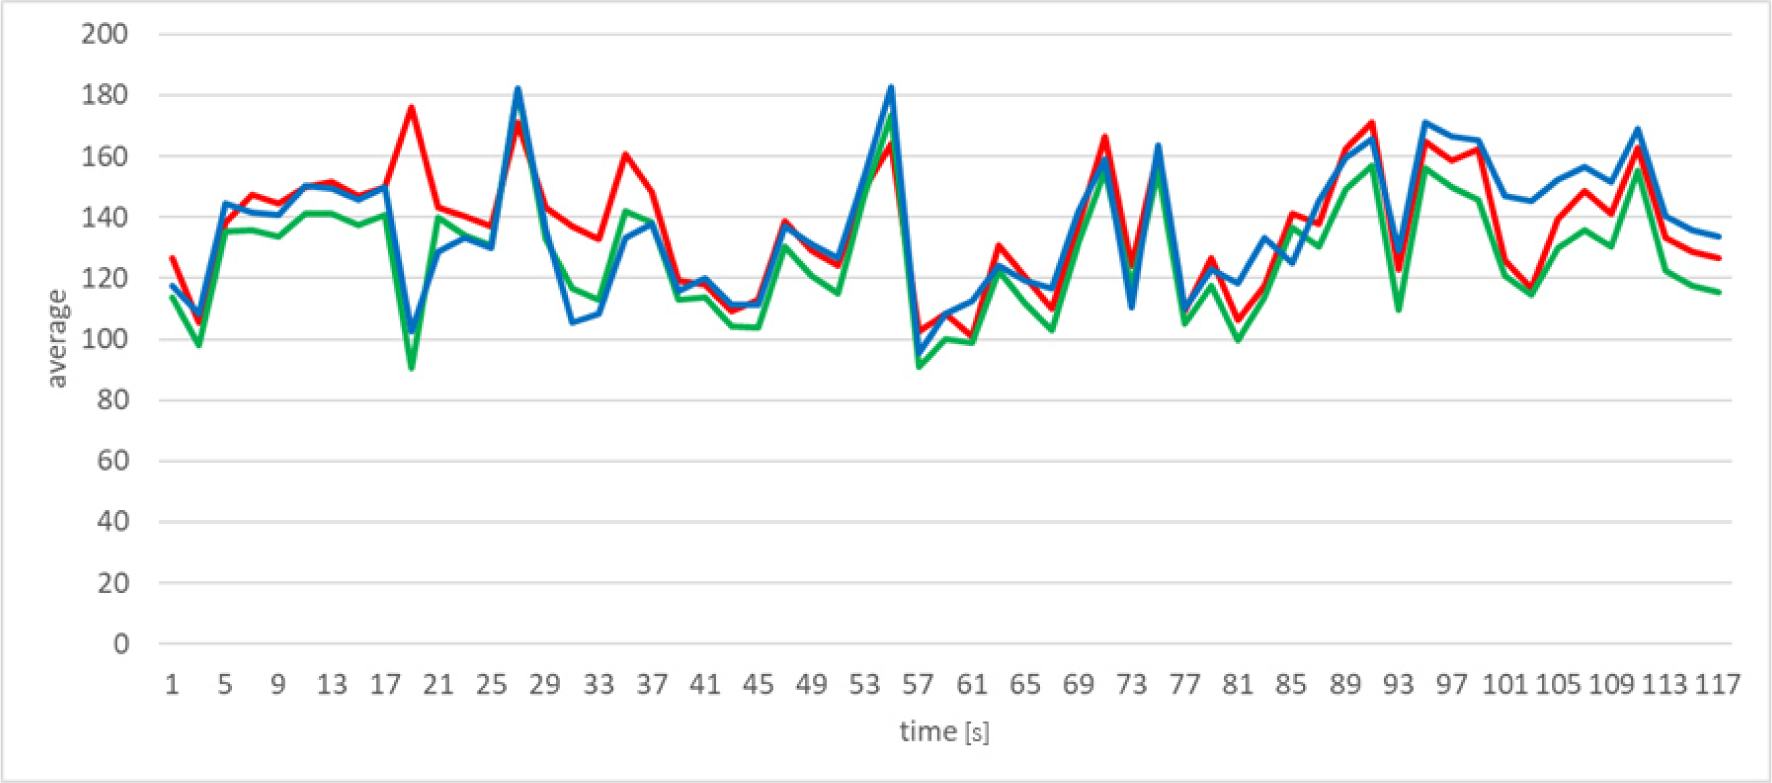
RGB colour statistics were conducted through the example of the short feature movie “Let’s Recycle”, which lasts two minutes. In the software tool Adobe Premiere PRO CS6 used for experimental purposes, one photo was extracted every 2 s from the movie. The photos were analyzed in the software tool Adobe Photoshop CS6 to obtain the results of using RGB colours. The software provided values of the arithmetic mean (Figure 4), median (Figure 5) and standard deviation (Figure 6) of each colour of the RGB spectrum (red, green, blue).
“Let’s Recycle” movie − the arithmetic means of each colour of the RGB spectrum
“Let’s Recycle” movie − the median of each colour of the RGB spectrum

“Let’s Recycle” movie − the standard deviation of each colour of the RGB spectrum

Red affects people physically or in the “lower order” of their psychological activity. It positively conveys physical courage, energy, basics of survival, strength, warmth, masculinity, and excitement. The downside of red is that it creates tension and aggression. It affects the pulse rate and thus creates the impression of a faster passage of time [30].
Values at which a larger deviation from the arithmetic mean is observed, applying the 4σ method, a peak is observed at 19 s (about 1/5) of the movie. At that moment, the breaking point comes, that is, the climax of the movie’s plot. It is especially evident in Figure 4, where graphical representations arithmetic mean of all three colours of the RGB spectrum are visible. Descriptive statistics of the arithmetic mean of the red colour of the frames are shown in Table 3. The arithmetic mean is 136.97, and the median arithmetic mean of red is 137.86. Relatively good overlap and a small coefficient of variation of 14.27% are visible.
“Let’s Recycle” movie − descriptive statistics of the arithmetic mean and the median of the red colour
|
Arithmetic mean |
Median |
|---|---|---|
Average |
136.97 |
136.76 |
Standard deviation |
19.55 |
23.85 |
Maximum |
176.00 |
176.00 |
Minimum |
100.80 |
85.00 |
Median |
137.86 |
139.00 |
Mode |
- |
147.00 |
Variance |
382.18 |
568.67 |
Coefficient of variation [%] |
14.27 |
17.44 |
The tension of the action is maintained by adding red colour. Applying the 2σ method to the values of the arithmetic means of the frame colour and the median of the frame colour, frames are noticeable in which both the arithmetic mean and the median go beyond the boundary zone determined by the 2σ method. It happens in 27 s and 35 s (about 1/6 of a movie), 55 s (about 1/3 of a movie), 71 s and 75 s (about 2/5 of a movie), 89 s and 91 s (about 1/2 of a movie) and 99 s (about 2/3 of the movie). Red, in this case, conveys a sense of danger and tragedy.
Green affects the human balance of mind, body, and emotions. It is achieved through harmony, a sense of stability, refreshment, universal love, peace, and renewal [30]. Green is in the middle of the spectrum, so it does not require adjustment in human perception. It strikes a balance but can give the impression of boredom.
Descriptive statistics of the arithmetic mean of the green colour of the frames are shown in Table 4. It is relatively good to match the arithmetic mean and the median for the values of the arithmetic mean and the median of the green colour of the frames. The coefficients of variation are small if there are no large deviations from the arithmetic means. Only in green colour, there is a dominant value (mode) in the arithmetic mean and the median.
“Let’s Recycle” movie − descriptive statistics of the arithmetic mean and the median of green colour
|
Arithmetic mean |
Median |
|---|---|---|
Average |
127.42 |
127.27 |
Standard deviation |
19.97 |
25.88 |
Maximum |
182.05 |
192.00 |
Minimum |
90.59 |
74.00 |
Median |
130.27 |
132.00 |
Mode |
135.60 |
106.00 |
Variance |
398.78 |
669.79 |
Coefficient of variation [%] |
15.67 |
20.33 |
According to the 4σ method, the accentuated green peak, in both the arithmetic mean and the median, is noticeable at 27 s (about 1/6 of the movie) and 55 s (about 1/3 of the movie), in synergy with the red colour. In this case, the green colour affects the balance and harmony in the movie. The main character’s emotions during the waste recovery are shown, as well as the changing awareness of the girl’s thinking about the importance of recovery. Milder peaks are noticeable applying the 2σ method, accented green in 71 s and 75 s (about 2/5 of the movie) and 91 s (about 1/2 of the movie), also in synergy with red.
It affects the “higher order” of psychological activity of the human mind. Blue colour positively affects a person’s intelligence and ability to communicate. It gives a kind of trust and calm and influences obligations, logic, and awareness [30]. The downside of blue is that it gives the impression of coldness, lack of emotion, reluctance, and rudeness.
Descriptive statistics of the arithmetic mean of the blue colour of the frames are shown in Table 5. According to the 4σ method, frames in 27 s (about 1/6 of the movie) and 55 s (about 1/3) were highlighted in blue, emphasising the ability to communicate, trust, calmness, and awareness. In addition to these “main” peaks, there are smaller ones in 71 s and 75 s (about 2/5 of the movie) and 89 s and 91 s (about 1/2). In all these moments, blue is in synergy with red and green.
“Let’s Recycle” movie − descriptive statistics of the arithmetic mean and the median of blue colour
|
Arithmetic mean |
Median |
|---|---|---|
Average |
136.12 |
134.10 |
Standard deviation |
20.90 |
25.84 |
Maximum |
182.74 |
194.00 |
Minimum |
95.68 |
83.00 |
Median |
135.80 |
133.00 |
Mode |
- |
150.00 |
Variance |
436.68 |
667.61 |
Coefficient of variation [%] |
15.35 |
19.27 |
To obtain the results of using RGB colours, photos from the movie “Warning” by Neihana Lowe were analyzed in the software tool Adobe Photoshop CS6. The values of the arithmetic mean (Figure 7), median (Figure 8) and standard deviation (Figure 9) of each colour of the RGB spectrum (red, green, blue) were read as shown in Table 6.
“Warning” movie − the arithmetic means of each colour of the RGB spectrum

“Warning” movie − the median of each colour of the RGB spectrum

“Warning” movie − the standard deviation of each colour of the RGB spectrum

Values at which a larger deviation from the arithmetic mean is observed, applying the 4σ method, a peak is observed at 89 s (about 2/5) of the movie. At that moment, the breaking point comes, that is, the climax of the movie’s plot. It is especially evident in Figure 8, where graphical representations of all three colours of the RGB spectrum are visible. Descriptive statistics of the arithmetic mean, and median of RGB colours of the frames are shown in Table 6.
“Warning” movie − descriptive statistics of the arithmetic mean and the median of the RGB colours
|
RED |
GREEN |
BLUE |
|||
|---|---|---|---|---|---|---|
|
Ar. mean |
Median |
Ar. mean |
Median |
Ar. mean |
Median |
Average |
104.33 |
99.96 |
94.02 |
87.64 |
92.59 |
87.07 |
Standard deviation |
36.66 |
56.99 |
39.90 |
45.08 |
37.99 |
49.80 |
Maximum |
168.55 |
187.00 |
179.68 |
184.00 |
160.81 |
174.00 |
Minimum |
46.31 |
19.00 |
36.13 |
27.00 |
35.76 |
19.00 |
Median |
114.77 |
121.50 |
100.51 |
86.00 |
97.31 |
92.00 |
Mode |
57.39 |
134.00 |
- |
33.00 |
- |
151.00 |
Variance |
1 343.70 |
3 247.93 |
1 591.75 |
2 032.02 |
1 443.48 |
2 480.25 |
Coeff. of variation [%] |
35.13 |
57.01 |
42.43 |
51.43 |
41.03 |
57.20 |
Applying the 2σ method to the values of the arithmetic means of the frame colour and the median of the frame colour, frames are noticeable in which both the arithmetic mean and the median go beyond the boundary zone determined by the 2σ method. It happens from 8 s to 12 s, from 68 s to 80 s (about 1/3 of the movie) and from 108 s to 124 s (about 1/2), in the synergy of all RGB colours.
A Kruskal-Wallis test is used to determine whether or not there is a statistically significant difference between the parameters of these two movies. Since these are independent sets of values that do not conform to the Gaussian distribution, distributions have similar shapes, and samples are not of equal length, the Kruskal-Wallis test was chosen to test whether there is a statistically significant difference between the parameters of the films “Let’s recycle” and “Warning”. The results are shown in Table 7.
Kruskal-Wallis test
|
H |
N |
p-value |
Results |
|---|---|---|---|---|
Frame length |
1.5409 |
154 |
0.21448 |
No statistically significant difference at p < 0.05 |
Red colour |
5.9418 |
228 |
0.01479 |
No statistically significant difference at p < 0.01 |
Blue colour |
0.4499 |
228 |
0.50236 |
No statistically significant difference at p < 0.05 |
Green colour |
0.0092 |
230 |
0.9234 |
No statistically significant difference at p < 0.05 |
The values of 20 points (frame duration according to the part of the film) were calculated for each film employing the obtained functions, i.e., eqs. (1) and (3). Based on these values, a correlation was made using the Spearman coefficient (Table 8). The coefficient value for frame length between the two mentioned films is 0.56, meaning the correlation between these two data sets is medium-strong.
Spearman coefficient
Position |
x1 |
x2 |
y1 |
y2 |
|---|---|---|---|---|
min |
0 |
0 |
0.035 |
0.458 |
1/16 |
0.1 |
0.225 |
0.030 |
0.427 |
1/8 |
0.2 |
0.45 |
0.026 |
0.399 |
3/16 |
0.3 |
0.675 |
0.023 |
0.375 |
1/4 |
0.4 |
0.9 |
0.021 |
0.353 |
5/16 |
0.5 |
1.125 |
0.019 |
0.335 |
3/8 |
0.6 |
1.35 |
0.018 |
0.320 |
7/16 |
0.7 |
1.575 |
0.017 |
0.308 |
1/2 |
0.8 |
1.8 |
0.017 |
0.299 |
9/16 |
0.9 |
2.025 |
0.018 |
0.294 |
5/8 |
1 |
2.25 |
0.020 |
0.292 |
11/16 |
1.1 |
2.475 |
0.022 |
0.293 |
3/4 |
1.2 |
2.7 |
0.024 |
0.297 |
13/16 |
1.3 |
2.925 |
0.028 |
0.304 |
7/8 |
1.4 |
3.15 |
0.032 |
0.315 |
15/16 |
1.5 |
3.375 |
0.037 |
0.329 |
max |
1.6 |
3.6 |
0.042 |
0.346 |
r = 0.56 (medium-strong correlation) |
||||
The growth coefficients of the functions of the frame length depending on the movie duration are very similar between the movies: 0.0327 in the case of “Let’s Recycle” and 0.0318 in the case of “Warning”. The growth coefficients show that the frames accelerate almost equally, meaning the shape of both functions is “with the opening upwards”.
The vertexes of the parables are in 3/5 (for “Warning”) and 1/2 (for “Let’s Recycle”) duration of the movie. They are the turning points when the actions start to calm down.
According to the frame statistics and the analysis of colour statistics, it can be concluded that the turning point of “Let’s Recycle”, i.e., the peak of the movie’s action is 19 s (1/10 duration of the movie). Colour statistics show the points of transition. In this way, the plot boundaries, climax, and unfolding of the plot in the movie are clear with the colour statistics. Transition points are points where all three colours stand out strongly. Red is highlighted to emphasise tension and aggression, blue to emphasise communication, trust, commitment, thought process and calm, and green restores renewal and balance in the human mind, body, and emotions. The transition points are in 27 s (about 1/6 of the movie) and 55 s (about 1/3). It can be statistically concluded that up to 27 s is the plot, from 27 s to 55 s is the climax, and after 55 s is the plot of the “Let’s Recycle” movie.
Values at which a larger deviation from the arithmetic mean is observed applying the 4σ method, a peak is observed at 76 s (about 2/5) of the “Warning” movie. At that moment comes the breaking point, the climax of the movie’s plot.
Colour statistics show the points of transition. In this way, the plot boundaries, climax, and unfolding of the plot in the “Warning” movie are clear with the colour statistics. The transition points are from 8 s to 12 s (action plot), from 68 s to 80 s, i.e., about 1/3 of the movie (highlight of the action) and from 108 s to 124 s, i.e., about 1/2 of the movie (the unfolding of the action), in a synergy of all RGB colours.
The movie conveys messages. To achieve rhythm and drama, the length of the frame is (among other things) one of the elements used to achieve interest and attract viewers. Various plans technically shape the frames. The colour is an important part of the movie on various levels and not just an addition to the aesthetics of the movie. It can affect viewers, making them feel comfortable or uncomfortable.
Colour can be used for a visual experience that manipulates intent to emphasise narration and – in effect – contribute to better message delivery. A significant element in the narration is achieved by combining and controlling the colour in the scenes using filters, lighting, or the use of movie strips, but also laboratory processing.
Suppose the movie is viewed as a product, especially as an informal educational tool. In that case, its life cycle is one of the most important components due to its distribution through various channels. For a movie to be successful, it is necessary to carefully plan the investment parameters through concept, pre-production, shooting, post-production, marketing, and distribution.
The movie has all the characteristics of a complex engineering system: it has technical complexity, it is real, open, artificial (purposely created by human work), dynamic (can take on different states), hybrid (some parts are created continuously and some discreetly) and has mixed control as a basis for its management. The making of the movie is conducted by a hierarchically complex structure of employees and meets multiple human needs: communication, entertainment, aesthetic pleasure, education, social, emotional, spiritual life, and curiosity (humanistic-social complexity). Using the examples of short propaganda movies “Let’s Recycle” by Swachh Bharat Mission and “Warning” by Neihana Lowe, it was shown that cinemetrics, i.e., colours and the speed of changing shots, are consistent with the theoretical predictions and could partly explain the success of both movies with audiences and the juries.
The analysis findings presented in this paper could also serve as a guide for amateur and semi-professional future film authors. Moreover, the importance of making content considering environmental problems and solutions in the era of social media and awareness of the importance of colour and frame length to message conveyance could largely benefit authors in the field.
Using the non-parametric Kruskal-Wallis test, it was proven that there is no statistically significant difference between the frame length and the use of colours in these two films. Points were calculated using the frame length functions for each film o examine the correlation (because the films are of different lengths, it was impossible to use real data). The determination of the Spearman coefficient showed a medium-strong correlation between the frame length of the two films.
By using cinemetrics for the analysis of the use of colour and frame length from the films “Let’s Recycle” and “Warning”, it can be concluded that successful environmental educational video materials have the following characteristics.
1. The growth coefficient of the functions of the length of the frame, which shows the acceleration of the film action, is about 0.03;
2. The vertex of the parable of the frame length function, which shows the turning point of the film, i.e., the moment when the action starts to calm down, is around the middle of the film (in 3/5 for “Warning” and 1/2 for “Let’s Recycle”);
3. The transition points (points where all three colours stand out strongly) are mainly two: in “Let’s Recycle”, they are about 1/6 and about 1/3 of the movie length and in “Warning”, about 1/3 and about 1/2 of the movie length.
- ,
The Concept of Environmental Education ,Environmental Education , Vol. 1 (1),pp 30–31 , , https://doi.org/https://doi.org/10.1080/00139254.1969.10801479, Sep. 1969 - ,
The Missing Link: Exploring the Relationship Between Higher Education and Political Engagement ,Polit Behav , Vol. 27 (1),pp 25–47 , 2005, https://doi.org/http://www.jstor.org/stable/4500183, [Online]. Available:[Accessed: 17.04.2023] - ,
Revisiting Education for Sustainable Development (ESD): Examining Anthropocentric Bias Through the Transition of Environmental Education to ESD ,Sustainable Development , Vol. 22 (2),pp 73–83 , , https://doi.org/https://doi.org/10.1002/sd.529, Mar. 2014 - ,
A Review of Research on the Effectiveness of Environmental Education in Promoting Intergenerational Learning ,J Environ Educ , Vol. 38 (4),pp 14–24 , , https://doi.org/https://doi.org/10.3200/JOEE.38.4.14-24, Jul. 2007 - , Critical pedagogy, ecoliteracy, & planetary crisis: The ecopedagogy movement, 2010
- ,
Reconsidering the Effects of Education on Political Participation ,J Polit , Vol. 70 (3),pp 612–631 , , https://doi.org/https://doi.org/10.1017/S0022381608080651, Jul. 2008 - ,
Globalization and environmental education: looking beyond sustainable development ,Journal of Curriculum Studies , Vol. 40 (1),pp 1–21 , , https://doi.org/https://doi.org/10.1080/00220270701684667, Feb. 2008 - ,
Forming attitudes that predict future behavior: A meta-analysis of the attitude-behavior relation ,Psychol Bull , Vol. 132 (5),pp 778–822 , 2006, https://doi.org/https://doi.org/10.1037/0033-2909.132.5.778 - ,
A Critical Analysis of Research in Environmental Education ,Stud Sci Educ , Vol. 34 (1),pp 1–69 , , https://doi.org/https://doi.org/10.1080/03057269908560148, Jan. 1999 - Social Media Use in 2021 For Media or Other Inquiries, 2021, www.pewresearch.org, [Online]. Available:[Accessed: 17.04.2023]
- ,
More Americans are getting news on TikTok, bucking the trend on other social media sites ,Pew Research Center , , Oct. 2022 - ,
Content Sharing in a Social Broadcasting Environment: Evidence from Twitter ,SSRN Electronic Journal , 2013, https://doi.org/https://doi.org/10.2139/ssrn.2341243 - ,
Thanks for watching’. The effectiveness of YouTube vlogendorsements ,Comput Human Behav , Vol. 93 ,pp 226–234 , , https://doi.org/https://doi.org/10.1016/j.chb.2018.12.014, Apr. 2019 - ,
Videos to influence: a systematic review of effectiveness of video-based education in modifying health behaviors ,J Behav Med , Vol. 37 (2),pp 218–233 , , https://doi.org/https://doi.org/10.1007/s10865-012-9480-7, Apr. 2014 - ,
Effective Educational Videos: Principles and Guidelines for Maximizing Student Learning from Video Content ,CBE—Life Sciences Education , Vol. 15 (4),pp es6 , , https://doi.org/https://doi.org/10.1187/cbe.16-03-0125, Dec. 2016 - ,
Formal, nonformal and informal education: A holistic perspective on lifelong learning ,International Review of Education , Vol. 28 (2),pp 159–175 , , https://doi.org/https://doi.org/10.1007/BF00598444, Jun. 1982 - ,
Informal learning on YouTube : exploring digital literacy in independent online learning ,Learn Media Technol , Vol. 38 (4),pp 463–477 , , https://doi.org/https://doi.org/10.1080/17439884.2013.783594, Dec. 2013 - ,
Short videos improve student learning in online education ,Journal of Computing Sciences in Colleges , Vol. 28 ,pp 253–259 , , May 2013 - , International Handbook of Internet Research. Dordrecht: Springer Netherlands, 2010
- , Film as art, 1969
- , The History of Cinema: Early and Classical Period (in Croatian), 2008
- , Will This Video Go Viral,” in Companion of the The Web Conference 2018 on The Web Conference 2018 - WWW ’18, 2018
- , Movie maps,” in 1999 IEEE International Conference on Information Visualization (Cat. No. PR00210
- , Film Style and Technology: History and Analysis, 3rd edition, 2009
- , Mehrabian, Silent messages, 1971
- , Hollander, Moving Pictures, 1st Edition, 1989
- ,
Number by colors - a guide to using color to understand technical data , 1996 - ,
Guide to quality control, kaoru ishikawa, the asian productivity association, revised English edition, 1984, No. of pages: 226 (Available in Western Europe and North America from Unipub, New York) ,Qual Reliab Eng Int , Vol. 1 (3),pp 215–215 , , https://doi.org/https://doi.org/10.1002/qre.4680010318, Jul. 1985 - ,
Guide to quality control, kaoru ishikawa, the asian productivity association, revised English edition, 1984, No. of pages: 226 (Available in Western Europe and North America from Unipub, New York) ,Qual Reliab Eng Int , Vol. 1 (3),pp 215–215 , , https://doi.org/https://doi.org/10.1002/qre.4680010318, Jul. 1985 - , Rhythm in the film (in Croatian), Učimo gledati
- ,
The Colour Affects System of Colour Psychology ,AIC Quadrennial Congress , 2009, https://doi.org/https://doi.org/10.13140/2.1.4246.0489