


To mitigate the repercussions of the war on the energy sector and ensure energy security for the European market, the transition from fossil fuels to renewable energy sources has become paramount. The consumption of fossil fuels not only results in non-renewable fossil resource depletion, as their reserves are limited but also leads to climate change and global warming due to greenhouse gas emissions. Therefore, there is a sense of urgency in seeking new and alternative energy sources.
In this context, bioenergy will play a significant role in meeting the European Union’s (EU) energy independence needs and reducing greenhouse gas emissions [1], [2]. According to the Energy Roadmap 2050, the installed capacity of bioenergy plants in the European Union is projected to increase from 44 GW in 2020 to 52 GW in 2030, with the potential to reach 87 GW in 2050 [3].
As a more efficient and clean method of handling biomass and organic waste, sustainable waste treatment solutions emphasise converting waste into energy, fuels, and products [4]. Among the different bioenergy production pathways, anaerobic digestion (AD) stands out as a well-established technology that is widely used as a waste management solution [5], [6], having the added benefit that both AD co-products, digestate and biogas, have a variety of utilisation options [7], [8]. The digestate can be used as an organic fertiliser, while the biogas can produce heat and power, be used as transportation fuel, or be pumped into the natural gas grid [8], [9].
Most medium/large-size wastewater treatment plants (WWTPs) use AD for treating and stabilizing municipal sewage sludge (MSS), a mixture of primary sludge (PS) and secondary sludge (SS) [10], [11]. Around 36,000 operational WWTPs in the EU have anaerobic facilities for sludge organic matter reduction. However, these digesters do not operate under optimal conditions to maximise biogas production, as the main purpose is sludge stabilisation [10], [12]. The EU accounts for more than half of the world’s primary energy supply of biogas, and this share has been increasing recently [13]. In the EU, biogas has so far played an important role in the energy sector, mainly in electricity production. Even though a common EU policy exists, mainly through directives and communications from the European Commission, a wide spectrum of strategies is found throughout the EU Member States, with significantly different outcomes.
MSS management is a major issue that challenges the sustainability of municipal WWTPs [14]. The disposal of MSS accounts for more than 50% of the capital and operating costs of WWTPs [15].
There are several factors influencing AD performance and stability; one of the most important is the hydraulic retention time (HRT), which determines the organic loading rate (OLR) and biomass retention [6], [16]. It is important to choose a suitable HRT to prevent increasing operational costs or lower organic matter biodegradation [6]. In WWTPs, it is common to establish an HRT of approximately 18−20 days [11]. However, Bi et al. [6] suggested that reducing HRT is an effective option to increase methane production and economic efficiency. In this study, the effects of three HRTs (13, 15 and 20 days) on the efficiency and stability of the process were evaluated.
Although the focus of WWTPs is sludge stabilisation, some WWTP anaerobic digesters have spare capacity that can be used to introduce other co-substrates and increase biogas production, reducing dependence on external energy sources [17], [18]. In this scenario, researchers often suggest implementing anaerobic co-digestion (AcoD) by adding biodegradable co-substrates to the anaerobic digester. AcoD is a feasible option to overcome the disadvantages of the MSS anaerobic biological process, as it can improve the nutrient balance and C/N ratio [8] while reducing odour and pathogens [10], [19].
According to the information reported by Agrawal et al. [20], the current municipal solid waste generation is around two billion tons annually. By the end of 2025, it will reach three billion tons. This huge quantum of waste can produce up to 4,000 m3 of biogas annually and an energy potential of roughly 86,000 TJ annually, helping to mitigate the energy crisis and providing an eco-friendly solution to waste management [21]. In addition, fruit and vegetable waste (FVW) is the highest food waste fraction in every country and every season [21], [22]. Almost 15% of fruit and 25% of vegetables produced are being lost at the bottom of the supply chain [23].
FVW is an ideal co-substrate to mix with MSS due to its high concentration of readily biodegradable organic matter [24]. Moreover, due to their intrinsic low pH, it is not advised to perform mono digestion with this type of substrate once it can generate high acidification levels, inhibiting further phases of the process [25]. Adopting rapidly biodegradable feedstocks, such as FVW as co-substrate, would improve the physicochemical characteristics of the feeding mixture, reducing inhibitory effects and promoting industrial synergies [26], [27].
Despite numerous benefits of co-digestion, antagonistic effects due to incompatible feedstock mixing ratios can result in organic overloading, acidification, and AD system failure [28]. These challenges, however, can be addressed by characterizing heterogeneous organic compounds in digester feedstocks and understanding their intrinsic biodegradability patterns [29].
Mango peel waste (MPW) was the selected co-substrate throughout this study. Incorporating this biowaste in the co-digestion process has significant potential for improving methane production and balancing the C/N ratio. Since MPW is typically disposed of in landfills, AcoD technology could be an alternative for treating and valorising this feedstock [5].
In the present study, the feasibility of implementing full-scale co-digestion of MSS with MPW was evaluated through the synergetic effects obtained at the laboratory scale. Using a continuous stirred tank reactor (CSTR), biogas potential assays were evaluated to increase the methane productivity of MSS, applying various techniques, including pre-treatment, co-digestion, and different HRTs. It was necessary to transform the peels into a liquor (mango peel liquor – MPL) by adopting some pre-treatment procedures, to make MPW viable for bioconversion in an AD-wet system,
Although mango was the chosen fruit, it is intended to provide a method for applying other fruits with similar characteristics as rapidly biodegradable co-substrates in the AcoD process [30]. Additionally, a specific methane indicator (SMI) and an energy potential recovery indicator (EPRI) are presented to assess the overall AD system. To the best of the authors’ knowledge, the evaluation of AD in comparison with the AcoD effect, considering simple indicators such as SMI and EPRI, has not been addressed in the literature. Therefore, this study provides insight into this innovative biowaste management strategy.
The experimental assays highlighted synergetic effects, which led to a higher methane generation at the given operating conditions than that obtained by processing MMS as AD mono-substrate. Even with the relevant increase in the OLR and the reduction of the HRT (13 days), the digester showed quite stable operating conditions without inhibition phenomena. A key factor influencing these results is the energy system context.
This section describes the substrate and co-substrates origin, collection, preparation, and characterization. The experimental design and monitoring plan are also described. Finally, the performance indicators applied to compare AD and AcoD trials are presented.
The residual water entering WWTP undergoes different treatment procedures, starting with grit removal, where the large-size waste is withdrawn, followed by the removal of fat oil and grease (FOG) before primary sedimentation. The sludge from the settling tank undergoes a process of thickening and, after that, results in the PS. The treated water from the primary treatment stage withstands a biological process (resulting in waste-activated sludge), and the excess follows a thickening process by air flotation, resulting in the SS, which were the two types of sludge used to form the mixture (MSS) applied on the AD process throughout the different experimental assays. The PS and SS used in the trials were collected in a WWTP at Lisbon, Portugal, with a treating capacity of 50,000 m3/day, serving approximately 210,000 inhabitants’ equivalent and stored at 4 °C until further use. The mango peel waste was collected during the experimental trials according to the requirements for the assays in progress through the surrounding academic population consumption and the researchers involved in the study.
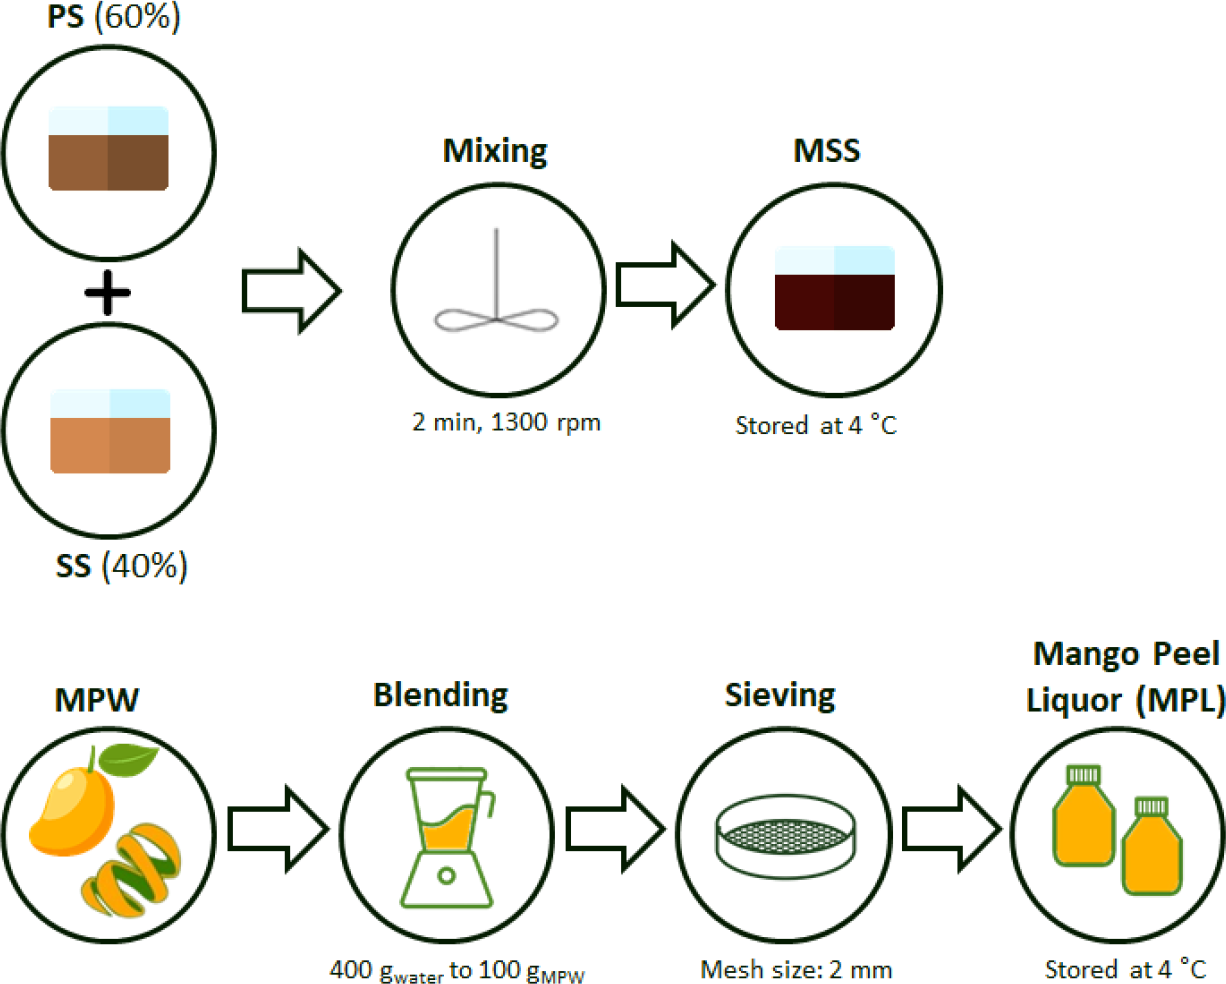
The PS:SS [v:v] ratio used to prepare the MSS in the laboratory was 60:40 to replicate what occurs in WWTPs. To homogenise the substrate, the MSS was agitated for 2 minutes (Velp Scientifica, 35 W and 230 V, with 1300 rpm).
Regarding the MPW, to use it as a co-substrate for AcoD, it was necessary to obtain a liquid fraction (MPL) which was obtained by blending the MPW with water in a proportion of 400 g of water to 100 g of MPW using a cooking blender (Selecline, 230 V, 400 W), on highest speed for 2 minutes. After blending, the pulp was sieved (mesh size of 2 mm), and the remaining liquid fractions were stored at 4 °C until further use. Figure 1 illustrates a schematic representation of the pre-treatment processes applied to MSS and MPW.
Schematic representation of the pre-treatment processes applied to the MSS and MPW
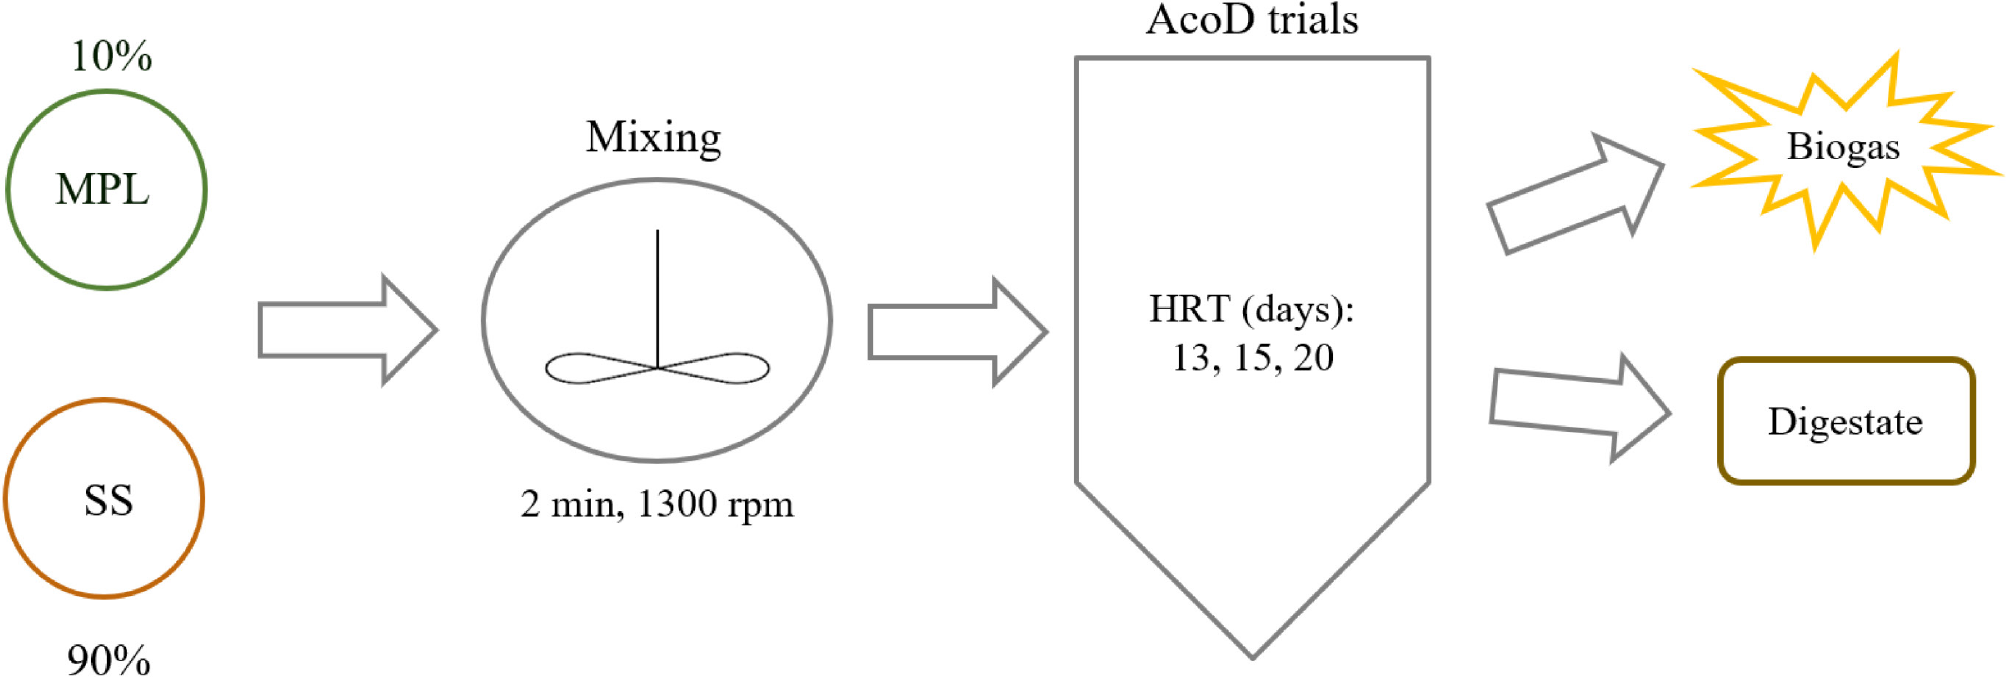
It was assumed for the feeding combination a ratio of 90% MSS and 10% MPL [v:v], along with a mechanical pre-treatment, as shown in Figure 2, after analysing the physicochemical characteristics of MSS and MPL.
Schematic representation of the co-digestion trials
A CSTR with an 11.3 L working volume, running under mesophilic conditions (36±1 °C), was used to perform the trials. A feeding pump (Watson Marlow, 60 rpm) is connected to the CSTR to feed the reactor, and an electric stirrer (Velp Scientifica ES) is inside the reactor to promote its agitation. The feeding mixtures and digestates for each HRT were characterieed (reactor input and output) to define the operational parameter to monitor AD/AcoD process.
The monitoring plan established to follow the continuous AD and AcoD process included daily procedures, like the control of temperature inside the reactor made by a thermal blanket, biogas production (registered by a flow meter from MilliGascounter, Ritter), methane production (measured with a portable analyser − LMSxi Multifunction Landfill Gas Analyser) and pH assessment of the feeding mixtures and digestates (measured using Multi 3430, WTW).
The total solids (TS), volatile solids (VS), VS/TS ratio, volatile suspended solids (VSS), total chemical oxygen demand (TCOD), soluble chemical oxygen demand (SCOD), SCOD/TCOD ratio, total Kjeldahl nitrogen (TKN) and total alkalinity (TA) were periodically analysed according to American Public Health Association [31]. Total organic carbon (Corg) was determined by dividing the organic matter content (expressed in VS) by 1.724, according to [32], and the carbon/nitrogen ratio (C/N) was calculated by taking the ratio between C organd TKN.
Different parameters, namely the OLR, VS and TCOD removal efficiency, specific gas production (SGP), specific methane production (SMP) and specific energy loading rate (SELR), were evaluated to assess the process performance and stability of the HRTs.
The following procedures consisted in selecting the HRT with the best performance and process stability and establishing performance indicators to act as tools to simplify the discussion of the results achieved. Two indicators were defined based on AD and AcoD performance to help identify the increments and the advantages of selecting a co-substrate to improve AD technology.
To assess the relative increase in specific methane production, a specific methane indicator (SMI, expressed in percentage) is proposed, as shown in eq. (1):
(1)
Where: SMPAD denotes specific methane production from the AD trial [mL CH4/g VS], and SMPAcoD − specific methane production from the AcoD trial [mL CH4/g VS].
To evaluate the energy potential recovered [kWh/m3feed sludge] in AD and AcoD trials, a simplified mathematical model, eq. (2), was adapted from [33] considering a lower caloric value of methane of 11.00 kWh/m3:
(2)
The coefficient 3.77 shown in eq. (2) was replaced by the experimental values obtained by the authors, shown in Table 1 and Table 2, corresponding to AD and AcoD trials, eqs. (3) and (4):
(3)
(4)
Where: E0 denotes energy produced during selected AD trial [kWh/m3feed sludge], E1 − energy produced during AcoD trial with highest performance [kWh/m3feed sludge], c − TS [kg/m3], and ηAD − TCOD removal.
A simplified indicator EPRI, expressed in percentage, was defined to evaluate the contribution of the MPL incorporation as co-substrate on the energy potential recovery, as shown below:
(5)
Where: E0 denotes energy potential recovery from AD, and E1 − energy potential recovery from AcoD.
All analyses were performed in two or three replicates, and the results are shown together with the means and standard deviations for each.
The GraphPad Prism Software (version 5.0) was used for the statistical analysis. The Tukey test was used to compare three or more samples, and the Student’s t-test was used to compare two samples, with a 95% level of confidence (p = 0.05). Differences were considered significant when p-values were less than 0.05.
Table 1 exhibits the physicochemical characterisation of the MSS and MPL. According to the results shown in Table 1, the MPL potential for improving the AD process is reflected in the VS/TS, SCOD/TCOD and C/N ratios values. These values are higher by 15%, four times and more than five times, respectively, when compared with MSS, highlighting this co-substrate’s easily biodegradable organic content [28].
Substrate and co-substrate physicochemical characterisation
Parameters |
Substrate MSS |
Co-Substrate MPL |
|---|---|---|
pH |
6.04±0.02 |
4.09±0.01 |
TS [g/L] |
28.04±2.01 |
33.69±1.62 |
VS [g/L] |
23.75±1.42 |
32.40±1.32 |
VS/TS [%] |
85 |
97 |
SCOD/TCOD [%] |
11 |
55 |
Corg [g/L] |
13.69±1.20 |
18.79±1.16 |
TKN [g/L] |
1.71±0.31 |
0.37±0.08 |
C/N |
8 |
51 |
Nevertheless, the negative impact of the co-substrate’s inherent acidic pH (4.09±0.01) must be highlighted since it can destabilise the methanogenic anaerobic consortium, inhibiting biogas production [34], [35].
The experimental trials’ design in the study followed the physicochemical characteristics of MPL referred to above, bearing in mind the spare capacity of digesters already implemented in real-scale WWTP [35].
Observing the above constraints established the definition of a correct feeding mixture ratio for lab-scale co-digestion trials to an up-scale design without infrastructure changes. Additionally, co-substrate selection needs a careful approach since carbohydrate-rich co-substrates can be easily biodegraded, inducing instability [35].
Regarding the previous statements, the authors proposed some assumptions: a ratio of 90% MSS and 10% MPL [v:v] for the feeding mixture, coupled with a mechanical pre-treatment, as illustrated in Figure 2; also an HRT of 15 days was selected, based on previous work with a similar composition of MSS and different type of co-substrates [36], [38]. It is important to cover a range of OLR values (low, medium and high) with two more HRTs (13 and 20 days) to evaluate the performance and stability of co-substrate incorporation. For each HRT, three cycles were performed after steady-state conditions were achieved.
Feeding mixture and digestate characterisations for each HRT trial
|
HRT = 13 days |
HRT = 15 days |
HRT = 20 days |
|||
|---|---|---|---|---|---|---|
|
Feeding mixture |
Digestate |
Feeding mixture |
Digestate |
Feeding mixture |
Digestate |
pH |
5.56±0.06 |
7.05±0.09 |
5.33±0.33 |
7.03±0.11 |
5.27±0.20 |
6.97±0.13 |
S [g/L] |
28.46±2.85 |
17.29±1.80 |
27.62±0.74 |
9.81±1.25 |
27.72±0.43 |
15.98±1.31 |
VS [g/L] |
25.14±2.30 |
13.79±1.28 |
22.64±0.49 |
11.75±1.01 |
22.18±0.47 |
11.08±0.91 |
VS/TS [%] |
88 |
80 |
82 |
79 |
80 |
76 |
VSS [g/L] |
- |
12.58±1.22 |
- |
8.75±0.99 |
- |
10.00±1.07 |
TCOD [g/L] |
35.73±5.07 |
21.44±2.40 |
32.15±5.59 |
16.43±1.31 |
31.19±6.18 |
17.30±0.06 |
SCOD [g/L] |
6.32±1.19 |
2.44±0.67 |
5.24±2.21 |
2.66±1.03 |
4.51±0.07 |
1.74±0.52 |
SCOD/TCOD [%] |
18 |
- |
16 |
- |
14 |
- |
Corg [g/L] |
14.58 |
- |
13.13 |
- |
12.87 |
- |
TKN [g/L] |
1.35±0.21 |
1.24±0.13 |
1.44±0.04 |
0.96±0.13 |
1.70±0.09 |
1.18±0.21 |
C/N |
11 |
- |
9 |
- |
8 |
- |
TA [mgCaCO3/L] |
- |
2761±543 |
- |
2320±181 |
- |
2973±167 |
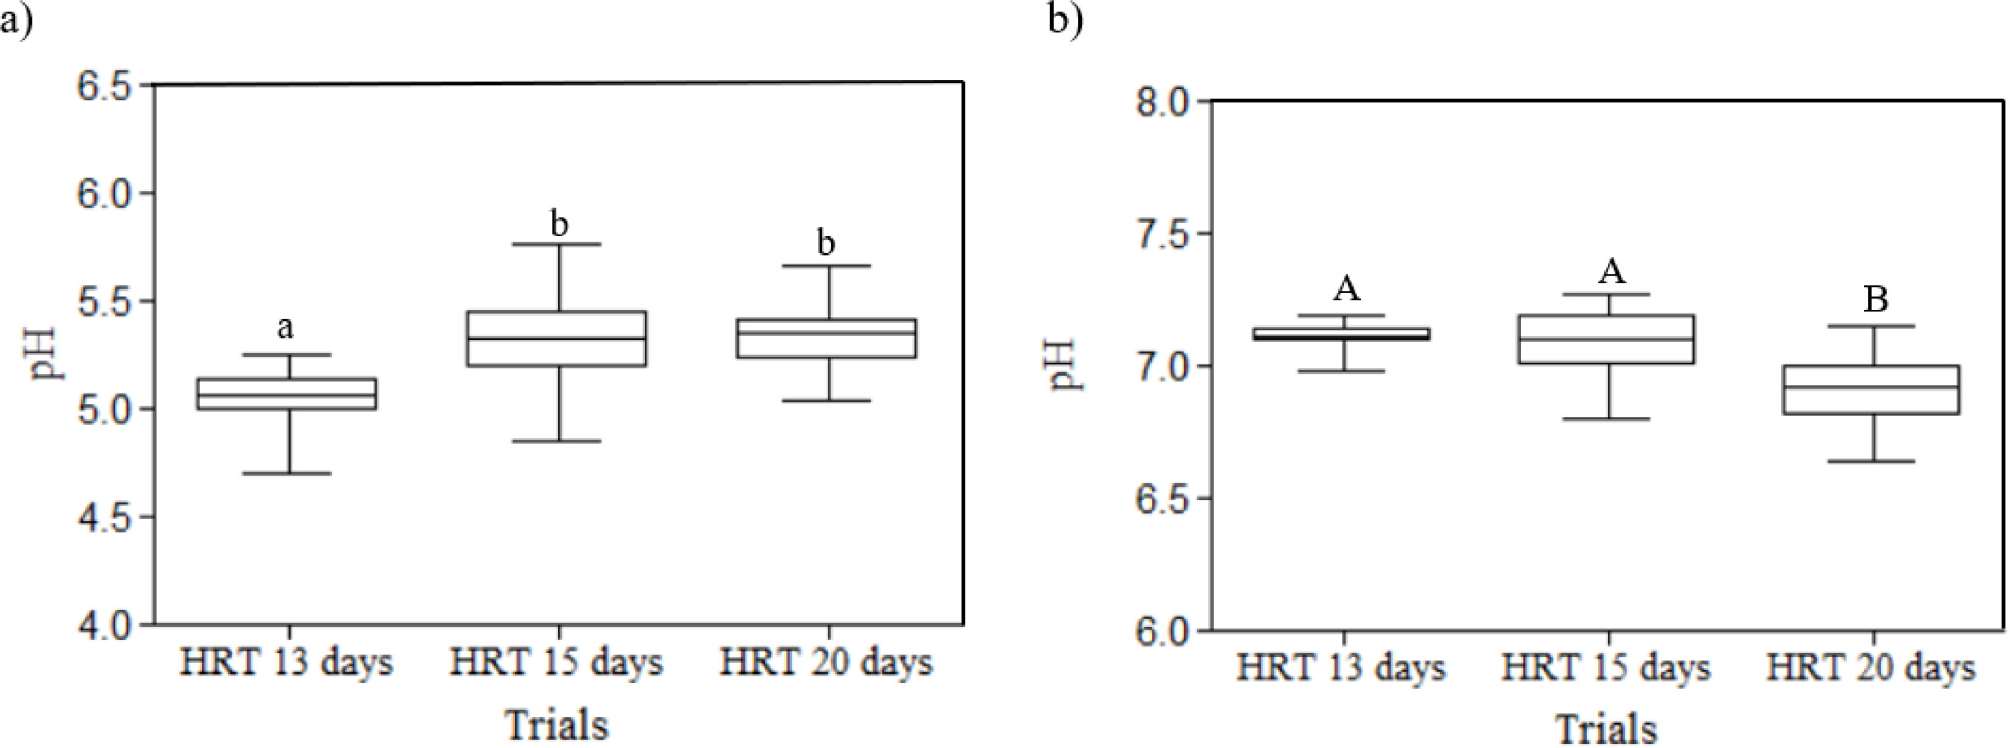
Regarding the values presented in Table 2, HRT of 13 days had the highest pH value (5.56, compared with 5.33 and 5.27 from HRT 15 and 20 days, respectively). However, there were no representative fluctuations. A statistical analysis of the pH values of the feed and digestate was done to ascertain the impact of HRT variation. A box-and-whisker plot was created (Figure 3) to depict this analysis, with the whiskers extending to the minimum and maximum and a five-number summary: the minimum, the 25th percentile, the median, the 75th percentile, and the maximum. Although the pH of feeding mixtures was below the minimum recommended values [29], [34] (Figure 3a), the digestates showed values of pH (between 6.97±0.13 and 7.05±0.09) which are in line with the buffer capacity of the AD process, as illustrated in Figure 3b.
Feeding mixtures (a) and digestates (b) pH pattern along trials; different letters in the graphic indicate significantly different results (p < 0.05) according to the Tukey test
Organic matter expressed in VS was higher for 13 days (25.14±2.30 g/L), showing a decrease of about 12% for the other HRTs. This behaviour is reflected in VS/TS ratio, where 13 days achieved the highest percentage of 88.
The highest SCOD/TCOD ratio (18%) was observed for HRT = 13 days, compared with 16% and 14% from HRT 15 and 20 days, respectively, indicating the presence of more easily available organic matter that can be biodegraded more rapidly. Comparing the C/N ratio of feeding mixtures, an improvement with the incorporation of MPL in MSS is visible, with an increment of 13% for HRT = 13 days, proven that using co-substrates such as MPL can, in fact, improve this parameter, as shown by other researchers [28], [38].
To support the decision of HRT selection for AcoD assays, Table 3 exhibits the results of the performance and stability parameters.
Performance and stability parameters from the experiment trials; different letters in the graphic indicate significantly different results (p < 0.05) according to the Tukey test
|
HRT = 13 days |
HRT = 15 days |
HRT = 20 days |
|---|---|---|---|
OLR [g VS/Lreactor.day] |
1.94±0.02 a |
1.51±0.02 b |
1.11±0.03 c |
SGP [mL/g VS] |
675±23 d |
504±15 e |
622±12 f |
SMP [mL CH4/g VS] |
425±17 g |
312±13 h |
392±10 g |
VS removal [%] |
45 i |
48 j |
50 k |
TCOD removal [%] |
40 l |
49 m |
51 m |
Quality [% CH4] |
63 n |
62 o |
63 n |
SELR [1/day] |
0.22±0.04 p |
0.24±0.05 p |
0.18±0.03 p |
When decreasing HRT, OLR increases, resulting in a positive synergetic effect in the SMP parameter. Highlighting the OLR value of 1.94±0.02 g VS/Lreactorday for HRT = 13 days, the highest SMP value (425±17 mL CH4/g VS) was achieved. It represents an increment of 16% compared with results obtained by Di Maria et al. [38] for similar operational parameters, with an OLR of 2.1 kg VS/m3day and an HRT between 10−14 days.
Over the different HRTs, there were no major changes in the VS content, with the highest removal rate (50%) registered at HRT = 20 days, reducing with the decrease in HRT, which is in agreement with the experiment described by Di Maria et al. [38], where it is suggested that VS removal percentages similarly reduced as HRT decreased and OLR increased. However, compared with the literature, even the lowest VS removal rate achieved throughout the trials had better results. For an OLR of 1.46 kg VS/m3day, with an HRT of 14 days, a VS removal of 22% was reported, less than half of what was attained across all of our HRTs [38].
Methane quality remained constant among trials (62−63%), with better results than the ones obtained by Di Maria et al. [38], where for OLR ranging from 1.46 to 2.8 kg VS/m3day the methane quality has ranged between 57−62%.
To evaluate the stability of the process, the following parameters were considered: SELR, TA, and pH of the digestate. SELR relates organic load (expressed in TCOD) fed into the reactor with the biomass inside the active volume of the reactor (expressed in suspended volatile solids mass). The anaerobic microbial consortium has a limited capacity to biodegrade organic matter, and when this limit is surpassed, microbial activity inside the reactor may become unstable, affecting the methanogenesis pathway. Therefore, the SELR values recommended must be below 0.4 1/day to ensure the stability of the AD process. Along the HRTs, the SELR results obtained (0.18 1/day, 0.22 1/day and 0.24 1/day) agree with those reported in the literature by other authors [39], [40]. SELR did not demonstrate significant differences (p > 0.05) between the several trials, proving that the process stability was unaffected by HRT variations.
Regarding the recommended values for the TA parameter, some authors [24] suggested that TA should be above 1500 mg CaCO3/L to maintain a stable process but did not define the upper limits. However, other authors warned of instability in the reactor at higher alkalinity values, with a maximum recommended value of 4000 mg CaCO3/L [41]. Therefore, for analysing the results obtained along the assays, the range: 1500 mg CaCO3/L < TA < 4000 mg CaCO3/L was defined to guarantee the stability of the AcoD process. The values obtained during the AcoD trial (2761, 2320, and 2973 mg CaCO3/L) fulfil the recommended values previously considered.
Although the pH feeding values are similar between the trials, the HRT of 13 days significantly differs from the others (p < 0.05). Despite the variability of feeding mixtures along the trials, Figure 3b shows that there were no major variations in the pH values of digestate throughout all trials: the pH remained close to neutrality (6.97–7.05), which is an indirect indicator of stability and will sustain the buffering capacity of the process. In contrast to the feeding pH, there were no statistically significant variations between HRT 13 days and HRT 15 days (p > 0.05).
Based on the previously discussed, it is possible to conclude that all HRT trials were within limits established not to compromise the stability and buffer capacity of the AcoD process.
The SMP parameter allows us to assess the best HRT regarding AcoD performance and stability due to a good correlation with daily methane production and daily VS organic load in the feeding mixture. Analysing the values shown in Table 3, the HRT of 13 days was the trial with the best performance in terms of SMP, with values 36% and 8% higher than the HRT of 15 days and 20 days, respectively. It is also important to highlight the correlation with the digestate pH, TA, and SELR values, which remained within the recommended ranges to evaluate the AcoD process stability.
After selecting HRT = 13 days as the trial with the best performance and stability parameters, it was decided to compare it with a mono-digestion scenario with the same HRT in similar operational conditions.
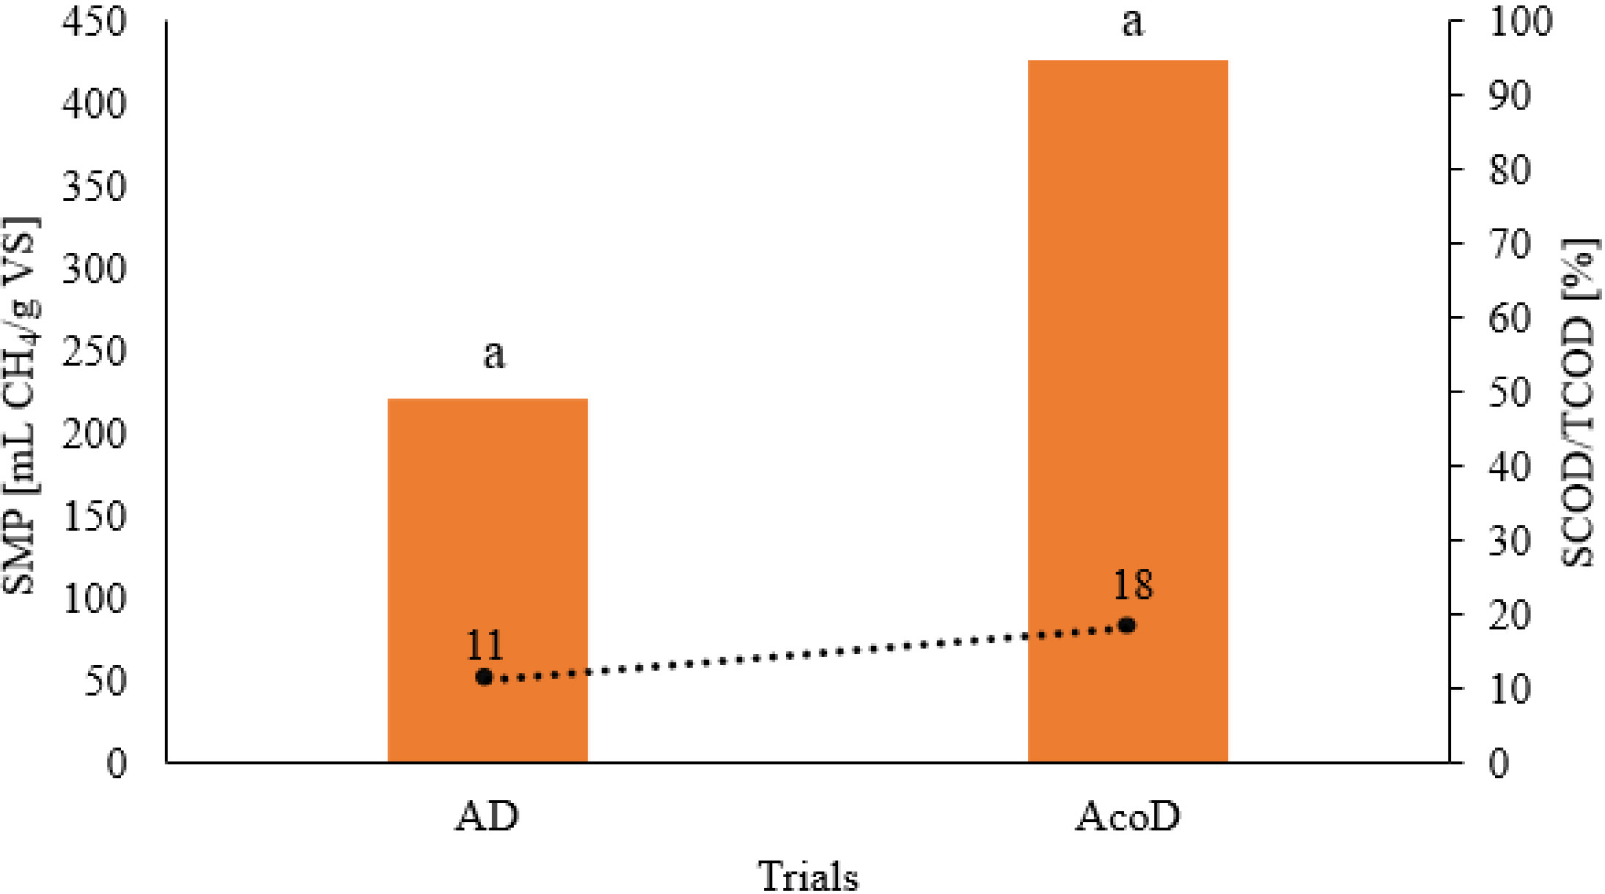
To allow the comparison between AD and AcoD, the performance and stability parameters regarding the AD trial (which refers to authors’ unpublished data) are the following: SMP of 220 mL CH4/g VS, with an OLR of 1.94 g VS/Lreactor.day, SCOD/TCOD of 11%, a C/N ratio of 8 and a SELR of 0.17 1/day. SCOD/TCOD ratio provides information on the bioavailability in the feeding load, indirectly justifying the increase in the SMP values recorded since there was a 64% increment in the bioavailability of the feeding mixture in the AcoD trial (Figure 4). It is shown that there are no significant differences between the SMP values obtained from the AD trial and the AcoD trial (p > 0.05), allowing the choice of the one that exhibits better results in terms of a specific production. This observation supports the idea that co-digestion can be used to produce bioenergy.
Comparing the C/N ratio between AD and AcoD trials, it is possible to register an increment of 38% from AD to AcoD, which agrees with the results obtained by other authors [28], [38], attesting to the benefits of incorporating the co-substrate.
Comparison between AD and AcoD with HRT of 13 days; different letters in the diagram indicate significantly different results between AD0 and AD1 (p < 0.05) according to Student’s t-test
Using the SMI indicator, eq. (1), to allow the comparison of SMP between AD and AcoD, it is possible to assess a value of 93%, which means that AcoD practically doubled the results obtained in the AD process. The obtained results align with those published by other researchers: [42] reported an increment of 48% in SMI values when a co-substrate (FVW and food waste) was added, compared with mono-digestion. On the other hand, Karki et al. [34] reported a 27% increase in co-digestion trials when compared with AD for an OLR of 2.5 kg VS/m3day. These results support the thesis that implementing co-digestion in WWTPs can indeed increase biogas production and the performance of the AD process.
To corroborate the results obtained with SMI, an energy analysis was performed regarding EPRI. Eq. (3) described above, using the TS concentration of 28.04 kg/m3 (Table 1) and ηAD = 0.26 (which refers to an average achieved by personal data), yielded E 0= 30.91 kWh/m3feed sludge for AD trial. For AcoD trials, considering HRT = 13 days, using the TS concentration of 28.46 kg/m3 (Table 2) and ηAD = 0.40 (Table 3), the results obtained from eq. (4) were E 1= 55.21 kWh/m3feed sludge.
Thus, the incorporation of 10% MPL in MSS for an OLR of 1.94 kg VS/m3reactor·day led to a 79% increase in the EPRI. Based on these results, it is possible to set trial HRT = 13 days at a real scale, coupling simple management modifications at WWTP facilities.
Nevertheless, the proposed indicator seems an important (even conservative) predicting tool to implement in real-scale new management scenarios. However, the feed regime should be carefully planned with a stepwise increase to the desired feed ratio to acclimatise the bacteria and prevent overloading.
The conducted research allowed to reinforce that co-digestion of municipal sewage sludge with biodegradable substrates contributes to improving the energy potential and performance of the anaerobic digestion process. In addition, it emphasises that this technology could be a viable option to contribute to the energy transition and reduce the dependence on fossil fuels.
Considering the stability parameters, all trials remained within the recommended values, not compromising the co-digestion process. The incorporation of mango peel liquor proved to be an effective way to upgrade the municipal sewage sludge AD process, at mesophilic conditions, with the most suitable hydraulic retention time being 13 days.
SMI allowed comparing the performance between AD and AcoD, concluding that the methane production nearly doubled under similar organic loading rates, corresponding to an SMI of 93%. EPRI showed an increase of 79% by incorporating 10% of a rapidly biodegradable feedstock as co-substrate (MPL).
The results highlight the importance of applying simplified indicators in developing new sludge management scenarios to upscale the co-digestion process, reducing WWTP energy needs. To promote the AcoD strategy at WWTPs, the authors suggest evaluating the co-digestion process from different perspectives with a careful assessment aiming at their full-scale application.
To sum up, the integrated management of fruit biowaste and municipal sewage sludge by co-digestion can contribute to achieving bioeconomy targets and sustainable development goals, promoting the sustainability of food production.
This work was funded by national funds through FCT – Fundação para a Ciência e a Tecnologia, I.P., under the project UIDB/04129/2020 of LEAF-Linking Landscape, Environment, Agriculture and Food, Research Unit.
B. Gouveia acknowledges EIT/EU − KIC InnoEnergy. EU, for the provision of the scholarship BL105/2021 under the project KIC MSC RENE No.1018P.03916.1.01.
c |
Sludge concentration (in TS) |
[kg/m3] |
EPRI |
Energy potential recovery indicator |
[%] |
HRT |
Hydraulic retention time |
[day] |
ηAD |
TCOD removal |
[%] |
OLR |
Organic loading rate |
[g VS/Lreactor·day] |
SCOD |
Soluble chemical oxygen demand |
[g/L] |
SELR |
Specific energy loading rate |
[1/day] |
SGP |
Specific gas production |
[mL/g VS] |
SMI |
Specific methane indicator |
[%] |
SMP |
Specific methane production |
[mL CH4/g VS] |
TA |
Total alkalinity |
[mgCaCO3/L] |
TCOD |
Total chemical oxygen demand |
[g/L] |
TKN |
Total Kjeldahl nitrogen |
[g/L] |
TS |
Total solids |
[g/L] |
VS |
Volatile solids |
[g/L] |
VSS |
Volatile suspended solids |
[g/L] |
Abbreviations |
||
AcoD |
Anaerobic Co-digestion |
|
AD |
Anaerobic Digestion |
|
CSTR |
Continuous Stirred Tank Reactor |
|
EU |
European Union |
|
FVW |
Fruit and Vegetable Waste |
|
MPL |
Mango Peel Liquor |
|
MPW |
Mango Peel Waste |
|
MSS |
Municipal Sewage Sludge |
|
PS |
Primary Sludge |
|
SS |
Secondary Sludge |
|
WWTP |
Wastewater Treatment Plant |
|
- , The Ukraine war and threats to food and energy security: Cascading risks from rising prices and supply disruptions, Royal Institute of International Affairs, 2022
- ,
Energy recovery of the biomass from livestock farms in italy: The case of Modena province ,Journal of Sustainable Development of Energy, Water and Environment Systems , Vol. 6 (3),pp 464–480 , 2018, https://doi.org/https://doi.org/10.13044/j.sdewes.d6.0199 - ,
A spatial analysis of biogas potential from manure in Europe ,Renewable and Sustainable Energy Reviews , Vol. 94 ,pp 915–930 , , https://doi.org/https://doi.org/10.1016/J.RSER.2018.06.035, Oct. 2018 - ,
Sustainable management of unavoidable biomass wastes ,Green Energy and Resources , Vol. 1 (1),pp 100005 , , https://doi.org/https://doi.org/10.1016/J.GERR.2023.100005, Mar. 2023 - ,
A preliminary assessment of anaerobic co-digestion potential of mango and microalgal residue biomass using a design of experiments approach: Effect of thermal, physical and biological pre-treatments ,Food and Bioproducts Processing , Vol. 128 ,pp 143–152 , , https://doi.org/https://doi.org/10.1016/J.FBP.2021.04.015, Jul. 2021 - ,
Effect of hydraulic retention time on anaerobic co-digestion of cattle manure and food waste ,Renew Energy , Vol. 150 ,pp 213–220 , , https://doi.org/https://doi.org/10.1016/J.RENENE.2019.12.091, May 2020 - ,
A review on alternative fuels in future energy system ,Renewable and Sustainable Energy Reviews , Vol. 128 ,pp 109927 , , https://doi.org/https://doi.org/10.1016/J.RSER.2020.109927, Aug. 2020 - ,
A Review on Performance Improvement of Anaerobic Digestion Using Co-Digestion of Food Waste and Sewage Sludge ,J Environ Manage , Vol. 338 ,pp 117733 , , https://doi.org/https://doi.org/10.1016/J.JENVMAN.2023.117733, Jul. 2023 - ,
Comparison of results from life cycle assessment when using predicted and real-life data for an anaerobic digestion plant ,Journal of Sustainable Development of Energy, Water and Environment Systems , Vol. 9 (3), 2021, https://doi.org/https://doi.org/10.13044/j.sdewes.d8.0373 - ,
Anaerobic co-digestion of mixed sewage sludge and fruits and vegetable wholesale market waste: Composition and seasonality effect ,Journal of Water Process Engineering , Vol. 31 ,pp 100848 , , https://doi.org/https://doi.org/10.1016/J.JWPE.2019.100848, Oct. 2019 - ,
Optimisation of sewage sludge anaerobic digestion through co-digestion with OFMSW: Effect of collection system and particle size ,Waste Management , Vol. 43 ,pp 137–143 , , https://doi.org/https://doi.org/10.1016/J.WASMAN.2015.06.029, Sep. 2015 - ,
Anaerobic codigestion of waste activated sludge and OFMSW: The experiences of Viareggio and Treviso plants (Italy) ,Water Science and Technology , Vol. 53 (8),pp 203–211 , 2006, https://doi.org/https://doi.org/10.2166/wst.2006.251 - , WBA GLOBAL BIOENERGY STATISTICS 2017, 2017
- ,
Hydrothermal carbonization of sewage sludge coupled with anaerobic digestion: Integrated approach for sludge management and energy recycling ,Energy Convers Manag , Vol. 224 ,pp 113353 , , https://doi.org/https://doi.org/10.1016/J.ENCONMAN.2020.113353, Nov. 2020 - ,
Application of anaerobic membrane bioreactors to municipal wastewater treatment at ambient temperature: A review of achievements, challenges, and perspectives ,Bioresour Technol , Vol. 267 ,pp 756–768 , , https://doi.org/https://doi.org/10.1016/J.BIORTECH.2018.07.050, Nov. 2018 - ,
Enhanced anaerobic digestion of sewage sludge by thermal or alkaline-thermal pre-treatments: Influence of hydraulic retention time reduction ,Int J Hydrogen Energy , Vol. 45 (4),pp 2655–2667 , , https://doi.org/https://doi.org/10.1016/J.IJHYDENE.2019.11.198, Jan. 2020 - ,
Residual municipal solid waste as co-substrate at wastewater treatment plants: An assessment of methane yield, dewatering potential and microbial diversity ,Science of The Total Environment , Vol. 804 ,pp 149936 , , https://doi.org/https://doi.org/10.1016/J.SCITOTENV.2021.149936, Jan. 2022 - ,
Biomethane production from anaerobic co-digestion at wastewater treatment plants: A critical review on development and innovations in biogas upgrading techniques ,Science of The Total Environment , Vol. 765 ,pp 142753 , , https://doi.org/https://doi.org/10.1016/J.SCITOTENV.2020.142753, Apr. 2021 - ,
Assessment of methods to pretreat microalgal biomass for enhanced biogas production ,Journal of Sustainable Development of Energy, Water and Environment Systems , Vol. 6 (2),pp 394–404 , , https://doi.org/https://doi.org/10.13044/j.sdewes.d5.0193, Jun. 2018 - , Anaerobic digestion of fruit and vegetable waste: a critical review of associated challenges, Environmental Science and Pollution Research, 2022
- ,
Anaerobic digestion of food waste through the operation of a mesophilic two-phase pilot scale digester – Assessment of variable loadings on system performance ,Bioresour Technol , Vol. 178 ,pp 226–229 , , https://doi.org/https://doi.org/10.1016/J.BIORTECH.2014.09.001, Feb. 2015 - ,
Pilot scale comparison of single and double-stage thermophilic anaerobic digestion of food waste ,J Clean Prod , Vol. 171 ,pp 1376–1385 , , https://doi.org/https://doi.org/10.1016/J.JCLEPRO.2017.10.080, Jan. 2018 - , Effect of mixing ratio on biomethane potential of anaerobic co-digestion of fruit and vegetable waste and food waste, Biomass Convers Biorefin, 2023
- ,
Anaerobic co-digestion of sewage sludge and fruit wastes: Evaluation of the transitory states when the co-substrate is changed ,Chemical Engineering Journal , Vol. 262 ,pp 1268–1274 , , https://doi.org/https://doi.org/10.1016/J.CEJ.2014.10.045, Feb. 2015 - ,
Study on anaerobic co-digestion of municipal sewage sludge and fruit and vegetable wastes: Methane production, microbial community and three-dimension fluorescence excitation-emission matrix analysis ,Bioresour Technol , Vol. 347 ,pp 126748 , , https://doi.org/https://doi.org/10.1016/J.BIORTECH.2022.126748, Mar. 2022 - ,
Assessment and optimization of a decentralized food-waste-to-energy system with anaerobic digestion and CHP for energy utilization ,Energy Convers Manag , Vol. 228 ,pp 113654 , , https://doi.org/https://doi.org/10.1016/J.ENCONMAN.2020.113654, Jan. 2021 - ,
The anaerobic digestion process of biogas production from food waste: Prospects and constraints ,Bioresour Technol Rep , Vol. 8 ,pp 100310 , , https://doi.org/https://doi.org/10.1016/J.BITEB.2019.100310, Dec. 2019 - ,
Anaerobic co-digestion of wastewater sludge: A review of potential co-substrates and operating factors for improved methane yield ,Processes , Vol. 8 (1), 2020, https://doi.org/https://doi.org/10.3390/pr8010039, MDPI AG, Jan. 01 - ,
Anaerobic co-digestion process for biogas production: Progress, challenges and perspectives ,Renewable and Sustainable Energy Reviews , Vol. 76 ,pp 1485–1496 , , https://doi.org/https://doi.org/10.1016/J.RSER.2016.11.184, Sep. 2017 - , Methane production from anaerobic co-digestion of sludge with fruit and vegetable wastes: effect of mixing ratio and inoculum type
- , , Standard methods for the examination of water and wastewater, 2012
- ,
Anaerobic co-digestion of swine manure with energy crop residues ,Biotechnology and Bioprocess Engineering , Vol. 16 (5),pp 1044–1052 , , https://doi.org/https://doi.org/10.1007/s12257-011-0117-4, Oct. 2011 - ,
Energy feasibility study of sludge pre-treatments: A review ,Appl Energy , Vol. 149 ,pp 176–185 , , https://doi.org/https://doi.org/10.1016/j.apenergy.2015.03.132, Jul. 2015 - ,
Anaerobic co-digestion: Current status and perspectives ,Bioresour Technol , Vol. 330 ,pp 125001 , , https://doi.org/https://doi.org/10.1016/J.BIORTECH.2021.125001, Jun. 2021 - ,
Current status and perspectives on anaerobic co-digestion and associated downstream processes ,Environmental Science: Water Research and TechnologyRoyal Society of Chemistry , Vol. 4 (11),pp 1759–1770 , 2018, https://doi.org/https://doi.org/10.1039/c8ew00356d, Nov. 01 - ,
Enhancing bioenergy recovery from agro-food biowastes as a strategy to promote circular bioeconomy ,Journal of Sustainable Development of Energy, Water and Environment Systems , Vol. 9 (1),pp 1–13 , , https://doi.org/https://doi.org/10.13044/j.sdewes.d8.0320, Jan. 2021 - ,
Effect of Minimizing d-Limonene Compound on Anaerobic Co-digestion Feeding Mixtures to Improve Methane Yield ,Waste Biomass Valorization , Vol. 10 (1),pp 75–83 , , https://doi.org/https://doi.org/10.1007/s12649-017-0048-1, Jan. 2019 - ,
Co-treatment of fruit and vegetable waste in sludge digesters. An analysis of the relationship among bio-methane generation, process stability and digestate phytotoxicity ,Waste Management , Vol. 34 (9),pp 1603–1608 , , https://doi.org/https://doi.org/10.1016/J.WASMAN.2014.05.017, Sep. 2014 - ,
Performance of Anaerobic Co-digestion of Pig Slurry with Pineapple (Ananas comosus) Bio-waste Residues ,Waste Biomass Valorization , Vol. 12 (1),pp 303–311 , , https://doi.org/https://doi.org/10.1007/s12649-020-00959-w, Jan. 2021 - ,
A pig slurry feast/famine feeding regime strategy to improve mesophilic anaerobic digestion efficiency and digestate hygienisation ,Waste Management and Research , Vol. 39 (7),pp 947–955 , , https://doi.org/https://doi.org/10.1177/0734242X20972794, Jul. 2021 - , Biomethanization of the Organic Fraction of Municipal Solid Wastes, Water Intelligence Online
- ,
BMP tests of source selected OFMSW to evaluate anaerobic codigestion with sewage sludge ,Waste Management , Vol. 33 (7),pp 1626–1632 , , https://doi.org/https://doi.org/10.1016/j.wasman.2013.03.020, Jul. 2013