


The global electricity sector accounts for 59% of all coal used, 34% of natural gas, 4% of oil, 52% of renewables, and almost 100% of nuclear power. It also accounts for about 20% of the world's total final energy consumption and more than a third of all energy-related CO2 emissions [1]. Within the main branches of the economy, the industrial sector, with its development in recent decades, has increased the consumption of electrical energy, representing 25% of all energy consumed worldwide [2]. Due to the high incidence of electrical energy consumption in the industrial sector, a greater effort is demanded in the search for strategies to monitor, reduce and manage the energy demand in this sector.
A gap analysis of existing industrial and research needs regarding energy management identified two main development demands in the industrial sector: production management concerning energy efficiency and integrating energy performance criteria in Information and Communication Technology systems [3]. To mitigate the energy and environmental impact of the industrial sector, the international community has adopted policies, laws, codes, and standards that promote improving energy efficiency in production processes to achieve sustainable development and environmental protection [4]. Some policies promote energy efficiency by reducing the use of fossil fuels and increasing non-conventional energy sources [5]. In Colombia, environmental policy tools such as Law 697 of 2001 [6] and Law 2099 of 2021 [7] promote rational energy use and efficiency.
Electric motors are one of the main consumers of electrical energy since they represent between 43 and 46% of electricity worldwide [8], equivalent to 13% of global CO2 emissions [8]. In addition, they affect between 60 and 70% of the electrical consumption of the industrial sector [9]. On the other hand, it is estimated that with energy-saving measures, electrical energy consumption from electric motors can be reduced between 20 and 30% locally and 10% globally [10].
Because of the need to save energy in electric motors due to their high energy and environmental impact at a global and industrial level, electrical energy saving measures have been proposed, such as the replacement of more efficient motors [11], the use of variable speed drives [12], energy regeneration [13], identification of bad operational practices [10], repair and maintenance standards [14], as well as improvement in the design of mechanical load [15]. In other studies, such as [2], [9], [16], the energy impact of various energy-saving measures in electric motors is evaluated with a general projection approach.
While demonstrating the potential for energy savings in electric motors, these studies highlight the difficulty of evaluating the energy and economic impact of these measures due to the high complexity and cost of directly measuring the energy efficiency of electric motors in industrial conditions [17]. This evaluation becomes even more complex if the measures are combined, such as replacing more efficient motors and installing variable speed drives [18].
As a proposed solution to this problem, this paper presents a methodology based on the ISO-50001 standard [19] that allows evaluation of the energy and economic impact of replacing more efficient motors and variable speed drives in industrial cooling tower pumping systems. As tools of the methodology, an energy performance indicator is proposed that relates energy consumption to the water flow of the entire pumping system. In addition, energy baselines are established that make it possible to effectively compare the plant's energy performance before and after equipment replacement.
Cooling tower systems are important components in an industry that require dispersing the heat from the water produced in industrial processes. These systems include water pumps that can be energetically optimised by replacing more efficient motors and installing variable-speed drives [13]. The parameters that influence a pumping system's consumption and energy efficiency are analysed, such as the load factor, flow regulation mechanisms, motor efficiency, power factor, and the effects of harmonics generated by variable speed drive, are assessed. Moreover, the operation of the cooling tower area and the pumping systems under the initial conditions are characterised in terms of electrical energy consumption, harmonics, and energy performance. Also, the system's operation after installing the new motors with their variable speed drives is characterised by electrical energy consumption, harmonics, and energy performance. The results are compared in the two mentioned scenarios, before and after the technological change.
The contribution of the proposed methodology based on the ISO-50001 standard is that it is not necessary to directly measure each motor's mechanical power and efficiency, which is a current challenge to monitor and evaluate the energy efficiency of electric motors in the industrial sector. Instead, the proposed energy performance indicator uses data that are easy to acquire, such as electricity consumption and water flow, which facilitates energy management of industrial pumping systems. Tools like these can be part of demand response programs that are currently one of the most advanced ways to manage and optimise energy in electrical systems [20].
This section describes the methodology used for the economic and energy evaluation of replacing the pumps in the clean-water-cooling tower plant.
Figure 1 shows the three main stages of the methodology to assess the impact of the cooling tower system's energy efficiency improvement: installation and inspection, measurement and data processing, and results and analysis. Each stage was designed to evaluate and obtain a comparison of both systems, standard efficiency motors and higher efficiency motors with adjusted load and variable speed drive.
Flowchart of the methodology
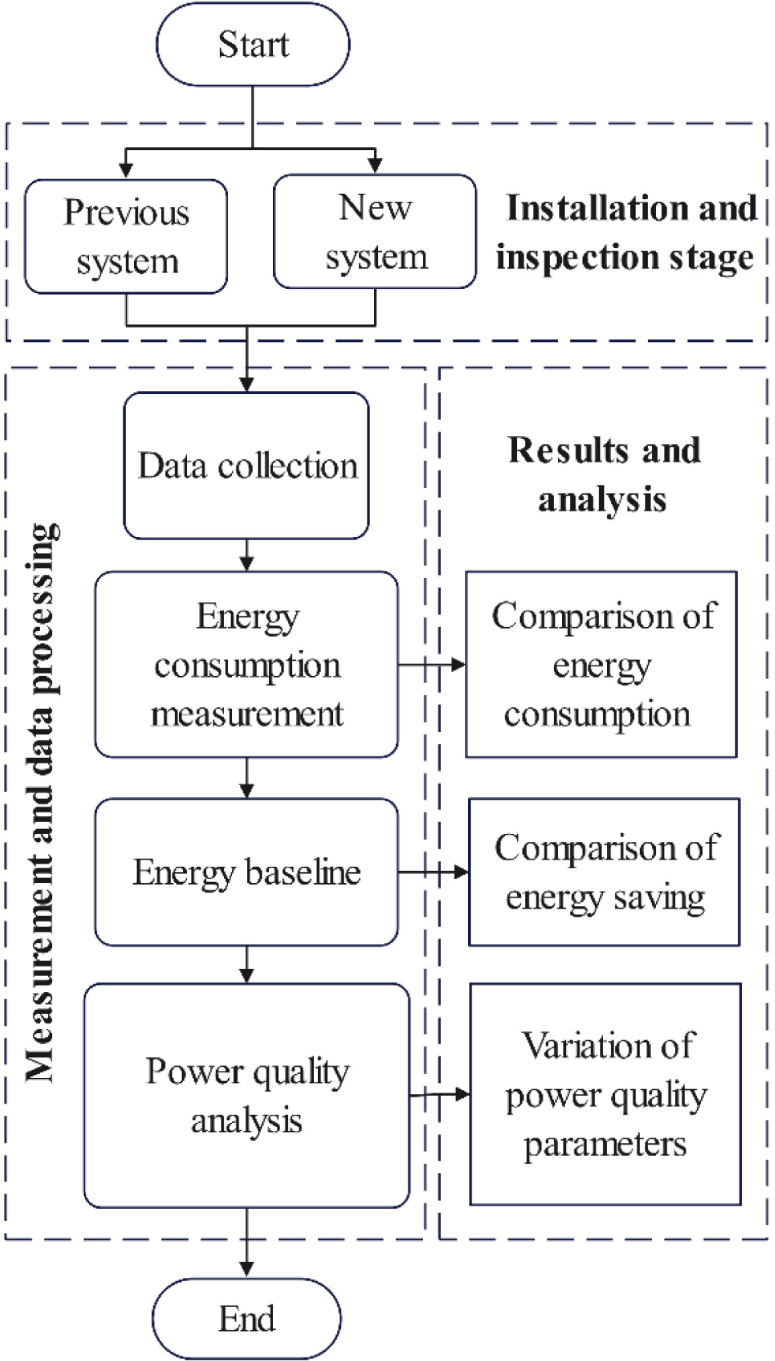
The installation and inspection stage starts with revising the available technologies and installing new technologies. Each technology is passed through the same process to obtain the same results that are compared and analysed. The measurement and data processing stage can be divided into five steps: data collection, measurement, characterisation of energy consumption, and power quality analysis. After running this process on the previous and proposed system, the results can be compared and obtained the different analyses such as comparison of energy consumption, comparison of energy saving, and variation of power quality parameters.
Regarding data collection, this step takes the necessary data to perform the study. Some information collected is related to the nameplate, loads, flow control methods, and motor starters. Regarding the energy consumption measurement, this step measures energy and daily power flow consumption at the common connection point and each load. The energy consumption data and the daily flow were obtained from the records of the energy management system for the previous system (from December 12, 2020, to May 31, 2021) and for the new system (from July 1, 2021, to December 30, 2021). All measurements were taken in the totaliser and the pumps.
The energy data obtained in the new measurements are tabulated. Then, the cooling tower operation baseline with energy consumption data (in kWh) versus the water flow demanded by the production plants is obtained. In addition, the energy parameters are studied, and the software NEPLAN is used to model the electrical system with the new characteristics. Finally, a power quality analysis was performed considering the evaluation of the total and individual voltage and current harmonics.
The cooling tower object of study is the induced mechanical draft type. It is part of a closed-cycle cooling system that extracts the most outstanding amount of heat energy generated in the distillation towers' heat exchangers and the soap plant's vacuum systems.
Figure 2 shows the system comprising a two-cell cooling tower, four motor pump assemblies, and two extractors at the top of the cooling tower. The tower cells are made of polymer (plastic). They are responsible for uniformly distributing the water as a thin film, thus facilitating its cooling as the air passes through them.
Cooling tower flowchart
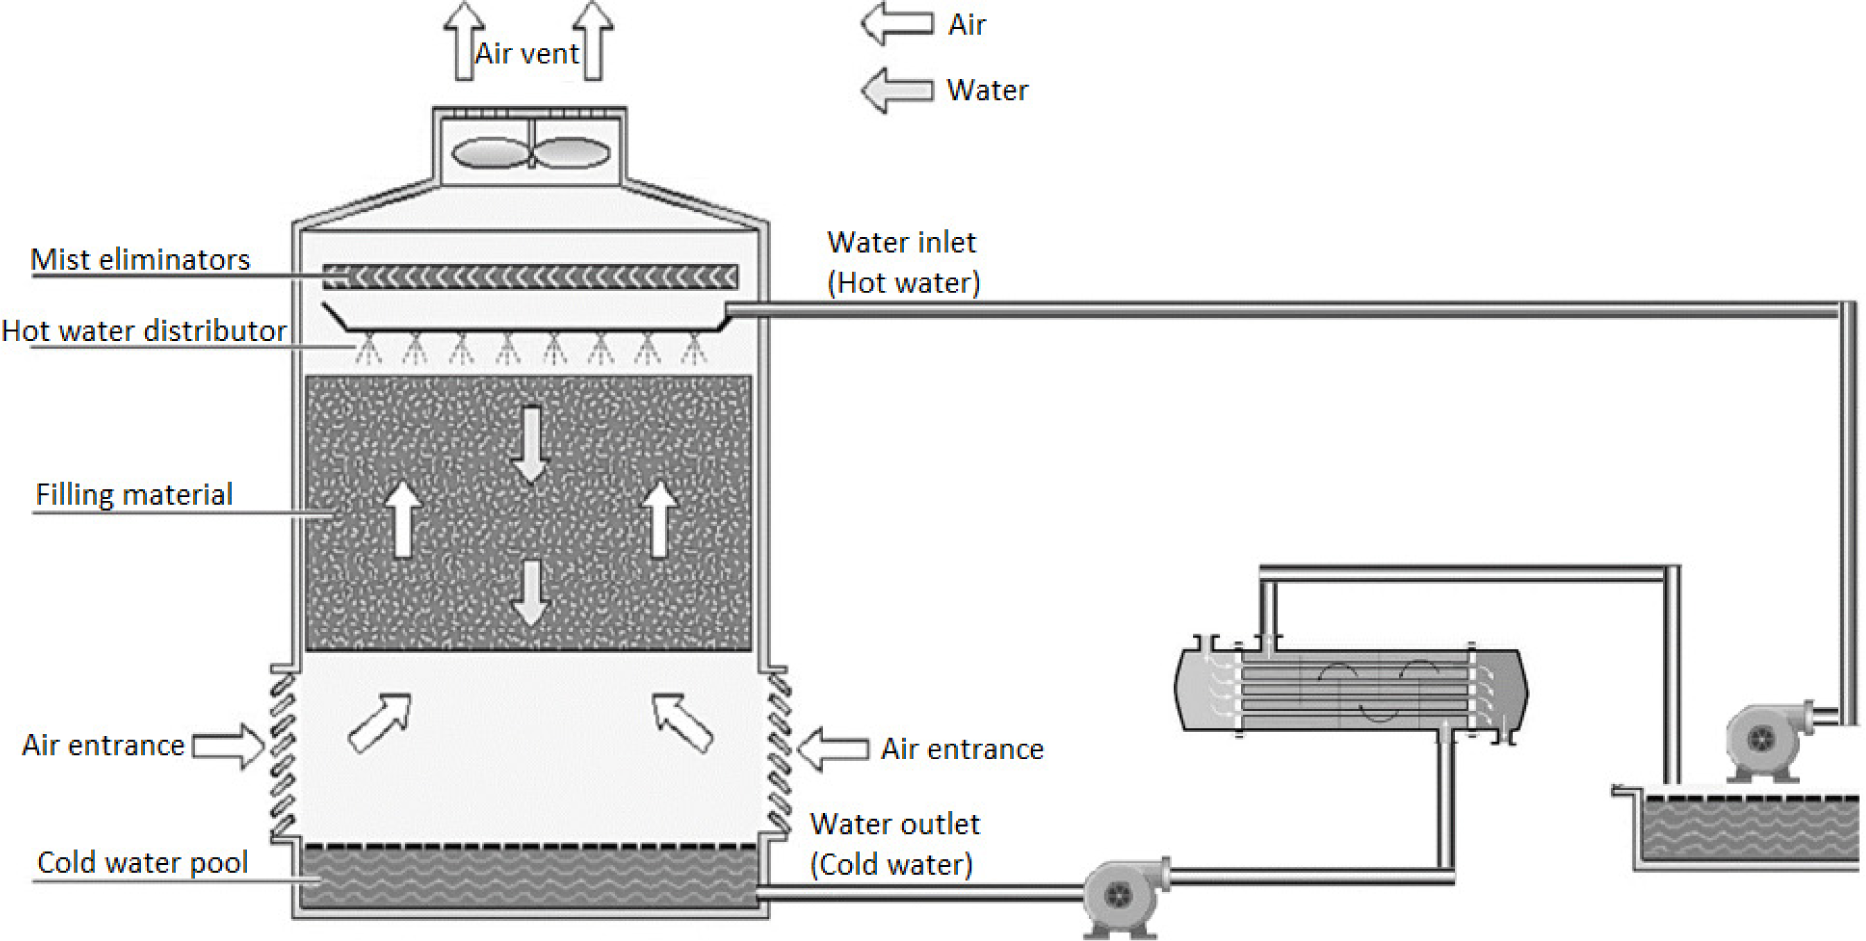
The air is sucked through the filling of the tower using two fans located in the upper part, establishing a flow against the current with the water, thus facilitating heat exchange between the two media. The extractors introduce 800 m3/h of forced air from the bottom to the top of the tower at an average speed of 15 km/h. Each fan is driven by a 25 HP, 1700 rpm motor and 5 kNm gearbox. The temperature of the water passing through the tower's interior drops by approximately 6 °C. The water reaches the bottom of the tower, where it is stored in a basin of approximately 8,000 l volume. At this point, the water is sucked in by four centrifugal pumps and sent through pipe networks to the different places required for cooling. The working pressure required by the processes must be between 50 and 70 psi (3.45 to 4.83 bar), and the temperature must be around 30 ºC. Once the water has exchanged heat, it returns to the cooling tower to be cooled again.
The operation of the cooling tower pumping system was controlled by the operator, who maintained the flow and pressure constant. Depending on the demand, the operator activates the necessary pumps to maintain the pressure and flow parameters required by the processes. The last pump did not work at 100%, and the flow parameters were regulated by throttling the main valve.
For the calculation of energy savings, the consumption of the system before and after the technological change. Power consumption is calculated according to eq. (1). corresponds to the monthly consumption, is the daily consumption, and is the number of days of that consumption.
(1)
The annual consumption is calculated as in eq. (2). The term corresponds to the annual consumption, is the monthly consumption, and is the number of operating months.
(2)
Energy saving can be calculated according to the subtraction of the consumption before and after the technological change, as expressed in eq. (3). The term ES refers to energy saving, is the energy consumption before the technological change, and is the energy consumption after the technological change.
(3)
The technological change consists of substituting four motors for others with less power (adjusted load) and greater efficiency. Furthermore, the flow control method changed from a manual to an automatic system with a flow and pressure loop closed with variable speed drives (the pumps start automatically depending on the demanded flow load and control the speed of the pump to regulate flow). These significant changes have a great advantage regarding the rational use of energy; however, non-linear loads (four variable speed drives) must be considered when evaluating energy-saving measures because they produce harmonics that affect power quality. Next, it explains how the variable speed drives affect power quality and the equipment used. The methodologies for measuring the harmonics injected into the network by each installed equipment will be described for the induction motors.
Organisations today set not only production goals but also energy savings goals. To comply with international commitments regarding what has to do with climate change, the Colombian Congress has approved laws such as 697 of 2001. This law invites the industry to embrace the culture of rational energy use by implementing administrative systems such as the ISO-50001 standard [19]. This standard allows companies to establish an energy policy, objectives, goals, and action plan ultimately aimed at protecting the environment and achieving savings that help the operating cost of organisations.
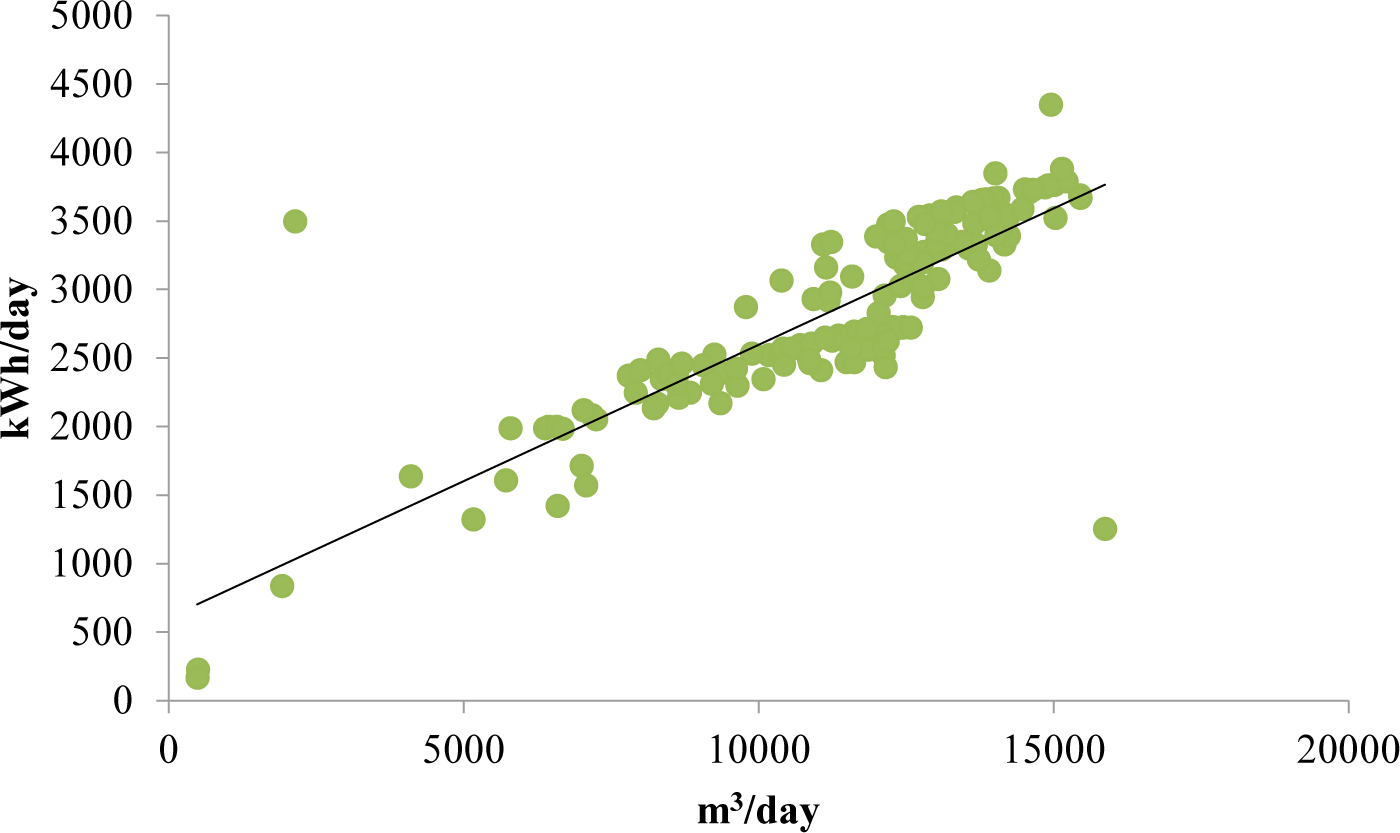
According to ISO-50001 [19], the energy baseline is a quantitative reference that provides the basis for comparing energy performance in a specified period. The energy baseline can be established by plotting a relevant variable (output variable of a process) against energy consumption. A scatterplot and the coefficient of determination can be used to show that the variable is relevant, i.e., influences energy consumption [21].
The information provided by the industry (energy in kWh vs. production in m3) with a time horizon of 167 days (five and a half months) was used to prepare the baseline. A scatter plot was made with these data, and the least squares linear regression technique was applied to these data. The analysis shows a coefficient of determination of 0.699, considered a strong indicator according to [22]. However, the data is filtered to model the process better and make the baseline more reliable.
Energy consumption and production information must be taken to build a baseline for the same specific period (day, month, and year) [21]. These data are plotted on a scatterplot, and the energy consumption is located on the Y axis and production on the X axis. The least squares method is used to find the coefficient of determination between and and draw the line of best fit. The slope and the intercept of the line are calculated analytically as in eq. (4).
(4)
The term is the energy consumption, is the associated production, is the slope of the line representing the average rate of change of energy consumption regarding production, is the intercept of the line on the Y axis, meaning the energy is not associated with the average production in the analysed period, and is the energy directly associated with the production process.
The coefficient of determination indicates the strength of the linear model of change in energy consumption with production (significant variable). If the coefficient of determination between and on the graph is weak, it can be attributed to some of the following [23]:
The periods in which production () and consumption () have been measured differ.
Lack of calibration of the measurement systems.
Non-real estimated values of production or processes that are not considered.
Technological or operational changes that modify the efficiency of the system.
Low monitoring and supervision to identify consumption, operation, and maintenance practices.
According to [22], indicators with are potential indicators and those with are strong indicators.
The coefficient of determination allows evaluation of the degree of adjustment of the regression line to the sample values. This value measures the degree of association between the dependent and independent variables. There is an adjusted , which does not depend on the number of variables that make up the model. A model with = 1 cannot be expected, as energy consumption is only correlated with production variations, and no other operating and maintenance factors that affect the system were considered. The also depends on the number of false data, and a filter must be used to eliminate data that do not represent normal behaviour. For example, calibration problems of measuring instruments, poor data collection, human errors, and consistent changes in production or consumption data [23].
The standard error of the estimate of Y is used to verify and eliminate false data from the sample, as shown in eq. (5). The term is the intercept, and is the slope.
(5)
The standard error of the estimate measures the amount of scatter in the observed data around the regression line. The standard error of the estimate is relatively low if the data points are very close to the line and vice versa. It can also be calculated by p-value as standard error. To perform the data filtering, the standard error of the mean was calculated and then used to find the more dispersed points on the line .
For monitoring power quality, the FLUKE 1753 network analyser is used. This instrument collects and stores detailed information on all the events associated with electrical disturbances. Furthermore, the instrument displays parameters of the electrical system, such as power, voltage, and current. The network analyser saves a file with all the information taken from the network, which can be downloaded with the FLUKE Power Log software as a histogram. It is possible to obtain from the 3rd to the 25th harmonics.
Power quality measurements were taken on the clean water-cooling tower plant's non-linear load drives and harmonic sources. These measurements were taken to determine how these four drives affect the plant's power quality. In addition, using the harmonic analysis simulator of the NEPLAN program, data of each of the individual harmonics were included to validate the system's behaviour. In addition to the simulation, measurements were made with the network analyser at the common point to determine how the installation of the harmonic source equipment affected the power supply.
Table 1 shows the motors installed in the cooling tower system plant in the clean and dirty water basins. In total, there are 18 motors of different powers. Four motors are 55 kW (75 HP). Three motors remain in the plant operation, while the fourth is reserved for maintenance or contingency events. Table 2 shows the data after the technological change from the pumps with 75 HP (55 kW) motors for a set of 45 HP (33.5 kW) pumps with the capacity to drive the same load but consume less energy.
Load census before the technological change
| No. | Motor | Power [kW] | Current [A] | Voltage [V] | Speed [RPM] |
|---|---|---|---|---|---|
| M1 | Pump motor of clean water 1 | 55.0 | 86.5 | 460 | 1,780 |
| M2 | Pump motor of clean water 2 | 55.0 | 86.5 | 460 | 1,780 |
| M3 | Pump motor of clean water 3 | 55.0 | 86.5 | 460 | 1,780 |
| M4 | Pump motor of clean water 4 | 55.0 | 86.5 | 460 | 1,780 |
| M5 | Pump motor of dirty water 1 | 22.4 | 35.0 | 460 | 1,775 |
| M6 | Pump motor of dirty water 2 | 22.4 | 39.0 | 440 | 1,755 |
| M7 | Pump motor of dirty water 3 | 22.4 | 35.0 | 460 | 1,775 |
| M8 | Blower of dirty water 1 | 15.0 | 26.7 | 440 | 1,765 |
| M9 | Blower of dirty water 2 | 15.0 | 26.7 | 440 | 1,765 |
| M10 | Blower of clean water 1 | 18.5 | 32.3 | 440 | 1,760 |
| M11 | Blower of clean water 2 | 18.5 | 32.3 | 440 | 1,760 |
| M12 | Motor of glycerin basin 1 | 56.0 | 88.4 | 460 | 1,780 |
| M13 | Motor of glycerin basin 2 | 37.3 | 56.0 | 460 | 1,780 |
| M14 | Pump motor of Palm Kernel | 11.0 | 19.2 | 440 | 1,765 |
| M15 | Pump motor of dirty water4 | 22.4 | 39.0 | 440 | 1,755 |
| M16 | Soda tank | 18.6 | 29.7 | 460 | 1,775 |
| M17 | Motor “Patol” | 18.6 | 22.2 | 440 | 1,755 |
| M18 | Motor of tank 33 | 7.5 | 11.4 | 460 | 1,750 |
Load census after the technological change
| No. | Motor | Power [kW] | Current [A] | Voltage [V] | Speed [RPM] |
|---|---|---|---|---|---|
| M1 | Pump motor of clean water 1 | 33.5 | 52.0 | 460 | 3,555 |
| M2 | Pump motor of clean water 2 | 33.5 | 52.0 | 460 | 3,555 |
| M3 | Pump motor of clean water 3 | 33.5 | 52.0 | 460 | 3,555 |
| M4 | Pump motor of clean water 4 | 33.5 | 52.0 | 460 | 3,555 |
| M5 | Pump motor of dirty water 1 | 22.4 | 35.0 | 460 | 1,775 |
| M6 | Pump motor of dirty water 2 | 22.4 | 39.0 | 440 | 1,755 |
| M7 | Pump motor of dirty water 3 | 22.4 | 35.0 | 460 | 1,775 |
| M8 | Blower of dirty water 1 | 15.0 | 26.7 | 440 | 1,765 |
| M9 | Blower of dirty water 2 | 15.0 | 26.7 | 440 | 1,765 |
| M10 | Blower of clean water 1 | 18.5 | 32.3 | 440 | 1,760 |
| M11 | Blower of clean water 2 | 18.5 | 32.3 | 440 | 1,760 |
| M12 | Motor of glycerin basin 1 | 56.0 | 88.4 | 460 | 1,780 |
| M13 | Motor of glycerin basin 2 | 37.3 | 56.0 | 460 | 1,780 |
| M14 | Pump motor of Palm Kernel | 11.0 | 19.2 | 440 | 1,765 |
| M15 | Pump motor of dirty water 4 | 22.4 | 39.0 | 440 | 1,755 |
| M16 | Soda tank | 18.6 | 29.7 | 460 | 1,775 |
| M17 | Motor “Patol” | 18.6 | 22.2 | 440 | 1,755 |
| M18 | Motor of tank 33 | 7.5 | 11.4 | 460 | 1,750 |
Table 3 shows monthly data: the power consumption measured in each motor of the cooling tower, the estimated work time of these motors and the energy consumed.
Estimated monthly energy before the technological change
| No. | Motor | Operation time [h/month] | Power [kW] | Energy [kWh/month] |
|---|---|---|---|---|
| M1 | Pump motor of clean water 1 | 720 | 50.3 | 36,212 |
| M2 | Pump motor of clean water 2 | 720 | 44.0 | 31,657 |
| M3 | Pump motor of clean water 3 | 720 | 42.6 | 30,640 |
| M4 | Pump motor of clean water 4 | 720 | 21.9 | 15,768 |
| M5 | Pump motor of dirty water 1 | 720 | 20.3 | 14,616 |
| M6 | Pump motor of dirty water 2 | 720 | 23.6 | 16,992 |
| M7 | Pump motor of dirty water 3 | 720 | 14.0 | 10,080 |
| M8 | Blower of dirty water 1 | 720 | 13.0 | 9,360 |
| M9 | Blower of dirty water 2 | 720 | 12.3 | 8,856 |
| M10 | Blower of clean water 1 | 720 | 12.1 | 8,712 |
| M11 | Blower of clean water 2 | 200 | 39.9 | 7,980 |
| M12 | Motor of glycerin basin 1 | 200 | 38.3 | 7,660 |
| M13 | Motor of glycerin basin 2 | 100 | 8.8 | 880 |
| M14 | Pump motor of Palm Kernel | 0 | 0.0 | 0 |
| M15 | Pump motor of dirty water 4 | 0 | 0.0 | 0 |
| M16 | Soda tank | 0 | 0.0 | 0 |
| M17 | Motor “Patol” | 0 | 0.0 | 0 |
| M18 | Motor of tank 33 | 0 | 0.0 | 0 |
After installing the new motor-pump systems with the variable speed drive and an automatic control system to control flow and pressure, the measurements were made again, obtaining the results in Table 4.
Estimated monthly energy after the technological change
| No. | Motor | Operation time [h/month] | Power [kW] | Energy [kWh/month] |
|---|---|---|---|---|
| M1 | Pump motor of clean water 1 | 720 | 23.0 | 16,547 |
| M2 | Pump motor of clean water 2 | 720 | 23.0 | 16,547 |
| M3 | Pump motor of clean water 3 | 720 | 23.0 | 16,547 |
| M4 | Pump motor of clean water 4 | 720 | 21.9 | 15,768 |
| M5 | Pump motor of dirty water 1 | 720 | 20.3 | 14,616 |
| M6 | Pump motor of dirty water 2 | 720 | 23.6 | 16,992 |
| M7 | Pump motor of dirty water 3 | 720 | 14.0 | 10,080 |
| M8 | Blower of dirty water 1 | 720 | 13.0 | 9,360 |
| M9 | Blower of dirty water 2 | 720 | 12.3 | 8,856 |
| M10 | Blower of clean water 1 | 720 | 12.1 | 8,712 |
| M11 | Blower of clean water 2 | 200 | 39.9 | 7,980 |
| M12 | Motor of glycerin basin 1 | 200 | 38.3 | 7,660 |
| M13 | Motor of glycerin basin 2 | 100 | 8.8 | 880 |
| M14 | Pump motor of Palm Kernel | 0 | 0.0 | 0 |
| M15 | Pump motor of dirty water 4 | 0 | 0.0 | 0 |
| M16 | Soda tank | 0 | 0.0 | 0 |
| M17 | Motor “Patol” | 0 | 0.0 | 0 |
| M18 | Motor of tank 33 | 0 | 0.0 | 0 |
Figure 3 shows the baseline built based on the available data. This unfiltered line has a determination coefficient of 0.69.
Unfiltered baseline
To improve , the data are filtered to remove unrepresentative data from the indicator. For filtering, two lines parallel to the baseline are used as a limit with the models and obtained from the data's mean dispersion. Values outside these lines are considered outliers and are removed. Figure 4 shows the indicator's baseline and the filters' limits delimited by the dispersion value N.
Baseline limits for data filtering
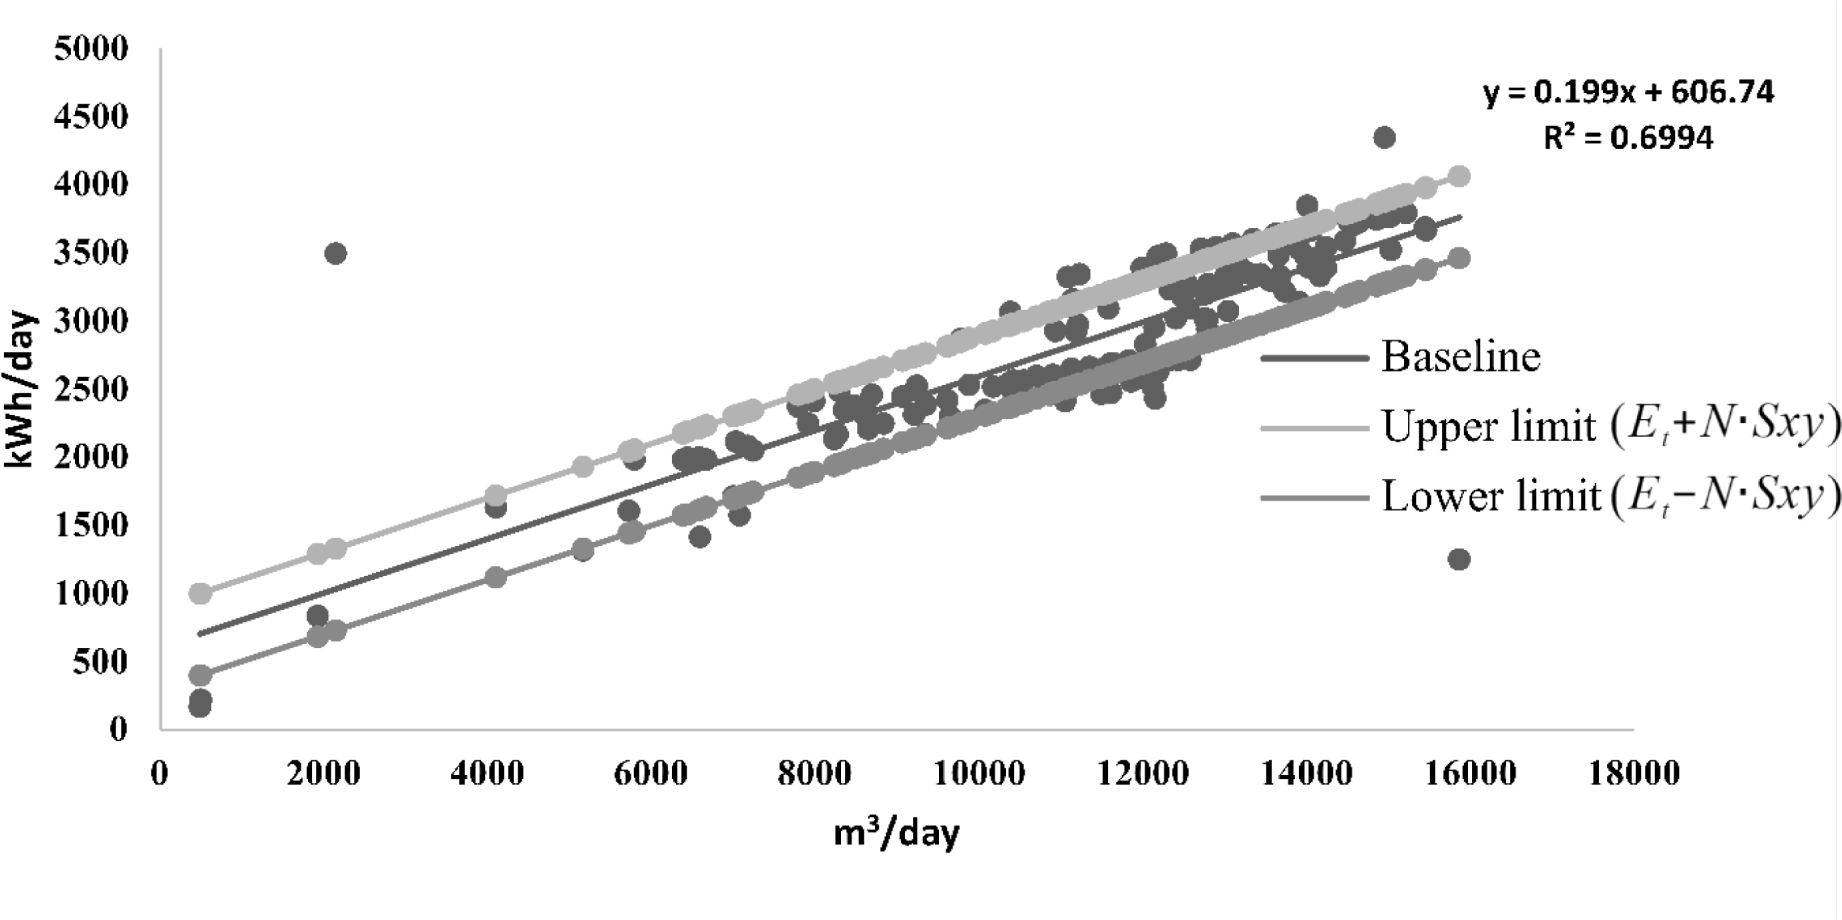
The data extracted from the sample does not represent more than 30% of the sample; therefore, the representative sample is not affected. With the data that remained from the sample, the value of was determined again, and it verified that its value is more significant than 0.9, which shows that the indicator is very strong [22]. Figure 5 shows the baseline with the filtered data.
Baseline with filtered data
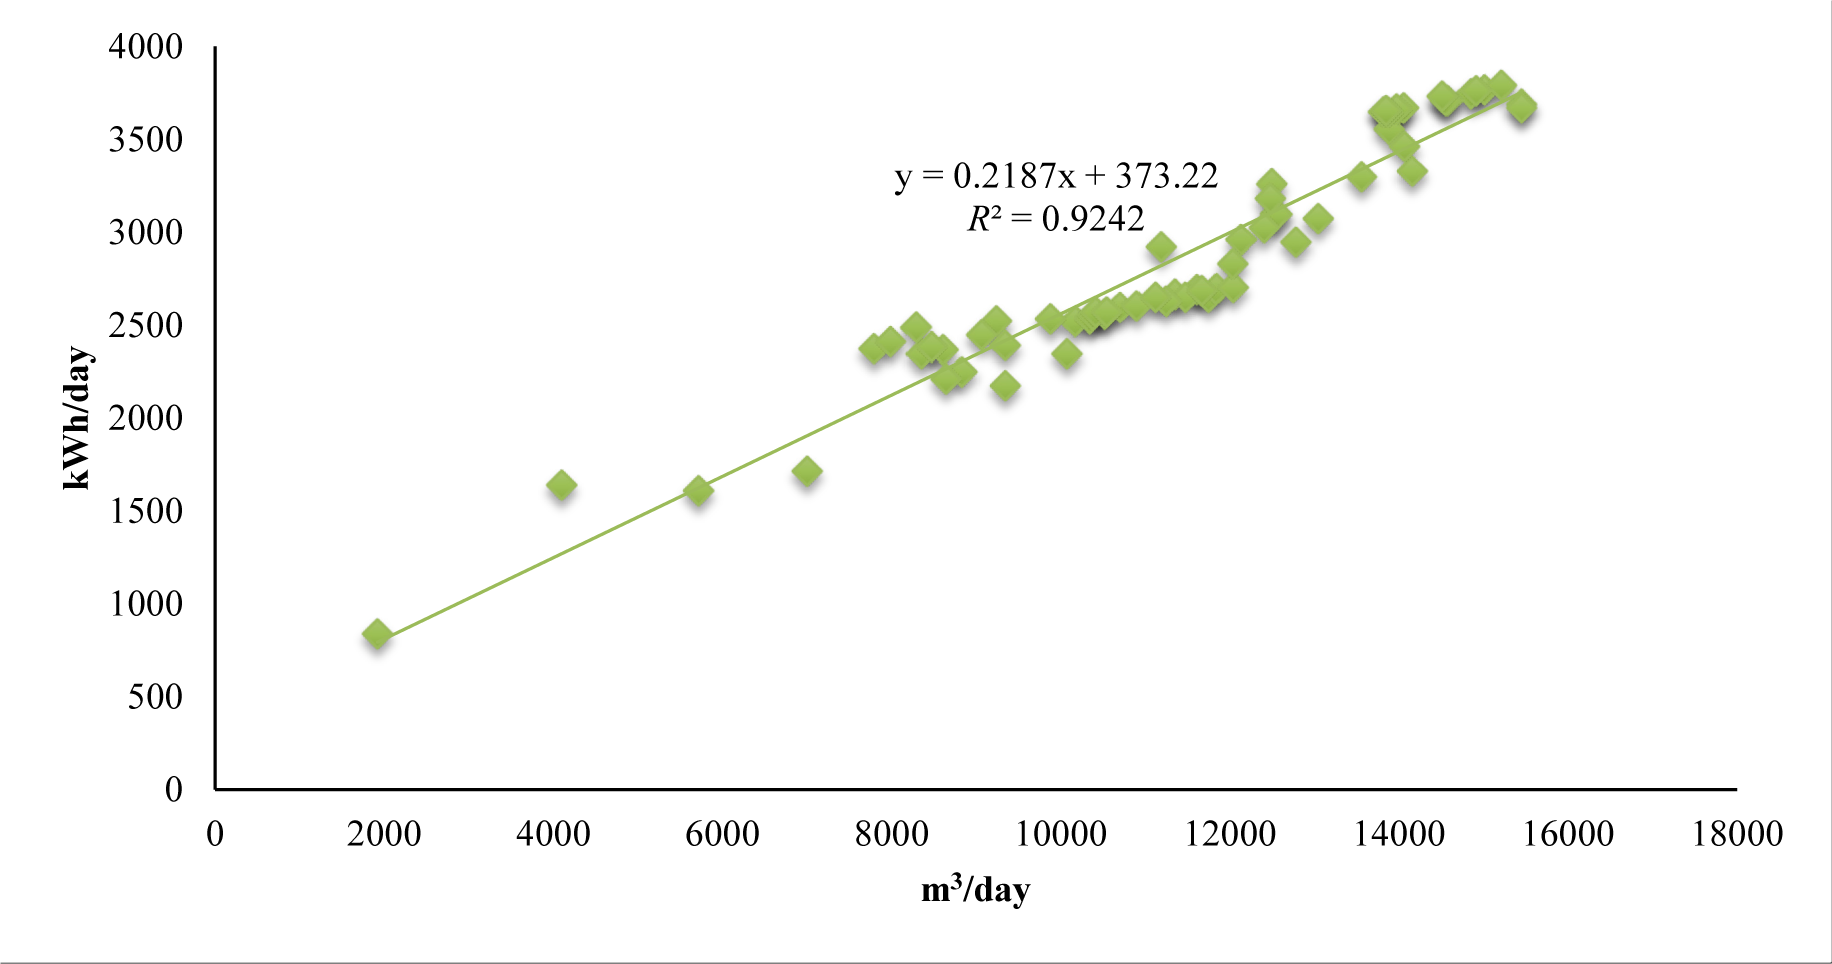
Figure 6 shows the baselines of the system before and after the technological change. The baseline is obtained from the linear fit of the scatter diagram of the cooling tower system's consumption data (in kWh/day) vs. production (in m3/day). This indicator comprises the relationship between the flow rate of the pumping system and energy consumption. The high correlation between these variables (0.9242) and (0.9883) before and after the technological change is the significant relationship between these variables and the validity of the indicator [22].
As shown in Figure 6, when the change is made, the energy performance indicator improves considerably concerning the abovementioned conditions, reflected in the calculated energy savings. A significant result of the new pump-motor systems is that the indicator has less dispersion, which shows that the system has improved considerably, not only in efficiency but also in the quality of operation.
Baseline comparison of the system before and after the technological change
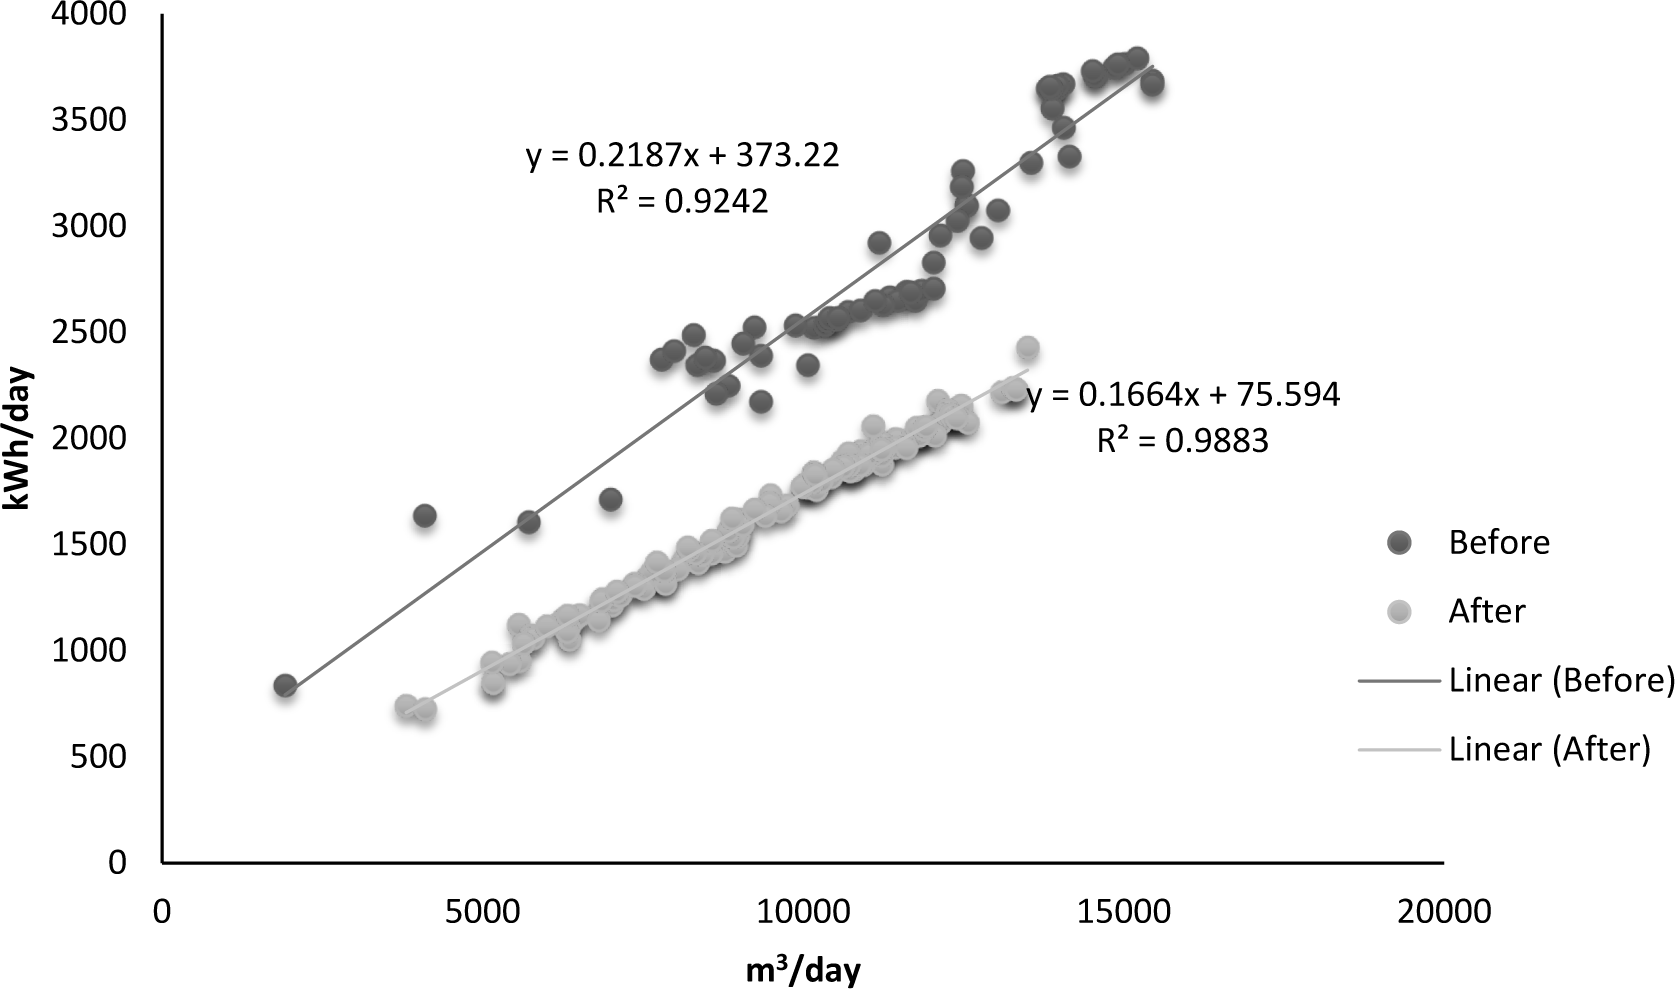
With the new pumping system, energy consumption not associated with production due to cavitation and throttling was minimised due to the flow control strategy by variable speed drive [24]. In the new baseline, the dispersion of points is less, and the energy is used more efficiently, taking better advantage of the work of the pump according to the flow needed for the process.
The performance indicator and the baseline of Figure 6, the energy efficiency of electric motors before and after the technological change, can be evaluated. These tools offer an alternative solution to the difficulty of directly measuring electric motors' mechanical power and efficiency under industrial conditions raised in different studies [17].
The Pareto chart shown in Figure 7 has been constructed. On the x-axis, (M1, M2...M18) represents the motors shown in Table 3. The primary y-axis units indicate the power consumption of each motor. The secondary y-axis units allow the observation of the accumulated power consumption of motors.
Figure 7 shows that the three motors of the clean water basin consume almost 50% of the energy consumed by the plant. These 55 kW (75 HP) equipment pieces were selected for the change for lower power motors, higher efficiency, and speed control utilising variable speed drive.
Pareto diagram of motors before the technological change
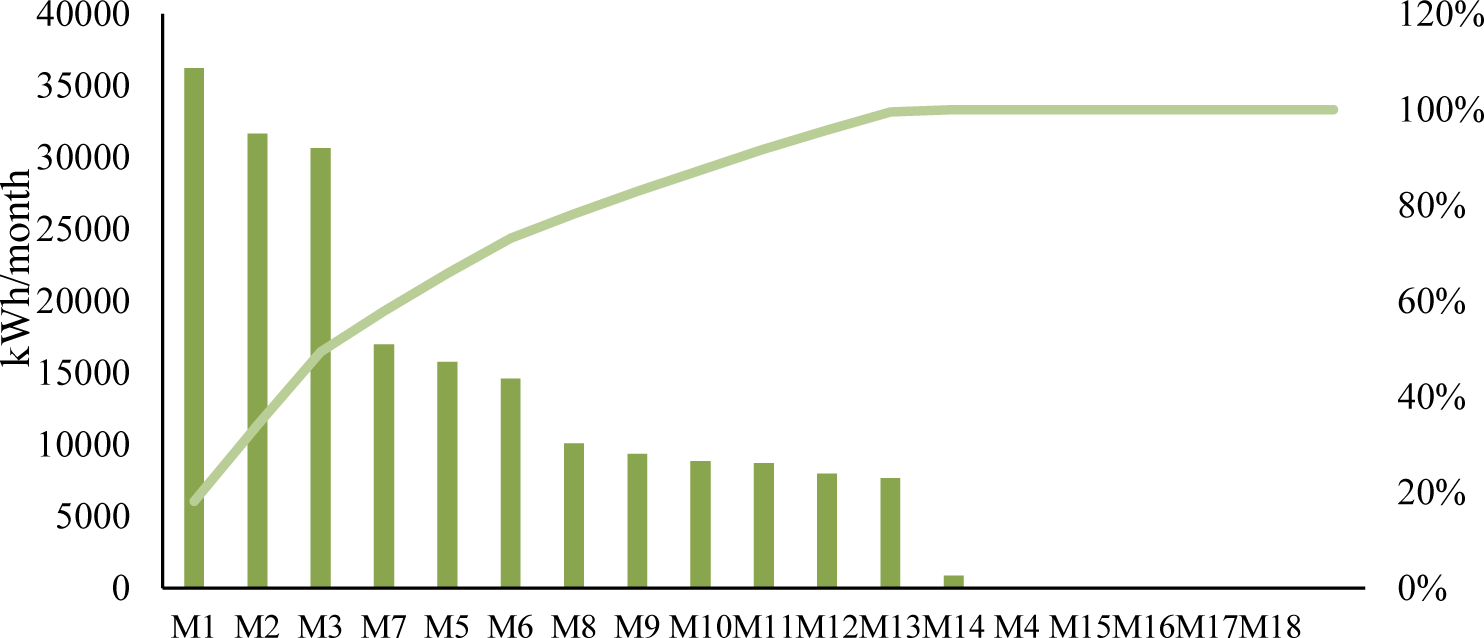
Figure 8 shows that the loads decreased considerably with the change of equipment. Now, five motors consume 55% of the system load, and among them, three of the motors are those of the replaced pump motor assembly.
Pareto diagram of motors after the technological change
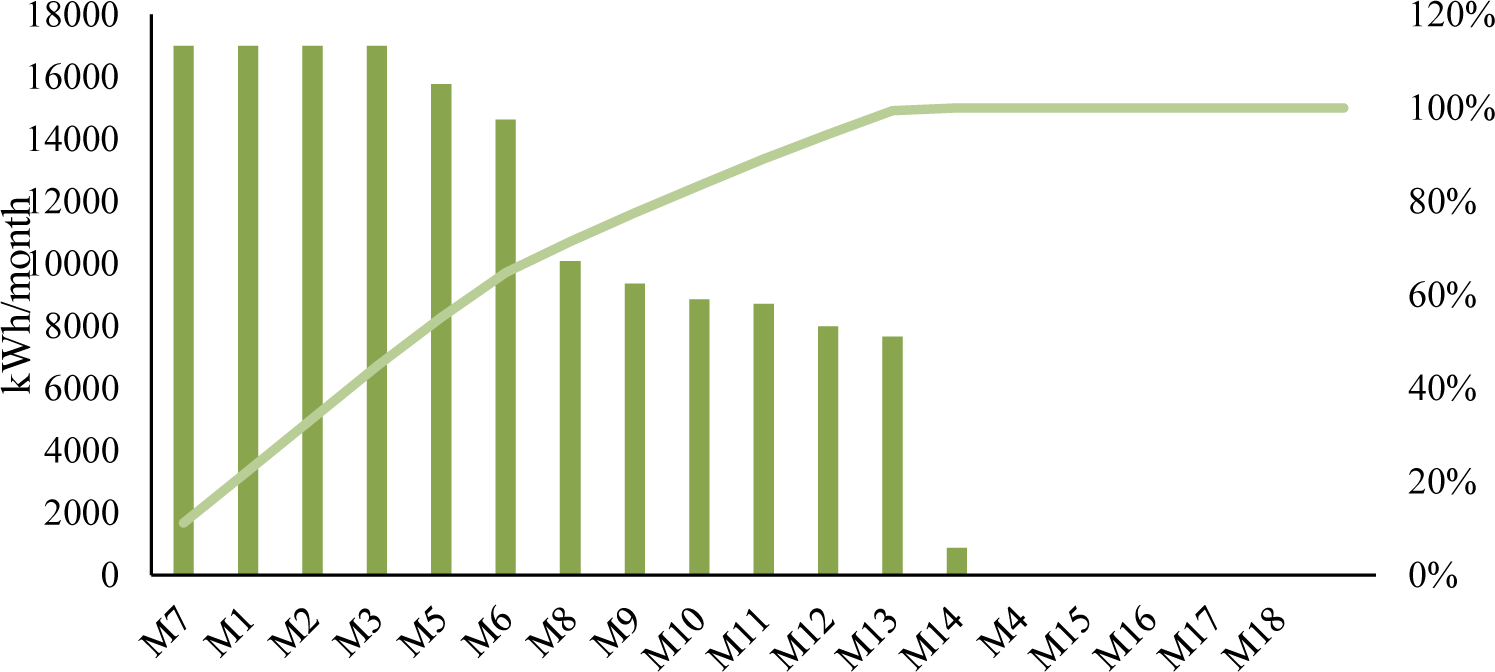
Figure 9 shows the electrical network diagram used to evaluate the technological changes, and Table 5 shows the data of the motors before and after the technological change. This network has a main feeder, the main bus, a transformer, a secondary bus, and 13 motors. The system is used to validate the power flow with all the motors connected in the network and the response of the load to the power quality events.
Electrical network of the industrial plant
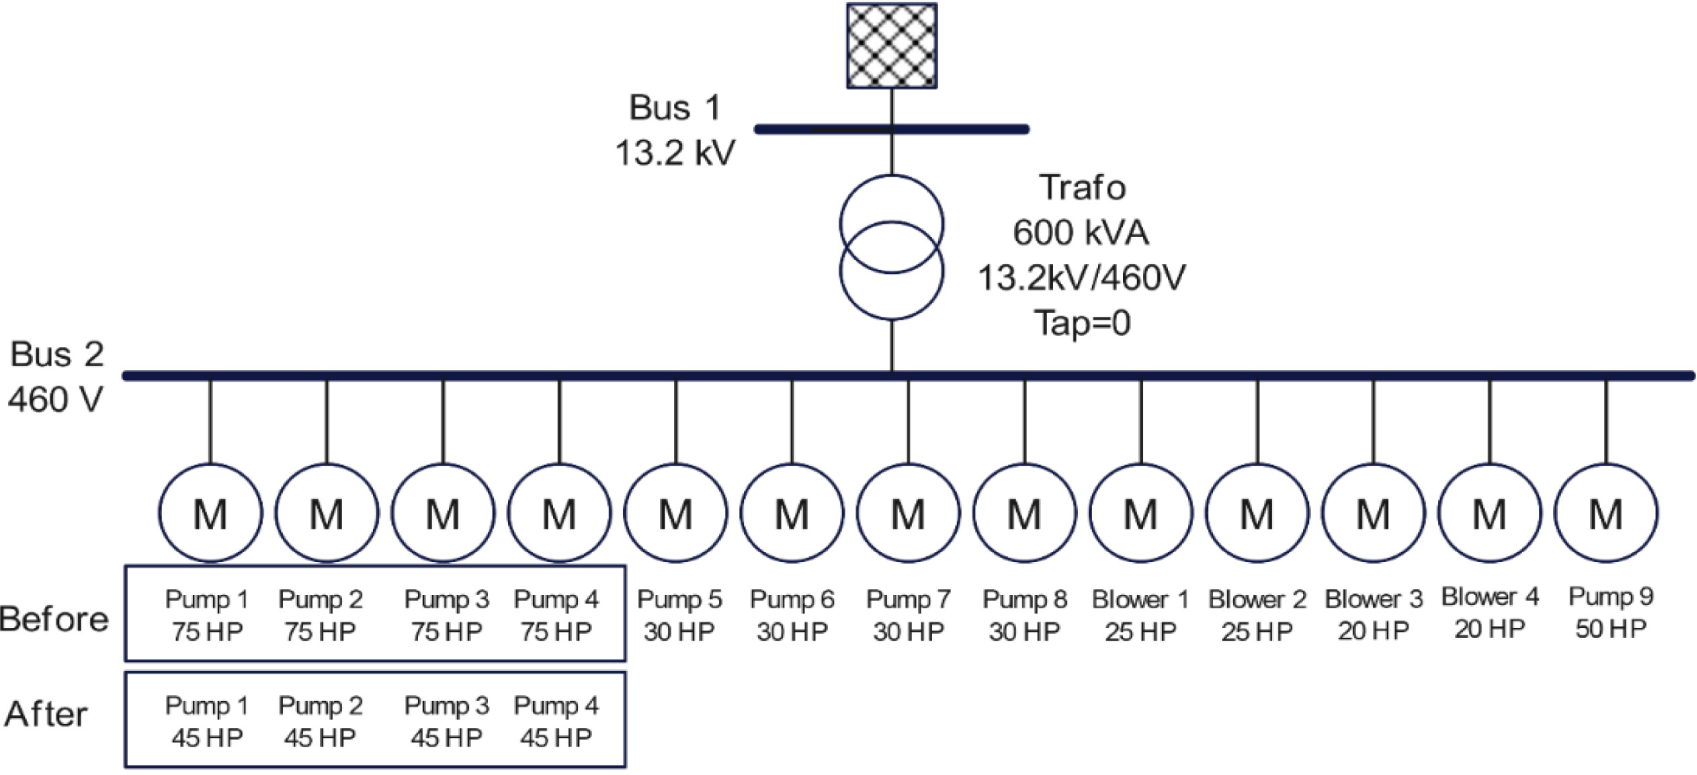
The electrical system of the cooling towers is made up of a 600 kVA transformer, with a primary voltage of 13.2 kV and a secondary voltage of 460 V that feeds an MCC. The MCC comprises a totaliser, 12 electric cells with soft starters, a variable speed drive that controls the glycerin basin pump, and 18 motors with capacities between 7.4 kW and 55.8 kW. Four motors, 55.8 kW driven by soft starters, were changed for the same number of 33.5 kW machines driven by variable speed drives. These drives feature a closed control loop to keep flow and pressure constant at varying speeds.
The installation of new Grundfos brand pumping systems was proposed, with pumps designed to work under the operating conditions of the process, with which greater efficiency is obtained and, therefore, greater energy use. Other motors of the system will be maintained as in the initial configuration.
Table 5 shows the data of the changed motors and those that were maintained. In the simulation, the nameplate data of the equipment (motors and transformers) and the measurements made with the network analyser were used.
Power of replaced and non-replaced motors
| No. | Motor | Before | After | ||
|---|---|---|---|---|---|
| [HP] | [kW] | [HP] | [kW] | ||
| M1 | Pump motor of clean water 1 | 75 | 55.9 | 45 | 33.5 |
| M2 | Pump motor of clean water 2 | 75 | 55.9 | 45 | 33.5 |
| M3 | Pump motor of clean water 3 | 75 | 55.9 | 45 | 33.5 |
| M4 | Pump motor of clean water 4 | 75 | 55.9 | 45 | 33.5 |
| M5 | Pump motor of dirty water 1 | 30 | 22.3 | 30 | 22.3 |
| M6 | Pump motor of dirty water 2 | 30 | 22.3 | 30 | 22.3 |
| M7 | Pump motor of dirty water 3 | 30 | 22.3 | 30 | 22.3 |
| M15 | Pump motor of dirty water4 | 30 | 22.3 | 30 | 22.3 |
| M10 | Blower of clean water 1 | 25 | 18.6 | 25 | 18.6 |
| M11 | Blower of clean water 2 | 25 | 18.6 | 25 | 18.6 |
| M8 | Blower of dirty water 1 | 20 | 14.9 | 20 | 14.9 |
| M9 | Blower of dirty water 2 | 20 | 14.9 | 20 | 14.9 |
| M12 | Pumps of glycerin basin | 50 | 37.2 | 50 | 37.2 |
All the scenarios consider the old and new technologies. The measurement is installed on the buses (Bus 1 and Bus 2) to evaluate the behaviour of the different signals. The software NEPLAN was used to simulate the load flow of the electrical system. The software Power Log Classic was used to analyse data from the network analysers.
Table 6 shows the cooling tower system's power flow results with the currently working motors, four 55 kW motors, four 22 kW motors, two 25 HP motors, two 20 HP motors, and a 50 HP motor. The load flow is simulated with all the motors in operation, resulting in the transformer's installed load capacity of 88%. However, the four pumps of the dirty and clean water basins only work three, and the fourth pump remains in reserve for contingency and maintenance events. Under these conditions, the load factor of the transformers is 72%, and the power factor is 0.846. The reason for this is that the company corrects the plant's power factor on the medium voltage side (13.7 kV), giving less importance to correcting the power factor on the low voltage side.
Results of the power flow before changing the four pumps
| No. | P [kW] | Q [kVar] | I [A] | PF |
|---|---|---|---|---|
| M1 | 58.8 | 36.4 | 84.3 | 0.85 |
| M2 | 58.7 | 36.4 | 84.3 | 0.85 |
| M3 | 58.7 | 36.4 | 84.3 | 0.85 |
| M4 | 58.7 | 36.4 | 84.3 | 0.85 |
| M5 | 24.4 | 13.9 | 34.2 | 0.87 |
| M6 | 24.4 | 13.9 | 34.2 | 0.87 |
| M7 | 24.4 | 13.9 | 34.2 | 0.87 |
| M15 | 24.4 | 13.9 | 34.2 | 0.87 |
| M10 | 19.4 | 11.1 | 27.2 | 0.87 |
| M11 | 19.4 | 11.1 | 27.2 | 0.87 |
| M8 | 16.2 | 12.2 | 24.7 | 0.80 |
| M9 | 16.2 | 12.2 | 24.7 | 0.80 |
| M12 | 41.1 | 30.8 | 62.6 | 0.80 |
Table 7 shows the power flow results of the cooling tower system after the technological change. With variable speed drives, the harmonic measurements are entered for the simulation giving a THDI (total harmonic current distortion) of 11.09% at the common connection point. The transformer was left with an installed load of 78%. The four motors of the new system pumps are highly efficient, starting with a variable speed drive each. Energy measurements were made to determine the harmonic components the variable speed drive injects into the network.
Results of the power flow after the technological change
| No. | P [kW] | Q [kVar] | I [A] | PF |
|---|---|---|---|---|
| M1 | 37.4 | 23.0 | 53.6 | 0.85 |
| M2 | 37.4 | 23.0 | 53.6 | 0.85 |
| M3 | 37.4 | 23.0 | 53.6 | 0.85 |
| M4 | 24.4 | 13.9 | 34.2 | 0.87 |
| M5 | 24.4 | 13.9 | 34.2 | 0.87 |
| M6 | 24.4 | 13.9 | 34.2 | 0.87 |
| M7 | 24.4 | 13.9 | 34.2 | 0.87 |
| M15 | 19.4 | 11.1 | 27.2 | 0.87 |
| M10 | 19.4 | 11.1 | 27.2 | 0.87 |
| M11 | 16.2 | 12.2 | 24.7 | 0.80 |
| M8 | 16.2 | 12.2 | 24.7 | 0.80 |
| M9 | 41.1 | 30.8 | 62.6 | 0.80 |
This section analyses the energy savings obtained with the technological change in the cooling tower pumping system, comparing the data before and after the change. In addition, the baselines in each stage and the system's energy quality parameters are evaluated.
Figure 10 shows the power demand behaviour before and after the technological change, with records every minute during a typical cooling pump system working day.
Active power before and after the technological change
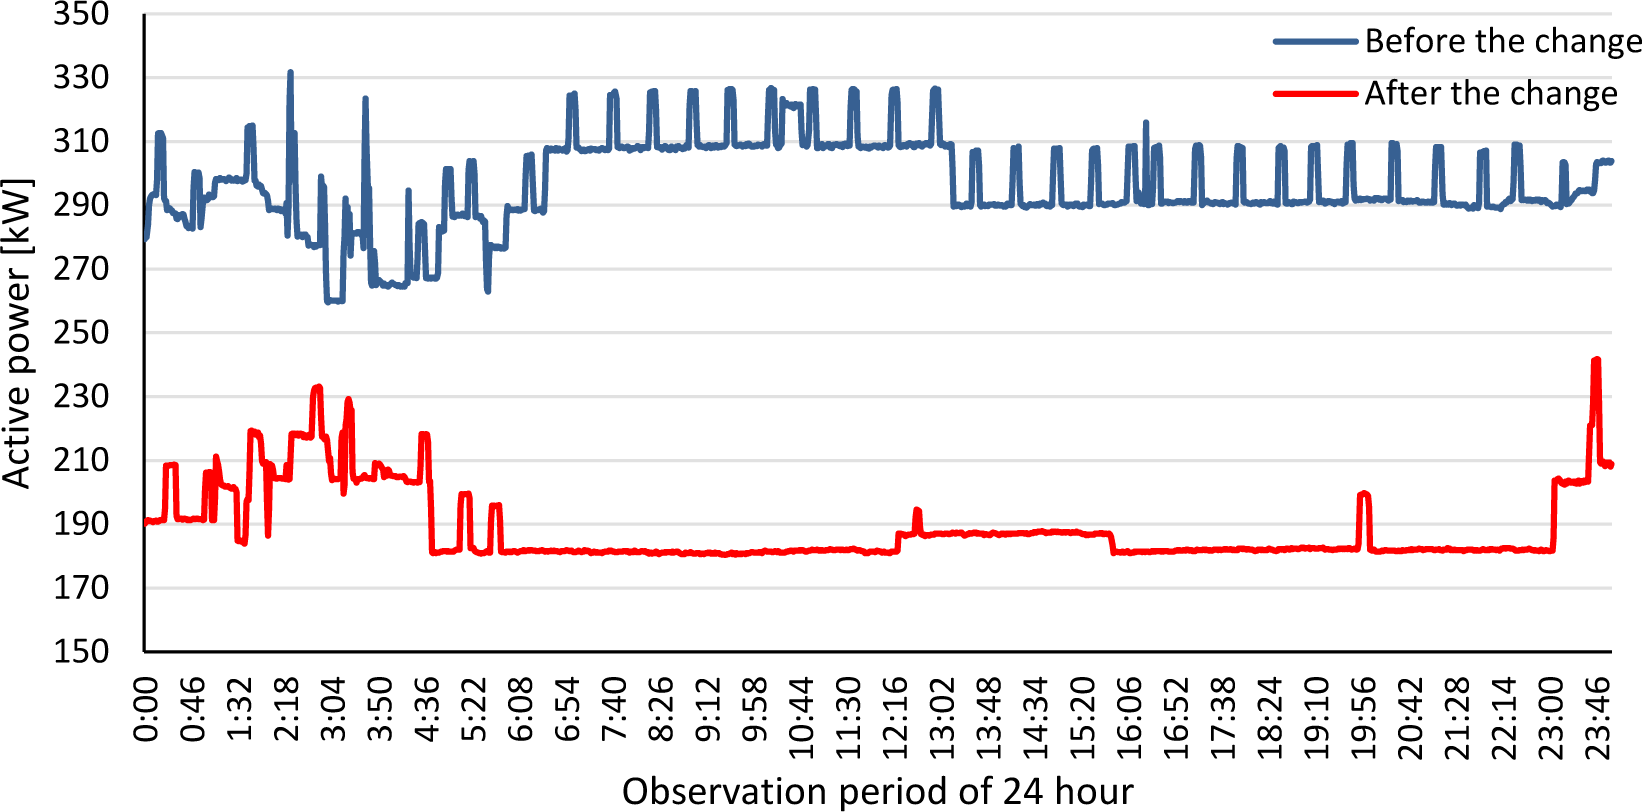
From the behaviour of the curves, the evident reduction in energy consumption can be observed when replacing the motor-pump systems, reflected in the space between both curves. In the upper curve corresponding to the demand before making the change, it is observed that in the first moments, the trend is variable with high peaks due to the continuous start-up of plants while the flow stabilises. When stabilisation is reached, there are peaks of powers associated with cavitation in the pumps, which causes starts for a short period. In the curve corresponding to the demand after the technological change (lower curve), as in the upper curve, the load does not initially stabilise while the plants start up, and the flow stabilises.
Table 8 shows the daily, monthly, and annual energy consumption before and after the technological change and the corresponding energy savings. The energy consumption was calculated from the demand behaviour shown in the previous graph, representing the pumps' typical day of operation in each scenario. The sum of the consumption minute by minute of each one of the systems gives us the daily consumption of that day measured with the estimated operating time of 30 days (720 h/month) and 11 months (7,920 h/year), the monthly consumption is calculated and annually respectively.
In the same way, the monthly and annual energy consumption of the new system was calculated with the measured data when the equipment was working under normal conditions.
Energy saving
| Consumption | Before | After | Savings |
|---|---|---|---|
| [kWh/day] | 7,125 | 4,528 | |
| [kWh/month] | 213,741 | 135,835 | 36% |
| [kWh/year] | 2,351,148 | 1,494,183 |
As shown in Table 8, the change resulted in significant energy savings of 36%. This energy saving is mainly due to the use of variable speed drives, since with the replacement of electric motors, the saving potential is between 0.5 and 2.2% [25], while with variable speed drives, the power saving can be between 20 and 50% depending on the load torque characteristics and speed variation [9], [26].
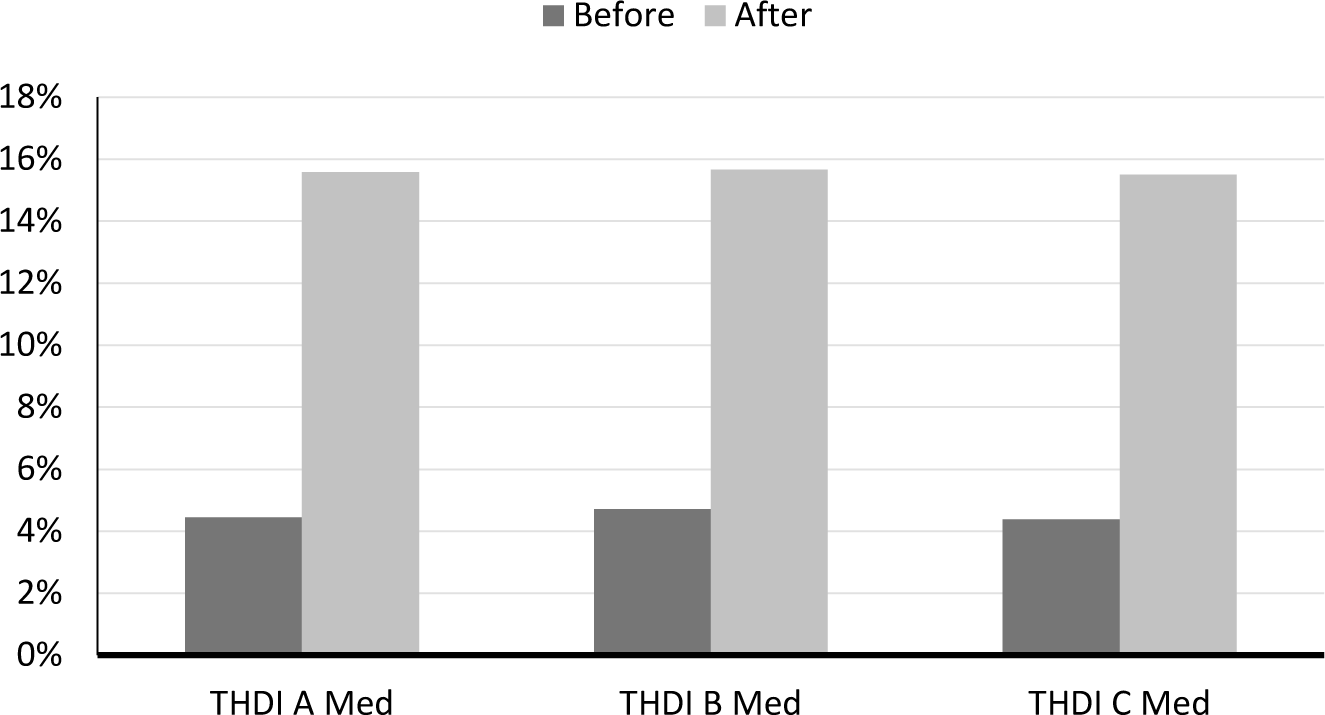
This section compares the behaviour of current harmonics before and after the technological change. Figure 11 shows the average THDI of each phase, while Figure 12 shows the behaviour of individual average current harmonics from the 2nd to the 13th order.
THDI before and after the technological change
Individual harmonics before and after the technological change
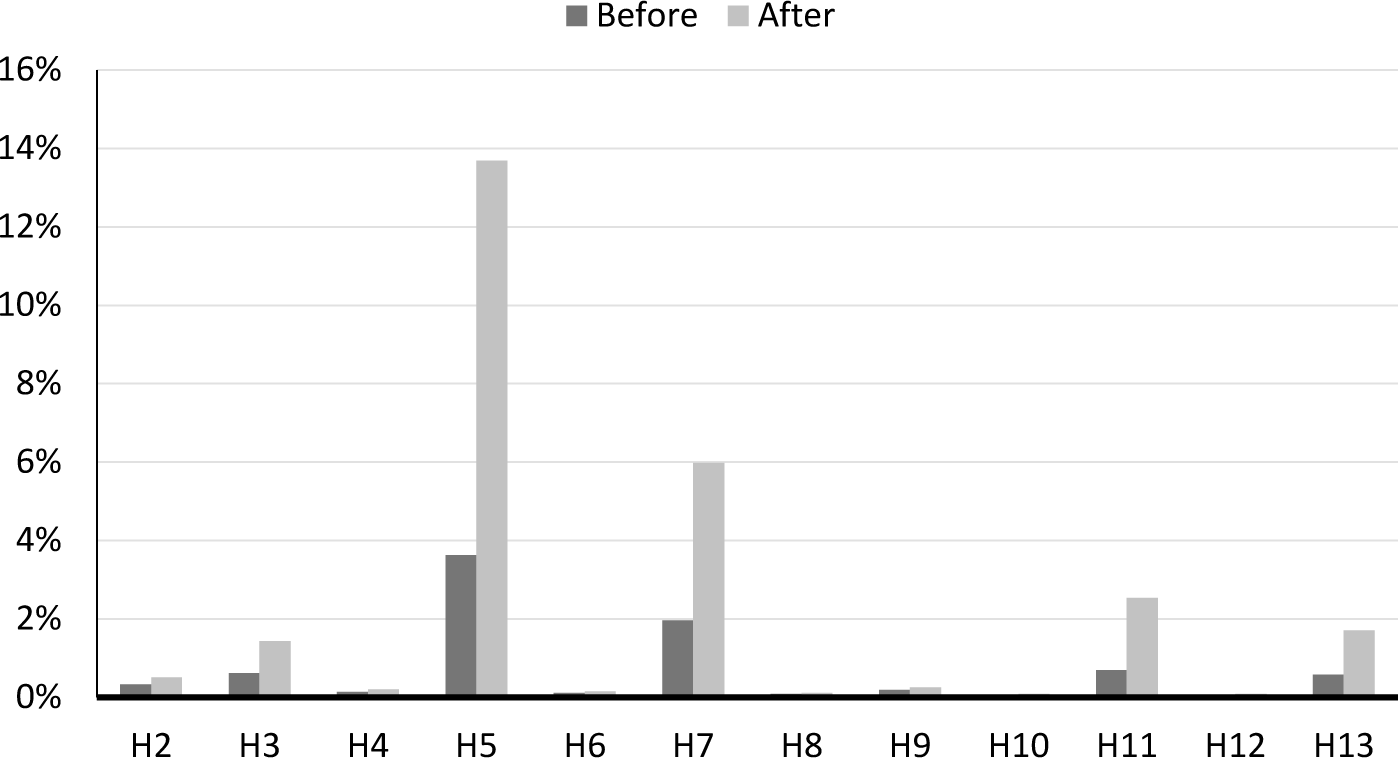
According to Figure 11 and Figure 12, the total and individual harmonics increased significantly by including the variable speed drive. It shows that although the change brought benefits in energy savings, it caused a deterioration in the power quality of the electrical system. This aspect should have been considered when planning the inclusion of variable speed drives.
Concerning the individual harmonics, there is a predominance of harmonics of the fifth, seventh, and eleventh order, the product of the characteristics of the six-pulse variable speed drive [27]. The 5th- and 11th-order harmonics are negative sequence harmonics, which generate a torque opposite to the rotation of the motor, causing torque pulsations, motor vibrations, etc. Also, the 7th-order harmonics is a positive sequence, generating torque in the same direction as the motor. In both cases (positive and negative harmonic sequences), additional currents are generated, which increase both the losses, such as energy consumption [28].
Considering that studies show that current harmonics can produce losses of up to 4% [29], these results show the need to install harmonic filters to mitigate the unwanted effects of these phenomena.
Electric motors are one of the main energy consumers in the industrial sector since they represent between 60 and 70% of the energy consumption in this sector, and they are also one of the consumers that present the greatest savings potential with a range between 20 and 30%. Despite the opportunity that companies in the industrial sector must improve their energy performance by increasing the energy efficiency of electric motors, there is currently a limitation to measuring the mechanical power and efficiency of this equipment in industrial conditions, which makes it difficult to assess the real impact of energy improvement measures.
This work proposes a methodology based on the ISO-50001 standard to solve the problem. It allows evaluation of the energy impact of energy-saving measures in a pumping system of an industrial cooling tower. The improvement consisted of replacing standard efficiency motors with higher efficiency motors with variable speed drives. In the methodology, an energy performance indicator is used as the main tool, which, together with two baselines, allows the quantification of energy savings in industrial conditions. The indicator is obtained from easily accessible data such as energy consumption and water flow. Therefore, it is not necessary to make expensive and invasive interventions to measure electric motors' mechanical power and efficiency.
The methodology was validated, demonstrating its applicability in similar cases (industrial cooling tower pumping systems), verifying that with the replacement of the motors and the variable speed drives, a saving of 36% was obtained in energy consumption. It was also possible to verify that the variable speed drives, because they have six pulses, generated an increase of 10% in the total current harmonics and an increase in the individual harmonics of the 5th and 7th order of 10% and 4%, respectively. Therefore, if this equipment is installed, including harmonic filters or using variable speed drives greater than 12 pulses must be considered.
In future research, new methodologies should continue to be developed with energy performance indicators that evaluate the system's operation with electric motors in different industrial applications in real time. Tools such as demand response programs and artificial intelligence must also be integrated to optimise the diagnosis of energy efficiency problems and decision-making for their solution.
The authors thank GRACETALES LTDA for allowing us to perform the study. The authors thank the Universidad de la Costa for supporting the investigation project. John E. Candelo-Becerra thanks the Universidad Nacional de Colombia, Sede Medellín, for the time provided to perform this research.
- World Energy Outlook 2022, 2022, https://www.iea.org/reports/world-energy-outlook-2022
- ,
Techno-economic-environmental impacts of industrial energy assessment: Sustainable industrial motor systems of small and medium-sized enterprises ,Sustainable Energy Technologies and Assessments , Vol. 49 ,pp 101694 , 20212022, https://doi.org/https://doi.org/10.1016/j.seta.2021.101694 - ,
Hybrid building performance simulation models for industrial energy efficiency applications ,Journal of Sustainable Development of Energy, Water and Environment Systems , Vol. 6 (2), 2018, https://doi.org/https://doi.org/10.13044/j.sdewes.d6.0194 - ,
Energy efficiency and sustainable development goals (SDGs) ,Energy , Vol. 239 ,pp 122365 , 2022, https://doi.org/https://doi.org/10.1016/j.energy.2021.122365 - Energy Production & Changing Energy Sources, 2019, https://ourworldindata.org/energy
- , Ley 697 del 2001, 2001
- , Ley 2099 de 2021-ley de transición energética, 2021
- , Large-Scale Downsizing of Induction Motors Requiring Stator Rewinding as a Low-Cost Strategy to Save Energy and Extend Motors Lifetime, Inter. Conf. on Energy Efficiency in Motor Driven Systems (EEMODS”09), 2009
- ,
Techno-economic analysis of energy efficiency improvement in electric motor driven systems in Swiss industry ,Appl Energy , Vol. 205 ,pp 85–104 , 2017, https://doi.org/https://doi.org/10.1016/j.apenergy.2017.07.121 - ,
New technology trends and policy needs in energy efficient motor systems - A major opportunity for energy and carbon savings ,Renewable and Sustainable Energy Reviews , Vol. 115 ,pp 109384 , 2019, https://doi.org/https://doi.org/10.1016/j.rser.2019.109384 - ,
Technical and Economical Considerations on Super High-Efficiency Three-Phase Motor ,IEEE Trans Ind Appl , Vol. 50 (2),pp 1274–1285 , 2014, https://doi.org/https://doi.org/10.1109/TIA.2013.2272548 - ,
Assessment of Multi-Phase Conversion and Modified PWM Strategy for Power Converters of Medium-Voltage Induction Motors Drive ,IEEE Trans Ind Appl ,pp 1–12 , 2023, https://doi.org/https://doi.org/10.1109/TIA.2023.3238003 - ,
Reducing Energy Costs in Electric-Motor-Driven Systems: Savings Through Output Power Reduction and Energy Regeneration ,IEEE Industry Applications Magazine , Vol. 24 (1),pp 84–97 , 2018, https://doi.org/https://doi.org/10.1109/MIAS.2016.2600685 - ,
, pp 1–90 , 2016, https://doi.org/https://doi.org/10.1109/IEEESTD.2016.7378244, IEEE Std 1068-2015 (Revision of IEEE Std 1068-2009) - ,
Effect of blade number on the performance of centrifugal fan ,Mater Today Proc , Vol. 72 ,pp 1143–1152 , 2023, https://doi.org/https://doi.org/10.1016/j.matpr.2022.09.185 - ,
Perspectives on Electric Motor Market Transformation for a Net Zero Carbon Economy ,Energies (Basel) , Vol. 16 (3),pp 1248 , 2023, https://doi.org/https://doi.org/10.3390/en16031248 - ,
Assessment of the energy efficiency estimation methods on induction motors considering real-time monitoring ,Measurement , Vol. 136 ,pp 237–247 , 2019, https://doi.org/https://doi.org/10.1016/j.measurement.2018.12.080 - ,
Considerations for Nonintrusive Efficiency Estimation of Inverter-Fed Induction Motors ,IEEE Transactions on Industrial Electronics , Vol. 63 (2),pp 741–749 , 2016, https://doi.org/https://doi.org/10.1109/TIE.2015.2477801 - , 2011, https://www.iso.org/standard/51297.html
- ,
The State of the Art in Model Predictive Control Application for Demand Response ,Journal of Sustainable Development of Energy, Water and Environment Systems , Vol. 10 (3), 2022, https://doi.org/https://doi.org/10.13044/j.sdewes.d9.0401 - ,
ISO 50006 - Energy Management Systems e Measuring Energy Performance Using Energy Baselines (EnB) and Energy Performance Indicators (EnPI) e General Principles and Guidance , 2014 - ,
Tools to improve forecasting and control of the electricity consumption in hotels ,J Clean Prod , Vol. 137 ,pp 803–812 , 2016, https://doi.org/https://doi.org/10.1016/j.jclepro.2016.07.192 - ,
Electricity management in the production of lead-acid batteries: The industrial case of a production plant in Colombia ,J Clean Prod , Vol. 198 ,pp 1443–1458 , 2018, https://doi.org/https://doi.org/10.1016/j.jclepro.2018.07.105 - ,
Small and Mid-Size Pump-Turbines with Variable Speed ,Energy Power Eng , Vol. 05 (02), 2013, https://doi.org/https://doi.org/10.4236/epe.2013.52a007 - ,
IEC 60034-30-1:2014 Rotating Electrical Machines: Efficiency Classes of Line Operated AC Motors ,pp 50 , 2014 - ,
Energy conservation using VFD ,International Conference on Energy Systems and Applications ,pp 531–536 , 2015, https://doi.org/https://doi.org/10.1109/ICESA.2015.7503406 - ,
Technical and Economical Considerations in the Application of Variable-Speed Drives With Electric Motor Systems ,IEEE Trans Ind Appl , Vol. 41 (1),pp 188–199 , 2005, https://doi.org/https://doi.org/10.1109/TIA.2004.841022 - ,
Electric Power Quality ,Power Systems , 2011, https://doi.org/https://doi.org/10.1007/978-94-007-0635-4 - ,
Voltage Harmonic Impacts on Electric Motors: A Comparison between IE2, IE3 and IE4 Induction Motor Classes ,Energies (Basel) , Vol. 13 (13),pp 3333 , 2020, https://doi.org/https://doi.org/10.3390/en13133333