


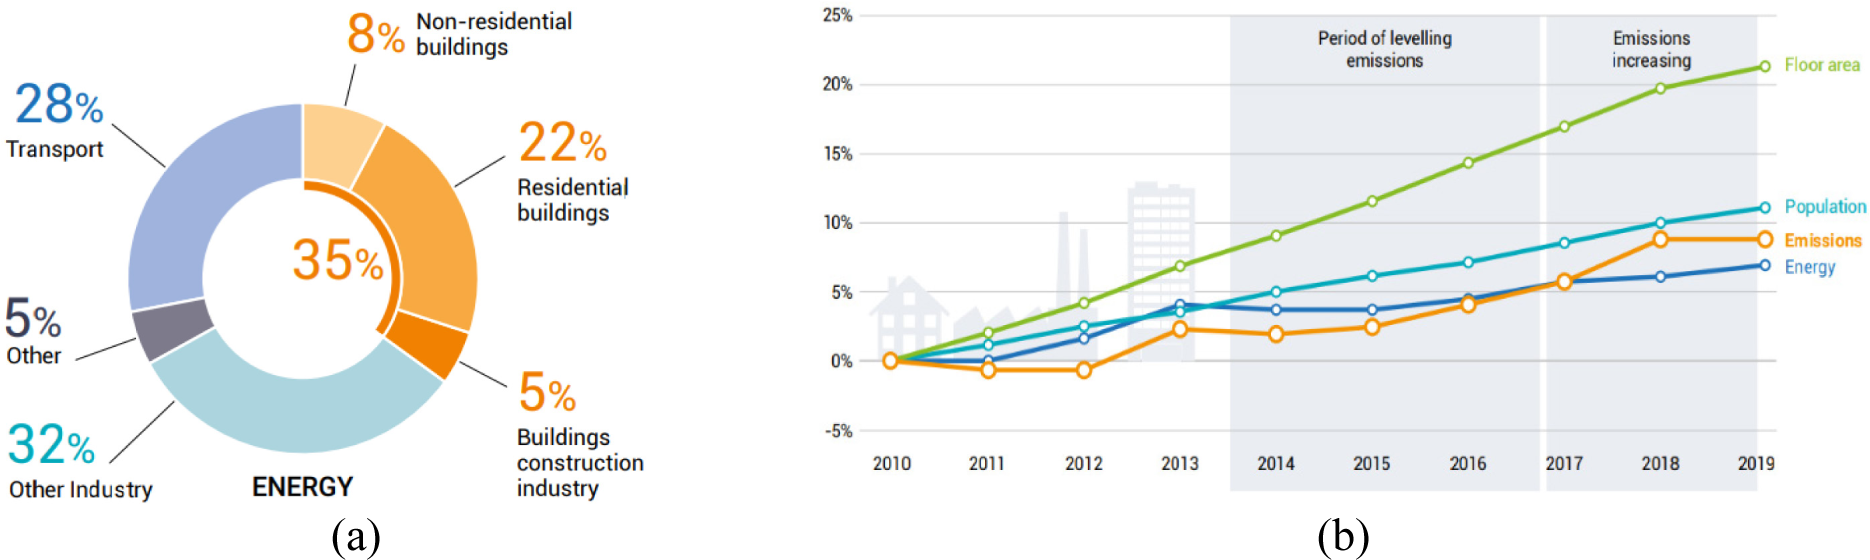
The global electricity system is growing with more sustainable renewable options developing as the market segment continues to grow. Industry, transport, and residential and commercial buildings account for 25.97% of the overall energy consumed in Malaysia, comparable to statistics from the Organization of Economic Co-operation and Development countries [1]. In comparison, household consumers account for more than 39% of energy demand in some countries, and consumer electronics may affect the efficiency of the overall energy [2]. Power usage in building operations accounts for roughly 55% of total worldwide electricity consumption, as seen in Figure 1. This highlights the need of developing a plan to aggressively decrease energy demand in the built environment, as well as adopting materials solutions that minimize lifetime carbon emissions, which, when combined, will reduce both energy demand and emissions in the built environment [3].
The global consumption in several buildings: (a) The global proportion of final energy and emissions from buildings and construction, 2019; (b) Changes in worldwide drivers of trends in building energy and emissions from 2010 to 2019 [3]–[5]
The answer to this wastage is energy efficiency (EE). EE policies have the potential to provide substantial benefits to both suppliers and consumers, as well as to society, the environment, and the economy as a whole. Concern to improve EE thus led to the development of numerous innovative technologies, such as energy management linked to the control of peak energy demand, better utilization of household appliances, and the creation of more efficient home equipment [6]. Thus, demand response (DR) is regarded as a cost-effective strategy for demand reduction and auxiliary services as compared to traditional and expensive strategies to increase generating capacity or network expansion [7].
In general, load monitoring (LM) refers to the process of recognizing and getting the load measurement in a power distribution system. The energy consumption and the state of the various loads in the system will be determined by these load readings [8]. Two approaches can be identified for the real-time monitoring of electric energy consumption. The first is referred to as Intrusive Load Monitoring (ILM), while the second is referred to as Non-Intrusive Load Monitoring (NILM) [9].
A quarter-century ago, Hart introduced the first algorithm for disaggregating household energy use and energy efficiency improvement techniques, launching the area of NILM into existence [10]. However, because most of the research published before 2011 was conducted using either lab-based or simulated data, hence the efficiency of disaggregation algorithms in the real-world application was unknown [11]. Thus, the use of NILM in residential and manufacturing building energy monitoring remains a significant challenge due to the high level of complexity and limited computational capacity of the technology [12]. As a result, the majority of NILM research has concentrated on residential domains, whereas NILM for larger load centres such as substations has received less attention. Larger load centres are complex systems with unique problems like heterogeneity and highly varied load compositions, and several approaches evolved for residential have limited uses in this environment [13].
Within load monitoring strategies, the NILM approach has been relevant due to its cost-effectiveness and ease of installation and replacement. NILM measures the power service entrance of an electrical circuit via a smart meter to disaggregate equipment-level data [14], [15]. NILM has drawn wide interest with the invention of new equipment and software to reduce cost and increase accuracy. Recently developed methods concentrated on the suitable application of artificial intelligence for home and industrial energy system solutions, demand control, and identification of appliances [16]. NILM involves processes such as data collection, feature extraction, event detection, and load identification.
NILM can be used to deduce the running events of single appliances based upon a smart meter or power meter from the electrical measurement data. The problem of disaggregation is formulated mathematically. Assume the energy consumption aggregation sequence of N active appliance at . The role of the NILM algorithm is to deduce the power performance of device at time t [17]:,
(1)
where is a boolean variable that symbolizes the status operation of appliance i, since σ(t) symbolizes the noise of measurement and any unenumerated contribution of appliances.
The main contributions of this article are to provide an overview of NILM's implementation, addressing the stages of NILM and advancements in the field. The overview explores the various techniques, methodologies, and algorithms employed in NILM systems to achieve load identification and energy disaggregation. Moreover, the limitations, applications, and recommended criteria for the implementation of NILM are highlighted as a contribution to the field of load disaggregation. The outline of this review is organized as follows: the purpose and benefits of load monitoring are discussed in section 2; section 3 discusses different types of loads. Section 4 presents the types of buildings and the type of loads used for the buildings. Section 5 reviews performance evaluation. Section 6 reviews and discusses the framework of NILM. The potential applications of NILM are demonstrated in section 7 while Section 8 proposes the recommended implementation of the NILM system. Section 9 features the limitations of NILM and finally Section 10 consists of the concluding remarks.
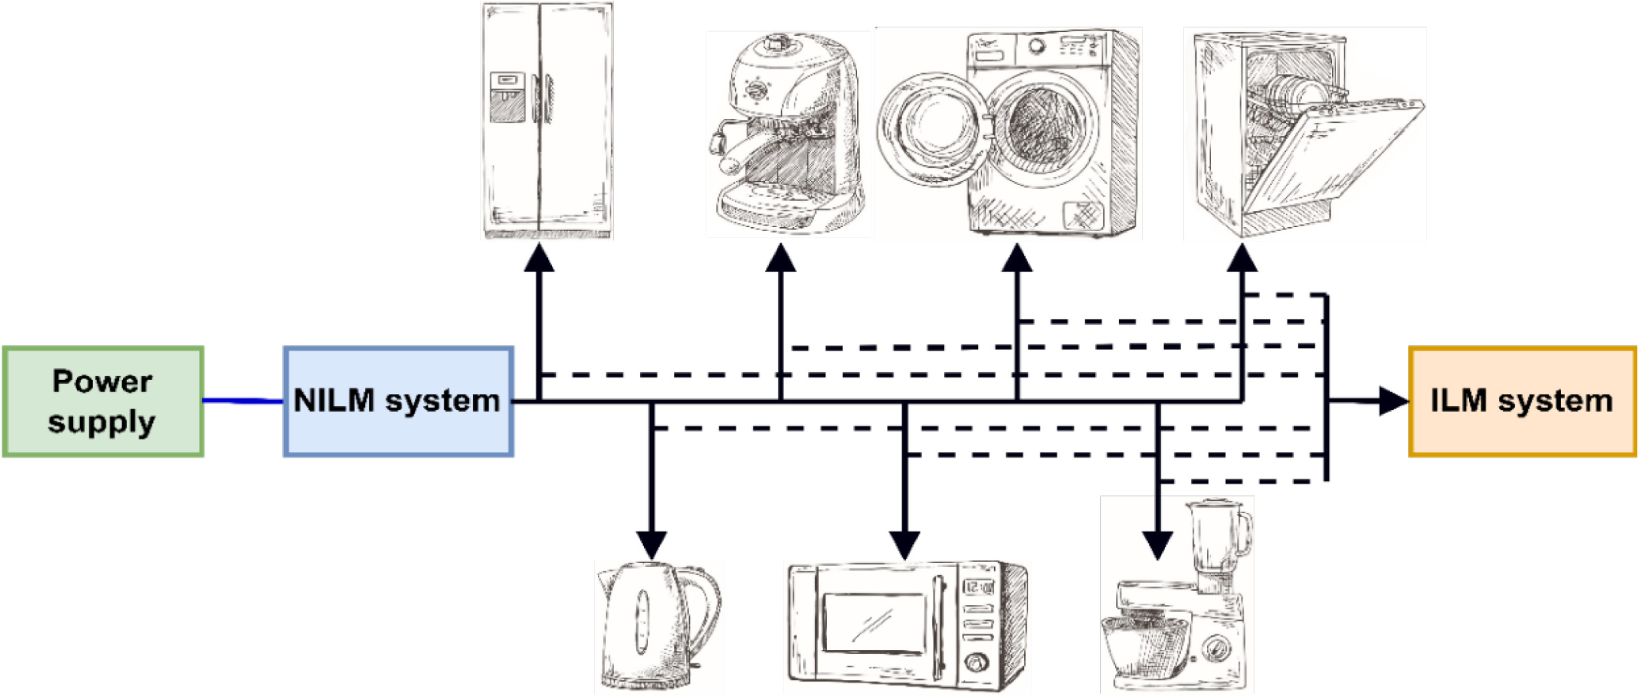
Researchers have categorized LM into two techniques, namely ILM and NILM. The difference between ILM and NILM is depicted in Figure 2. With the former referring to distributed sensing (i.e., monitoring each appliance) and the latter referring to single-point sensing (i.e., monitoring at a single point, commonly at the incoming point).
ILM also known as component-based load monitoring, is a technique that works by monitoring and collecting energy usage data from each appliance or device individually. The installation of separate load monitoring equipment is thus required by ILM [14]. The ILM approach, when compared to the NILM method, is more precise in monitoring appliance-specific energy usage. The drawbacks include significant costs, numerous sensor setups, and installation difficulty, which favours the usage of NILM, especially for large-scale installations [8].
NILM technology utilizes disaggregation algorithms instead of sensor networks by installing an outdoor smart meter, which is simpler, cheaper, and more reliable [18]. The feature extraction stage is concerned with extracting relevant features from energy consumption signals to aid in representing appliances from the same group with similar signatures while distinguishing between power signals from various categories of appliances. Features are characteristics of the signal that are unique for each load. For example, features for power consumption signal from one load is significantly different from features for power consumption signal from another load that is connected to the same source. Since they are unique, features can be used to distinguish between these two loads. On the other hand, the load identification stage is primarily used to train classifiers that will be used to detect appliances and extract appliance-level power signatures [19]. In comparison to intrusive monitoring systems, the NILM system is superior since it does not measure energy measure energy usage from each appliance. This eliminates the need to install any additional instruments, thereby the overall cost of sensors and installations is lower. Appliances may be monitored in real-time for energy usage, which can be utilized to plan for a more efficient operation of the load [20]. Furthermore, the possible applications of residential load monitoring NILM-based on four major categories include energy use feedback, DR, load forecasting, and home automation [21]. However, the majority of applications prioritises residential buildings more than commercial buildings which will be justified in section 4.
The difference between the NILM system and ILM system
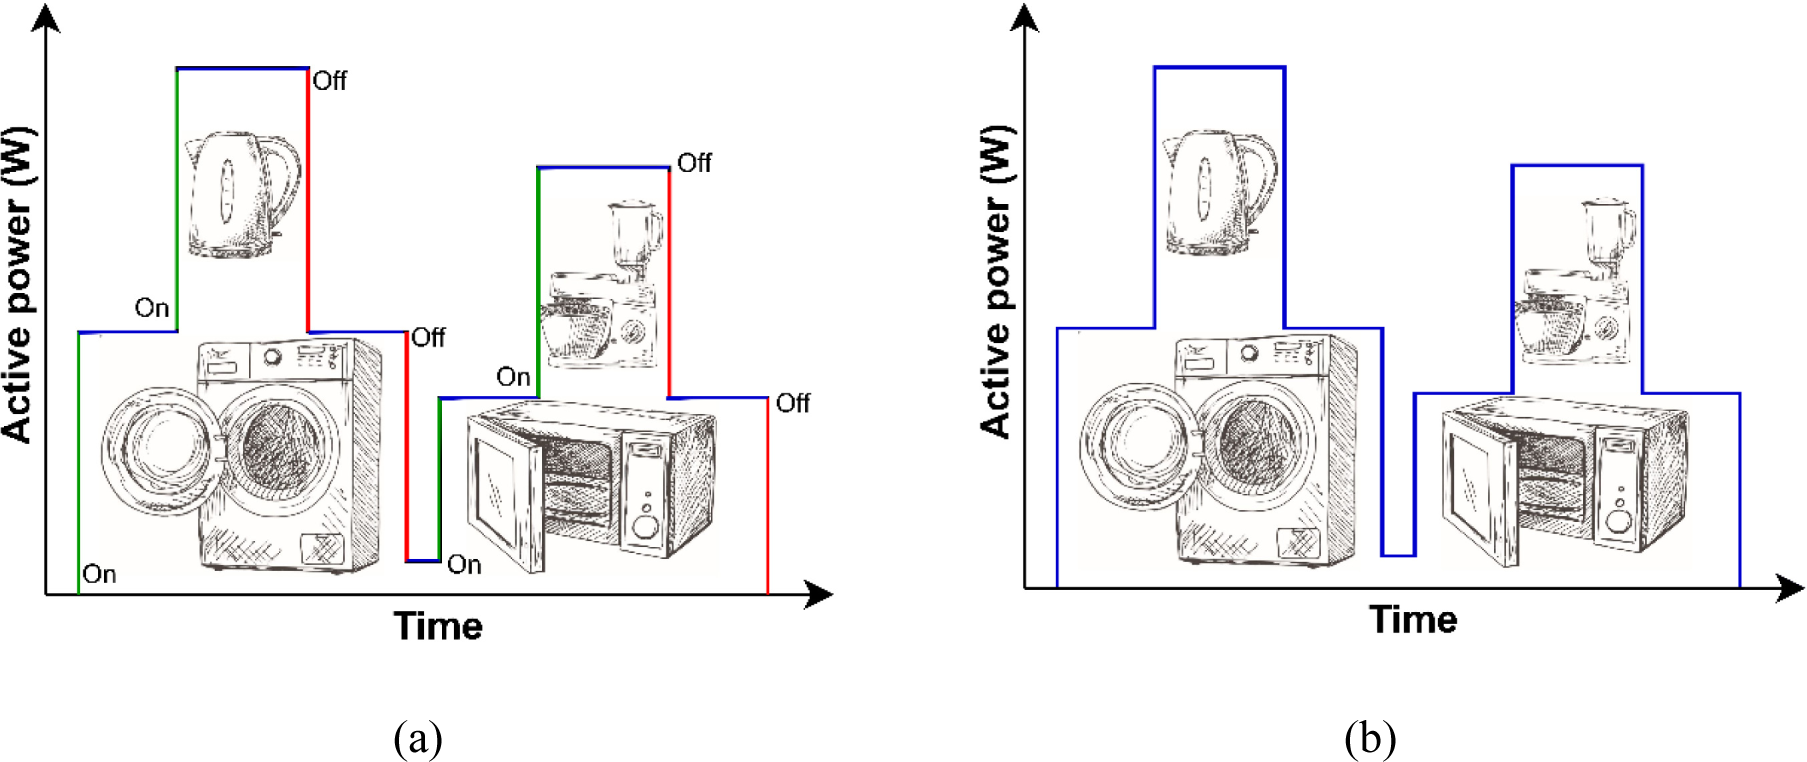
Appliances have varying operational modes and power consumption patterns. There are four categories of appliances, each with a distinct operational state, that are often used to depict and characterize appliances in a scientific study. As may be seen in Figure 3, several appliance states are depicted graphically as having on/off state, multi-state, infinite-state, and permanent-state.
Types of appliances
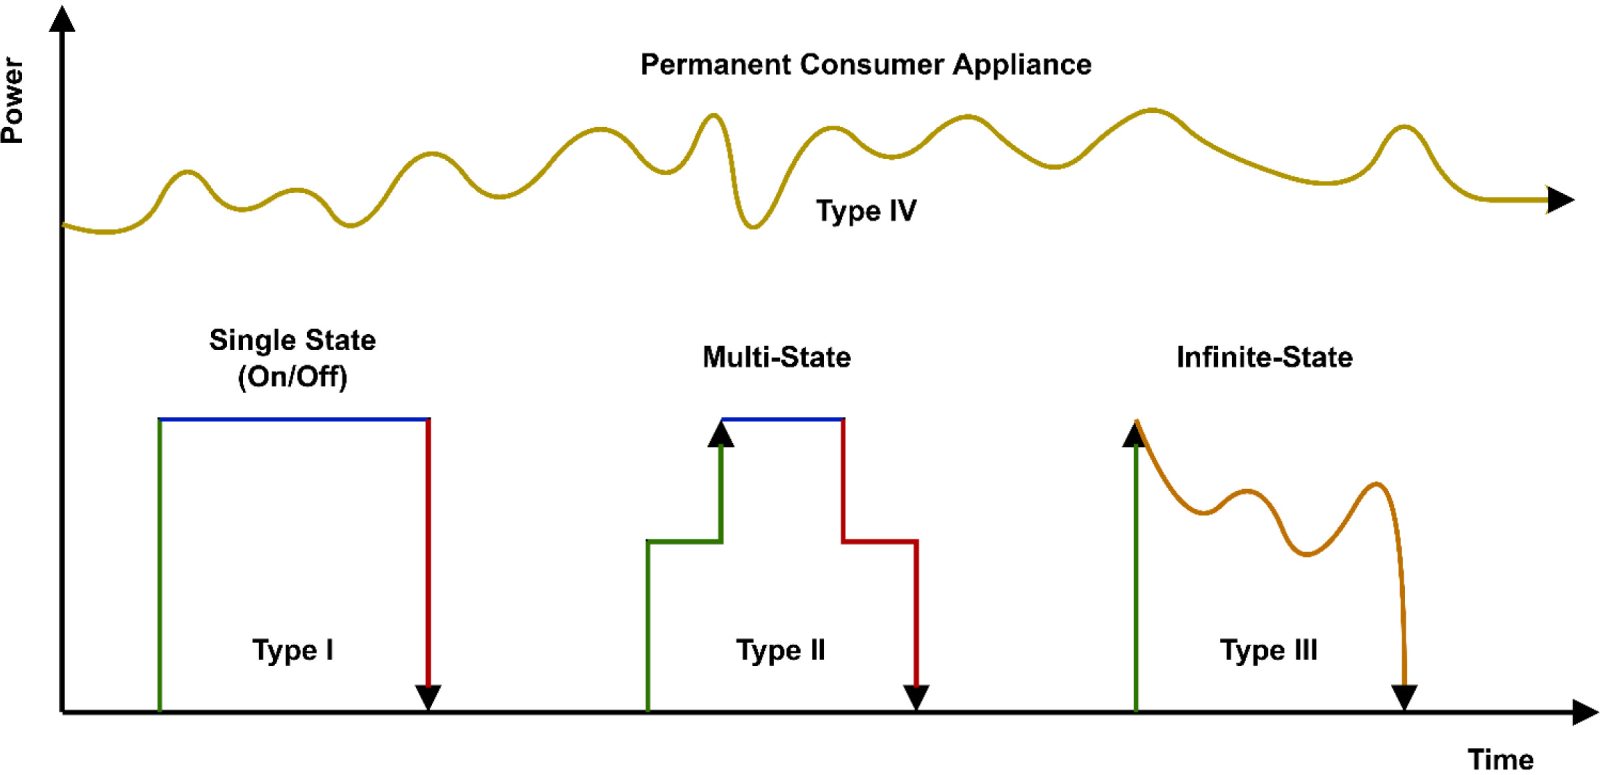
Type I appliances are those that can either be turned on/off (two-state). This category contains ordinary domestic equipment such as a light bulb or toaster. Generally, resistive loads such as those found in appliances require just a single specified quantity of power when active. On/off appliances are purely resistive in their operations. Loads having a tiny reactive portion are expected to be linear in operation. The concept that electric power is additive is a well-known fact. When describing a collection of two-state appliances, this characteristic is taken advantage of in the NILM model [22].
A type II appliance is a multi-state appliance having a limited number of working states known as a Finite State Machine (FSM). Consumer loads that fall within this category include washing machines, stove burners, refrigerators, induction motors, and other similar items. In addition, the switching pattern of these appliances is repetitive, which makes it easier for the disaggregation algorithm to determine the appliances' mode of operation [23].
Type III appliances are those that operate in an infinite state of recurrence. To illustrate, the power consumption of light-dimmers fluctuates constantly rather than in a predictable step shift over time. Consequently, the NILM algorithms have a difficult time disaggregating this sort of device from the aggregated load data that are collected. The dimmer lights, power drill, and chiller are examples of Type III appliances [22], [23].
In the Type IV category are the appliances that run continuously 24 hours a day. Cable television (TV) receivers, alarm systems, and portable power supplies are all examples of Type IV devices. So, the NILM system must be capable of discriminating between the events of various types of appliances whether they are run concurrently or separately at various time intervals. The extraction of features from the raw signals recorded during the transient and steady-state operation of the appliances would aid in the precise detection of the occurrences [24]. Some writers classify appliances such as refrigerators and TVs as continuous appliances, however these devices have a variety of operating states and belong to the multi-state category of loads [14].
Reduced energy use in residential and commercial buildings is a crucial step toward greater energy efficiency [25]. Because of the increasing use of switching power supply, NILM analysis in both residential and commercial buildings is complicated by the interaction between devices and measurement systems [26]. The applications of both buildings are divided into two sections namely offline and online (real-time) applications. Offline applications look at the complete dataset at once and back in time to determine when the change happened. Online applications operate continuously with the process being monitored, analysing each data point as it becomes available with the objective of identifying a change point as soon as possible after it happens, preferably before the next data point arrives [27].
Commercial buildings have a greater potential for developing high-quality power predictions than homes since they have more recurring demands due to the split between working and non-working hours that they operate under. Furthermore, commercial buildings use more electricity than residential homes, as well as a single business building may have a significant impact on the overall stability of the energy system [28]. Commercial buildings are complicated, and NILM alone will not be adequate to accurately disaggregate energy consumption. More studies in real commercial buildings will be required to determine the best cost-effective combination of NILM systems and auxiliary technologies [26]. Types of loads in commercial buildings are water pumps, office equipment, heaters, ventilation, and air conditioning (HVAC). The number and complexity of loads, the difficulty in understanding small variations in power consumption, and the failure to find constantly working loads are three important characteristics that make NILM systematically challenging in commercial buildings. In addition, simultaneous operation causes overlapping loads, which complicates disaggregation. Because of this, residential building specific NILM algorithms generally underperform when implemented in commercial buildings. Hence, reliable disaggregation algorithms specific to commercial buildings have yet to be implemented [29].
Most of the present NILM research has been on residential buildings employing low-frequency power data acquired from smart meters [25]. All appliances of the household can be used in residential buildings such as electronic devices, heaters, fans, and refrigerators. However, due to the lack of research on commercial buildings, researchers tend to focus more on residential buildings. There is now a lot of focus on disaggregation methods and datasets for residential buildings in NILM studies. The methods of NILM may be effective due to the number of loads, load similarity and less complexity. Hence, NILM system approaches for residential buildings can be considered to be similar to the concept of the NILM framework and not be applied to commercial buildings which may lead to inaccurate results.
Generally, the effectiveness of non-intrusive load monitoring techniques may be assessed by using public datasets and by calculating various metrics to measure the performances on a specific dataset. Before implementation, researchers would try to simulate based on the public datasets and assess them by using the performance metrics to ensure the analysed model is effective in real-time.
A collection of reference data is important for a systematic comparison of the NILM technique's performance. It may consume time and costly to obtain and identify patterns generated by the different loads. These datasets are designed to quantify subjective house demand by low and high-frequency non-intrusive single data point metrics. Datasets can be classified as event or non-event datasets [30]. Many datasets have been used to test NILM algorithms more than 40 public datasets were published and each one has different parameters and specifications. Furthermore, there is no general agreement on how the dataset should be made accessible to the public. This leads to substantial structural variations between the datasets that are accessible to the public. Public NILM datasets often include energy data from diverse households across different regions, climates, and demographics. Regional traits like appliance usage, energy habits, and appliance prevalence vary. These variations impact NILM algorithm performance across regions due to cultural differences, climate conditions, and energy pricing structures, or the availability of certain appliances in a specific region. Thus, it's vital for researchers to account for regional nuances, either by creating adaptable models or using diverse datasets to enhance generalized and robust NILM solutions. The relevance of datasets to regions depends on factors such as the location, energy consumption patterns, appliance types, and electrical systems prevalent in that area. Researchers and practitioners in NILM need to carefully select datasets that align with the specific characteristics of the region they are targeting. While some aspects of NILM research are transferable, datasets tailored to a particular region enhance the accuracy and applicability of NILM algorithms, leading to more effective energy monitoring and optimization solutions. DSCleaner is a Python module for cleaning, pre-processing, and converting time series datasets to a standard file format, which is described in detail in this [31]. Hafiz et al. [32] also presented a comprehensive review of 42 NILM datasets.
Real datasets which include high sampling rate (kHz) and low sampling rate (Hz) as well synthetic datasets can be used. The purpose of using datasets is because it can be consumed either for residential buildings or commercial buildings. The provided appliances in the households' datasets are a TV, washing machine, washing dryer, fridge, lights, dishwasher, duct heater, dryer, microwave, oven, cooker, kettle, printer, digital video disc player, kitchen outlets, coffee maker, stove, freezer, iron, vacuum cleaner, and more appliances can be found in the datasets. Whereas the loads in the datasets of commercial buildings are HVAC units, lights, monitors, laptops, chillers, lifts, water pumps, sewer pumps, personal computers, and imaging devices.
Low-frequency datasets are more available to the public due to the lower cost and easier installation. The sampling rate and features vary from one dataset to another where the sampling rate in the datasets is between 0.2 Hz and 15 Hz. Smart [33], Indian ambient water and electricity sensing (iAWE) [34], REFIT [35], GREEND [36], office plug load dataset (OPLD) [37], rainforest automation energy (RAE) [38], electricity consumption and occupancy (ECO) [39], and Dataport [40] datasets measured the electrical consumption at resolution of 1 Hz. Whereas, Tracebase [41] and appliance consumption signature database (ACS-F1) [42] datasets recorded the consumption of the appliance at a sampling rate of 10 seconds as well commercial building energy dataset (COMBED) [43] dataset collected data at 20 seconds. There are datasets having resolution of 1 minutes such as almanac of minutely power dataset (AMPDs2) [44], Chulalongkorn university building energy management system (CU-BEMS) [45], Indian buildings energy consumption dataset (I-BLEND) [46], electrical-end-use dataset (EEUD) [47], and Dutch residential energy dataset (DRED) [48]. In addition, ENERTALK [49] was recorded at a sampling rate of 15 Hz.
Researchers tend to use a high sampling rate to study the patterns of loads and several features require a high frequency to extract them. High-frequency datasets are less available due to the high cost of installation. One of the datasets that is used by the public is reference energy disaggregation dataset (REDD) [50] which captured the signals of loads at 15 kHz as well can be used for a low rate at 1 Hz. Building-level fully labelled dataset for electricity disaggregation (BLUED) [51] contains the measurement recordings at 12 kHz. United Kingdom domestic appliance-level electricity dataset (UK-DALE) [52] and controlled on/off loads library (COOLL) dataset [53] measured the electricity consumption at 16 kHz and 100 kHz, respectively. Whereas, worldwide household and industry transient energy dataset (WHITED) [54] recorded the signatures of the total consumption at 44.1 kHz. Building level office environment dataset (BLOND) [55] collected the measurements in two categories, namely BLOND-50 had resolution at 50 kHz and BLOND-250 measured the electricity consumption at 250 kHz. HELD1 [56], LIT [57], and plug-level appliance identification dataset (PLAID) [58] also used a high sampling rate to record the energy usage at 4 kHz, 15 kHz, and 30 kHz respectively.
Running campaigns for actual datasets is a costly and time-consuming operation that requires a large amount of sensor infrastructure, money, and effort. Furthermore, training the network for recognising the appliances and running state-of-the-art algorithms of energy disaggregation and load identification is not possible without having precise consumption data. To address this problem, synthetic datasets are utilized to achieve cost savings and performance parity [32]. 5 synthetic datasets are published to the public including SmartSim [59], AMBAL [60], SHED [61], SynD [62], and NILM-Synth [63].
SmartSim [59] measured the appliances for one household at 1 Hz. Furthermore, SmartSim is integrated with NILM-TK, a publicly accessible NILM toolkit, and its synthetically produced traces are compared to traces from a real house to demonstrate that they give comparable quantitative and qualitative findings for representative energy analytics.
Automated model builder for appliance loads (AMBAL) [60] dataset contains a signal at a resolution of 1 Hz. AMBAL enables the generation of models using real-world device power consumption data acquired through smart plugs. Models are modelled as sequences of parametrized signatures, and complexity is kept low while achieving the required precision. Furthermore, a synthetic appliance trace generator is described, which allows for the recombination of appliance models to mimic user actions in houses of varying complexity. Simulated high-frequency energy disaggregation (SHED) dataset [61] consists of 8 buildings. SHED dataset covers the overall current consumption as well as specific consumption according to various categories for each building. Individual consumptions for buildings 1–6 are comprised of low-frequency power measurements, whereas those for buildings 7–8 are comprised of high-frequency current data. Every 30 seconds, one current waveform is captured, and 200 points are sampled for each current waveform. Power data are also taken at a frequency of 1/30 Hz.
Synthetic energy dataset (SynD) [62] provides a simulated home that is used for a total of 21 appliances for 180 days. Measurements are taken from the aggregate and the submeters at a rate of 5 Hz. NILM-Synth [63] was recently published, as a synthetic dataset-generating tool that can generate complicated, realistic power waveforms that are ideal for training, testing, and benchmarking NILM algorithms. The program and load library are natively compatible with major numeric computing applications, such as NILMTK, a popular software framework for developing NILM algorithms. Table 1 shows the common public datasets which are accessible to the public and a comparison between the datasets, highlighting their main characteristics, such as region, sample resolution, duration, features and the number of sites.
Comparison of NILM public datasets (V=voltage, I=current, P=active power, Q=reactive power, S=apparent power, pf=power factor, f=frequency)
| Dataset | Region | Sampling resolution | Duration | Sites | Features | |
|---|---|---|---|---|---|---|
| Aggregate | Appliance | |||||
| REDD [50] | USA | 15 kHz, 1 Hz | 1/3 Hz | 2-4 weeks | 6 | V, I, P |
| UK-DALE [52] | UK | 16 kHz | 6 sec | 655 days | 5 | V, I, P, Q, S |
| PLAID [58] | USA | - | 30 kHz | - | 55 | V, I |
| AMPds [65] | Canada | 1 min | 1 min | 2 years | 1 | V, I, P, Q, S, pf, f |
| DRED [48] | Netherlands | 1min | 1 Hz | 6 months | 1 | V |
| LIT [57] | Brazil | 15.36 kHz | - | 24 hours | - | V, I |
| WHITED [54] | Germany, Austria, Indonesia | 44.1 kHz | - | - | - | V, I |
| Smart [33] | USA | 1 Hz | 1 Hz | 3-4 months | 7 | V, P, S, f |
| iAWE [34] | India | 1 Hz | 1 Hz | 78 days | 1 | V, I, P, Q, S, pf |
| GREEND [36] | Austria, Italy | - | 1 Hz | 3-6 months | 9 | P |
| OPLD [37] | Singapore | 1 Hz | 1 Hz | - | - | I, P, S |
| RAE [38] | Canada | 1 Hz | 1 Hz | 72 days | 1 | V, I, P, Q, S |
| ECO [39] | Switzerland | 1 Hz | 1 Hz | 8 months | 18 | V, I, P, pf |
| Dataport [40] | USA | 1 Hz, 1 min | 1Hz, 1 min | 4 years | 722 | P, S |
| Tracebase [41] | Germany | - | 0.1 Hz | 6 years | 15 | P |
| ACS-F1 [42] | Switzerland | - | 0.1 Hz | 1 hour | 10 | I, P, Q, pf |
| COMBED [43] | India | 0.3 Hz | 0.3 Hz | 1 month | 1 | I, P |
| CU-BEMS [45] | Thailand | - | - | 18 months | 1 | P |
| I-BLEND [46] | India | 1 min | - | 52 months | 7 | V, I, P, pf, f |
| EEUD [47] | Canada | 1 min | - | 1 year | 23 | P |
| ENERTALK [49] | Korea | 15 Hz | 15 Hz | 1-4 months | 22 | P, Q |
| BLUED [51] | USA | 12 kHz | - | 8 days | 1 | V, I, P, Q |
| BLOND [55] | Germany | 50kHz,250 kHz | - | 50-230 days | 1 | P, Q |
| HELD1 [56] | - | 4 kHz | - | - | 1 | V, I |
| COOLL [53] | France | 100 kHz | - | 6 s | 12 | V, I |
| SmartSim [59] | - | 1 Hz | 1 Hz | 7 days | 1 | P |
| AMBAL [60] | - | 1 Hz | 1 Hz | 1 day | - | - |
| SHED [61] | France | 1/30 Hz | 1/30 Hz | 14 days | 8 | V, I, P |
| SynD [62] | Austria | 5 Hz | 5 Hz | 6 months | 2 | P, S |
| REFIT [35] | UK | 8 sec | 8 sec | 2 years | 20 | P |
Evaluation metrics is performed to reach the classification accuracy required. Researchers have been working on the NILM system to evaluate the performance of accuracy metrics. [64] and [30] reviewed an extensive evaluation of performance metrics in detail. The performance of metrics is split into event detection (event-based) and load disaggregation (state-based) where the metrics of event-based approaches measure the classification Accuracy (ACC), the precision (P), the recall (R), the F-Measure (F1), Detection error rate (DER) and Failed detection (FD). Whereas the metrics of state-based techniques are Relative error (RE), root mean square error (RMSE), the standard deviation of error (SDE), average error (AE), match rate (MR), Energy accuracy (EAv1), fraction of energy (FEE), R-squared, and Energy error (EE).
Generally, the metrics for event detection and energy disaggregation are included in Table 2 as well as their respective definitions. Where TP is a true positive that detects of event appliance as being an event, TN is a true negative that detects of the event-less appliance as being event-less, FP is a false positive that detects of the event-less appliance as being an event and FN is a false negative that detects event appliance as being event-less [64]. In addition, i is number of observations or events based on each time step, N is the number of appliances, E is the measured energy, is the average measured energy over the dataset, is the estimated energy, is the error between the NILM and measured data, is the error between the NILM and measured data over the entire dataset, and α is the mapping factor.
Performance evaluation for event detection and load disaggregation
| Metric | Description | Equation |
|---|---|---|
| P | Precision (P) is the positive predictive value (PPV) | |
| R | Recall is the sensitivity or the true positive rate (TPR) | |
| Fβ | Trades-off precision and recall, where β is the weighing factor | |
| ACC | Accuracy of the load identification | |
| FD | The sum of false positive and false negative | |
| DER | The proportion between failed detections (FD) and the number of positive cases. | |
| RE | The relative error measures the quality of energy estimation relative to the consumed energy data | |
| RMSE | The root mean square error is known as the standard deviation of the errors in the energy estimation | |
| SDE | The standard deviation of error points out the spread range of the variations around the AE estimation | |
| AE | The average error identifies if the rated energy is overestimated or underestimated consistently | |
| MR | The match rate metric is based on the overlapping rate of true and estimated energy | |
| EE | The energy error metric is the ratio of the absolute difference between estimated and true energy, and the total amount of true energy | |
| EAv1 | The energy accuracy is reporting the energy error between 0 and 1. | |
| FEE | The fraction of energy is the ratio between the total estimated energy and actual energy used | |
| R-squared | The R-squared is a statistical measure of how close the estimations are from the ground-truth data |
As shown in Figure 4, the execution of load monitoring consists of four steps including data acquisition, event detection, features extraction, and load identification. At the beginning of NILM, the selection of sampling rate depends on the features that will be used and the loads that the building has. After that, event detection can be obtained by several methods to obtain the on/off events. Then, a feature based on steady-state that just needs a low sampling rate is selected, while a high sampling rate is for transient-state. Lastly, the loads are classified through the main meter by using supervised learning or unsupervised learning techniques. All the stages of NILM will be discussed in the next section in detail.
NILM Framework Procedure
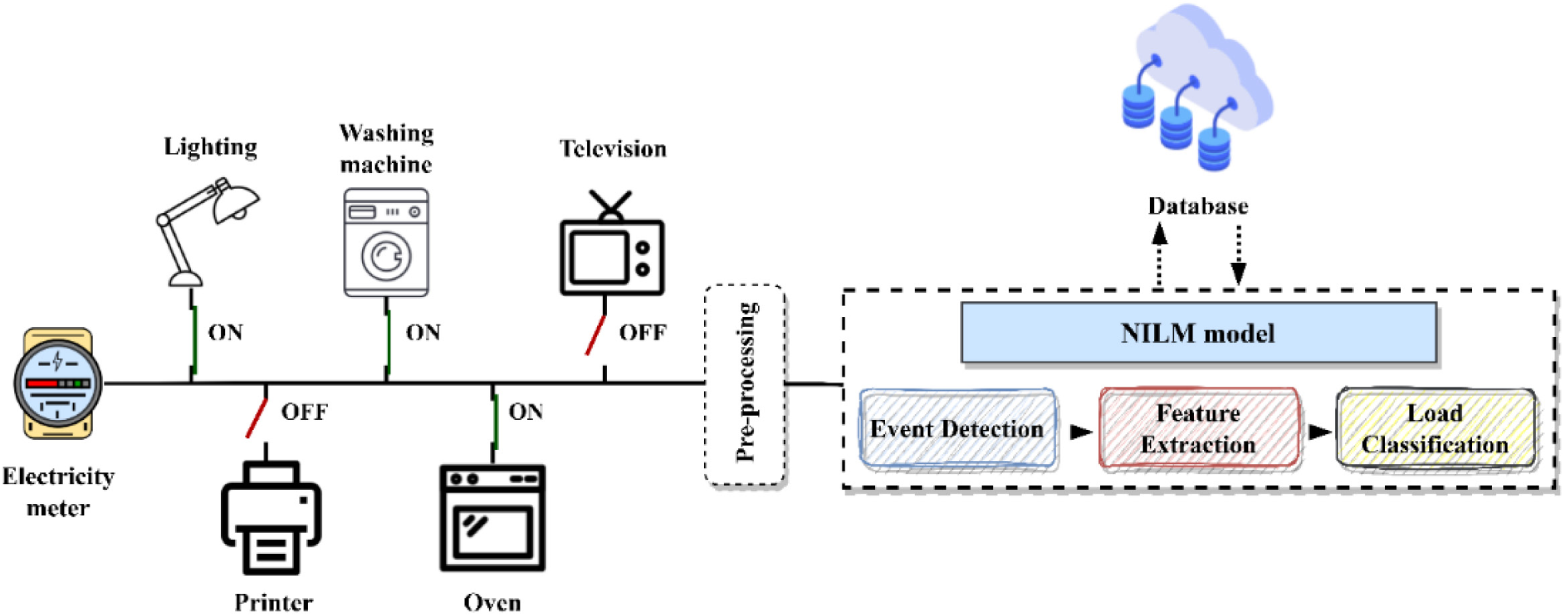
Data acquisition is one of the essential modules of NILM execution and its function has a considerable role in NILM. It is possible to classify data acquisition into two categories: low frequency (macroscopic), and high frequency (microscopic). To identify the load appliances running, the sampling frequency selection is quite related to the types of electric features used [17]. For NILM, the selection of a certain sampling rate is based on the quantity of data that needs to be acquired from these signals, the length of time available, and the loads that the buildings have. As shown in Figure 3, Type I has a constant signature and requires a low frequency while type II and type III have more changes in the event, hence requiring a high frequency to classify the loads [66]. A study of energy consumption patterns collected by smart meters may be utilized to determine the occupancy of a building or the usage of certain electric appliances through the NILM [67]. The total meter is used to acquire the real-time total electricity consumption of residential consumers. In the next step, the harmonics and waveform distortions are calculated in real-time, and it is also possible to do frequency domain analysis and wavelet transform analysis. Frequency domain analysis transforms time-domain signals into the frequency domain using methods like Fast Fourier Transform (FFT) to examine frequency components. Whereas, the wavelet transform provides time and frequency information, suitable for signals with varying frequencies over time. Both techniques are powerful in NILM for extracting insights from energy consumption data. Choosing different smart meters based on the requirements of different load characteristics, as well as selecting the proper sample frequency are all the necessary steps in this process [68].
NILM practitioners frequently favour low-frequency approaches because of their low cost, ease of implementation, and scalability; yet they are restricted in their applicability and functionality owing to feature loss [22]. Using a sampling rate ranging in Hz, it is possible to extract information not only from the steady-state but also from the type-I transients of the loads that are linked to the main power [69]. Schirmer and Mporas [70] aimed to improve energy disaggregation, which isolates appliance energy use from overall consumption by using appliance-driven sampling rates. By adjusting data collection frequency to match appliance behaviours like steady-state or transient patterns, accuracy is enhanced. The approach leads to better energy disaggregation, aiding in precise identification and understanding of appliance contributions to overall consumption. Huang et al. [71] examined the performance over a range of low-frequency sampling rates. According to the findings, NILM classification ability diminishes nonlinearly as the sample rate lowers, and the extent to which this deterioration varies between appliance kinds is demonstrated empirically. Low-frequency meters have a visible impact on the disaggregation process by making it more difficult to analyse [72]. The techniques of disaggregation are in demand, since all the data of the waveshape may be missing. The main problem at a low rate of sampling is that it is difficult to identify low-energy consumption appliances such as compact fluorescent lamp bulbs, light-emitting diode bulbs, and mobile chargers because the events involved are inconspicuous and the events become noises in the signal besides the high- energy loads such as resistive loads, air conditioner, and washing machine, that may lead the classifier to identify the small amount of power to the loads that consumed high energy. Moreover, they retain a realistic side while taking into consideration the actual smart meter technologies and huge data management issues, low-frequency measuring methods are regarded favourably [73].
High frequency is a process that extracts characteristics from short-term voltage and current waveforms that range from cycles to seconds in length, using a large number of samples. Increased sampling rates (kHz) need the use of highly calibrated equipment for data collection since they are more susceptible to electric noise. However, they may offer valuable operational information for load detection [73]. Typical approaches in the high sampling rate classify the steady or transient state features. In the event of greater sampling rates, such as those over a few kHz, the capacity for consumption disaggregation rises, and electrical devices with extremely low consumption can be recognized, which are often concealed in the case of lower sample frequencies [69]. Therefore, there exists a trade-off between the performance of the NILM system and the selection of sample rates. This trade-off can be assessed by comparing the ability to identify the same appliances across varying sampling rates, thereby aiding in the determination of optimal hardware specifications [74]. Lynch et al. [75] focused on the relationship between sampling frequency for feature extraction and selection in NILM system accuracy. The findings demonstrate that the sampling rate is linearly proportional to the accuracy of the model. The accuracy of the model improves when the sample rate is increased. However, one restriction is that, in the presence of high-power loads, it is always difficult to distinguish between low-power and variable appliances from data collected from the entire building [23]. Furthermore, the complexity of data storage, transport, and processing rises dramatically for a high sampling rate as compared to a low sampling rate. Hence, a high sampling rate is not yet regarded as a viable option for large-scale applications [76]. After data is collected and pre-processed, event detection will be selected to capture the appliance’s events (on/off).
It is generally known that switching on and off a load causes an instantaneous spike in power measurements. These load events may be properly recognized if a suitable threshold can be established to filter the power records before they are recorded [77]. Event detection may be done using either event-based or state-based (eventless) approaches. Using detection algorithms, the event-based technique recognises events and switches on and off appliances. In contrast to the event-based technique, the state-based method detects events by sampling each sample from the aggregated signal. In general, an event is defined as a signal that transitions from one stable state to another that differs from the preceding one [24]. The event-based approach, as shown in Figure 5, attempts to identify On/Off transitions, while state-based algorithms attempt to determine whether an appliance is On for the measured period.
The concept of event detection: (a) Event-based; (b) State-based
Lately, researchers concentrate on introducing several algorithms for event detection in the NILM system. In NILM, Nait Meziane et al. [78] proposed a method improved of event detection focused on the High Accuracy NILM Detector (HAND). Simply the usage of the standard deviation of the envelope observed by the current signal as a feature. Simulations indicate that the detection method provides 100% accuracy and 97.13% recall. Dash et al. [79] proposed a new method to automate the detection process of event states for all appliances to support the NILM system. Several different experiment results detect that the modulation in the automated detection algorithm considerably makes efficient the accuracy of appliance disaggregation outcomes in the output of NILM, even though no modifications are made in the load disaggregation algorithm. A hybrid approach is proposed by Rehman et al. [80] for event detection. The role of the method requires no more information other than the data collected from a meter. The method works without informing previous data of the device and building. Furthermore, it has the potential to improve the efficiency of detecting events whose performance is influenced by the period of complicated transition. Rehman et al. [81] propose a computational event detection method for load identification that is both minimal in complexity and quick. It has been evident that the developed method is effective for identifying high-consumption device events at low sample frequencies when used. Table 1 presents the summary of recent detection algorithms in NILM. The list of the advantages and disadvantages of each approach is also generated in Table 3.
Recent detection methods in the NILM system
| Ref | Detector | Advantages | Disadvantages |
|---|---|---|---|
| [77] | Median filter and ripple mitigation algorithms | It does not require a high sampling rate and high-speed computing hardware. |
Faulting to detect and pair all the events. |
| [81] | Mean Sliding Window (MSW) | Requires a low sampling rate. |
Diversity of the algorithm’s parameters. |
| [79] | Automatic State Detection (ASD) | The better state detection mechanism. |
Increasing the error due to overlapping states. |
| [78] | High Accuracy NILM Detector (HAND) | Low complexity and fast computation. |
Precision is sensitive to noise. |
| [82] | Cepstrum smoothing | Using frequency domain. |
needs high harmonics. |
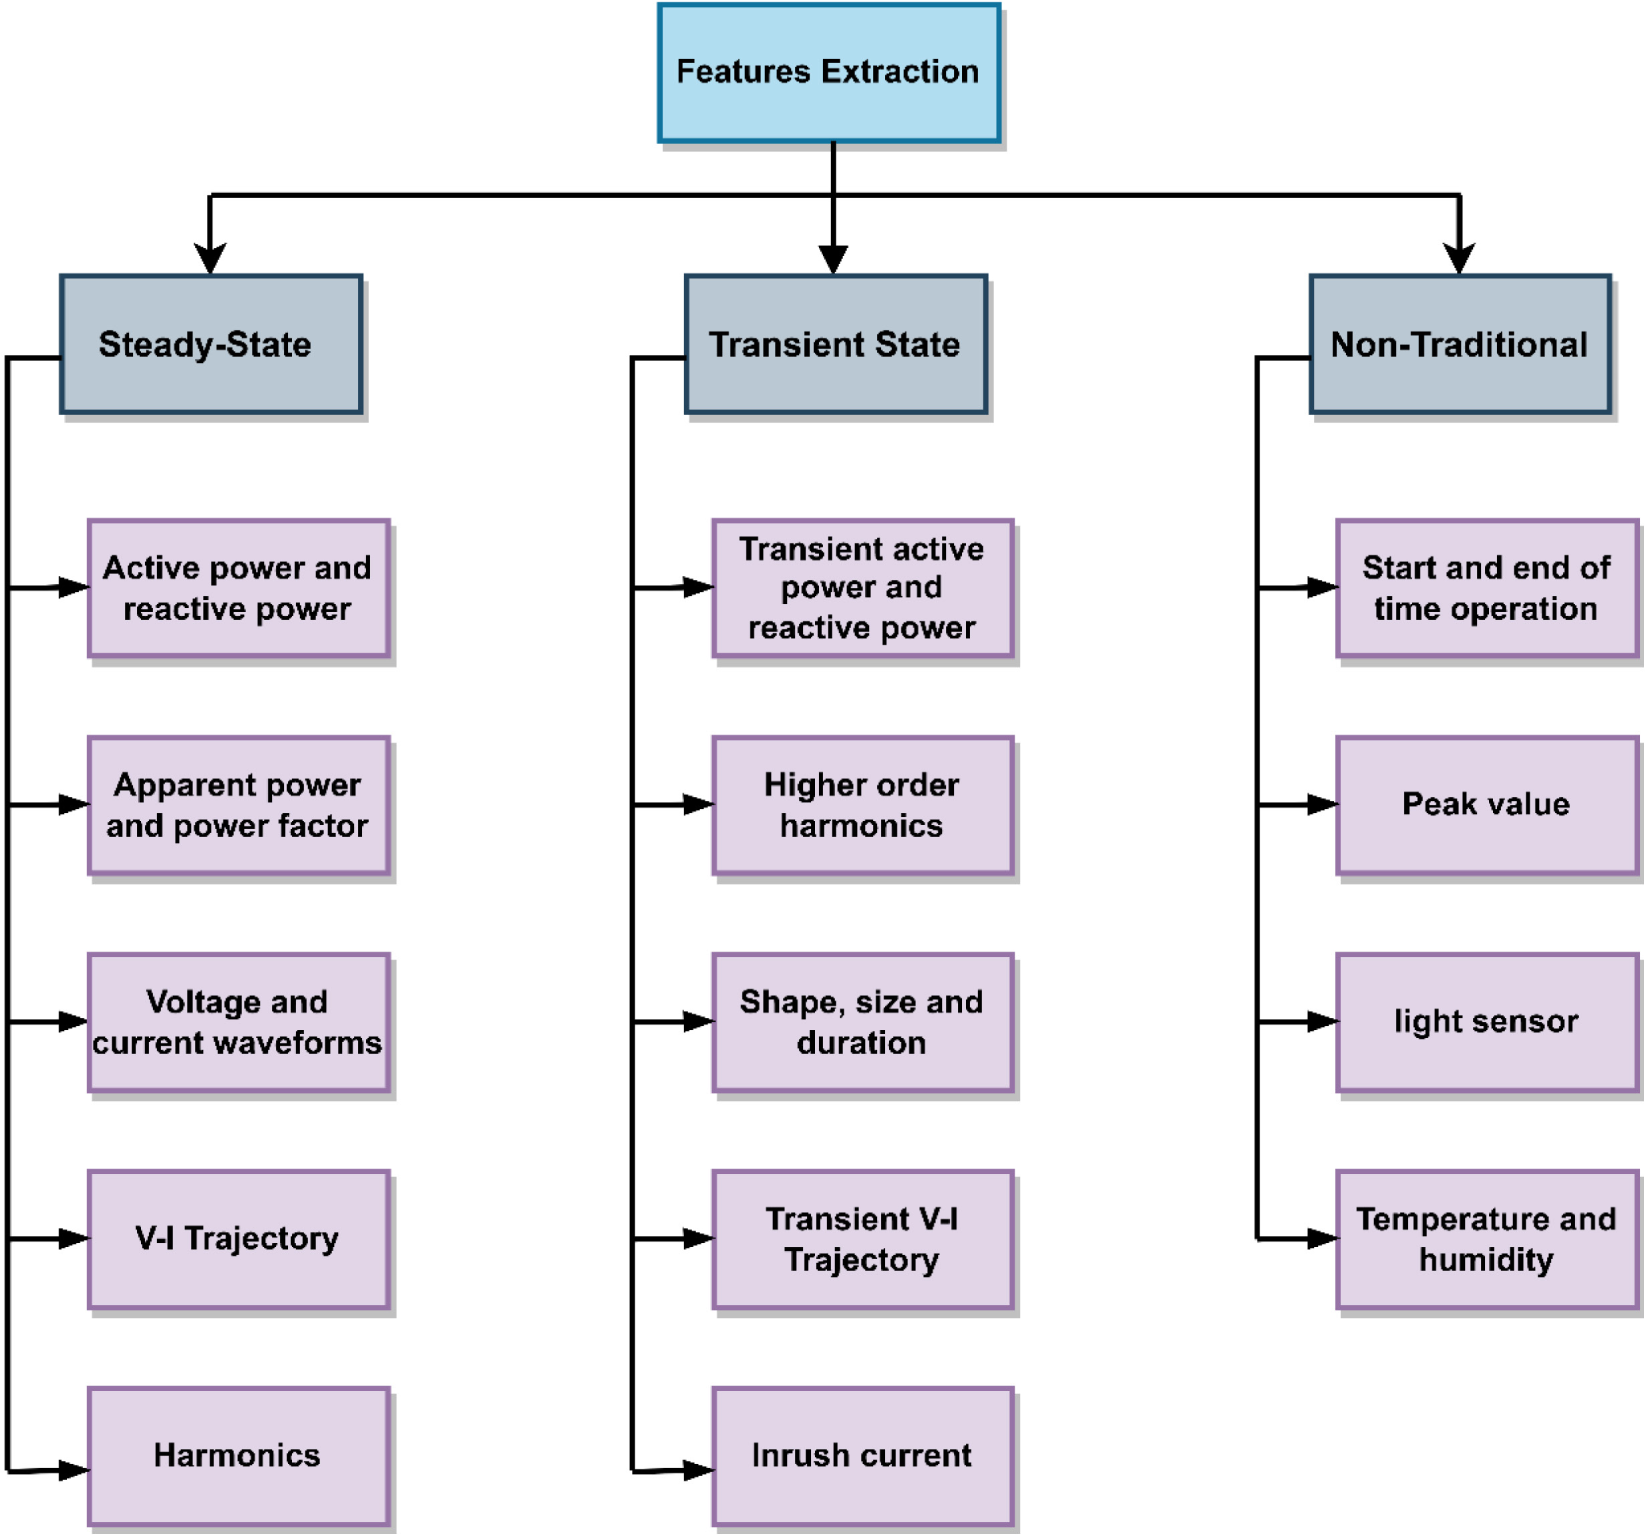
Feature extraction is considered the crucial step in NILM as well as selecting the significant features leads to increase the performance of the model. With the critical role of feature extraction, appliance signatures can be detected from current and voltage signals extracted. Features can be divided into three groups: steady-state, transient, and non-traditional [24]. Figure 6 depicts the division of these three groups. Power derivations, harmonics, voltage-current (V-I) trajectories, voltage, and current waveforms are all characteristics of a steady-state. Transient state characteristics such as transient active power and reactive power, inrush current, transient V-I trajectory, shape, size, and higher-order harmonics are obtained to investigate the transient condition. Furthermore, non-traditional characteristics include start and end times, peak and off-peak hours, light sensors, humidity, and temperature monitoring.
Features extraction for energy disaggregation
Steady-state signatures are the load features extracted when the appliance is in its steady-state operation [8]. Because the fluctuations in signatures may be at their smallest during the steady-state operation of the appliance, steady-state features may not need a large number of sampled signals [24]. Sadeghianpourhamami et al. [83] proposed a review of feature groups and identified the efficient feature group by execution of methodical feature elimination. The fluctuations in patterns are likely to be at their lowest during the device's steady-state operation. As a result, the characteristics of a steady-state do not need the use of a high sampling rate. Moreover, this is to be observed that several appliance signatures can be overlapped due to their comparable characteristics.
Brito et al. [84] demonstrated a new load signature based on instantaneous real power-reactive power (P-Q). The findings demonstrate that instantaneous P-Q produces more graphically distinct patterns than traditional load characteristics, particularly when dealing with low-power loads, whereas the latter commonly overlap. The major disadvantage of this technique is that appliances with comparable power draw characteristics overlap in the P-Q signatures, making it impossible to discriminate between them only if it is based on power step differences. To address this challenge, V-I trajectories are applied to discriminate between appliance events and other appliances events which gives a unique shape for each load more than the active power feature [85]. Angle, length, maximum distance, variations, average slope, Trajectory Centroid, and overshoot are all characteristics determined by the form of the V-I trajectory [86]. Kholeif et al. [87] investigated the effect of changing the voltage on the features extracted in the V-I trajectory method. The findings showed that apparent power, current, and harmonics are affected by voltage variation. Iksan et al. [88] expand and evaluate appliance load signatures based on a hybrid method that uses the V-I trajectory. The identification findings not only identify between equipment that is resistive, inductive, and capacitive, but they can also distinguish between equipment that is linear/non-linear and electrical appliances that are low in power.
Further, the frequency domain exemplification of signals and features can be detected. Harmonic features are used for the recognition in contrast to the time domain of device-specific current harmonic components that efficiently classify device events [24]. In addition to having excellent anti-interference capabilities, the steady-state characteristics are useful in identifying high-power consumption equipment such as electric heaters. In the case of appliances with Type II, Type III, and Type IV loads, however, focusing only on the steady-state makes the identification of appliances with these types of loads more challenging [89]. Steady-state approaches are widely used due to their low cost and ease of obtaining power parameters such as active power, reactive power, apparent power, and power factor. After all, it is highly limited due to overlapping appliance signatures [17]. Table 4 lists the summary of features extraction based on steady-state including real power, reactive power, current harmonics, and V-I trajectory while discussing the advantages and disadvantages.
Summary of recent features based on steady-state
| Ref | Feature | Advantages | Disadvantages |
|---|---|---|---|
| [83], [90], [91] | Real Power (P) | The ability to classify high-power and Type I appliances. |
The patterns may overlap with similar loads. |
| [84], [92] | Real Power (P) and Reactive Power (Q) | Easy to identify the appliances that have capacitance and inductance. |
Appliances that have similar power draw characteristics overlapping in the signatures. |
| [93], [94], [95], [96] | Current Harmonics | It is applied when there are non-linear loads. |
The amplitude of higher harmonics is small, and it is difficult to ensure complete recovery due to the limitation of sampling frequency. |
| [86], [97], [93] | V-I Trajectories | Strong separability. |
Unable to classify the low power patterns. |
The features obtained during the transient state would disclose unique information about the device, which would assist in the more accurate identification of the events. Electrical signals collected at a higher frequency are required to capture the characteristics of transient states (in kHz). So, the hardware module for extracting transient characteristics from high-sampled input signals should be able to process high-sampled input signals [24]. The process of high sampling rate needs a NILM system to enable the identification of transient features. The most used analyses in the transient state are transient V-I trajectories, Inrush current, higher-order harmonics, and transient power [24], [86].
It has been shown that transient real power and reactive power signatures may be utilized to monitor the functioning statuses of electrical appliances via the process of transient identification. This combination of characteristics is particularly well suited for identifying appliances that have very lengthy transient time, generate considerable spikes in their power use, and then exhibit slower changing variations. The edges and slopes of these transients or their power profiles are used to identify them [83]. Le et al. [98] analysed and extracted a new transient signal from the active power signal based on a low sampling rate. The state of the appliance is to obtain a transient signal to detect ON/OFF events of appliances. Athanasiadis et al. [99] proposed the turning-on of a target appliance by processing the measured active power transient response and estimating its consumption in real-time. The NILM system can identify in real-time when an appliance is turned on based on its information-rich transient response sampled at 100 Hz.
Because voltage has a significant degree of resemblance to other electrical devices, it is difficult to differentiate between them efficiently. It is possible to solve this limitation by using a harmonic analysis based on the Fourier transform to perform feature extraction, which may be used to reflect the variations between various equipment types. The Fourier transform technique and the Wavelet transform method are two of the most often used harmonic detection methods [100], [101]. Drouaz et al. [102] demonstrated new transient features based on the time-frequency domain by using the Stockwell transform to generate the shape of the frequency harmonic voices.
Hasan et al. [103] investigated the unique shape of a current at the starting phase (turn-on state) of a device. The adoption of a shapelet-based classification technique is time-consuming and may lead to computing difficulties. Nevertheless, by offering both analytical premises and experimental data, this study establishes simple computationally cost-efficient, and robust shapelet discovery and matching criteria that are both simple and resilient. Table 5 lists the summary of features extraction based on transient state including transient real power, transient reactive power, shape, size, and duration as well as the list of the advantages and disadvantages.
Summary of recent features based on transient-state
| Ref | Feature | Advantages | Disadvantages |
|---|---|---|---|
| [83], [99] | Transient Real Power (P) and Reactive Power (Q) | Have significant spikes in their power draw, followed by slower-changing variations. |
The operation of appliances presenting similar transient response patterns brings up a low accuracy. |
| [98], [102],[103] | Shape, size, and duration | Analysing the spectral envelopes for continuously variable loads. |
Requires a high sampling rate with more kHz. |
Non-traditional features have been of considerable interest in feature extraction approaches in recent times. This category contains all the characteristics that distinguish it from the two conventional groups. providing details of the detected appliance by using the environmental quantities such as starting and ending time, day of the week, temperature, and sensed light [24], [104]. Senave et al. [105] investigate the characterization of the heat loss coefficient of homes based on onboard monitoring data of their interior temperature and energy consumption, which were gathered throughout the heating season. Despite there is lesser trend in using non-traditional features, it can provide high performance for the NILM system, therefore needs to be considered.
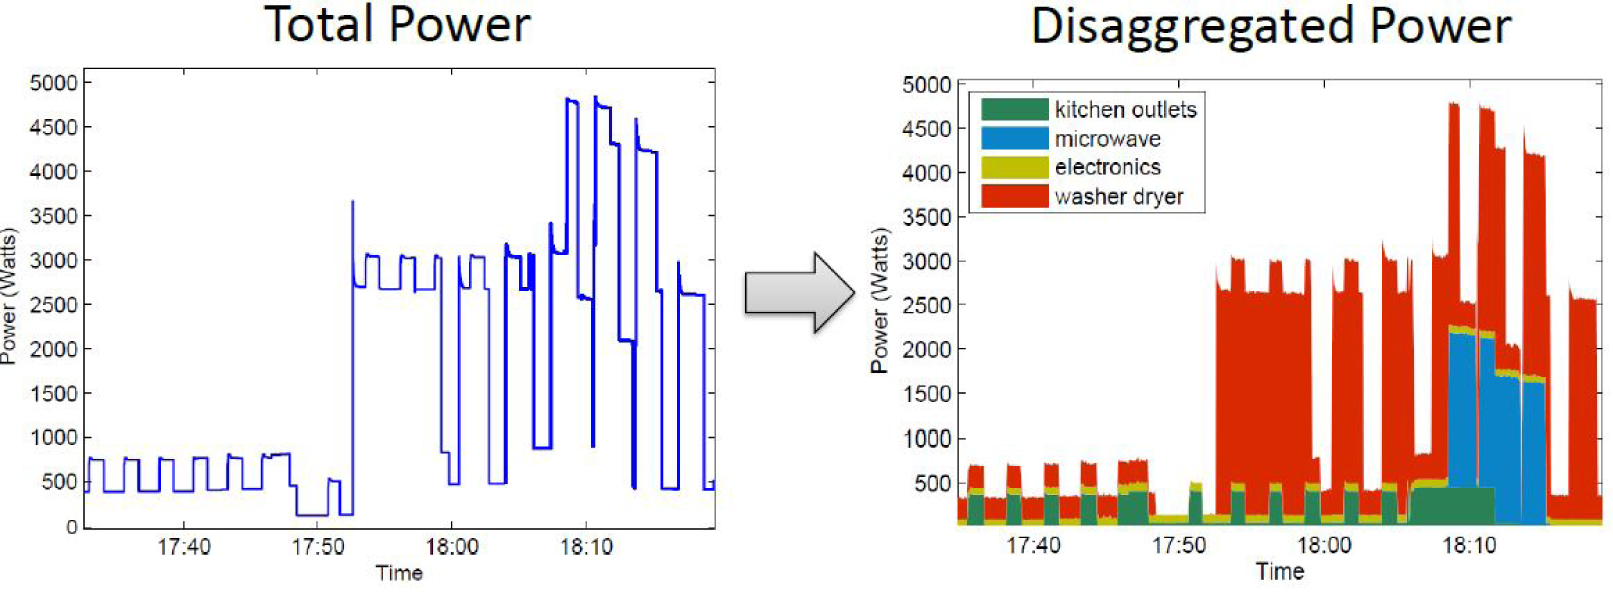
In today's current technologically driven world, recent separate fields and breakthrough technologies, such as the Internet of Things (IoT), artificial intelligence (AI), big data analytics, and fog (edge)-cloud computing, are on the rise in popularity [106]. After detecting the events of appliances and selecting the features, the algorithms of classification are involved to disaggregate the loads. Load disaggregation refers to a group of algorithms that may disaggregate the power consumption of households by individual appliances operated for a specific time. Figure 7 shows the disaggregated power of appliances from the total power consumption. Whereas the classifier disaggregates the total power based on events obtained from the appliances.
Load disaggregation NILM-based on the total power for microwave, electronics, washer dryer, and kitchen outlets [107]
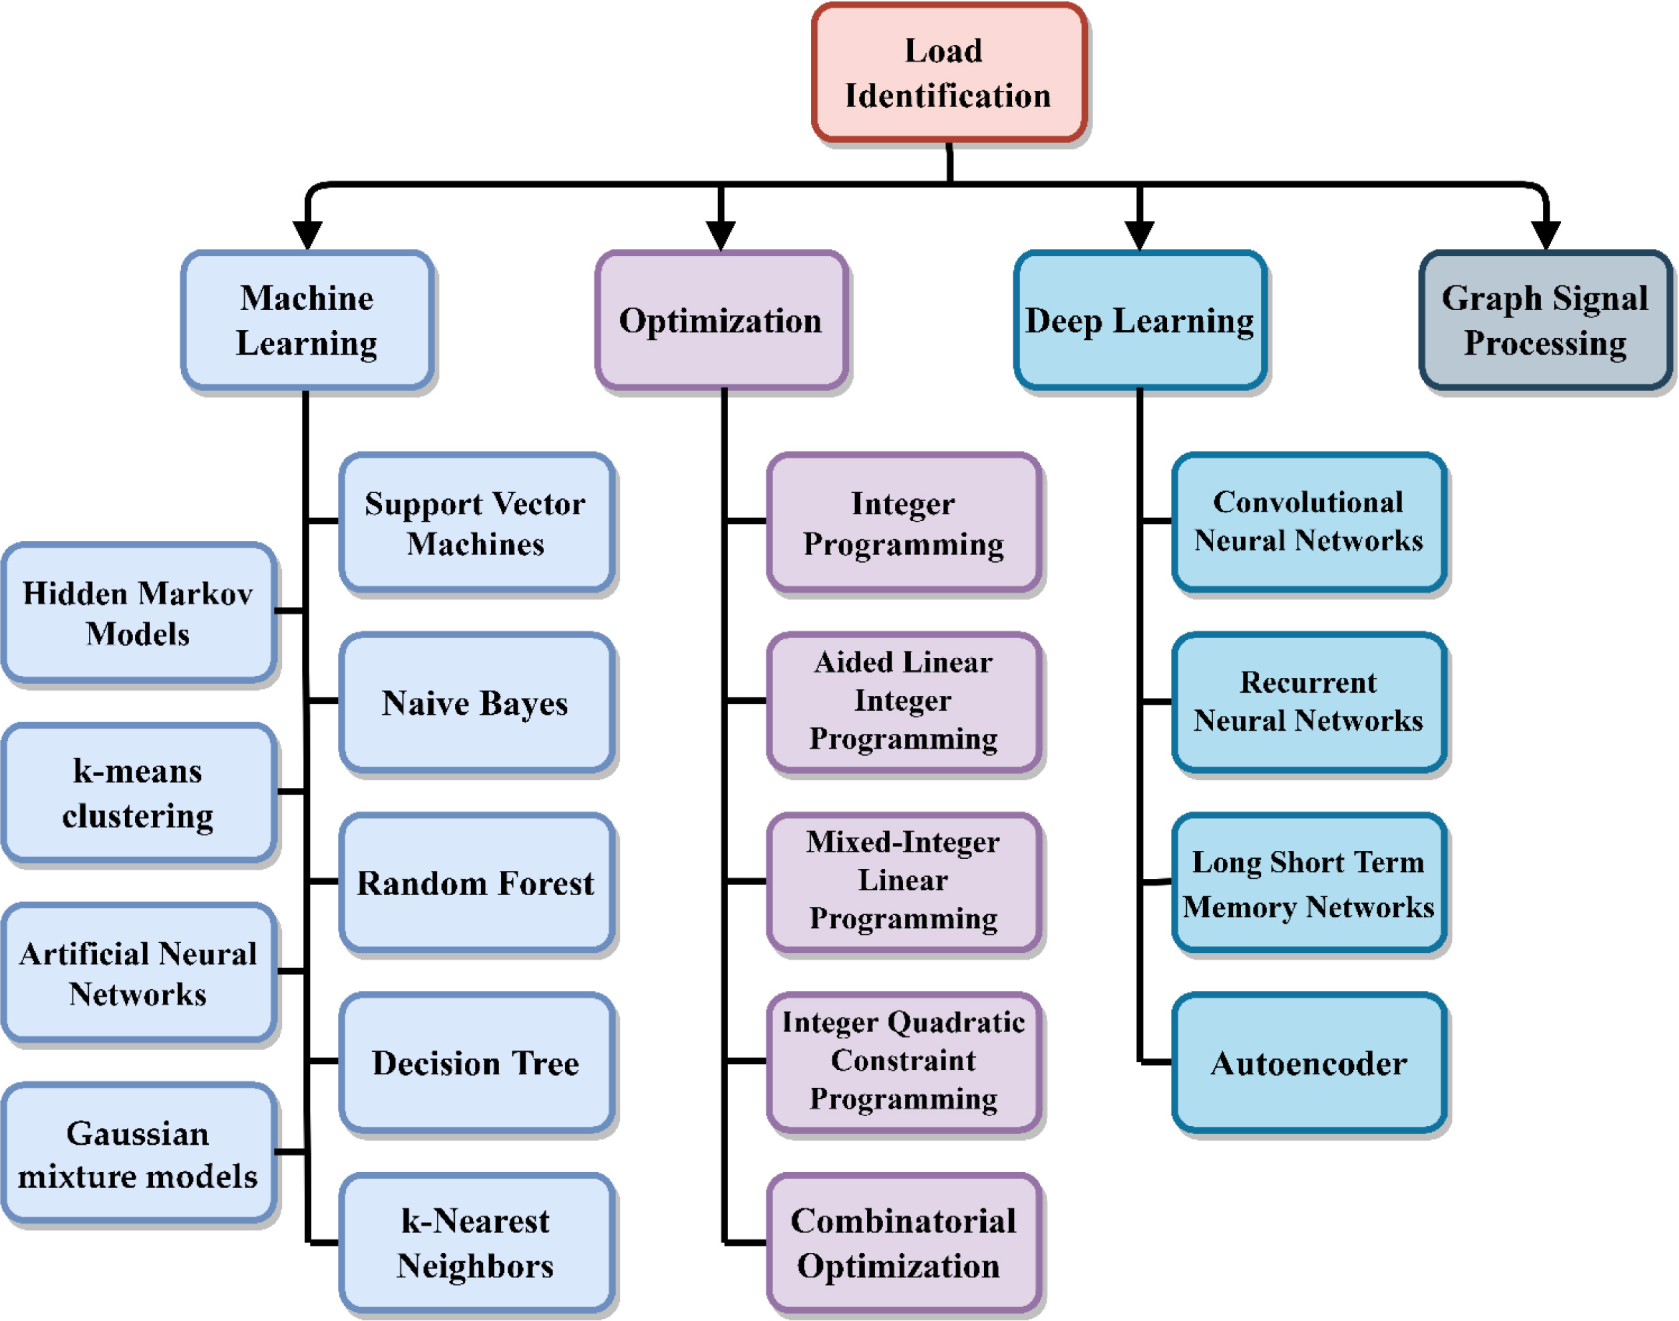
Researchers have also been drawn to the NILM domain by the improved performance of optimization, graph signal-based, machine learning, and deep learning techniques in a variety of pattern recognition limitations. This has prompted them to apply these AI techniques to the NILM domain to improve the energy disaggregation of appliances performances. The methods of supervised or unsupervised learning can classify the appliances by adding a training dataset or without it [24]. During the last decade, many researchers have concentrated on supervised algorithms rather than unsupervised algorithms, which have the potential to save the time of learning and classify all sorts of appliances effectively and with high performance. In NILM, there are low trends for optimization methods and graph signal processing (GSP) methods. Figure 8 shows the techniques of load disaggregation that have been used in NILM.
Most of the researchers concentrate on machine learning to investigate the performance of load classification. Machine learning algorithms in NILM are divided into two categories; supervised learning and unsupervised learning.
In machine learning, supervised learning techniques are algorithms that learn to map input data to a target data attribute, which is usually a class label. To be able to identify the appliances that are operating at any given moment, supervised learning approaches need the training of individual appliance data [108]. Supervised learning techniques contain several approaches based on artificial neural networks (ANN) [109], [110], support vector machines (SVM) [95], k-nearest neighbours (k-NN) [111], [112], Hidden Markov models (HMM) [75], [113], genetic algorithms (GA), decision tree (DT) [114], random forest (RF) [115], naïve Bayes (NB) [116]. To illustrate, HMM can be used either supervised or unsupervised learning, whereas the genetic algorithm can solve optimization problems in machine learning. In supervised techniques, the labelling process involves complete monitoring of the loads to be detected. The training takes extracted events to obtain the appliance's signatures.
Load disaggregation techniques are based on machine learning, optimization, deep learning, and graph signal processing
Recently, Gao et al. [117] suggested frequency spectrum in combination with time-domain analysis to identify loads based on SVM and particle swarm optimization (PSO). Kelati et al. [118] have proven that the accuracy of a k-NN classifier is dependent on the quantity of the training datasets for the appliances under consideration. Yang et al. [116] demonstrated that by using a small number of training samples with generic NB and the average power, it is possible to obtain good classification accuracy. The NB algorithm is preferable to be applied since it just takes a little quantity of the training data to forecast the class of the appliance. Himeur et al. [119] presented an efficient NILM framework that comprises a unique fusion of various time-domain characteristics offered to extract appliance patterns from a large number of data sources. In addition, Choksi et al. [120] have introduced a novel approach based on a power pattern matrix and DT for properly recognizing the patterns of household appliances. This is further affirmed by Nalmpantis et al. [104] who proposed a comprehensive analysis of machine learning approaches from qualitative to quantitative. Therefore, neural networks have shown that they are capable of meeting the condition of generalization with a high degree of confidence.
Algorithms of supervised learning can effectively classify the loads due to the training that they need and the labelling of the data. However, several limitations include intense focus on the training time and the unseen data. Supervised methods may take a longer time to train based on the size of the data as well as failure to identify the unseen data which needs to be updated when there is a new appliance or changes in the power pattern.
Unsupervised methods do not require any training before classification. This is an important advantage since, in this way, minimum effort is required from the user and the intrusiveness involved in building a database is reduced [121]. Furthermore, the unsupervised approaches are not reliant on the number of appliances that make up the aggregated load and are capable of dynamically adapting to changes in the power system over time [122]. Moreover, researchers have used unsupervised learning approaches in NILM systems such as HMM [113], k-means clustering [123], and Gaussian mixture models (GMM).
The use of HMM is to recognize the load state and power consumed when the hidden variables can be estimated (appliance states). The transition of the matrix can be used to observe appliance state changes. Instead of taking into account the appliance's actual functioning states, traditional HMM-based models instead rely only on basic empirical data. To solve this problem, a new model suggested by Wang et al. [124] is called the Adaptive Factorial HMM model, and it provides for a more accurate search for the operating condition of each appliance and subsequent accurate modelling using an adaptive search. A new infinite Factorial Hidden Markov Model constrained on Contextual features (iFHMMCC) has been proposed by Hasan et al. [103]. Furthermore, it is utilized to reduce the computational cost of inference and makes the model more tractable. Mostafavi et al. [125] proposed a new approach that can remove the need for human training and potentially expedite the adoption of low-cost power monitoring based on Bayesian networks. The adaptive Density Peak Clustering-Factorial Hidden Markov Model (ADPC-FHMM) is a model that Wu et al. [126] suggested to automatically detect the functioning condition of any appliance based on its power consumption. The findings show that the suggested model is indeed effective and superior. Wu et al. [127] also presented Time-Efficient Factorial Hidden Semi-Markov Model (TE-FHSMM) to boost computing performance. Two publicly accessible datasets and a real-world scenario indicate that the suggested model delivers excellent results in terms of both computing performance and efficiency. Ponrak et al. [128] proposed method uses a semi-supervised learning approach, with improved K-Means and Hierarchical methods. It involves determining the best number of clusters, selecting features, and managing the data. The findings present the suggested technique that precisely displays the energy consumption of each electric device. Papageorgiou et al. [129] presented an unsupervised NILM approach under the consideration of odd harmonic currents. To create unlabelled data clusters, the suggested technique first uses a k-means clustering algorithm. The findings show that when the harmonic content is taken into account, the F-Score index improves considerably for all analysed combinations.
Algorithms of unsupervised learning can learn without any labels of data which reduces the time for labelling manually and can be inserted after the classification stage. Moreover, they can reduce the dimensionality of the appliances' patterns. On the other hand, the classification of loads can be less accurate due to no training as well as may take a longer time to obtain the whole possibilities based on the number of features.
Optimization approaches address the load disaggregation challenge and optimize the problem. Recognizing load by this method matches the identified unknown appliance feature with the known appliance feature in the database and attempting to minimize the error of mismatch as well as detecting the nearest similarity. Researchers have proposed various optimization methods including aided linear integer programming (ALIP), mixed-integer linear programming (MILP), integer quadratic constraint programming (IQCP), integer programming (IP) [130], and combinatorial optimization methods which include artificial bee colony (ABC), PSO, and GA [131].
In recent works, Dash et al. [130] presented a two-stage NILM technique that is both simple and effective. It is presented with a standard deviation-based automated state identification technique (stage 1) and a penalty-based improved IP-based load disaggregation approach (stage 2). Several test results show that the suggested improved IP-based technique is an effective and less complicated solution to the load disaggregation issue. However, concerns with transient signals and circumstances where certain states are binary combinations of other states have been demonstrated to cause problems with IP-based disaggregation on actual data. To overcome this problem, Bhotto et al. [132] presented an ALIP disaggregation method that addresses many of the drawbacks of the IP-based approach. The experimental findings show that ALIP has a considerable accuracy improvement over the IP-based disaggregation approach. Wittmann et al. [133] introduced the mixed-integer linear constraints (MILC) technique to effectively predict the behaviour of complicated load signatures. The suggested technique is also evaluated in the comparison to IP and ALIP. The results show that the suggested technique is capable of reliably identifying and allocating individual energy signatures in a computationally efficient way, as well as outperforming existing methods. Kong et al. [134] presented NILM system based on segmented IQCP. The findings show that the method may be used with current smart meters to build a device-level load model for future smart grid research and applications.
In recent works based on combinatorial optimization methods, Lin et al. [135] demonstrated the PSO-based NILM technique and verified it in an actual housing situation. According to the experimental findings of the suggested technique, the PSO-based NILM presented in this study has a load recognition accuracy of 64.06%. The accuracy of the model considers low where state-of-the-art NILM models achieved from 85% to over 95% in disaggregating household energy consumption as shown in Table 6. The accuracy can vary widely depending on the specific dataset, the complexity of the household, the types of appliances present, the quality of the data, and the techniques used for load disaggregation. Guo et al. [136] suggested a novel combinatorial optimization-based load disaggregation approach. First, the PSO algorithm is enhanced by including temporal probability in the fitness function. Second, investigate the multi-model combination load disaggregation approach, which parallelizes the enhanced PSO, IP algorithm, and delta feature (DF) model. The experimental findings indicate that the approach performs well for load disaggregation. To increase the accuracy of load classification, Ghosh et al. [137] suggested the ABC optimization technique by reducing the computational complexity of the processor which requires less training of appliance profiles. The suggested approach provides a higher rate of classification accuracy than the current techniques in use.
Optimization approaches can highly achieve identity precision and able to solve the problems of machine learning. However, the limitations of optimization methods are costly to be computed, also it difficult to discern the loads with the same or overlapping signatures, mostly if the database does not extract anonymous appliances will tend to have a lower trend for research. Moreover, the larger computational overhead of the disaggregation method may result in inaccurate findings, and delayed operation.
Analytical tools such as GSP are useful for visualizing complicated correlations between data samples [138]. GSP has been commonly applied, in both supervised and unsupervised learning. Unsupervised GSP involves filtering and clustering to disaggregate and classify loads without any previous knowledge of specific load shapes, while supervised GSP is trained using labelled samples of individual appliance data [139].
Comparison of NILM models
| Ref | Sampling rate | Feature | Technique | F1-score | Findings |
|---|---|---|---|---|---|
| [158] | 30 kHz, 100 kHz | V-I Trajectory | Siamese network model | 97.88 % | The number of training samples required is minimal. New electrical equipment may be identified without retraining the model due to the constant increase of the feature library. When there are too many samples in the feature library, the identification process may be delayed. The model's computational efficiency is poor. |
| [159] | N/A | Active power | GSP | N/A | To increase disaggregation accuracy, the scaling factor may be modified to meet appliances with large magnitude power use and short, highly intermittent operation. Except for the electric resistance water heater, all appliances operate better according to F-measure at lower threshold levels. |
| [160] | 1 Hz | Active power | GMM | 98 % | The method can easily classify the category of the two-state appliance. The experimental findings demonstrate similar per-performance to other unsupervised algorithms. There is no discrimination between appliances with the same power. |
| [161] | 0.017 Hz | Active power and reactive power | Affinity propagation clustering algorithm and time-segmented state probability | 95.71 % | The model is simple, the probabilities and power templates are stored as matrices and can be called up quickly. The need for a quick calculation time and low-rate sampling. It performs poorly when recognizing appliances with constantly adjustable power while in use. |
| [162] | 12.8 kHz | Current and harmonics | SVM | 96 % | When active and reactive power data are confounded, harmonic features may help increase classification accuracy. The amplitude of higher harmonics is tiny, and the sampling frequency limitation makes full recovery impossible. |
| [163] | N/A | Active power | k-NN | 93 % | It effectively captures signal nonlinearities. Though it misclassified electrical gadgets and only had a 50% classification accuracy, it accurately classified furnaces, kitchen outlets, washing dryers, and microwave ovens. |
| [164] | N/A | Current waveforms and real power | PSO-RF | N/A | Power fluctuation signals may be identified by comparing their power differences, and this approach was shown to be successful, which can properly identify the appliance's on/off status. |
| [165] | 10 kHz | Active power | DT | 87 % | The proposed technique has been able to accurately identify the appliances are induction heaters, washing machines, and fridges. The use of power patterns for classification would reduce data processed by a complex algorithm using high sampling rates. |
| [166] | 1.2 kHz | IRMS and current harmonics | NB | 84.52 % | After testing the data, it was found that when the original data was subjected to FFT decomposition, it would generate interference with an amplitude of about 0.3A, which greatly affected the accuracy of the final identification using harmonics. |
| [167] | 1 Hz | Active power | Denoising Auto-Encoder | 80.5 % | The suggested technique has a high degree of generality and can efficiently recognize the same equipment from multiple models. Classification of multi-state loads is difficult, as is a satisfactory classification of Type-I loads. |
| [168] | 1 Hz, 0.17 Hz | Active power | Sequence to point | 80.3 % | The technique identifies the loads efficiently and with great accuracy. Sometimes samples with no power usage have some disaggregation inaccuracy. The model must be trained once for each target appliance, which is time-consuming. |
| [169] | 8 kHz | V-I Trajectory | CNN-LSTM | 99 % | The CNN network is unable to efficiently extract temporal information, and the load classification achieves low performance as a result. The LSTM network uses real-time V-I sampling data for training, extracts the temporal features of load operation for load detection, and enhances recognition accuracy. However, the network convergence speed is slow. |
| [170] | N/A | Current waveforms | Backpropagation neural network | 95.35 % | The proposed method can determine the state of the power on and off as well can identify the type and running time of different electrical loads. |
Recently, Bochao Zhao et al. [140] applied semi-supervised GSP to tackle the difficult challenge of reducing the influence of measurement noise and unknown loads on load disaggregation performance. As a result, the method improved NILM performance when applied to three events based on NILM approaches and two real-world datasets with multiple residences and varied noise levels. The disaggregation of water heaters and HVAC system components have been investigated by Green et al. [139]. A supervised GSP method was used; and the findings demonstrate that the values of disaggregation sequencing, graph scaling factor, and graph classifier threshold have a substantial influence on supervised GSP NILM performance. He et al. [141] presented two NILM algorithms based on the emerging concept of GSP. In the first place, it reduces the overall variance of the graph. Second, simulated annealing is used to further fine-tune the entire graph-variation solution. The suggested approach, which does not need any extra hardware installation, might operate with traditional smart meters, such as recording data every 10 seconds through the Consumer access device. Consumer access devices empower individuals to take control of their energy consumption, reduce wastage, and potentially save on energy costs as well obtaining information on power consumption in several seconds to the consumer. Zhang et al. [138] showed a two-step GSP-based method proposed for low-rate NILM problems. The suggested technique treats disaggregation as an optimization and classification problem with a regularisation term defined by the overall smoothness of the graph signal. The disaggregation findings based on the REDD dataset indicate the exceptional quality of the proposed method.
Using supervised techniques can outperform unsupervised techniques due to the provided samples of complicated operational cycles to the disaggregation algorithm, which may not be taken into account in unsupervised methods. Furthermore, supervised techniques enable the algorithm to be tailored to a specific set of load types, allowing for higher precision in classification [139].
Deep learning is a machine learning concept based on artificial neural networks. For many applications, deep learning models outperform shallow machine learning models and traditional data analysis approaches [142]. In NILM, researchers have found some deep learning approaches such as convolutional neural network (CNN) [143], autoencoder (AE) [144], recurrent neural network (RNN) [145], and long-short term memory (LSTM) to improve load disaggregation by extracting features automatically [146], [147]. Wang et al. [148] proposed reconstructing the load signals from collected data and load identification by using denoising autoencoder (dAE) and LSTM. The approach dAE and LSTM outperformed HMM and dAE. However, LSTM was able to store and bring out the information through the data of time sequence. With the use of high-dimensional sparsity hourly energy data, Jia et al. [149] have developed a tree-structured CNN classifier for the study of temporal patterns. Osathanunkul [150] investigated if decreasing the sample rate would shorten the time required to disaggregate an aggregated reading while still producing an acceptable result as a disaggregation algorithm, RNN with LSTM is used. Load data for small office appliances such as laptops, computer monitors, etc. have been proposed by [151]. It is impossible to overlook the potential energy savings that each tiny item has, especially in major enterprises and institutions. It is shown that the RNN that has been presented obtains superior outcomes. Zehua et al. [152] showed a new method of NILM based on CNN. Although CNN-based load classification requires a huge quantity of data to properly fit the network, the benefit is significant. Chen et al. [153] suggested a new NILM model, which is a hybrid model combining the CNN and LSTM networks. The CNN network is used to extract the V–I image characteristics, while the LSTM network is used to recover the electrical equipment time characteristics. Tests show that the model is better than the k-NN approach and the SVM, CNN, and LSTM methods.
Recently, researchers have focused on transferability to decrease data gathering, which is a key strategy for addressing the issue of inadequate deep learning training data. This method seeks to transfer knowledge from the source domain to the target domain by assuming that the training and test data must be distributed independently and identically [154]. A V-I trajectory-enabled transfer learning approach was presented by Liu et al. [155]. Different electric loads may be distinguished by the shape and colour information of their V-I trajectories using correct trajectory pre-processing and colour encoding methods by transferring a convolutional neural network called AlexNet that has already been trained to the new NILM tasks. However, the technique can detect type-I loads, but type-II loads remain a difficult challenge. D’Incecco et al. [156] introduced seq2point learning for NILM, which is based on appliance transfer learning and cross-domain transfer learning. The findings demonstrated that CNN layers trained on washing machines may be applied to other appliances. This suggests that all appliances utilize the same signatures for NILM, which might simplify the data collection process. The federated learning and TL that Li et al. [157] presented maintains high performance while protecting the privacy of the users. The findings are similar to state-of-the-art NILM algorithms with robust privacy protection, which is useful for deploying the distributed algorithm to home Internet of Things devices.
The approaches based on deep learning algorithms may consider several factors in order to have an efficient model where the size of data depends on the similarity of loads and number of appliances which require a huge data to identify the loads easily. Large data may not lead to an increase in the accuracy of the model until it reaches a steady point. However, normalizing data can improve neural networks and be more accurate. Table 6 demonstrates the summary of recent NILM models. The relation between the features and the classifiers is described with various approaches in the remarks. F1-score or F1-measure is calculated by obtaining the data test's precision and recall measuring the test's accuracy and to demonstrate the model's performance as shown in the table below.
With the development of technology, NILM has been expanded to several applications for the past few years and have become common to be used not only in buildings which helps to monitor the appliances events, also for shipboard control, electric vehicles (EVs), smart grids, distributed energy resources, and human activities. This section highlights several applications of NILM that haves been applied recently.
NILM systems are an excellent option for monitoring several appliances without the requirement for sub-monitoring. It has not yet been recognized that these systems can reliably identify the aberrant activity of the different appliances being monitored. To accomplish this objective, the NILM systems must be able to correctly duplicate the appliance's power absorption profile, which other anomaly detection systems would subsequently examine, in addition to generating an accurate estimate of the appliance's energy consumption [171].
Rashid et al. [172] proposed in determining if NILM-detected appliance signatures may be utilized directly for anomaly detection. The research concentrates on two basic home appliances: air conditioning and refrigerator. Both of these appliances rely on a compressor to function, and their high energy consumption is mostly attributable to the compressor. Any malfunction in the compressor or any other component influencing the compressor is reflected in the appliance's power consumption trace. However, it demonstrates that regularly misses "frequent class" of air conditioning (AC) anomalies in all the households due to the fundamental cause of all of these undetected abnormalities were their shorter length. Duration is a critical factor in determining anomalies. All of the missed anomalies have a period of 8 hours; as a consequence, throughout a complete test day (day or night), the nature of the abnormality becomes diluted with the appliance's typical behaviour. This research demonstrates that when the normalized error of the appliance is considerable, the direct application of NILM methods for accurate anomaly detection in AC or refrigerators is not feasible. As a result, this calls for the development of anomaly aware NILM algorithms, as well as some post-processing of NILM output signals to reduce the influence of noise.
Smart grids have progressed from being a theoretical concept to an established norm, at least in the world's most developed nations. Smart grids are defined as the integration of conventional power grids with contemporary information and communication technologies (ICT), as well as the integration of distributed generating systems and microgrids for quality evaluation and supported independent living [173].
Zhou et al. [174] demonstrated a smart grid system based on a distributed spiking neural network (SNN), in which each household has a set of smart outlets for all appliances. The acquired data is stored inside the low-cost smart outlets before being sent to the local home server through a shared wireless channel. The local server will keep learning or categorizing the incoming data before uploading the appliance type and down-sampled data to the area server. Finally, the server may recommend that utility providers change the ideal load demand based on the data obtained from particular appliances. Because of the one-to-many design, communication between smart outlets, the local server, and the area server is restricted. The use of SNN based on unsupervised learning does not need labelling the dataset before training and is ideal for low-cost deep learning hardware implementation [174]. One of the most difficult tasks for distribution networks is providing clients with high-quality and dependable electricity. Self-healing control techniques are important for a smart distribution grid to meet these needs, whereas unsupervised methods will be the best choice for managing and controlling smart grids in real-time [173].
Ambient assisted living (AAL) refers to services and products that help older persons maintain their physical independence. Indeed, the present rise in life expectancy has become a public health concern, particularly in industrialized nations, and the majority of recent technology developments are being utilized to create smart settings to aid the elderly [175]. Generally, AAL entails employing a certain kind of sensors, such as wearables or ambient sensors to monitor a specific parameter of activity, such as physiological signals or motions, and making relevant decisions or suggestions (e.g. monitoring the health deterioration in long-term or producing alerts for short-term intervention) [176]. Alcalá et al. [177] proposed a new method for monitoring the elderly's activities to identify deviations in their daily routine. The results demonstrated greater sensitivity to pattern deviations and decreased susceptibility to false alarms brought on by extended periods of inactivity. Additionally, a family home is shown as an example of a setting where a strict schedule is adhered to in order to illustrate its usefulness in cases where there are declines and deviations, most often due to elderly disorders problems but not always. Flexibility, low-cost, widespread availability, and capacity to collect data over time are the primary benefits of applications [175].
The home energy management system (HEMS) has been studied extensively despite being the least important part of the urban energy internet. HEMS stands for the energy management system, and it is made up of sensors, the Internet, intelligent switches, and wireless transmission [178]. If a house has access to renewable energy sources and/or storage, HEMS should arrange the use of electrical appliances and the electric energy flow to maximise efficiency. While it's vital to divide home electronics into two categories, deferrable and non-deferrable appliances. Equipment like lights, stoves, and freezers fall into the former category since their use cannot be postponed. The latter category comprises appliances like washers and dryers, water pumps, and so on, the amount of time they are used varies depending on the cost of energy. Electric usage should also be evaluated, and appliances needing high energy consumption should be given more scheduling priority. The turn-on and turn-off timings of appliances, as well as their time length are critical characteristics for appliance scheduling [175]. As a result, it can offer electrical management and power consumption analysis services, as well as optimise home energy efficiency while concentrating on home comfort, which may help to solve global energy and environmental concerns [178].
The popularity and rise of EVs haves reduced pollution, but has also had negative consequences, such as increasing peak demand on the grid. However, DR by EVs helps to enhance peak shaving and valley filling effects, as well as lessen the possibility of load-shedding on the grid side [179]. NILM models can be used in EVs either in households or electric charging stations.
Residentially, the statistical parameters of the EV's charging pattern, including charging start time, charging finish time, and charge length, are examined, and the flexibility in DR of the EV's charging load is assessed [179]. Sun et al. [180] presented an EV-assisted battery load concealment approach with NILM-based to minimise the costs for battery procurement and installation while keeping consumers’ privacy leaks within an acceptable range. Wang et al. [181] demonstrated a deep learning based NILM for load recognition and controllability of EV charging stations. The convenience of calling for an EV charging station is improved by a collaborative design that takes into account both the power consumption patterns of load clusters and those of single loads. However, there are several problems in the connection of EV cluster to grid. First, there is an equal amount in charging power amongst EV charging stations, making classification, and clustering challenging. Moreover, EV charging stations experience both predictable and unpredictable charging volumes, which might cause the supervised learning algorithm to deviate from its intended course [181].
The United States Naval intends to manage future navy ships intelligently with fewer crew members, which will be substantially more sophisticated than today's ships. Meanwhile, as the number of components on board grows, load monitoring becomes one of the most critical considerations in the functioning of shipboard systems. Because certain future navy shipboard loads may exhibit unique power consumption patterns (e.g., pulsed loads), an effective load monitoring technique that can actively monitor all types of loads in real-time without triggering any false fault detection is required [182]. Lindahl et al. [183] demonstrated a method for fault identification and isolation in NILM. The USCGC SPENCER has two NILMs installed in its engine room, each monitoring bulk power for a total of 19 loads. The NILM uses a neural network classification method to segment this power data by load, then returns several metrics that are useful for identifying and solving problems. Moreover, investigation of metric space in relation to faults reported in the ship's wastewater system demonstrates that these metrics give adequate information for accurate detection and identification of fault types. These auto-generated measurements might eventually be paired with sophisticated clustering techniques for completely automatic fault detection and identification. Senemmar et al. [182] demonstrated the transformation of discrete wavelet. In a two-zone medium voltage direct current (MVDC) shipboard power system, a CNN model was created for NILM. The 12 kV two-zone MVDC network in the model is powered by a pair of 36 MVA AC generators. Each zone includes five sorts of loads: motor, pulsed load, hotel load, radar, and propulsion load. The findings reveal that the behaviour of a pulsed load is similar to that of a fault in MVDC systems, hence it is crucial to carefully monitor these types of loads to avoid activating any fault avoidance methods. More significantly, the suggested approach might identify critical loads such as pulsed loads reliably in future shipboard systems.
Photovoltaic (PV) systems, energy storage systems, wind turbines, and EVs are all examples of distributed energy resources (DER), which are small-scale, embedded generators. Electric heating, air conditioning systems, combined heat and power plants, and other smart loads and low-carbon technologies are also considered DER. DER are critical enabling technologies for the evolution of the electric power sector away from the use of polluting fossil fuels [184]. Wang et al. [185] suggested a novel three-stage regional-NILM approach for determining the states of various sorts of loads in an area by disaggregating substation demand. Traditional loads, distributed generation such as PVs, and flexible loads such as EVs are the three categories of loads. The suggested technique anticipates conventional load first using long-term historical data and then employs spectral analysis to improve the signal-to-noise proportion. The PV capacity is then calculated by running a peak coincidence analysis on negative residuals and local solar irradiance data. Finally, a unique restricted activation matching pursuit approach is suggested for estimating EVs states such as the total EVs load and the number of EVs. Regional NILM offers a cost-effective method for distribution network operators to understand the status of the network. Therefore, it may considerably improve network visibility without needing costly monitoring and data privacy problems can be avoided.
The consideration of the implementation standards before modelling is essential to achieving the necessary efficiency in NILM systems. It is tough to consider one model from the current studies as accurate due to the natural variation of loads and the geographic environment in each building. Criteria that need to be considered are load types, scalability, climate, complexity, and operation time.
Load types: Analysing and investigating the type of load is crucial for it needs diligent facilitation on predicting what will occur in the stages of NILM. A high sampling rate will assist to classify Type-III loads when the signal varies each second. In contrast, selecting a low frequency will be sufficient for Type-I and Type-II which give constant changes in the waveforms and provides several preferences such as data size and cost. NILM system faces difficulty to classify similar loads which exists in commercial buildings, in which high frequency does not only assist to increase the accuracy of classification but also choosing the right features is necessary to obtain high precision. To illustrate, Non-linear loads have high harmonics and can be selected as features, as well as resistive loads can use active power as a single feature due to lack of reactive power in these loads. Studying the loads will save more time and minimize the errors in the model later.
Scalability: Identifying the number of appliances that can reach 10 and above in the residential buildings and more than 50 loads in the commercial buildings cause some challenges which transmit similarity in the signals. A high sampling rate is a selective choice due to the huge number which will lead overlapping in several loads, thus, accurate analysis is needed to obtain the distance of signals between the loads, whereas low sampling will bring out some missing points in the data. Moreover, supervised methods will be impacted and will take more time for training due to the number of classes, while unsupervised approaches will solve this problem.
Climate: The geographical location also plays a crucial role to increase the classification based on the features. There is a lack of research on non-traditional features such as temperature, humidity, and light sensors. Sometimes electrical features are not sufficient to grant the best data for the classifier. Adding these kinds of features in the hottest places will enhance the NILM system and can easily identify peak hours and decrease energy load as a result of supply restrictions. Heating and cooling loads consume high energy as well as these loads are under Type-III loads which non-traditional features will assist to enhance the NILM system.
Operation time: Residential building loads might be on/off at any time due to no specific time to classify them while commercial building loads run at the same time on weekdays. By detecting the change points in the power consumption will grant the consumers the display of two things either detecting the on/off events (event-based) or state-based which detects each sample that consumes in the building. Selecting eventless methods to detect the patterns of commercial loads will be more useful than event-based methods as the operation time is known. On/off events methods is preferable in the residential building which has known loads and less usage, and each load varies from the others which gives a unique signal with no overlap and minimizes the reading of data.
Complexity: Increasing the intricacy will escalate the cost and it becomes more computational and this involved AI algorithms and optimization methods. Adding two stages of classification including optimization might consume more time for supervised approaches to be trained. In addition, several models are designed to add the new appliances' signals to the database when the NILM system captures a new signature in the aggregate power by labelling the new load manually or automatically through unsupervised methods.
New appliances and flexibility: Supervised algorithms must be trained to disaggregate the appliances to achieve high accuracy and when adding new appliances to the household, the model should be re-trained to capture the new signals which cause the model to consume more time per training, hence making it unaffordable for the consumers. However, labelling data is not crucial for unsupervised algorithms. The model can learn automatically and be independent in training. The performance is less with the unsupervised methods but grants flexibility in training with new appliances and gives less implementation cost for users.
Ideal NILM model and suitability: the NILM system vary in performance from one household to another due to the variations in loads of houses as well as the NILM implementation for commercial buildings is non-compatible with the system that is designed for residential buildings. However, the products of NILM must be discerned for residential or commercial use. The products of the NILM system need to be compatible with all households and perform equally and efficiently with different aspects. Moreover, the suitability of the product with all houses may be complicated and expensive for the company but will grant reliable product and high specification.
Data storage and complexity: the complexity of data storage, transport, and processing rises dramatically for a high sampling rate as compared to a low sampling rate. The cost of installing NILM with a high frequency is expensive but grants an efficient system for monitoring the appliances Moreover, the model needs to be affordable for the users and preferable to use a low sampling rate with accurate performance. A high sampling rate is not currently considered as a realistic alternative for large-scale applications.
Scalability and similarity in loads: limited size of the number of appliances in NILM may lead to non-scalability whereas increasing the number of classes will decrease the accuracy of load disaggregation. In addition, the similarity of appliances brings a wrong performance due to the equal power usage in which the signatures overlap. Commercial buildings face the equality of power usage for several loads; hence, equal loads require a high-sampling rate to avoid signal overlap which provides the transient state features.
This paper gives the framework on how to implement non-intrusive load monitoring in households, as well as their techniques together with related advantages and disadvantages. Several drawbacks exist, including identifying low power and variable appliances for low and high frequencies, as well as overlapping appliance signatures which can be a huge challenge for classifiers that should detect each appliance of the household. In comparison with ILM, NILM outperform many aspects in terms of installation, operation, and maintenance which can be an efficient option for at a lower cost. The main contributions of this article provided an overview of NILM's implementation, addressing the stages of NILM and advancements in the field. The overview explored the various techniques, methodologies, and algorithms employed in NILM systems to achieve load identification and energy disaggregation. Moreover, the limitations, applications, and recommended criteria for the implementation of NILM were highlighted as a contribution to the field of load disaggregation.
In the first stage of NILM, data collection is to be considered for the next stages, which is a crucial step to identify the loads with high accuracy. The selection of the sampling rate depends on the extracted features that will be used in the model whereas some features cannot be adapted with some loads due to each device having a unique pattern and needing to be observed to set the best features. Choosing a low frequency facilitates computing, cost, and installation as well Type I and Type II which can be detected based on steady state. When compared to that, high frequency is difficult to operate due to the high cost, and the complexity of the model, instead of that it can investigate the signature of the load easily and study the transient events based on the transient state. A high sampling rate may detect Type III due to the fluctuation in the signal and more events. Low power loads such as electronics are difficult to be detected for both sampling rates but easy to use high frequency and low frequency to detect high power appliances to classify them.
Feature extraction is the most important of the stages in NILM, which can bring a decisive accuracy for the classifiers. Classifiers may misclassify the appliances due to the low power loads or similarity in the signatures. Loads need to be observed and studies on each load needs to carry out before choosing the suitable features. It can be selected as the real power feature if the loads have resistance, as well as setting reactive power as a feature if having a capacitance or inductance which makes the appliances non-overlapped in the signal. Moreover, harmonics can be used with non-linear loads because they generate high harmonics. Choosing the wrong features leads to poor results, thus making it difficult to classify correctly for the loads. Moreover, causes of increasing the complication of the model come from the incorporating features that increase the dimensionality of the model.
AI approaches becomes a source of interest because they can classify appliances with satisfactory accuracy. Unsupervised methods may adjust to changes in the NILM system over some time without training dataset and huge computing, but that leads to insufficient accuracy due to inability to recognise the appliances correctly, thus more time is needed to learn and detect the fault. At present, there has been much more focus on developing a technique based on supervised learning. These methods show a good adaptation to patterns of appliances to detect them, which it can facilitate when applying high precision to the NILM system. Training the classifier for the monitoring brings out a high recognition in the classification especially in the case of deep learning, in which it has proven its efficiency to classify the appliances and only missing a slight percentage of classification.
The evaluation of NILM techniques is essential to show how the method is more efficient and capable of classifying the appliances individually. The public datasets for residential and commercial buildings have been provided for all types of loads and the researchers can test the model with either high or low frequencies and various features to be selected for the real model.
This research was funded under Fundamental Research Grant Scheme - FRGS/1/2020/TK0/UPNM/03/3 by the Ministry of Higher Education Malaysia.
- Putrajaya, Malaysia, 2020, https://meih.st.gov.my/
- ,
Comparison of linear regression and artificial neural networks models to predict heating and cooling energy demand, energy consumption and CO 2 emissions ,Energy , Vol. 118 ,pp 24–36 , 2017, https://doi.org/https://doi.org/10.1016/j.energy.2016.12.022 - ,
2020 Global status report executive summary of the 2020 global status report for buildings and construction ,United Nations Environment Programme ,pp 1–7 , 2020 - Energy Technology Perspectives 2020, IEAParis, 2020, https://www.iea.org/reports/energy-technology-perspectives-2020
- World Energy Balances 2020, IEAParis, 2020, https://www.iea.org/data-and-statistics/data-product/world-energy-balances
- ,
NILM-based approach for energy efficiency assessment of household appliances ,Energy Informatics , Vol. 3 (1),pp 10 , 2020, https://doi.org/https://doi.org/10.1186/s42162-020-00131-7 - ,
Residential loads flexibility potential for demand response using energy consumption patterns and user segments ,Appl Energy , Vol. 254 ,pp 113693 , 2019, https://doi.org/https://doi.org/10.1016/j.apenergy.2019.113693 - ,
Application of load monitoring in appliances’ energy management – A review ,Renewable and Sustainable Energy Reviews , Vol. 67 ,pp 235–245 , 2017, https://doi.org/https://doi.org/10.1016/j.rser.2016.09.064 - ,
Non-intrusive load monitoring using artificial intelligence classifiers: Performance analysis of machine learning techniques ,Electric Power Systems Research , Vol. 198 ,pp 107347 , 2021, https://doi.org/https://doi.org/10.1016/j.epsr.2021.107347 - ,
Nonintrusive appliance load monitoring ,Proceedings of the IEEE , Vol. 80 (12),pp 1870–1891 , 1992, https://doi.org/https://doi.org/10.1109/5.192069 - ,
Multi-label LSTM autoencoder for non-intrusive appliance load monitoring ,Electric Power Systems Research , Vol. 199 ,pp 107414 , 2021, https://doi.org/https://doi.org/10.1016/j.epsr.2021.107414 - ,
An Overview of Non-Intrusive Load Monitoring: Approaches, Business Applications, and Challenges ,2018 International Conference on Power System Technology (POWERCON), IEEE ,pp 4291–4299 , 2018, https://doi.org/https://doi.org/10.1109/POWERCON.2018.8601534 - ,
Non-intrusive Load Composition Estimation from Aggregate ZIP Load Models using Machine Learning ,International Journal of Electrical Power & Energy Systems , Vol. 105 ,pp 191–200 , 2019, https://doi.org/https://doi.org/10.1016/j.ijepes.2018.08.016 - ,
Load modelling and non-intrusive load monitoring to integrate distributed energy resources in low and medium voltage networks ,Renewable Energy , Vol. 179 ,pp 445–466 , 2021, https://doi.org/https://doi.org/10.1016/j.renene.2021.07.056 - ,
Data-driven energy prediction modeling for both energy efficiency and maintenance in smart manufacturing systems ,Energy , Vol. 238 ,pp 121691 , 2022, https://doi.org/https://doi.org/10.1016/j.energy.2021.121691 - ,
NILM Dashboard: A Power System Monitor for Electromechanical Equipment Diagnostics ,IEEE Trans Industr Inform , Vol. 15 (3),pp 1405–1414 , 2019, https://doi.org/https://doi.org/10.1109/TII.2018.2843770 - ,
Non-Intrusive Load Monitoring (NILM) – A Recent Review with Cloud Computing ,2019 IEEE International Conference on Smart Instrumentation, Measurement and Application (ICSIMA), IEEE ,pp 1–6 , 2019, https://doi.org/https://doi.org/10.1109/ICSIMA47653.2019.9057316 - ,
Toward smart energy user: Real time non-intrusive load monitoring with simultaneous switching operations ,Appl Energy , Vol. 287 ,pp 116616 , 2021, https://doi.org/https://doi.org/10.1016/j.apenergy.2021.116616 - ,
Smart non-intrusive appliance identification using a novel local power histogramming descriptor with an improved k-nearest neighbors classifier ,Sustain Cities Soc , Vol. 67 ,pp 102764 , 2021, https://doi.org/https://doi.org/10.1016/j.scs.2021.102764 - ,
Nonintrusive load monitoring (NILM) using an Artificial Neural Network in embedded system with low sampling rate ,2016 13th International Conference on Electrical Engineering/Electronics, Computer, Telecommunications and Information Technology (ECTI-CON), IEEE ,pp 1–4 , 2016, https://doi.org/https://doi.org/10.1109/ECTICon.2016.7561398 - ,
An electrical load measurements dataset of United Kingdom households from a two-year longitudinal study ,Sci Data , Vol. 4 (1),pp 160122 , 2017, https://doi.org/https://doi.org/10.1038/sdata.2016.122 - ,
Non-Intrusive Load Monitoring: A Review and Outlook , 2016, https://doi.org/https://doi.org/10.48550/arXiv.1610.01191 - ,
Non-Intrusive Load Monitoring Approaches for Disaggregated Energy Sensing: A Survey ,Sensors , Vol. 12 (12),pp 16838–16866 , 2012, https://doi.org/https://doi.org/10.3390/s121216838 - ,
Energy management using non-intrusive load monitoring techniques – State-of-the-art and future research directions ,Sustain Cities Soc , Vol. 62 ,pp 102411 , 2020, https://doi.org/https://doi.org/10.1016/j.scs.2020.102411 - ,
A generative model for non-Intrusive load monitoring in commercial buildings ,Energy Build , Vol. 177 ,pp 268–278 , 2018, https://doi.org/https://doi.org/10.1016/j.enbuild.2018.07.060 - ,
Practical limits to the use of non-intrusive load monitoring in commercial buildings ,Energy Build , Vol. 251 , 2021, https://doi.org/https://doi.org/10.1016/j.enbuild.2021.111308 - ,
A survey of methods for time series change point detection ,Knowl Inf Syst , Vol. 51 (2),pp 339–367 , 2017, https://doi.org/https://doi.org/10.1007/s10115-016-0987-z - ,
A non-intrusive load monitoring approach for very short-term power predictions in commercial buildings ,Appl Energy , Vol. 292 , 2021, https://doi.org/https://doi.org/10.1016/j.apenergy.2021.116860 - ,
A comparison of non-intrusive load monitoring methods for commercial and residential buildings , 2014, https://doi.org/https://doi.org/10.48550/arXiv.1408.6595 - ,
Performance evaluation in non-intrusive load monitoring: Datasets, metrics, and tools—A review ,Wiley Interdiscip Rev Data Min Knowl Discov , Vol. 8 (6),pp e1265 , 2018, https://doi.org/https://doi.org/10.1002/widm.1265 - ,
dsCleaner: A python library to clean, preprocess and convert non-instrusive load monitoring datasets ,Data (Basel) , Vol. 4 (3),pp 123 , 2019, https://doi.org/https://doi.org/10.3390/data4030123 - ,
A critical review of state-of-the-art non-intrusive load monitoring datasets ,Electric Power Systems Research , Vol. 192 ,pp 106921 , 2020, https://doi.org/https://doi.org/10.1016/j.epsr.2020.106921 - ,
Smart*: An Open Data Set and Tools for Enabling Research in Sustainable Homes ,SustKDD 111 , Vol. 201 (112),pp 108 , - ,
It’s different: Insights into home energy consumption in India ,Proceedings of the 5th ACM Workshop on Embedded Systems For Energy-Efficient Buildings ,pp 1–8 , 2013, https://doi.org/https://doi.org/10.1145/2528282.2528293 - ,
An electrical load measurements dataset of United Kingdom households from a two-year longitudinal study ,Sci Data , Vol. 4 (1),pp 1–12 , 2017, https://doi.org/https://doi.org/10.1038/sdata.2016.122 - ,
GREEND: An energy consumption dataset of households in Italy and Austria ,2014 IEEE International Conference on Smart Grid Communications (SmartGridComm), IEEE ,pp 511–516 , 2014, https://doi.org/https://doi.org/10.1109/SmartGridComm.2014.7007698 - , Classifying Office Plug Load Appliance Events in the context of NILM using Time-series Data Mining, Proceedings of the 12th REHVA World Congress and CLImA, Aalborg, DenmarN, 2016
- ,
RAE: The rainforest automation energy dataset for smart grid meter data analysis ,Data (Basel) , Vol. 3 (1),pp 8 , 2018, https://doi.org/https://doi.org/10.3390/data3010008 - ,
The ECO data set and the performance of non-intrusive load monitoring algorithms ,Proceedings of the 1st ACM conference on embedded systems for energy-efficient buildings ,pp 80–89 , 2014, https://doi.org/https://doi.org/10.1145/2674061.2674064 - , Pecan Street Inc.: A Test-bed for NILM, International Workshop on Non-Intrusive Load Monitoring, 2012
- ,
On the accuracy of appliance identification based on distributed load metering data ,2012 Sustainable Internet and ICT for Sustainability (SustainIT), IEEE ,pp 1–9 , 2012 - ,
Appliance consumption signature database and recognition test protocols ,2013 8th International Workshop on Systems, Signal Processing and their Applications (WoSSPA), IEEE ,pp 336–341 , 2013, https://doi.org/https://doi.org/10.1109/WoSSPA.2013.6602387 - ,
A comparison of non-intrusive load monitoring methods for commercial and residential buildings , 2014 - ,
Electricity, water, and natural gas consumption of a residential house in Canada from 2012 to 2014 ,Sci Data , Vol. 3 (1),pp 1–12 , 2016, https://doi.org/https://doi.org/10.1038/sdata.2016.37 - ,
CU-BEMS, smart building electricity consumption and indoor environmental sensor datasets ,Sci Data , Vol. 7 (1),pp 1–14 , 2020, https://doi.org/https://doi.org/10.1038/s41597-020-00582-3 - ,
Data descriptor: I-BLEND, a campus-scale commercial and residential buildings electrical energy dataset ,Sci Data , Vol. 6 (1),pp 1–12 , 2019, https://doi.org/https://doi.org/10.1038/sdata.2019.15 - ,
Electrical-end-use data from 23 houses sampled each minute for simulating micro-generation systems ,Appl Therm Eng , Vol. 114 ,pp 1449–1456 , 2017, https://doi.org/https://doi.org/10.1016/j.applthermaleng.2016.07.133 - ,
Loced: Location-aware energy disaggregation framework ,Proceedings of the 2nd acm international conference on embedded systems for energy-efficient built environments ,pp 45–54 , 2015, https://doi.org/https://doi.org/10.1145/2821650.2821659 - ,
The enertalk dataset, 15 hz electricity consumption data from 22 houses in Korea ,Sci Data , Vol. 6 (1),pp 1–13 , 2019, https://doi.org/https://doi.org/10.1038/s41597-019-0212-5 - , REDD : A Public Data Set for Energy Disaggregation Research, Workshop on data mining applications in sustainability (SIGKDD), San Diego, CA, 2011
- , BLUED : A Fully Labeled Public Dataset for Event-Based Non-Intrusive Load Monitoring Research, Proceedings of the 2nd KDD Workshop on Data Mining Applications in Sustainability (SustKDD), 2012
- ,
The UK-DALE dataset, domestic appliance-level electricity demand and whole-house demand from five UK homes ,Sci Data , Vol. 2 (1),pp 1–14 , 2015, https://doi.org/https://doi.org/10.1038/sdata.2015.7 - ,
COOLL: Controlled On/Off Loads Library, a Public Dataset of High-Sampled Electrical Signals for Appliance Identification ,pp 1–5 , 2016 - ,
WHIETED - A Worldwide Household and Industry Transient Energy Data Set ,3rd International Workshop on Non-Intrusive Load Monitoring ,pp 1–4 , 2016 - ,
BLOND, a building-level office environment dataset of typical electrical appliances ,Sci Data , Vol. 5 (1),pp 1–14 , 2018, https://doi.org/https://doi.org/10.1038/sdata.2018.48 - ,
HELD1: Home Equipment Laboratory Dataset for Non-Intrusive Load Monitoring ,SIGNAL 2018 : The Third International Conference on Advances in Signal, Image and Video Processing ,pp 15–20 , 2018 - ,
Designing a novel dataset for non-intrusive load monitoring ,2018 VIII Brazilian Symposium on Computing Systems Engineering (SBESC) ,pp 243–249 , 2018, https://doi.org/https://doi.org/10.1109/SBESC.2018.00045 - ,
PLAID: A public dataset of high-resolution electrical appliance measurements for load identification research ,proceedings of the 1st ACM Conference on Embedded Systems for Energy-Efficient Buildings ,pp 198–199 , 2014, https://doi.org/https://doi.org/10.1145/2674061.2675032 - ,
SmartSim: A device-accurate smart home simulator for energy analytics ,2016 IEEE International Conference on Smart Grid Communications (SmartGridComm), IEEE ,pp 686–692 , 2016, https://doi.org/https://doi.org/10.1109/SmartGridComm.2016.7778841 - ,
AMBAL: Realistic load signature generation for load disaggregation performance evaluation ,2017 ieee international conference on smart grid communications (smartgridcomm), IEEE ,pp 443–448 , 2018, https://doi.org/https://doi.org/10.1109/SmartGridComm.2017.8340657 - ,
A generative model for non-Intrusive load monitoring in commercial buildings ,Energy Build , Vol. 177 ,pp 268–278 , 2018, https://doi.org/https://doi.org/10.1016/j.enbuild.2018.07.060 - ,
A synthetic energy dataset for non-intrusive load monitoring in households ,Sci Data , Vol. 7 (1),pp 1–17 , 2020, https://doi.org/https://doi.org/10.1038/s41597-020-0434-6 - ,
NILM-Synth: Synthetic Dataset Generation for Non-Intrusive Load Monitoring Algorithms ,2022 IEEE Power & Energy Society Innovative Smart Grid Technologies Conference (ISGT), IEEE ,pp 1–6 , 2022, https://doi.org/https://doi.org/10.1109/ISGT50606.2022.9817461 - ,
Machine learning approaches for non-intrusive load monitoring: from qualitative to quantitative comparation ,Artif Intell Rev , Vol. 52 (1),pp 217–243 , 2019, https://doi.org/https://doi.org/10.1007/s10462-018-9613-7 - ,
AMPds: A public dataset for load disaggregation and eco-feedback research ,2013 IEEE electrical power & energy conference, IEEE ,pp 1–6 , 2013, https://doi.org/https://doi.org/10.1109/EPEC.2013.6802949 - ,
Prospects of Appliance-Level Load Monitoring in Off-the-Shelf Energy Monitors: A Technical Review ,Energies (Basel) , Vol. 11 (1),pp 189 , 2018, https://doi.org/https://doi.org/10.3390/en11010189 - ,
Review of results on smart‐meter privacy by data manipulation, demand shaping, and load scheduling ,IET Smart Grid , Vol. 3 (5),pp 605–613 , 2020, https://doi.org/https://doi.org/10.1049/iet-stg.2020.0129 - ,
Review of Non-intrusive Load Appliance Monitoring ,2018 IEEE 3rd Advanced Information Technology, Electronic and Automation Control Conference (IAEAC), IEEE ,pp 18–23 , 2018, https://doi.org/https://doi.org/10.1109/IAEAC.2018.8577910 - ,
Review of NILM applications in smart grids: power quality assessment and assisted independent living ,2020 Argentine Conference on Automatic Control (AADECA), IEEE ,pp 1–6 , 2020, https://doi.org/https://doi.org/10.23919/AADECA49780.2020.9301641 - ,
Improving Energy Disaggregation Performance Using Appliance-Driven Sampling Rates ,2019 27th European Signal Processing Conference (EUSIPCO), IEEE ,pp 1–5 , 2019, https://doi.org/https://doi.org/10.23919/EUSIPCO.2019.8902978 - ,
Non-intrusive load monitoring system performance over a range of low frequency sampling rates ,2017 IEEE 6th International Conference on Renewable Energy Research and Applications (ICRERA), IEEE ,pp 505–509 , 2017, https://doi.org/https://doi.org/10.1109/ICRERA.2017.8191111 - ,
Low Cost Disaggregation of Smart Meter Sensor Data ,IEEE Sens J , Vol. 16 (6),pp 1665–1673 , 2016, https://doi.org/https://doi.org/10.1109/JSEN.2015.2501422 - ,
Non-intrusive load monitoring through home energy management systems: A comprehensive review ,Renewable and Sustainable Energy Reviews , Vol. 79 ,pp 1266–1274 , 2017, https://doi.org/https://doi.org/10.1016/j.rser.2017.05.096 - ,
Performance Analysis of Similar Appliances Identification using NILM Technique under Different Data Sampling Rates ,Proceedings of the 5th International Workshop on Non-Intrusive Load Monitoring ,pp 79–83 , 2020, https://doi.org/https://doi.org/10.1145/3427771.3427858 - ,
On the Relationship between Sampling Rate and Hidden Markov Models Accuracy in Non-Intrusive Load Monitoring ,In Irish Conference on Artificial Intelligence and Cognitive Science (AICS) ,pp 180–192 , 2017 - ,
Residential Electrical Load Monitoring and Modeling – State of the Art and Future Trends for Smart Homes and Grids ,Electric Power Components and Systems , Vol. 48 (11),pp 1125–1143 , 2020, https://doi.org/https://doi.org/10.1080/15325008.2020.1834019 - ,
A new event detection technique for residential load monitoring ,2018 18th International Conference on Harmonics and Quality of Power (ICHQP), IEEE ,pp 1–6 , 2018, https://doi.org/https://doi.org/10.1109/ICHQP.2018.8378820 - ,
High accuracy event detection for Non-Intrusive Load Monitoring ,2017 IEEE International Conference on Acoustics, Speech and Signal Processing (ICASSP), IEEE ,pp 2452–2456 , 2017, https://doi.org/https://doi.org/10.1109/ICASSP.2017.7952597 - ,
An Automatic State Detection Algorithm for Non-intrusive Load Monitoring ,2019 IEEE 16th India Council International Conference (INDICON), IEEE ,pp 1–4 , 2019, https://doi.org/https://doi.org/10.1109/INDICON47234.2019.9030372 - ,
Non-Intrusive Load Monitoring: A Computationally Efficient Hybrid Event Detection Algorithm ,2020 IEEE International Conference on Power and Energy (PECon), IEEE ,pp 304–308 , 2020, https://doi.org/https://doi.org/10.1109/PECon48942.2020.9314442 - ,
Low Complexity Event Detection Algorithm for Non- Intrusive Load Monitoring Systems ,2018 IEEE Innovative Smart Grid Technologies - Asia (ISGT Asia), IEEE ,pp 746–751 , 2018, https://doi.org/https://doi.org/10.1109/ISGT-Asia.2018.8467919 - ,
Event Detection in NILM using Cepstrum smoothing ,3rd International Workshop on Non-Intrusive Load Monitoring ,pp 1–4 , 2016 - ,
Comprehensive feature selection for appliance classification in NILM ,Energy Build , Vol. 151 ,pp 98–106 , 2017, https://doi.org/https://doi.org/10.1016/j.enbuild.2017.06.042 - ,
Instantaneous active and reactive load signature applied in non‐intrusive load monitoring systems ,IET Smart Grid , Vol. 4 (1),pp 121–133 , 2021, https://doi.org/https://doi.org/10.1049/stg2.12008 - ,
An Empirical Investigation of V-I Trajectory Based Load Signatures for Non-Intrusive Load Monitoring ,IEEE Trans Smart Grid , Vol. 5 (2),pp 870–878 , 2014, https://doi.org/https://doi.org/10.1109/TSG.2013.2271282 - ,
A New Set of Steady-State and Transient Features for Power Signature Analysis Based on V-I Trajectory ,2019 IEEE PES Innovative Smart Grid Technologies Conference - Latin America (ISGT Latin America), IEEE ,pp 1–6 , 2019, https://doi.org/https://doi.org/10.1109/ISGT-LA.2019.8895360 - ,
Impact of supply voltage variation on V-I trajectory identification method ,2017 Nineteenth International Middle East Power Systems Conference (MEPCON), IEEE ,pp 839–844 , 2017, https://doi.org/https://doi.org/10.1109/MEPCON.2017.8301277 - ,
Appliances identification method of non-intrusive load monitoring based on load signature of V-I trajectory ,2015 International Conference on Information Technology Systems and Innovation (ICITSI), IEEE ,pp 1–6 , 2015, https://doi.org/https://doi.org/10.1109/ICITSI.2015.7437744 - ,
Non-Intrusive Load Monitoring Based on Feature Extraction of Change-point and XGBoost Classifier ,2020 IEEE 4th Conference on Energy Internet and Energy System Integration (EI2), IEEE ,pp 2652–2656 , 2020, https://doi.org/https://doi.org/10.1109/EI250167.2020.9347014 - ,
An overview of Non-intrusive load monitoring methodologies ,2015 IEEE Conference on Energy Conversion (CENCON), IEEE ,pp 54–59 , 2015, https://doi.org/https://doi.org/10.1109/CENCON.2015.7409513 - ,
Non-intrusive load monitoring based on low frequency active power measurements ,AIMS Energy , Vol. 4 (3),pp 414–443 , 2016, https://doi.org/https://doi.org/10.3934/energy.2016.3.414 - ,
Non-intrusive load monitoring by using active and reactive power in additive Factorial Hidden Markov Models ,Appl Energy , Vol. 208 ,pp 1590–1607 , 2017, https://doi.org/https://doi.org/10.1016/j.apenergy.2017.08.203 - ,
Basic Summary of Non-intrusive Load Monitoring ,2019 IEEE 10th International Conference on Software Engineering and Service Science (ICSESS), IEEE ,pp 1–5 , 2019, https://doi.org/https://doi.org/10.1109/ICSESS47205.2019.9040726 - ,
Machine Allocation via Pattern Recognition in Harmonic Waves of Manufacturing Plants ,Procedia CIRP , Vol. 67 ,pp 69–74 , 2018, https://doi.org/https://doi.org/10.1016/j.procir.2017.12.178 - ,
Non-intrusive load monitoring based on harmonic characteristics ,Procedia Comput Sci , Vol. 183 ,pp 776–782 , 2021, https://doi.org/https://doi.org/10.1016/j.procs.2021.02.128 - ,
Household appliance classification using lower odd-numbered harmonics and the bagging decision tree ,IEEE Access , Vol. 8 ,pp 55937–55952 , 2020, https://doi.org/https://doi.org/10.1109/ACCESS.2020.2981969 - ,
Impact of supply voltage variation on V-I trajectory identification method ,2017 Nineteenth International Middle East Power Systems Conference (MEPCON), IEEE ,pp 839–844 , 2017, https://doi.org/https://doi.org/10.1109/MEPCON.2017.8301277 - ,
Non-Intrusive Load Monitoring Based on Novel Transient Signal in Household Appliances with Low Sampling Rate ,Energies (Basel) , Vol. 11 (12),pp 3409 , 2018, https://doi.org/https://doi.org/10.3390/en11123409 - ,
A Scalable Real-Time Non-Intrusive Load Monitoring System for the Estimation of Household Appliance Power Consumption ,Energies (Basel) , Vol. 14 (3),pp 767 , 2021, https://doi.org/https://doi.org/10.3390/en14030767 - ,
Research on Non-Intrusive Load Monitoring Based on Random Forest Algorithm ,2020 4th International Conference on Smart Grid and Smart Cities (ICSGSC), IEEE ,pp 1–5 , 2020, https://doi.org/https://doi.org/10.1109/ICSGSC50906.2020.9248565 - ,
Multi-level non-intrusive load identification based on k-NN ,2019 IEEE 3rd Conference on Energy Internet and Energy System Integration (EI2), IEEE ,pp 1905–1910 , 2019, https://doi.org/https://doi.org/10.1109/EI247390.2019.9061896 - ,
New Time-Frequency Transient Features for Nonintrusive Load Monitoring ,Energies (Basel) , Vol. 14 (5),pp 1437 , 2021, https://doi.org/https://doi.org/10.3390/en14051437 - ,
Non-Intrusive Load Monitoring Using Current Shapelets ,Applied Sciences , Vol. 9 (24),pp 5363 , 2019, https://doi.org/https://doi.org/10.3390/app9245363 - ,
Machine learning approaches for non-intrusive load monitoring: from qualitative to quantitative comparation ,Artif Intell Rev , Vol. 52 (1),pp 217–243 , 2019, https://doi.org/https://doi.org/10.1007/s10462-018-9613-7 - ,
Analysis of the influence of the definition of the interior dwelling temperature on the characterization of the heat loss coefficient via on-board monitoring ,Energy Build , Vol. 215 ,pp 109860 , 2020, https://doi.org/https://doi.org/10.1016/j.enbuild.2020.109860 - ,
A Smart Home Energy Management System Using Two-Stage Non-Intrusive Appliance Load Monitoring over Fog-Cloud Analytics Based on Tridium’s Niagara Framework for Residential Demand-Side Management ,Sensors , Vol. 21 (8),pp 2883 , 2021, https://doi.org/https://doi.org/10.3390/s21082883 - ,
Recent Advances in Algorithms for Energy Disaggregation ,In the behavior energy and climate change (BECC) Conference ,pp 1–29 , 2011, https://doi.org/https://doi.org/10.4159/harvard.9780674062924.c3 - ,
Non Intrusive Load Monitoring (NILM): A State of the Art ,Advances in Intelligent Systems and Computing ,pp 125–138 , 2018, https://doi.org/https://doi.org/10.1007/978-3-319-61578-3_12 - ,
Non-Intrusive Load Monitoring using Feed Forward Neural Network ,2019 IEEE Innovative Smart Grid Technologies - Asia (ISGT Asia), IEEE ,pp 4065–4069 , 2019, https://doi.org/https://doi.org/10.1109/ISGT-Asia.2019.8880801 - ,
A New Method for the Nonintrusive Load Monitoring Based on BP Neural Network ,2017 2nd International Conference on Multimedia and Image Processing (ICMIP), IEEE ,pp 93–97 , 2017, https://doi.org/https://doi.org/10.1109/ICMIP.2017.55 - ,
Non-Intrusive Electrical Appliances Monitoring and Classification using K-Nearest Neighbors ,2019 2nd International Conference on Innovation in Engineering and Technology (ICIET), IEEE ,pp 1–5 , 2019, https://doi.org/https://doi.org/10.1109/ICIET48527.2019.9290671 - ,
A Supervised Learning Approach to Appliance Classification Based on Power Consumption Traces Analysis ,IOP Conf Ser Mater Sci Eng , Vol. 517 ,pp 012011 , 2019, https://doi.org/https://doi.org/10.1088/1757-899X/517/1/012011 - ,
A Prediction Mechanism of Energy Consumption in Residential Buildings Using Hidden Markov Model ,Energies (Basel) , Vol. 11 (2),pp 358 , 2018, https://doi.org/https://doi.org/10.3390/en11020358 - ,
Application of wavelet-based ensemble tree classifier for non-intrusive load monitoring ,2015 IEEE Electrical Power and Energy Conference (EPEC), IEEE ,pp 397–401 , 2015, https://doi.org/https://doi.org/10.1109/EPEC.2015.7379983 - ,
Random forest based adaptive non-intrusive load identification ,2014 International Joint Conference on Neural Networks (IJCNN), IEEE ,pp 1978–1983 , 2014, https://doi.org/https://doi.org/10.1109/IJCNN.2014.6889897 - ,
A non-intrusive appliance load monitoring for efficient energy consumption based on Naive Bayes classifier ,Sustainable Computing: Informatics and Systems , Vol. 14 ,pp 34–42 , 2017, https://doi.org/https://doi.org/10.1016/j.suscom.2017.03.001 - ,
Load Identification of Non-intrusive Load-monitoring System Based on Time-frequency Analysis and PSO-SVM ,DEStech Transactions on Engineering and Technology Research, no. eeta , 2017, https://doi.org/https://doi.org/10.12783/dtetr/eeta2017/7743 - ,
Implementation of non-intrusive appliances load monitoring (NIALM) on k-nearest neighbors (k-NN) classifier ,AIMS Electronics and Electrical Engineering , Vol. 4 (3),pp 326–344 , 2020, https://doi.org/https://doi.org/10.3934/ElectrEng.2020.3.326 - ,
Effective non-intrusive load monitoring of buildings based on a novel multi-descriptor fusion with dimensionality reduction ,Appl Energy , Vol. 279 ,pp 115872 , 2020, https://doi.org/https://doi.org/10.1016/j.apenergy.2020.115872 - ,
Pattern matrix and decision tree based technique for non-intrusive monitoring of home appliances ,2017 7th International Conference on Power Systems (ICPS), IEEE ,pp 824–829 , 2017, https://doi.org/https://doi.org/10.1109/ICPES.2017.8387403 - ,
NILM Techniques for Intelligent Home Energy Management and Ambient Assisted Living: A Review ,Energies (Basel) , Vol. 12 (11),pp 2203 , 2019, https://doi.org/https://doi.org/10.3390/en12112203 - ,
Unsupervised algorithms for non-intrusive load monitoring: An up-to-date overview ,2015 IEEE 15th International Conference on Environment and Electrical Engineering (EEEIC), IEEE ,pp 1175–1180 , 2015, https://doi.org/https://doi.org/10.1109/EEEIC.2015.7165334 - ,
K-Means Clustering-Based Electrical Equipment Identification for Smart Building Application ,Information , Vol. 11 (1),pp 27 , 2020, https://doi.org/https://doi.org/10.3390/info11010027 - ,
Adaptive modeling for Non-Intrusive Load Monitoring ,International Journal of Electrical Power & Energy Systems , Vol. 140 ,pp 107981 , 2022, https://doi.org/https://doi.org/10.1016/j.ijepes.2022.107981 - ,
An unsupervised approach in learning load patterns for non-intrusive load monitoring ,2017 IEEE 14th International Conference on Networking, Sensing and Control (ICNSC), IEEE ,pp 631–636 , 2017, https://doi.org/https://doi.org/10.1109/ICNSC.2017.8000164 - ,
Non-intrusive load monitoring using factorial hidden markov model based on adaptive density peak clustering ,Energy Build , Vol. 244 ,pp 111025 , 2021, https://doi.org/https://doi.org/10.1016/j.enbuild.2021.111025 - ,
A time-efficient factorial hidden Semi-Markov model for non-intrusive load monitoring ,Electric Power Systems Research , Vol. 199 ,pp 107372 , 2021, https://doi.org/https://doi.org/10.1016/j.epsr.2021.107372 - ,
A Semi-supervised Method of Non-intrusive Load Monitoring with Answer-Question Technique ,2021 9th International Electrical Engineering Congress (iEECON), IEEE ,pp 141–144 , 2021, https://doi.org/https://doi.org/10.1109/iEECON51072.2021.9440251 - ,
Unsupervised NILM Implementation Using Odd Harmonic Currents ,2021 56th International Universities Power Engineering Conference (UPEC), IEEE ,pp 1–6 , 2021, https://doi.org/https://doi.org/10.1109/UPEC50034.2021.9548250 - ,
An Appliance Load Disaggregation Scheme Using Automatic State Detection Enabled Enhanced Integer Programming ,IEEE Trans Industr Inform , Vol. 17 (2),pp 1176–1185 , 2021, https://doi.org/https://doi.org/10.1109/TII.2020.2975810 - ,
Non-intrusive Load Monitoring Method Based on SAGA-FCM Algorithm ,DEStech Transactions on Engineering and Technology Research, no. acaai , 2020, https://doi.org/https://doi.org/10.12783/dtetr/acaai2020/34212 - ,
Load Disaggregation Based on Aided Linear Integer Programming ,IEEE Transactions on Circuits and Systems II: Express Briefs , Vol. 64 (7),pp 792–796 , 2017, https://doi.org/https://doi.org/10.1109/TCSII.2016.2603479 - ,
Nonintrusive Load Monitoring Algorithm Using Mixed-Integer Linear Programming ,IEEE Transactions on Consumer Electronics , Vol. 64 (2),pp 180–187 , 2018, https://doi.org/https://doi.org/10.1109/TCE.2018.2843292 - ,
An Extensible Approach for Non-Intrusive Load Disaggregation With Smart Meter Data ,IEEE Trans Smart Grid , Vol. 9 (4),pp 3362–3372 , 2018, https://doi.org/https://doi.org/10.1109/TSG.2016.2631238 - ,
Non-Intrusive Load Monitoring Based on Swarm Intelligence ,2019 8th International Congress on Advanced Applied Informatics (IIAI-AAI), IEEE ,pp 546–551 , 2019, https://doi.org/https://doi.org/10.1109/IIAI-AAI.2019.00117 - ,
Research on non-intrusive load disaggregation method based on multi-model combination ,Electric Power Systems Research , Vol. 200 ,pp 107472 , 2021, https://doi.org/https://doi.org/10.1016/j.epsr.2021.107472 - ,
Artificial Bee Colony Optimization Based Non-Intrusive Appliances Load Monitoring Technique in a Smart Home ,IEEE Transactions on Consumer Electronics , Vol. 67 (1),pp 77–86 , 2021, https://doi.org/https://doi.org/10.1109/TCE.2021.3051164 - ,
Low-Rate Non-Intrusive Appliance Load Monitoring Based on Graph Signal Processing ,2019 International Conference on Security, Pattern Analysis, and Cybernetics (SPAC), IEEE ,pp 11–16 , 2019, https://doi.org/https://doi.org/10.1109/SPAC49953.2019.237866 - ,
Analysis of supervised graph signal processing-based load disaggregation for residential demand-side management ,Electric Power Systems Research , Vol. 208 ,pp 107878 , 2022, https://doi.org/https://doi.org/10.1016/j.epsr.2022.107878 - ,
Improving Event-Based Non-Intrusive Load Monitoring Using Graph Signal Processing ,IEEE Access , Vol. 6 ,pp 53944–53959 , 2018, https://doi.org/https://doi.org/10.1109/ACCESS.2018.2871343 - ,
Non-Intrusive Load Disaggregation Using Graph Signal Processing ,IEEE Trans Smart Grid , Vol. 9 (3),pp 1739–1747 , 2018, https://doi.org/https://doi.org/10.1109/TSG.2016.2598872 - ,
Machine learning and deep learning ,Electronic Markets , Vol. 31 (3),pp 685–695 , 2021, https://doi.org/https://doi.org/10.1007/s12525-021-00475-2 - ,
Non-intrusive Load Monitoring based on Convolutional Neural Network with Differential Input ,Procedia CIRP , Vol. 83 ,pp 670–674 , 2019, https://doi.org/https://doi.org/10.1016/j.procir.2019.04.110 - ,
Investigation of Deep Learning-based Techniques for Load Disaggregation, Low-Frequency Approach ,International Journal of Advanced Computer Science and Applications , Vol. 11 (1), 2020, https://doi.org/https://doi.org/10.14569/IJACSA.2020.0110186 - ,
Classification performance using gated recurrent unit recurrent neural network on energy disaggregation ,2016 International Conference on Machine Learning and Cybernetics (ICMLC), IEEE ,pp 105–110 , 2016, https://doi.org/https://doi.org/10.1109/ICMLC.2016.7860885 - ,
Energy Disaggregation in Smart Home Appliances: A Deep Learning Approach ,Energy , 2020 - ,
Sequence-to-Point Learning With Neural Networks for Non-Intrusive Load Monitoring ,Proceedings of the AAAI Conference on Artificial Intelligence , Vol. 32 (1), 2018, https://doi.org/https://doi.org/10.1609/aaai.v32i1.11873 - ,
A New Approach for Supervised Power Disaggregation by Using a Denoising Autoencoder and Recurrent LSTM Network ,2019 IEEE 12th International Symposium on Diagnostics for Electrical Machines, Power Electronics and Drives (SDEMPED), IEEE ,pp 507–512 , 2019, https://doi.org/https://doi.org/10.1109/DEMPED.2019.8864870 - ,
A Tree-Structured Neural Network Model for Household Energy Breakdown ,The World Wide Web Conference ,pp 2872–2878 , 2019, https://doi.org/https://doi.org/10.1145/3308558.3313405 - ,
Different Sampling Rates on Neural NILM Energy Disaggregation ,2019 Joint International Conference on Digital Arts, Media and Technology with ECTI Northern Section Conference on Electrical, Electronics, Computer and Telecommunications Engineering (ECTI DAMT-NCON), IEEE ,pp 318–321 , 2019, https://doi.org/https://doi.org/10.1109/ECTI-NCON.2019.8692281 - ,
Office Appliances Identification and Monitoring using Deep Leaning based Energy Disaggregation for Smart Buildings ,IECON 2020 The 46th Annual Conference of the IEEE Industrial Electronics Society, IEEE ,pp 1986–1991 , 2020, https://doi.org/https://doi.org/10.1109/IECON43393.2020.9255127 - ,
A non-intrusive load identification method based on convolution neural network ,2017 IEEE Conference on Energy Internet and Energy System Integration (EI2), IEEE ,pp 1–5 , 2017, https://doi.org/https://doi.org/10.1109/EI2.2017.8245612 - ,
A deep learning based non-intrusive household load identification for smart grid in China ,Comput Commun , Vol. 177 ,pp 176–184 , 2021, https://doi.org/https://doi.org/10.1016/j.comcom.2021.06.023 - ,
Nonintrusive residential electricity load decomposition based on transfer learning ,Sustainability (Switzerland) , Vol. 13 (12), 2021, https://doi.org/https://doi.org/10.3390/su13126546 - ,
Non-Intrusive Load Monitoring by Voltage–Current Trajectory Enabled Transfer Learning ,IEEE Trans Smart Grid , Vol. 10 (5),pp 5609–5619 , 2018, https://doi.org/https://doi.org/10.1109/TSG.2018.2888581 - ,
Transfer Learning for Non-Intrusive Load Monitoring ,IEEE Trans Smart Grid , Vol. 11 (2),pp 1419–1429 , 2020, https://doi.org/https://doi.org/10.1109/TSG.2019.2938068 - ,
Energy Disaggregation with Federated and Transfer Learning ,2021 IEEE 7th World Forum on Internet of Things (WF-IoT), IEEE ,pp 698–703 , 2021, https://doi.org/https://doi.org/10.1109/WF-IoT51360.2021.9595167 - ,
Non-Intrusive Adaptive Load Identification Based on Siamese Network ,IEEE Access , Vol. 10 ,pp 11564–11573 , 2022, https://doi.org/https://doi.org/10.1109/ACCESS.2022.3145982 - ,
Analysis of supervised graph signal processing-based load disaggregation for residential demand-side management ,Electric Power Systems Research , Vol. 208 ,pp 107878 , 2022, https://doi.org/https://doi.org/10.1016/j.epsr.2022.107878 - ,
A blind event-based learning algorithm for non-intrusive load disaggregation ,International Journal of Electrical Power and Energy Systems , Vol. 129 ,pp 106834 , 2021, https://doi.org/https://doi.org/10.1016/j.ijepes.2021.106834 - ,
Non-intrusive Load Monitoring Method Considering the Time-segmented State Probability ,IEEE Access , Vol. 10 ,pp 39627–39637 , 2022, https://doi.org/https://doi.org/10.1109/access.2022.3167132 - ,
Non-intrusive load monitoring based on harmonic characteristics ,Procedia Comput Sci , Vol. 183 ,pp 776–782 , 2021, https://doi.org/https://doi.org/10.1016/j.procs.2021.02.128 - ,
Non-Intrusive Electrical Appliances Monitoring and Classification using K-Nearest Neighbors ,2019 2nd International Conference on Innovation in Engineering and Technology (ICIET), IEEE ,pp 1–5 , 2019, https://doi.org/https://doi.org/10.1109/ICIET48527.2019.9290671 - ,
Load disaggregation in non-intrusive load monitoring based on random forest optimized by particle swarm optimization ,2017 IEEE Conference on Energy Internet and Energy System Integration (EI2), IEEE ,pp 1–6 , 2017, https://doi.org/https://doi.org/10.1109/EI2.2017.8245609 - ,
Pattern matrix and decision tree based technique for non-intrusive monitoring of home appliances ,2017 7th international conference on power systems (ICPS), IEEE ,pp 824–829 , 2018, https://doi.org/https://doi.org/10.1109/ICPES.2017.8387403 - ,
Two-Step Non-Intrusive Load Monitoring Based on High-Frequency Current Data ,2020 39th Chinese Control Conference (CCC) ,pp 3174–3178 , 2020, https://doi.org/https://doi.org/10.23919/CCC50068.2020.9189259 - ,
A Novel Denoising Auto-Encoder-Based Approach for Non-Intrusive Residential Load Monitoring ,Energies (Basel) , Vol. 15 (6),pp 2290 , 2022, https://doi.org/https://doi.org/10.3390/en15062290 - ,
Sequence to point learning based on bidirectional dilated residual network for non-intrusive load monitoring ,International Journal of Electrical Power and Energy Systems , Vol. 129 ,pp 106837 , 2021, https://doi.org/https://doi.org/10.1016/j.ijepes.2021.106837 - ,
A deep learning based non-intrusive household load identification for smart grid in China ,Comput Commun , Vol. 177 ,pp 176–184 , 2021, https://doi.org/https://doi.org/10.1016/j.comcom.2021.06.023 - ,
A New Method for the Nonintrusive Load Monitoring Based on BP Neural Network ,2017 2nd International Conference on Multimedia and Image Processing (ICMIP) ,pp 93–97 , 2017, https://doi.org/https://doi.org/10.1109/ICMIP.2017.55 - ,
State of art overview of Non-Intrusive Load Monitoring applications in smart grids ,Measurement: Sensors , Vol. 18 ,pp 100145 , 2021, https://doi.org/https://doi.org/10.1016/j.measen.2021.100145 - ,
Can non-intrusive load monitoring be used for identifying an appliance’s anomalous behaviour? ,Appl Energy , Vol. 238 ,pp 796–805 , 2019, https://doi.org/https://doi.org/10.1016/j.apenergy.2019.01.061 - ,
Review of NILM applications in smart grids: Power quality assessment and assisted independent living ,2020 Argentine Conference on Automatic Control (AADECA), IEEE ,pp 1–6 , 2020, https://doi.org/https://doi.org/10.23919/AADECA49780.2020.9301641 - ,
Unsupervised Learning for Non-intrusive Load Monitoring in Smart Grid Based on Spiking Deep Neural Network ,Journal of Modern Power Systems and Clean Energy , Vol. 10 (3),pp 606–616 , 2021, https://doi.org/https://doi.org/10.35833/MPCE.2020.000569 - ,
NILM techniques for intelligent home energy management and ambient assisted living: A review ,Energies (Basel) , Vol. 12 (11),pp 2203 , 2019, https://doi.org/https://doi.org/10.3390/en12112203 - ,
Applications of NILM Techniques to Energy Management and Assisted Living ,IFAC-PapersOnLine , Vol. 52 (11),pp 164–171 , 2019, https://doi.org/https://doi.org/10.1016/j.ifacol.2019.09.135 - ,
Assessing Human Activity in Elderly People Using Non-Intrusive Load Monitoring ,Sensors , Vol. 17 (2),pp 351 , 2017, https://doi.org/https://doi.org/10.3390/s17020351 - ,
Applications of NILM in the Optimization Management of Intelligent Home Energy Management System ,iSPEC 2020 - Proceedings: IEEE Sustainable Power and Energy Conference: Energy Transition and Energy Internet ,pp 2300–2305 , 2020, https://doi.org/https://doi.org/10.1109/iSPEC50848.2020.9351198 - ,
Quantifying flexibility of residential electric vehicle charging loads using non-intrusive load extracting algorithm in demand response ,Sustain Cities Soc , Vol. 50 ,pp 101664 , 2019, https://doi.org/https://doi.org/10.1016/j.scs.2019.101664 - ,
Combining Electric Vehicle and Rechargeable Battery for Household Load Hiding ,2015 IEEE International Conference on Smart Grid Communications (SmartGridComm), IEEE ,pp 611–616 , 2015 - ,
Non-intrusive load perception and flexibility evaluation for electric vehicle charging station : a deep learning based approach ,2022 IEEE 5th International Electrical and Energy Conference (CIEEC), IEEE ,pp 2570–2575 , 2022 - ,
Non-intrusive Load Monitoring in MVDC Shipboard Power Systems using Wavelet-Convolutional Neural Networks ,2022 IEEE Texas Power and Energy Conference, TPEC 2022, IEEE ,pp 1–6 , 2022, https://doi.org/https://doi.org/10.1109/TPEC54980.2022.9750745 - ,
Shipboard Fault Detection Through Nonintrusive Load Monitoring : A Case Study ,IEEE Sens J , Vol. 18 (21),pp 8986–8995 , 2018 - ,
Load modelling and non-intrusive load monitoring to integrate distributed energy resources in low and medium voltage networks ,Renew Energy , Vol. 179 ,pp 445–466 , 2021, https://doi.org/https://doi.org/10.1016/j.renene.2021.07.056 - ,
Regional nonintrusive load monitoring for low voltage substations and distributed energy resources ,Appl Energy , Vol. 260 ,pp 114225 , 2020, https://doi.org/https://doi.org/10.1016/j.apenergy.2019.114225