


Electricity generated with photovoltaic solar panels is clean and carbon-free compared to fossil fuel-based electricity generation [1]. The installation of photovoltaic solar panels on the ground is already well established, and a new alternative is the installation of floating solar panels in reservoirs of hydroelectric power plants (HPPs) [2]. Floating photovoltaic systems have competitive advantages in terms of efficiency and environmental protection [3]. They can generate electricity complementary, joined with the hydroelectric power plant (HPP), thus reducing the "turbines" water consumption for later use, such as at the beginning of the night or at peak load times [4]. From the point of view of the electric power system, the proposition of a floating photovoltaic plant (FPVP) generates the same power as on hydroelectric turbine and contributes to the power distribution of the hydroelectric power plant (HPP) [5]. The solar plant is a "virtual water turbine" [6]. Therefore, when operated individually, the intermittent energy of the photovoltaic source is converted into stable energy and integrated with the hydroelectric power plant (HPP), the latter, in turn, can use the stored energy at critical times, balancing the system when energy demand is potentially most valuable, such as in the early evening at peak load times [7].
Photovoltaic technology is one way to use solar energy to generate electricity. With an estimated durability of 25 years, these systems are made up of solar cells and semiconductor materials that, with the incidence of solar irradiation, generate electrical potential [8] [9]. Photovoltaic energy (PV) as a source of renewable electricity generation is one of the most promising in the world [10]. However, installing solar panels directly on the ground can cause some problems, especially in countries with insufficient space for installation [11] [12]. As an alternative, floating photovoltaic systems have competitive advantages in terms of efficiency and environmental preservation, especially concerning the structure of large-scale floating photovoltaic modules located in lakes of dams and reservoirs of Hydroelectric Power Plants (HPP) [13] [14].
The studied system was previously a floating platform, which made of plastic reinforced with high-density HDPE polyethylene fibers or metal structures, the entire system is modular, allowing expansion and fixation with pins or screws, and the anchoring that supports the matrix of photovoltaic modules, inverters, combiner boxes, lightning rods, and others equipment's [15]. Each unit in this set generally consists of main and auxiliary floats, which provide a maintenance access path and additional buoyancy [15]. Photovoltaic modules generate direct current (DC), sent to combiner boxes connected to inverters that convert into alternating current (AC) [14].
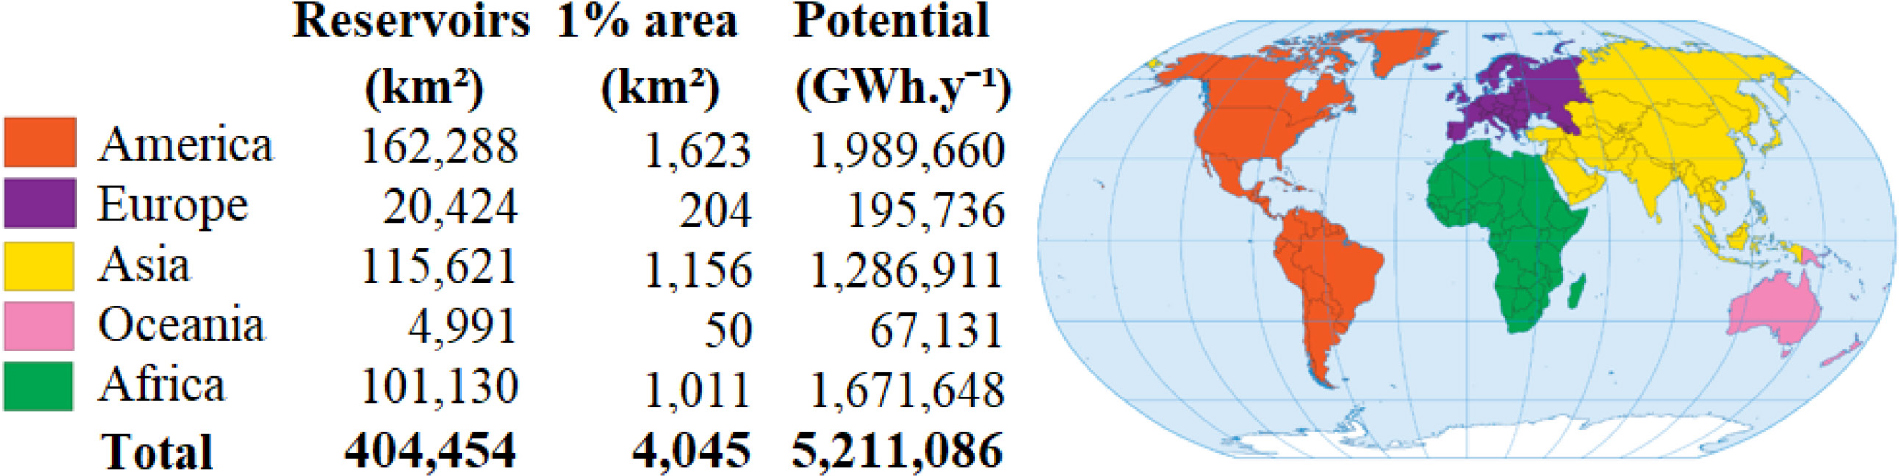
The installation of floating photovoltaic plants (FPVPs) can bring many benefits, such as increasing energy efficiency, does not use fossil fuels, and reduces energy losses due to shading [16]. The joint energy system contributes to the social development of communities close to the reservoirs, enabling the management of essential water resources for agriculture and river transport [17]. Found a gain of 11% in producing floating photovoltaic energy compared to a conventional system with fixed structures in the ground [3]. With the growth of electricity consumption and periods of drought, the water storage level in hydroelectric reservoirs decreases. Therefore, there is a risk of an energy deficit in the coming years as demand increases and stricter laws to protect the environment for new projects. According to World Bank study [17], the potential for generating photovoltaic energy in the reservoirs by continent, results in 5,211 TWh/y considering 1% of the use of the surface area of reservoirs, minimizing environmental impacts, as shown in Figure 1.
Floating Photovoltaic Plant potential in reservoirs by continent (World Bank Group, 2019)
This study aims to prove the technical feasibility of the hybrid operation of a floating photovoltaic plant (FPVP) with hydroelectric power plant (HPP) by modeling the fluctuation of solar energy in the different proposed scenarios, considering the fast activation of the hydroelectric power plant (HPP), and verifying the compensation for the reduction in the flow of turbinate water for electrical generation in critical periods of severe drought [18]. The photovoltaic system connected directly with the transmission line of the hydroelectric substation. The system operates so that hydroelectric and photovoltaic power generation complement each other. After the addition of the floating photovoltaic plant (FPVP), the Electrical System Operator begins to release more power at the dispatch set point during the day [19]. As expected, the output of the hydropower plant reduces on an average day, especially between 11:00 a.m. and 4:00 p.m. when the generation of the photovoltaic plant is high.
The Electrical System Operator requests the saved energy and uses it at the beginning of the morning and the end of the afternoon [19]. Although electricity generated daily by hydraulic potential is relieved, water storage is maintained at the same level to meet water demand from other downstream reservoirs [20]. The grid completely absorbs all the energy generated in the hybrid system without any limitation. This system demonstrates that hydro turbines can adequately respond to demand and photovoltaic supply fluctuations during the day and seasons [21].
In this paper, the development of a semi-quantitative research approach uses calculations and simulates the energy solar potential. The Ilha Solteira SP hydroelectric power plant (HPP) in Brazil served as a study reference to understand whether the use of a floating photovoltaic plant (FPVP) in hydroelectric power plant (HPP) reservoirs is one of the most viable. The literature review of the technological study used the data provided by energy government agencies, monographs, and research reports to obtain the basis for the theoretical part and calculations. The PVsyst software version 7.2 processed the floating photovoltaic power generated potential depending on a percentage limited to 1.0% of the total area in km² of the reservoir's water level.
Selected the geographical location data, solar generation power, and inclination plane in degrees of the photovoltaic modules, azimuth, albedo, photovoltaic modules, and inverters. After completing the data entry and device selection, the program ran the simulation and provided the results in a complete report with tables and graphs on the photovoltaic generation of electricity. The data calculates the valuable volume of the hydroelectric reservoirs as a percentage of its maximum value as the basis unit for the analysis. The floating photovoltaic plant (FPVP) electricity represents the equivalent volume of water reserved or drained in the hydroelectric power plant's (HPP) turbines for electricity generated.
MATLAB software performed mathematical modeling and produced diagrams based on the water balance for the 12 studied scenarios, with the balance of electricity generated and the rational distribution of daily load between the hydroelectric power plant (HPP) and the floating photovoltaic plant (FPVP). The financial assessment compared the implemented photovoltaic plant (PV) on the ground and a floating photovoltaic plant (FPVP) of the same capacity, the return on investment for the floating photovoltaic plant (FPVP), and the benefits obtained. In this way, it is possible to confirm the ability of the hydroelectric power plant (HPP) to compensate the floating photovoltaic plant (FPVP) in unfavorable scenarios, to regulate the peak load, and the emptying time of the reservoir considering the hybrid operating system. The 12 scenarios studied are shown in Figure 2.
Power generation scenarios in a hybrid system
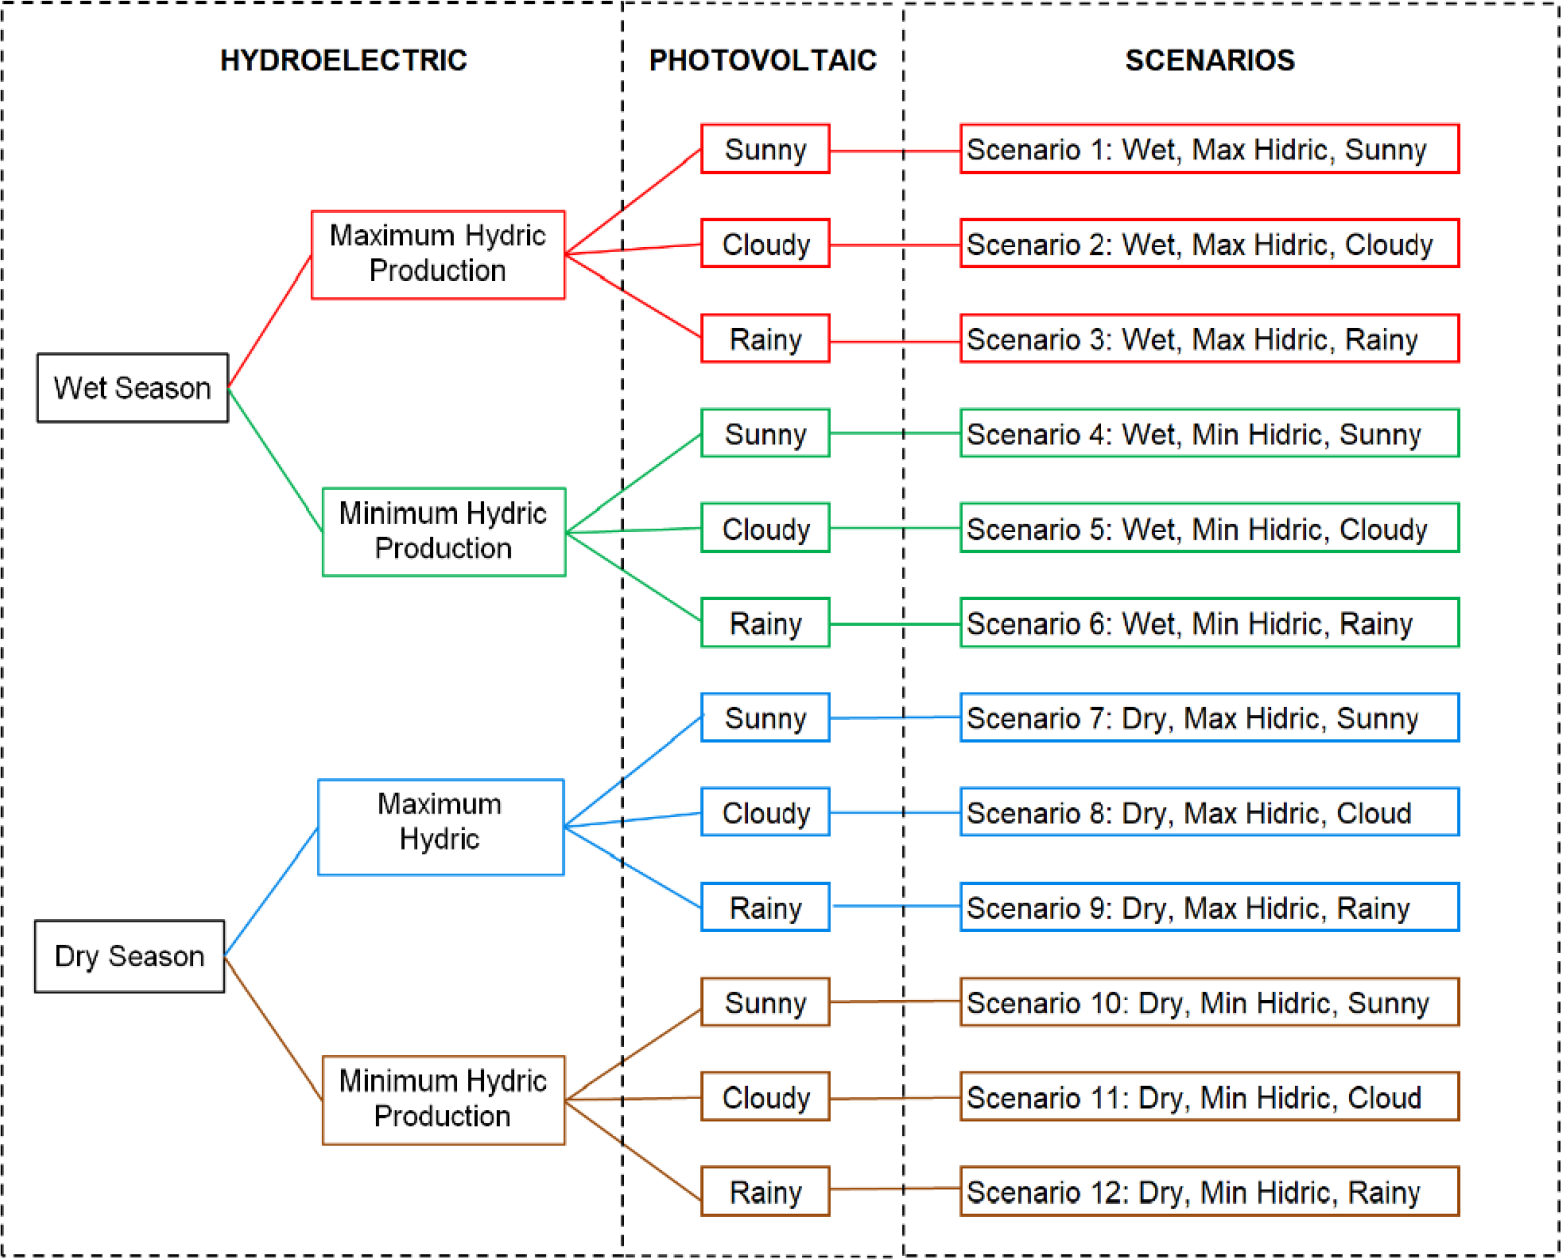
This study considered the following assumptions, according to government authorities in the electricity sector in Brazil; National Electric Energy (ANEEL) [22] and Electric Energy Commercialization Chamber (CCEE) [23].
The division of the months of the year into dry and wet periods, with the dry period comprising the months of May to November (7 months) and the wet period comprising the months of December to April (5 months).
Maximum and minimum electrical power generation considering water sources in the wet and dry seasons throughout 2022.
The uncertainty of photovoltaic generation, considering the possibility of a day with different weather conditions such as sunny, cloudy, or rainy.
The technical feasibility of operating the HPP in conjunction with the FPVP to balance the production of the two energy sources must achieve a constant level throughout the day and ensure that the electricity generated is connected to the transmission system to meet the planned and contracted production. The daily energy output of the HPP and FPVP is the sum of the values obtained per hour in a day, according to the following equations:
(1)
EH: Daily hydropower production.
EHi: Hydropower production in i-th hour.
(2)
EPV: Daily photovoltaic production.
EPVi: Photovoltaic production in i-th hour.
From the point of view of the electrical system, the FPVP acts as a virtual water turbine that complements the energy production of the HPP [4]. The photovoltaic system offsets all energy generated and stored in the reservoir in the form of potential energy and maintenance of water volume. The estimation of the equivalent flow (m³/s) and the equivalent volume (m³/d) of the FPVP's energy production, the "C" coefficient defines the monthly energy ratio (MWh) and monthly flow (m³/s) of the HPP. The ratio between the monthly energy and the monthly flow of hydropower generation:
(3)
Determination of the maintenance of the reservoir water flow according to the operation of the FPVP in the hybrid system:
(4)
The equation for FPVP equivalent monthly water flow:
(5)
VD: Equivalent flow in 1 (one) day (m³/d)
To estimate the equivalent non-turbocharged water flow when using the FPVP in a hybrid system, the estimated calculation of the use of the photovoltaic source during the 24 hours of the day, considering the maximum and minimum power generation of the HPP and in which months of the wet and dry seasons the highest equivalent flow could occur.
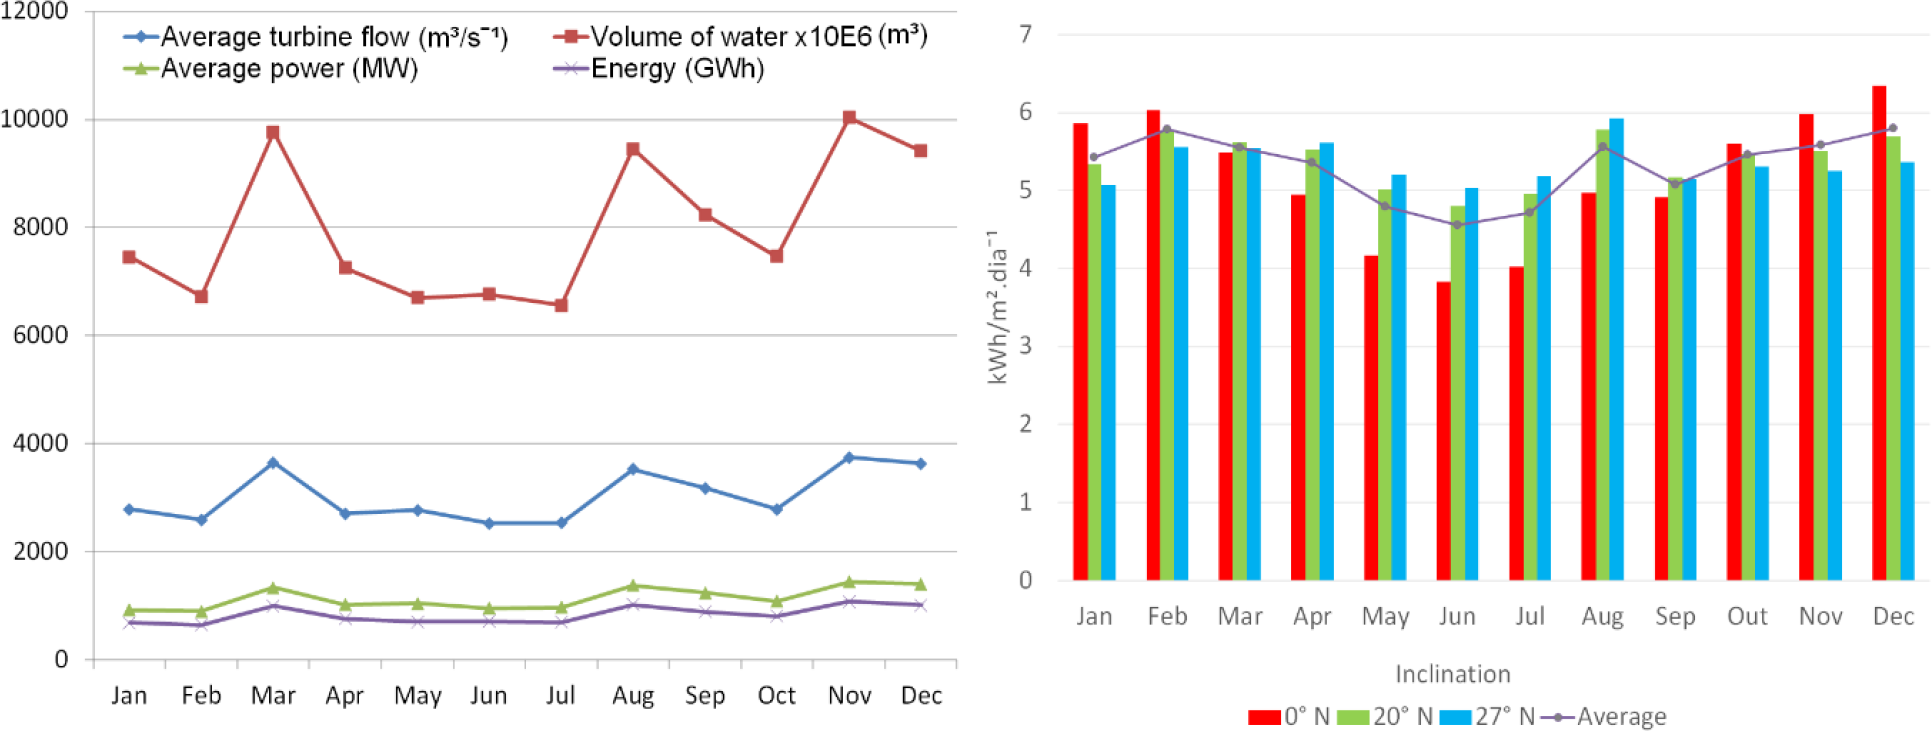
The installed capacity of the Ilha Solteira power plant is 3,444 MW, and the reservoir area is 1,195 km². The database of government agencies, the National Electrical System Operator [19] and the National Agency for Water and Basic Sanitation [24] provided historical data for the year 2022 on average power and turbine flow as the potential water volume for power generation, as shown in Figure 3a. PVsyst calculated the solar potential and showed that the lowest solar radiation occurs in June with an average of 4.4 kWh/m². The period of strong solar radiation lasts 3.2 months, with a daily average of incident short waves per square meter of over 6.1 kWh/m², as shown in Figure 3b.
Power and turbines flow (a); Solar potential (b)
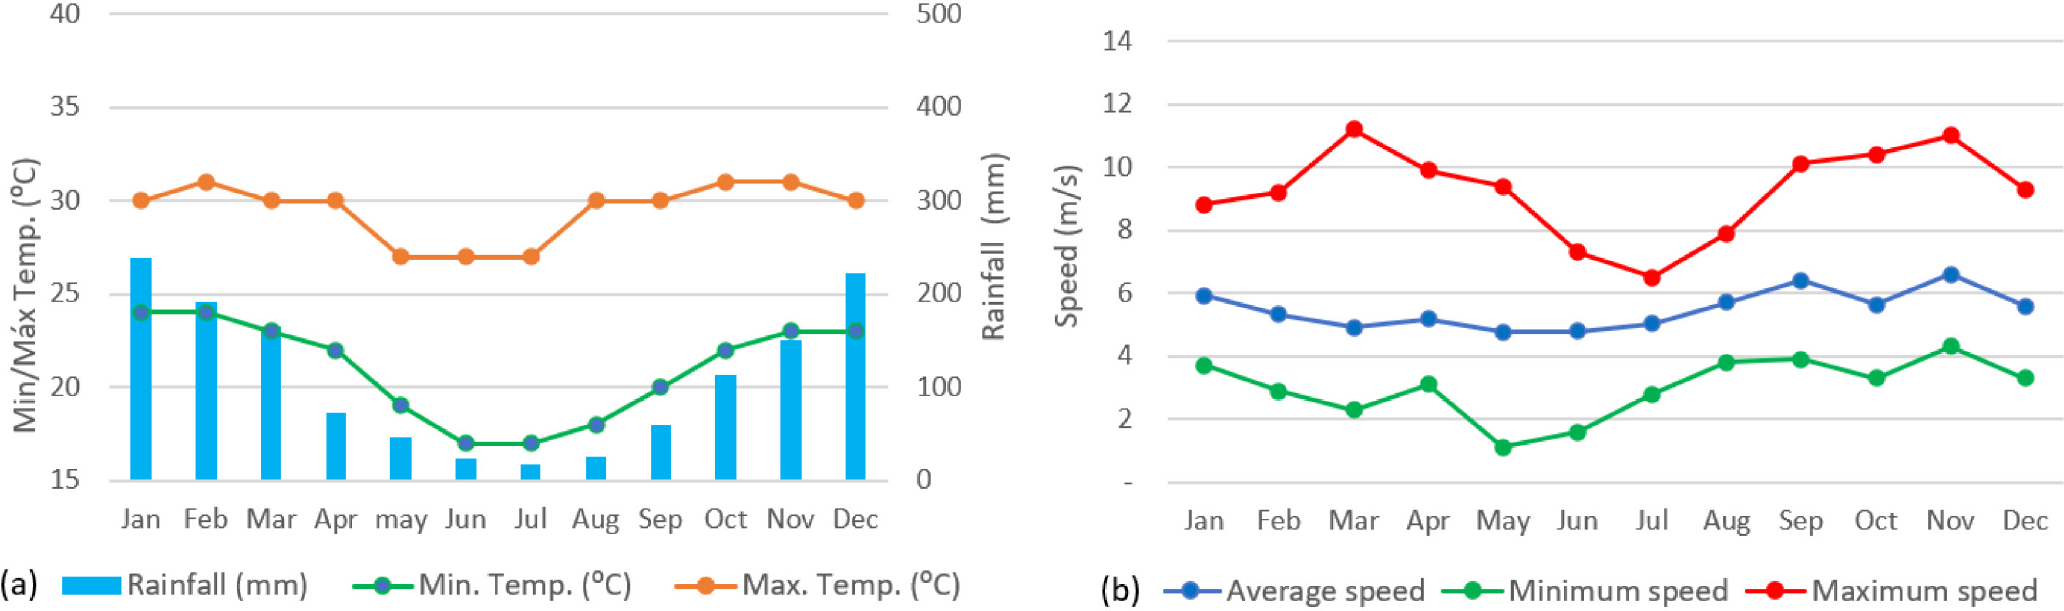
On Ilha Solteira, the temperature varies between 15 °C and 33 °C throughout the year; with an average daily maximum temperature above 32 °C, even in the winter the temperatures are higher than 25 °C. The duration of precipitation is 5.3 months, from October 24 to April 3, with a greater than 37% probability that a given day will have precipitation, as shown in Figure 4a. The windier part of the year lasts for 4.3 months, from June 27 to November 5, with wind speeds of more than 10 m/s, the average wind speed is about 6 m/s, as shown in Figure 4b.
Average temperature and rainfall (a); Average wind speed (b)
The PVsyst software version 7.2 simulated a photovoltaic potential of 480,000 kWp in the reservoir lake of the HPP on Ilha Solteira-SP considering; occupation of a maximum of 1% of the reservoir area, monocrystalline modules of 600 Wp, data with location, generation power, and selected photovoltaic inverter module. PVsyst process the number of modules, inverters, and the necessary configuration to obtain the required power generation. The result is shown in Table 1.
Result of the PVsyst simulation of the Floating Photovoltaic Plant
FPVP Proposal |
Value |
|
|---|---|---|
Number of modules |
800,000 |
units |
Number of inverters |
362 |
units |
Operating voltage |
573-820 |
V DC |
Modules in series |
20 |
units |
Number of queues |
40,000 |
units |
occupied area |
2,264,093 |
m² |
Rated power PV |
480,000 |
kWp |
Maximum power PV |
475,402 |
kW DC |
Rated power CA |
369,240 |
kW AC |
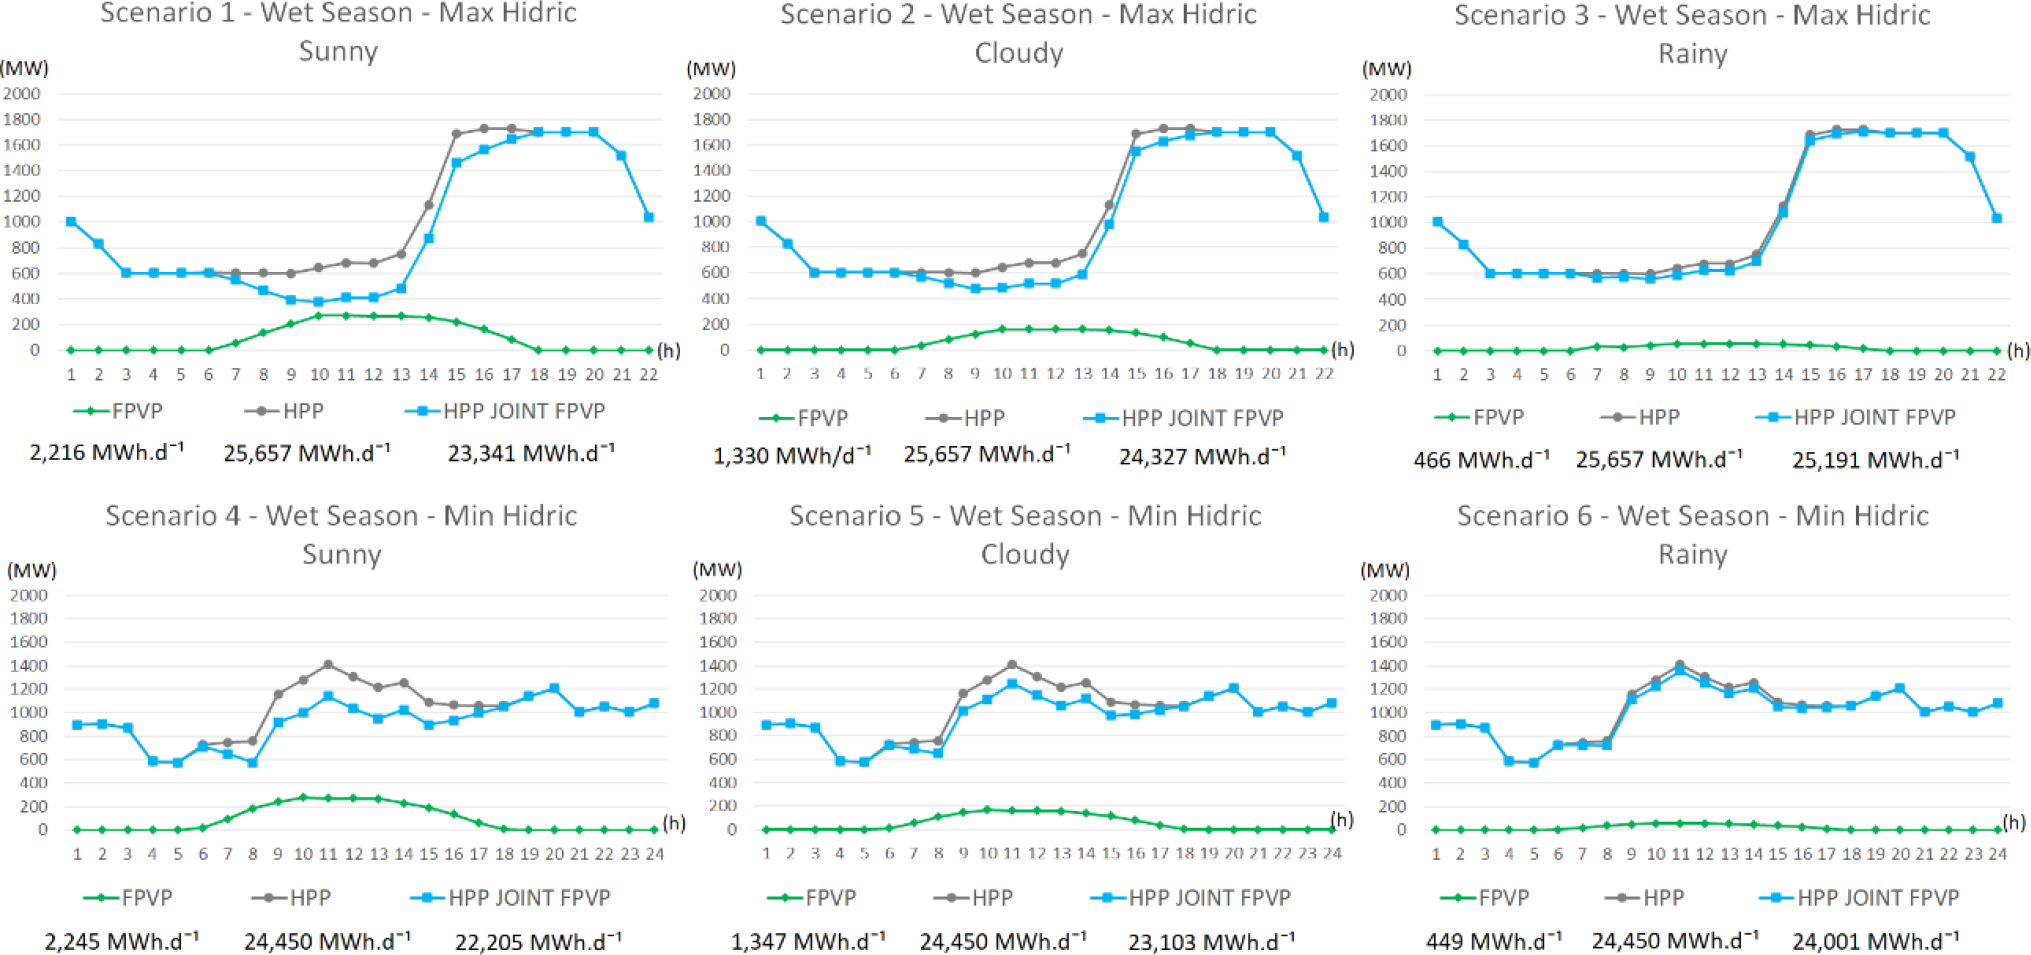
The HPP energy production before and after hybrid operation in the wet season (December, January, February, March, and April), considering the FPVP power generation from 7:00 a.m. to 5:00 p.m. on sunny, cloudy, and rainy days, it is possible to reduce the power generation of the HPP significantly. The FPVP contribution is relevant for sunny and cloudy scenarios; 1 (2,216 MWh d-1), 2 (1,330 MWh d-1), 4 (2,245 MWh d-1), and 5 (1,347 MWh d-1). Even in the rainy scenarios, 3 (466 MWh d-1), and 6 (449 MWh d-1), there is a substantial contribution of energy generation from FPVP in joint system, as shown in Figure 5.
Contribution of Floating Photovoltaic Plant in the daily contracted dispatch of Hydroelectric Power Plant in the wet season
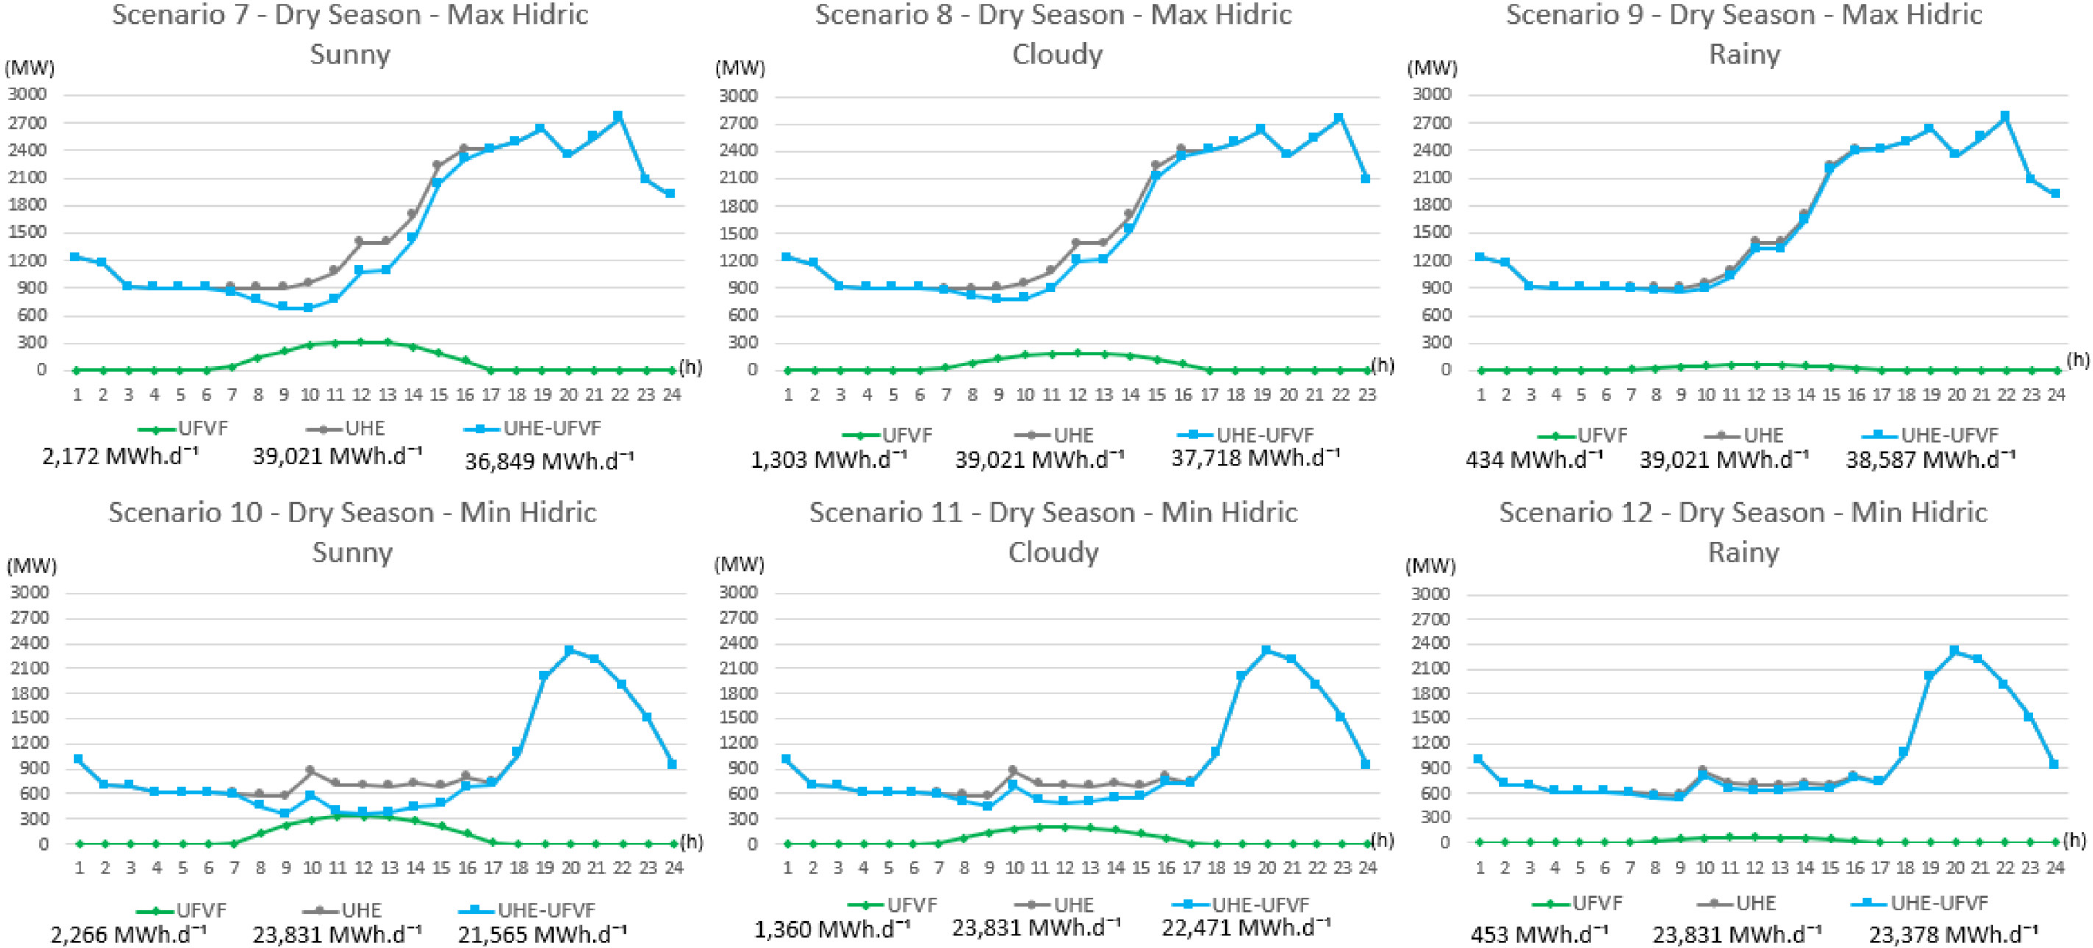
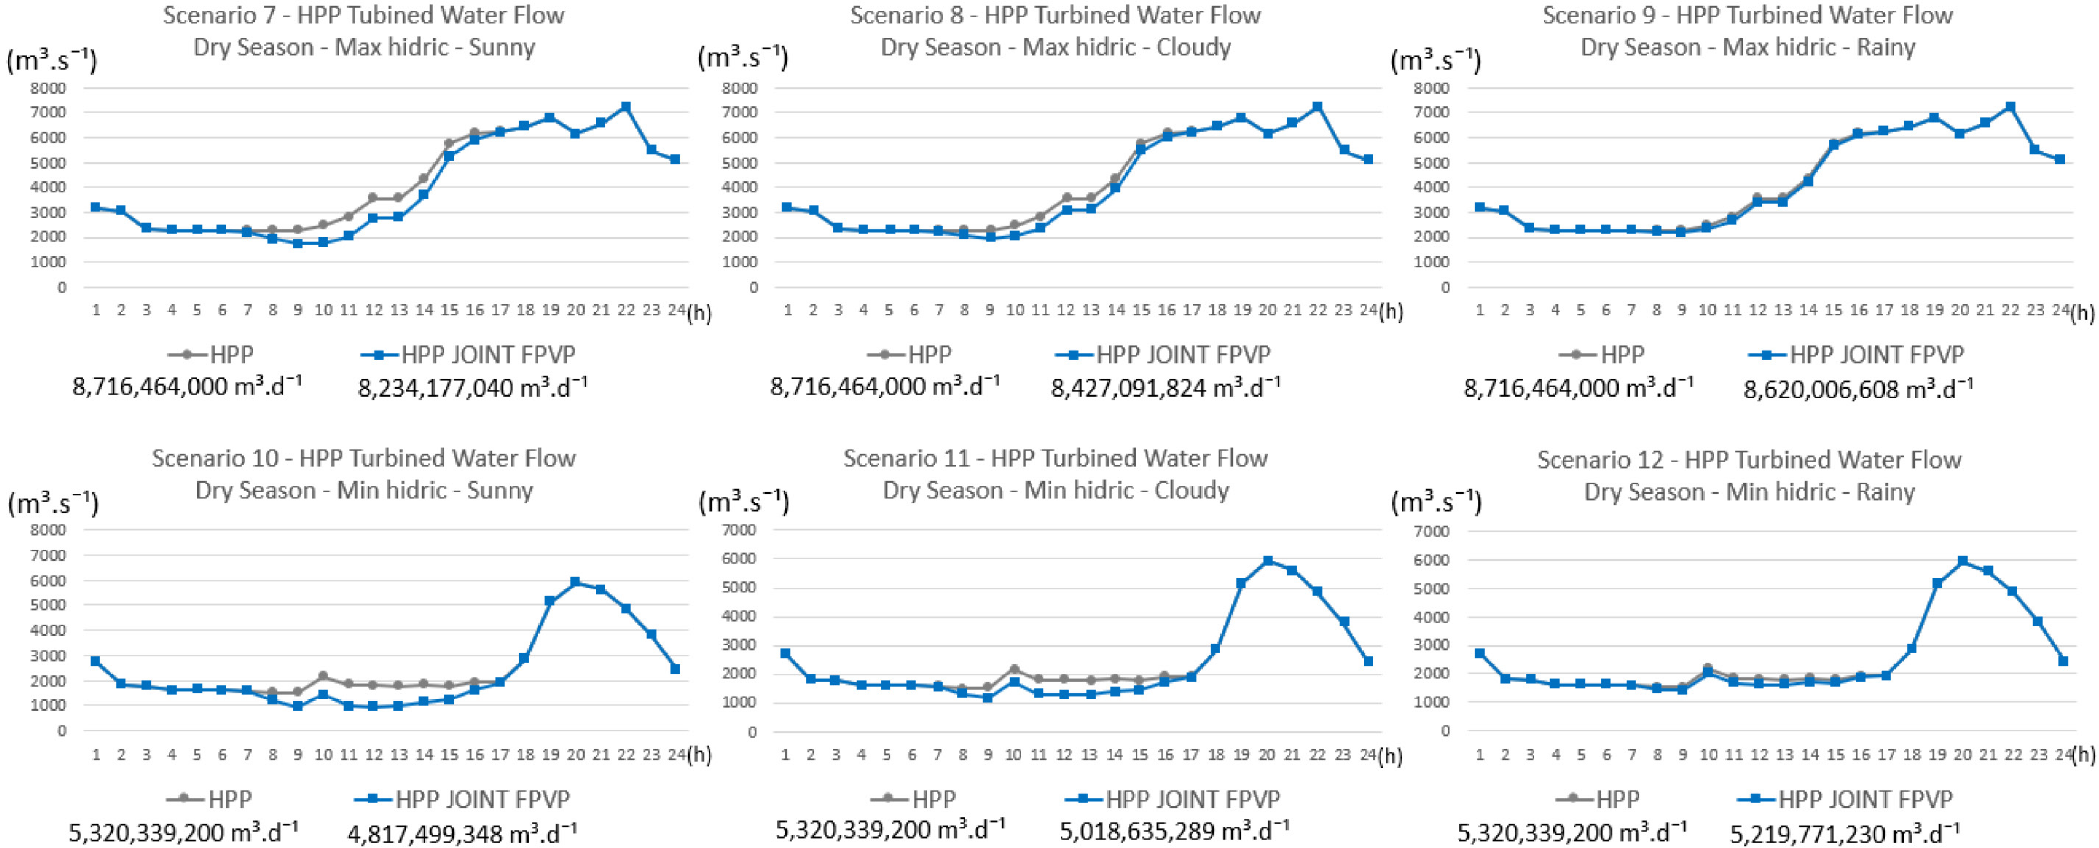
The reduced production of the HPP for the dry season (May, June, July, August, September, October, and November). The contribution of the FPVP is relevant for sunny and cloudy scenarios; 7 (2,172 MWh d-1), 8 (1,303 MWh d-1), 10 (2,266 MWh d-1), and 11 (1,360 MWhd- 1). Significant contribution in the rainy scenarios; 3 (466 MWh d-1), and 6 (449 MWh d-1) considering the joint systems, as shown in Figure 6.
Contribution of Floating Photovoltaic Plant in the contracted daily dispatch of Hydroelectric Power Plant in the dry season
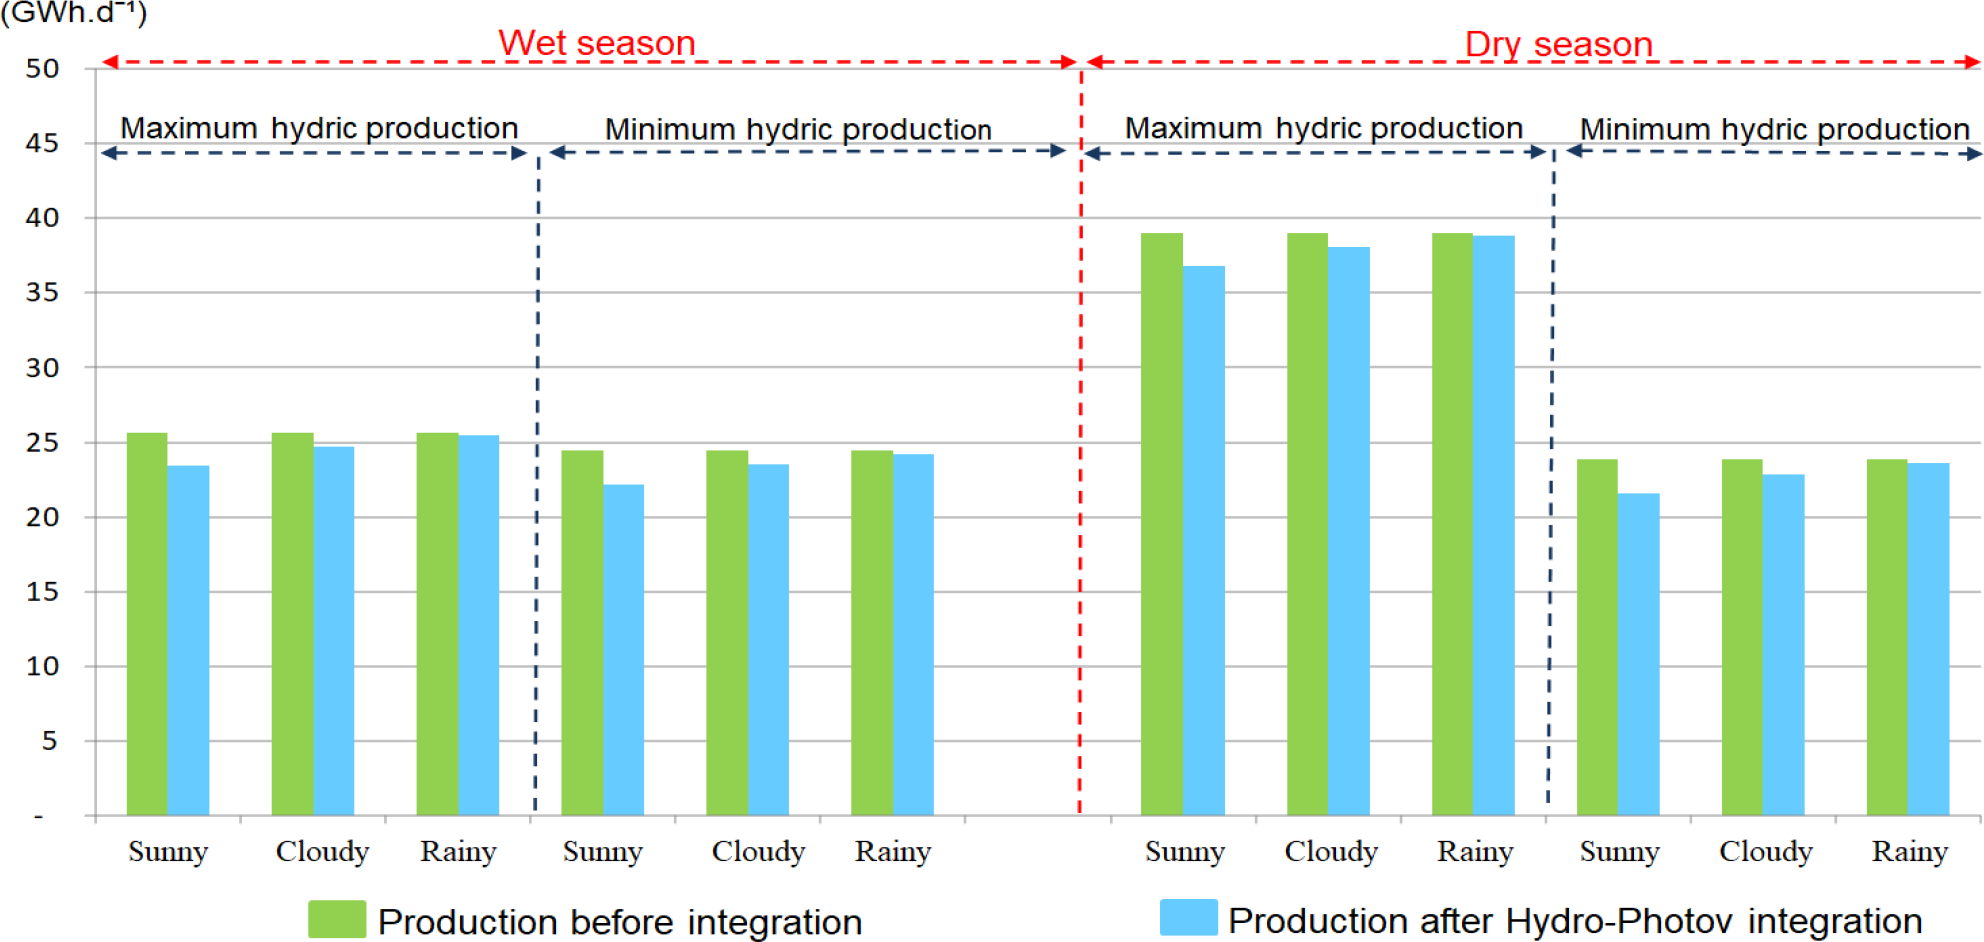
The database of the Electrical System Operator [19] for the year 2022 determined the maximum and minimum values of hydroelectric production and the FPVP based on the PVsyst simulation data. Considering the daily energy production of HPP and FPVP together, there is a decrease in HPP energy production under all scenarios evaluated, which is more pronounced on sunny days, as expected. However, the energy contribution always observed was of FPVP, as shown in Figure 7.
Hydroelectric Power Plant production before and after integration in all evaluated scenarios
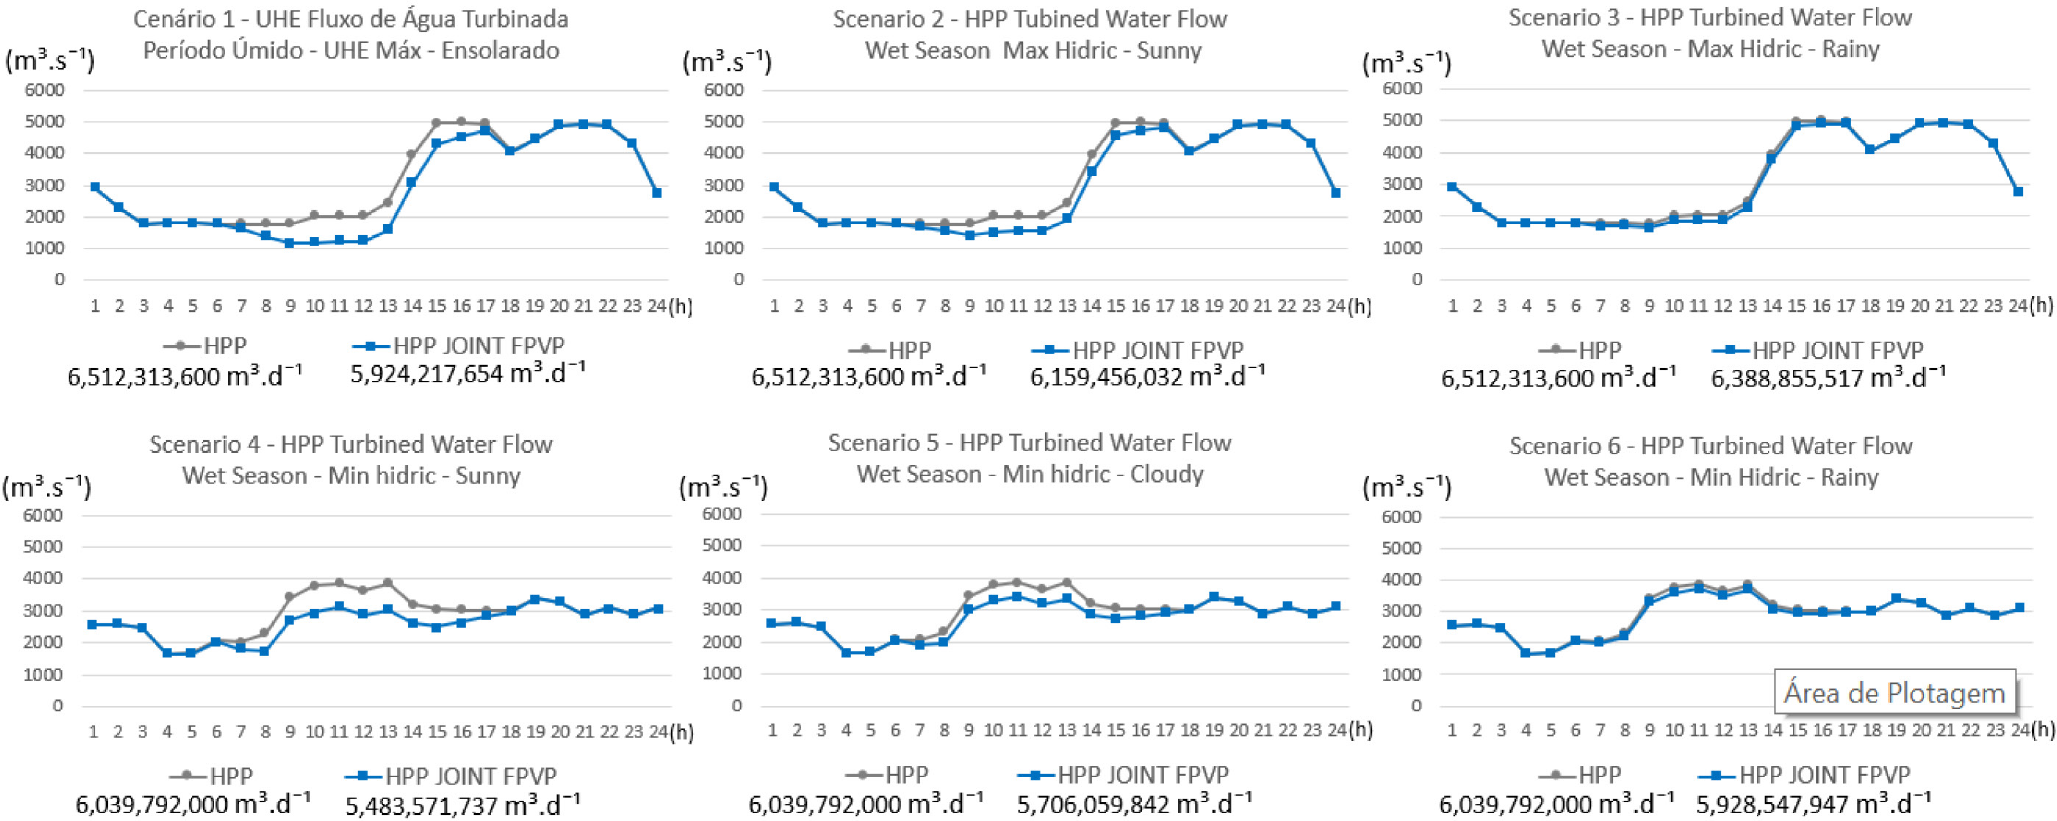
The difference between the turbinate flow of the power plant before and after a hybrid operation with the FPVP allows for a statistical survey that resulted from the estimated daily flow of water not consumed in the power plant reservoir and converted the daily production of electrical energy of the FPVP from 7:00 a.m. to 5:00 p.m. into an equivalent flow of turbinate water in 12 scenarios. These amounts of water are essential during long periods of drought.
The HPP turbinated flow before and after hybrid operation with FPVP in the wet season (December, January, February, March, and April). The reduced HPP turbinated flow is relevant for sunny and cloudy scenarios; 1 (5,924,217,654 m³dˉ¹), 2 scenarios, there is a considerably reduction in the HPP turbinated flow; 3 (6,388,855,517 m³dˉ¹), and 6 (5,928,547,947 m³dˉ¹), as shown in Figure 8.
Statistical water storage scenarios for the wet period
The dry season (May, June, July, August, September, October, and November) is relevant for sunny and cloudy scenarios; 7 (8,234,177,000 m³d-1), 8 (8,427,091,824 m³d-1), 10 (4,817,499,348 m³d-1), and 11(5,018,635,289 m³d-1). Even in the rainy scenarios, there is a considerably reduced HPP turbinated flow; 9 (8,620,006,608 m³d-1) and 12 (5,219,771,230 m³d-1), as shown in Figure 9.
Statistical water storage scenarios for the dry period
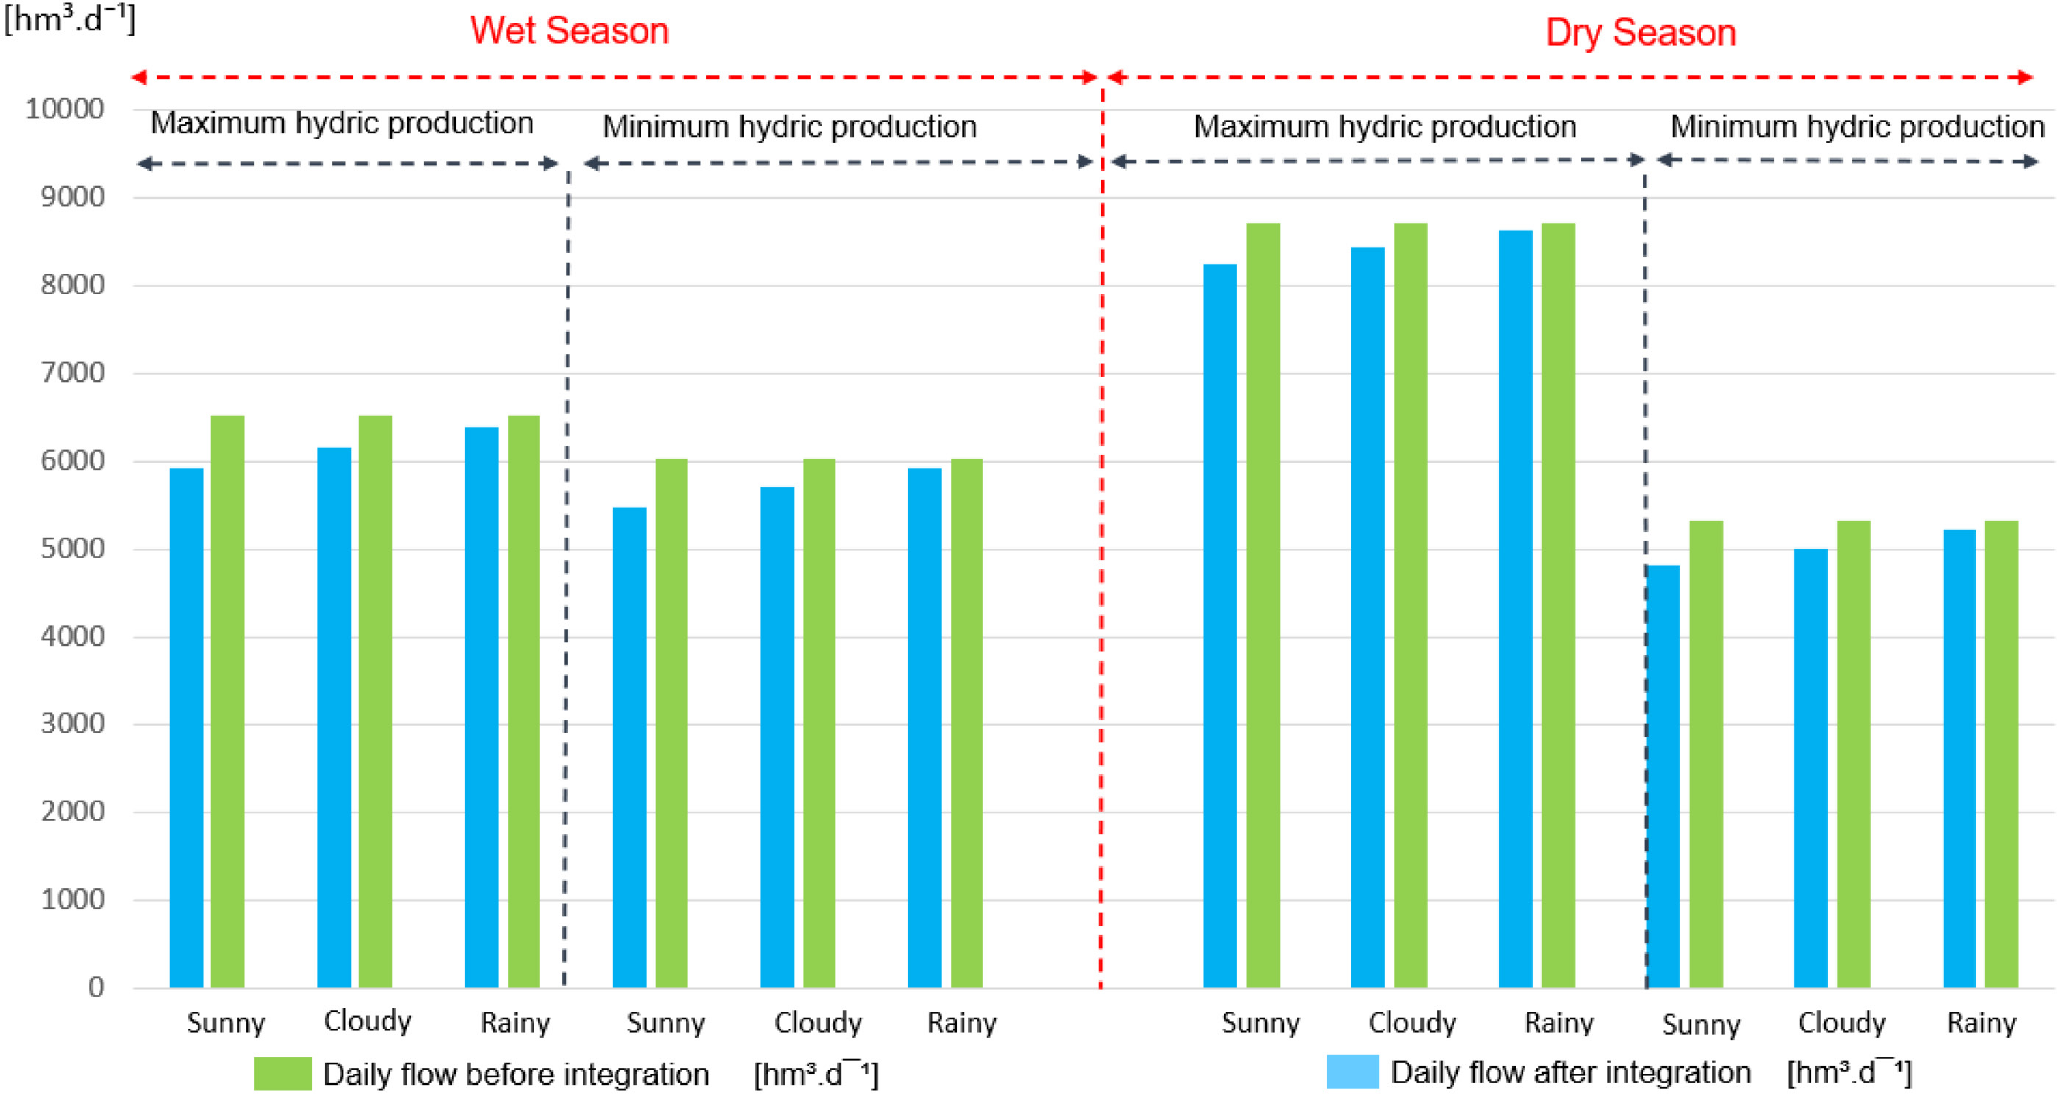
There is an improvement in the system, as the amount of turbine water is reduced for power generation after the joint operation of the HPP and FPVP systems, with the effect observed in both wet and dry periods, as shown in Figure 10.
Daily water flow before and after Hydroelectric Power Plant and Floating Photovoltaic Plant integration
Emissions of greenhouse gases (GHGs) (atmospheric substances that cause global warming and climate change) are crucial to understanding and solving the climate crisis [25]. Although most GHGs are released naturally, human activities are also causing an increase in the amount of GHG concentrations in the atmosphere, which can result in adverse effects on the climate, including an increase in the frequency and intensity of extreme weather events such as floods, droughts, fires and hurricanes that affect thousands of people and cause economic damage [26]. The CO2 Balance (or Carbon Footprint) is a measure of the total amount of carbon dioxide emissions that are direct or caused by production activities (ordering, manufacturing, transportation, distribution, and recycling) or people (consumption, leisure, travel, and disposal) [27]. The carbon footprint also expressed as pure CO2 or CO2 equivalent (CO2 eq) [25].
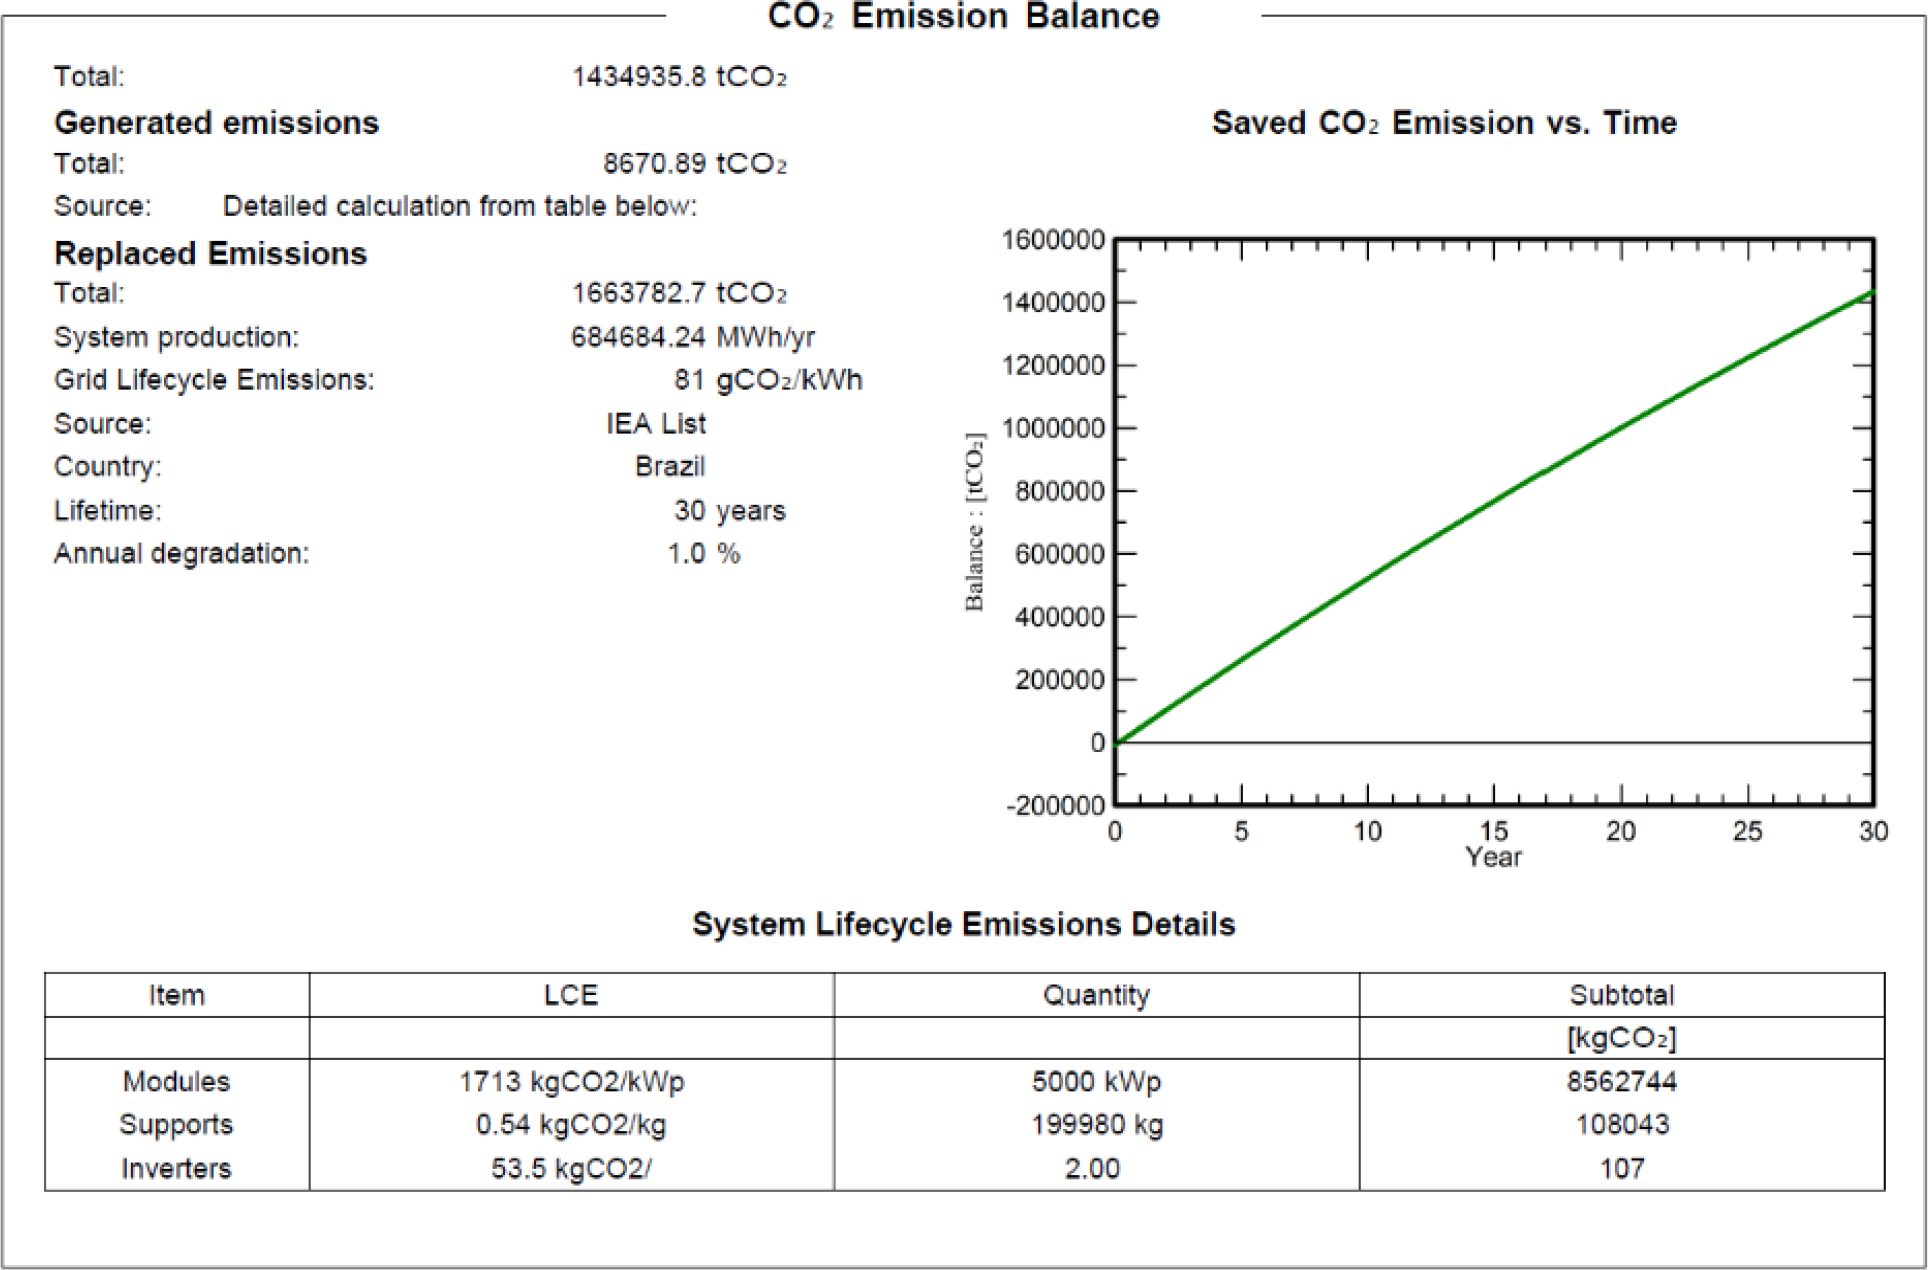
The FPVP does not emit greenhouse gases (GHGs). However there are some emissions into the atmosphere during panel manufacturing, installation, and maintenance [8]. Determining whether this technology can help protect the environment requires establishing the carbon footprint, which is responsible for accounting for the net carbon inputs and outputs from energy activities [28]. This carbon footprint study is based on a simulation performed in the PVsyst software, considering a system operating lifetime of 30 years. The estimated photovoltaic electricity generation is 684,684.24 MWh/yr and the CO2 emissions from the life cycle of the devices that make up the photovoltaic system at 8,670.89 t CO2/yr. Thus, the CO2 emissions avoided with the FPVP are 1,663,782.7 t CO2/yr. The diagram of CO2 emissions avoided over 30 years is shown in Figure 11.
Balance of Carbon Dioxide emissions avoided with the use of Floating Photovoltaic Plant
Installation of floating photovoltaic plants (FPVP) involves higher costs compared to photovoltaic plants (PV) in the ground. The investment costs of a conventional photovoltaic plant (PV) and a floating photovoltaic plant (FPVP), whose prices are higher due to the floating structure and monitoring system. The *CAPEX and **OPEX of (FPVP) are almost 20% higher for floating structures [17] [29]. On the other hand, the necessary cost of land acquisition and transmission system for ground (PV) is not considered compared to the cost of transmission of FPVP installed in the lake of the reservoir of an HPP and connected to the existing transmission system, as shown in Table 2.
Comparison of investment costs – Floating Photovoltaic Plant x Photovoltaic Plant on the ground
Component |
(FPV) (US$/Wp) |
(PV) (US$/Wp) |
|---|---|---|
Photovoltaic Modules |
0.25 |
0.25 |
Inverter |
0.06 |
0.06 |
Mounting system |
0.15 |
0.10 |
System supervision |
0.13 |
0.08 |
Design/build/test |
0.14 |
0.13 |
Total |
0.73 |
0.62 |
CAPEX: Capital Expenditure; Investment expenses in goods for the acquisition of installation equipment.
OPEX: Operational Expenditure; Operating expenses on equipment maintenance.
The total investment cost (CAPEX) required for the implementation of a 480 MWp floating photovoltaic plant (FPVP) in the reservoir lake of the Ilha Solteira hydroelectric power plant (HPP), is shown in Table 3.
Capital Expenditure of Floating Photovoltaic Plant
CAPEX (480 MWp) |
(US$/Wp) |
TOTAL (US$) |
% |
|---|---|---|---|
Photovoltaic Modules |
0.25 |
120.0 ×10⁶ |
34.24 |
Inverters |
0.06 |
28.8 ×10⁶ |
8.22 |
Mounting system |
0.15 |
72.0 ×10⁶ |
20.55 |
Supervision system |
0.13 |
62.4 ×10⁶ |
17.81 |
Design/build/test |
0.14 |
67.2 ×10⁶ |
19.18 |
Total |
0.73 |
350.4 ×10⁶ |
100.00 |
The total investment cost (OPEX) required for the operating expenses on equipment maintenance of a 480 MWp floating photovoltaic plant (FPVP) in the reservoir lake of the Ilha Solteira hydroelectric power plant (HPP), is shown in Table 4.
Operational Expenditure of Floating Photovoltaic Plant
OPEX (480 MWp) |
(US$/Wp) |
TOTAL (US$) |
% |
|---|---|---|---|
Operational Insurance |
0.00077 |
369.6 ×10³ |
20.61 |
Monitoring |
0.00057 |
273.6 ×10³ |
15.30 |
Preventive maintenance |
0.00119 |
571.2 ×10³ |
31.96 |
Corrective maintenance |
0.00120 |
576.0 ×10³ |
32.13 |
Total |
0.00373 |
1,790.4 × 10³ |
100.00 |
0.51% CAPEX |
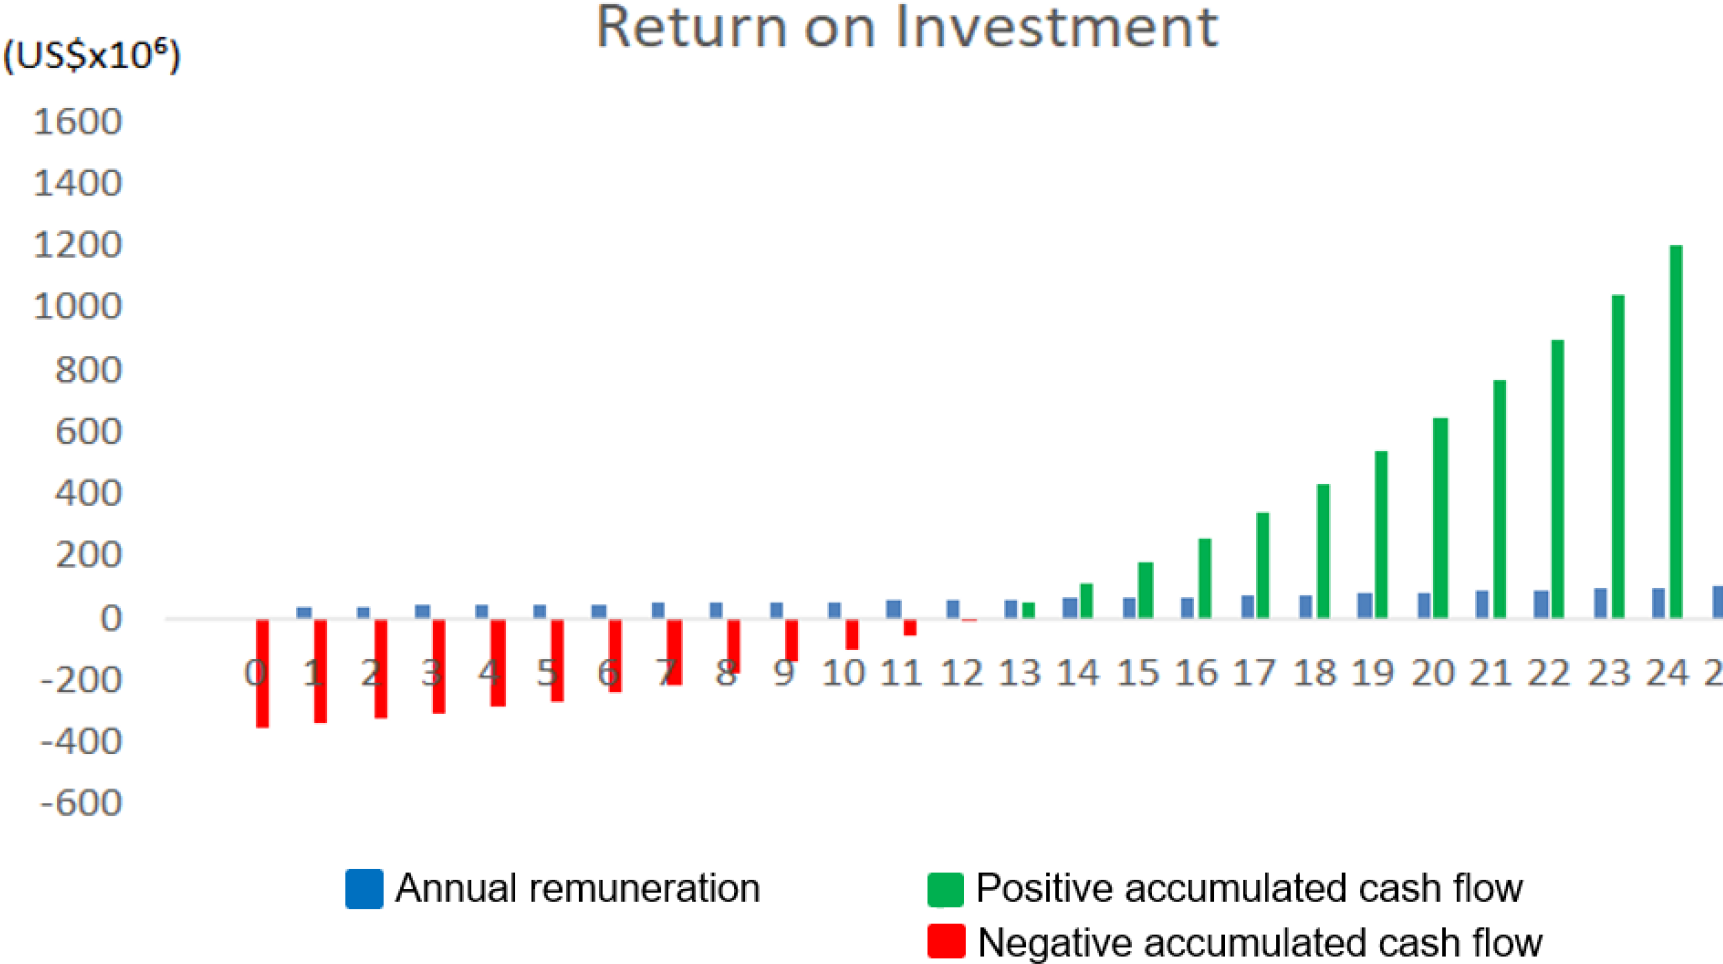
The calculation of the investment return (ROI) is crucial. The analysis carried out concerning the cost of implementing the technology regarding the benefit obtained. That is, the result obtained demonstrates how long the benefits will equal the investment. Considering the valuable life of the system of 25 years, and the average price of photovoltaic energy of US$1695/MWh, according to the Electric Energy Commercialization Chamber. The production of electricity from solar sources is 684,864 MWh/yr, calculated in the PVsyst, and the project's total investment of US$350,400,000.00, it will take the FPVP system 13 years to start producing a profit, as shown in Figure 12.
Return on investment
The deployment of the hybrid system of hydroelectric power plants (HPP) and floating photovoltaic plants (FPVP) opens a new frontier in the global expansion of renewable energy. It could double the installed solar photovoltaic capacity without acquiring land needed for ground-mounted installations. Provide the social development of communities close to the reservoirs, enabling the management of essential water resources for agriculture and river transport. In the analyzed scenarios, the acquired data in this paper point to a daily reserve of 7% in the water volume of the turbines due to the generation of photovoltaic energy in hydroelectric stock reserves, allowing strategic management of water resources, using solar production during the day and reserving water for use during long periods of drought and to prepared to climate change. Furthermore, combining solar dispatch with hydropower can smooth variability in solar output, making better use of transmission line asset management. Hydroelectric power plants can benefit where climatic seasonality influences water availability. Combined with other demonstrated environmental preservation and greenhouse gas production benefits, in addition, to increase energy yield, reduces hydroelectric lake water evaporation, and improves water quality. Considering a system's useful life of 25 years and 13 years to present positive financial results, the return-on-investment study suggests financial viability. Floating solar energy is an attractive option for many countries.
The authors declare no conflicts of interest regarding the publication of this paper.
- ,
Some Remarks about the Deployment of Floating PV Systems in Brazil ,Journal of Electrical Engineering , Vol. 5 ,pp 10–19 , 2017, https://doi.org/https://doi.org/10.17265/2328-2223/2017.01.002, Jan. - ,
Combining Floating Solar Photovoltaic Power Plants and Hydropower Reservoirs: A Virtual Battery of Great Global Potential ,Energy Procedia , Vol. 155 ,pp 403–411 , 2018, https://doi.org/https://doi.org/10.1016/j.egypro.2018.11.038, Nov. - ,
A Study on Power Generation Analysis of Floating PV System Considering Environmental Impact ,International Journal of Software Engineering and Its Applications , Vol. 8 ,pp 75–84 , 2014, https://doi.org/https://doi.org/10.14257/ijseia.2014.8.1.07, Jan. - ,
Theories and methodology of complementary hydro/photovoltaic operation: Applications to short-term scheduling ,Journal of Renewable and Sustainable Energy , Vol. 7 ,pp 063133 , 2015, https://doi.org/https://doi.org/10.1063/1.4939056, Nov. - ,
Dispatch performance analysis of PV power plants using various energy storage capacities , 2015, https://doi.org/https://doi.org/10.1109/IECON.2015.7392508, Nov. - ,
Integrating Floating Solar PV with Hydroelectric Power Plant: Analysis of Ghazi Barotha Reservoir in Pakistan ,Energy Procedia , Vol. 158 ,pp 816–821 , 2019, https://doi.org/https://doi.org/10.1016/j.egypro.2019.01.214, Feb. - ,
Floating photo voltaic power plant: A review ,Renewable and Sustainable Energy Reviews , Vol. 66 ,pp 815–824 , 2016, https://doi.org/https://doi.org/10.1016/j.rser.2016.08.051, Aug. - National Renewable Energy Laboratory (NREL), Doe Solar Energy Technologies Program, Annual Report, 2004, 2022, http://nrel.gov/docs/fy06osti/36804.pdf, Accessed: Apr. 15
- ,
Floating photovoltaic plants and wastewater basins: an Australian project ,Energy Procedia , Vol. 134 ,pp 664–674 , 2017, https://doi.org/https://doi.org/10.1016/j.egypro.2017.09.585, Oct. - Riding the wave of solar energy: Why floating solar installations are a positive step for energy generation, 20182023, https://www.semanticscholar.org/paper/Riding-the-wave-of-solar-energy%3A-Why-floating-solar/e42131cdb7b19f6c915d5a07806fe4e99ff4ad61, AvailableAccessed: Dec. 04
- ,
Scenarios for use of floating photovoltaic plants in Brazilian reservoirs ,IET Renewable Power Generation , Vol. 9 , 2015, https://doi.org/https://doi.org/10.1049/iet-rpg.2015.0120, Aug. - ,
Design and Installation of 500-kW Floating Photovoltaic Structures Using High-Durability Steel ,Energies , Vol. 13 , 49962020, https://doi.org/https://doi.org/10.3390/en13194996, p.Sep. - ,
Floating solar PV—hydroelectric power plants in Brazil: Energy storage solution with great application potential ,Int. J. EQ , Vol. 4 (1),pp 40–52 , 2019, https://doi.org/https://doi.org/10.2495/EQ-V4-N1-40-52, Mar. - ,
Feasibility Study of a Hydro PV Hybrid System Operating at a Dam for Water Supply in Southern Brazil ,Journal of Power and Energy Engineering , Vol. 3 (9), 2015, https://doi.org/https://doi.org/10.4236/jpee.2015.39006, Art. no. 9Sep. - Seaflex, The Mooring System, 2022, https://www.seaflex.com/products/seaflex-mooring-system, Accessed: Mar. 21
- ,
Solar water heating system and photovoltaic floating cover to reduce evaporation: Experimental results and modeling ,Renewable Energy , Vol. 105 ,pp 601–615 , 2017, https://doi.org/https://doi.org/10.1016/j.renene.2016.12.094, May - World Bank Group; Series; ESMAP. Where Sun Meets Water: Floating Solar Market Report, 2022, https://www.worldbank.org/en/topic/energy/publication/where-sun-meets-water, Accessed: Aug. 02
- ,
Floating Photovoltaic Systems Coupled with Pumped Hydroplants under Day-Ahead Electricity Market Conditions: Parametric Analysis ,Electronics , Vol. 12 (10), 2023, https://doi.org/https://doi.org/10.3390/electronics12102250, Art. no. 10Jan. - National Electrical System Operator (ONS), Operation History 2022, 2022, http://www.ons.org.br/páginas/resultados-da-operação/histórica-da-operação, Accessed: Mar. 20
- ,
Regularization of hydroelectric reservoir levels through hydro and solar energy complementarity ,RBRH , Vol. 21 ,pp 549–555 , 2016, https://doi.org/https://doi.org/10.1590/2318-0331.011615174, Sep. - ,
Floating PV: Assessing the Technical Potential of Photovoltaic Systems on Man-Made Water Bodies in the Continental U.S ,Environmental Science & Technology , Vol. 53 , 2018, https://doi.org/https://doi.org/10.1021/acs.est.8b04735, Dec. - , National Electric Energy Agency (ANEEL), Electric Energy Atlas of Brazil, Agência Nacional de Energia Elétrica, 2008
- Electric Energy Commercialization Chamber (CCEE), 2022, https://www.ccee.org.br/portal, Accessed: Apr. 20
- National Agency for Water and Basic Sanitation (ANA), 2022, https://www.gov.br/ana/pt-br/assuntos/aplicativos-sistemas/acesso-aos-sistemas, Accessed: Mar. 25
- The World Bank, CO2 emissions (metric tons per capita), 2022, https://data.worldbank.org/indicator/EN.ATM.CO2E.PC, Accessed: Jun. 20
- Global Greenhouse Gas Emissions Data, 2022, https://www.epa.gov/ghgemissions/global-greenhouse-gas-emissions-data, Accessed: Jun. 18
- ,
Potential of distributed generation and its impact on reducing CO2 emissions: Study of a micro photovoltaic plant connected to the electricity grid ,Engevista , Vol. 21 (2), 2019, https://doi.org/https://doi.org/10.22409/engevista.v21i2.27299, Art. no. 2May - Sector modeling of low carbon options for the sector of renewable sources of electricity generation. Ministry of Science, Technology, Innovation, and Communications (MCTIC), 2018, 2022, https://www.gov.br/mcti/pt-br, Accessed: Apr. 15
- Energy Research Company (EPE), Power Generation Costs Report 2021, 20222022, https://www.epe.gov.br/sites-pt/publicacoes-dados-abertos/publicacoes/PublishingImages/pt/publicacoes-dados-abertos/publicacoes/caderno-de-precos-da-geracao/EPE_Power%20Generation%20Costs%20Report%202021.pdf, Aug.Accessed: Apr. 15