


Recently, researchers have suggested further investigation on the contribution of energy types, including clean cooking fuels, in separating indicators of the SDGs and increasing the effectiveness of energy access projects, which considers the need for local development [1]. There is currently a significant concern regarding pre-processing strategies in producing economically viable biofuels, such as biomass hydrolysis, which consumes a substantial amount of energy and is deemed inefficient in terms of cost-effectiveness [2]. Biomass source from the kesambi tree (Schleichera oleosa L.) holds potential as an energy resource due to its high calorific value. Kesambi wood, characterised by its elevated calorific value, is around 60 per cent denser than teak wood [3]. In Indonesia, particularly in the East Nusa Tenggara (ENT) Province, kesambi wood is extensively used as biomass fuel for cooking, especially in making se'i meat, a traditional smoked meat from Rote Island in ENT. Kesambi wood, known for its dense, robust texture and varying shades from pink to grey, boasts a remarkable energy value of up to 20.80 MJ/kg [3].
Kesambi wood is the preferred fuel resource for grilling and smoking se'i meat because of its high energy and impact on the specific flavour of the se'i meat. However, the extensive use of kesambi wood for fuel raises significant concerns regarding its conservation. This research aims to find alternative fuel from kesambi leaves, which are made into briquettes for grilling and smoking se'i meat while maintaining its flavour.
Compared to fossil fuel, biomass feedstocks encounter several challenges, including low bulk density, elevated moisture content, hydrophilic attributes, and reduced calorific value, rendering raw biomass less practical for large-scale utilisation [4]. Thermochemical conversion, encompassing temperature, duration, and oxygen presence, involving torrefaction, pyrolysis, gasification, and direct combustion, cannot be excluded [5]. Torrefaction, a thermal conversion technique, operates within the temperature range of 200 °C to 300 °C, leading to the depolymerisation of a significant portion of biomass hemicellulose [6]. This process is executed in an oxygen-devoid atmosphere with low heating rates and a relatively prolonged reactor residence time, often around 1 hour [7]. The hydrophilic and fibrous nature, coupled with low calorific and bulk energy content, results in substantial accumulation costs across the supply chain, presenting substantial challenges for advanced conversion systems [8]. Integrating torrefaction with co-firing, gasification, or pyrolysis yields superior efficiency and economic viability compared to independent processes [9].
Biomass has a lower fixed carbon content and a greater volatile matter content than coal. For instance, the typical ranges for the volatile matter content of biomass and coal are 67–88 wt% and 0.5–50 wt%, respectively. Coal and biomass have fixed carbon concentrations of 46–92 wt% and 0.5–20 wt%, respectively [10]. The processes of dehydration and devolatilisation continue when biomass experiences torrefaction. As a result, most of the H and O contained in the biomass is extracted together with the moisture and light volatile components [11]. Investigation into spruce torrefaction has determined that torrefaction temperature carries more impact than residence time up to 275 °C. In contrast, at 300 °C, residence time profoundly influences semi-char sample composition due to intensive cellulose decomposition [12]. Elevated torrefaction temperatures yield denser semi-char solid products with increased fixed carbon content and enhanced calorific value [13].
The combustion of charred biomass versus untreated biomass shows that the distribution of semi-char products is highly dependent on process conditions such as torrefaction temperature and residence time, and the combustion characteristics of semi-char products make them suitable for fuel applications [14]. Torrefaction testing of gandarusa (Justicia gendarussa) leaves as raw biomass material to convert it into solid briquettes or pellets has proven more effective than carbonisation [15]. Solar energy-driven complete transformation to briquettes was analysed for gandarusa leaves, achieving an energy-neutral production cycle. The superior performance of a 45.55% starch binder suggests that the amount of binder employed affects the briquettes' characteristics [16]. Lignocellulosic biomass processing, as well as the use and exploitation of nanomaterials, present significant obstacles. Bioenergy production is anticipated to increase if these problems can be resolved, signalling a pivotal time for the environmentally friendly fuel industry [17].
In this investigation, briquette fuel was employed due to the larger size requirement of biomass products for se'i smoking than bio-pellets. Incorporating a binder is pivotal for augmenting the mechanical resilience of biobriquettes and safeguarding against transportation or storage damage. Commonly used binders in biobriquette production encompass lignin, cellulose, and starch. Prior studies have evidenced that binder utilisation enhances the compressive strength and density of biobriquettes. Nevertheless, binder type and quantity necessitate meticulous consideration to prevent interference with desired chemical and physical biobriquette properties.
Optimising torrefaction product particle size and incorporating binders can be executed via response surface methodology and central composite design utilising Design Expert 13. This experimental technique employs mathematical aspects to predict responses when multiple input variables are altered.
The variables under scrutiny in this investigation are particle size and binder quantity. Evaluation of biobriquettes encompasses their physical and chemical attributes like density, compressive strength, moisture content, and calorific value. Employing response surface methodology with the central composite design aims to uncover the optimal conditions for each variable, thereby generating high-quality, eco-friendly biobriquettes as a substitute for fossil fuels. The study will culminate in a refined response model for biobriquettes, hinged upon the particle size of semi-char and kesambi products and the binder quantity employed.
This research utilised torrefied kesambi leaves and tapioca binder as its foundational materials. Kesambi leaves underwent torrefaction at 300 °C for 20 minutes, drawing from earlier investigations. The research was conducted at the Exact Sciences Laboratory of Artha Wacana Christian University and the Bioscience Laboratory of Nusa Cendana University in Kupang, Indonesia.
The size of kesambi leaf powder tested in this study ranged from 12 mesh to 70 mesh, with a tapioca binder ratio of 3–17% to the mass of kesambi leaves in each treatment combination tested. The Response Surface Methodology (RSM) approach was used in the design of this study, which was then evaluated using Central Composite Design (CCD) and Design Expert 13 (DX13) software. This design is an organised, systematic approach to optimising and designing experiments. Interactions according to RSM are presented in Table 1.
Interaction of powder size and binder ratio using a centralised composite design
| StdOrder | RunOrder | PtType | Blocks | Particle size [mesh] | Binder ratio [%] |
|---|---|---|---|---|---|
| 3 | 1 | 1 | 1 | 20 | 15 |
| 5 | 2 | -1 | 1 | 12 | 10 |
| 6 | 3 | -1 | 1 | 70 | 10 |
| 10 | 4 | 0 | 1 | 40 | 10 |
| 11 | 5 | 0 | 1 | 40 | 10 |
| 4 | 6 | 1 | 1 | 60 | 15 |
| 1 | 7 | 1 | 1 | 20 | 5 |
| 2 | 8 | 1 | 1 | 60 | 5 |
| 8 | 9 | -1 | 1 | 40 | 17 |
| 12 | 10 | 0 | 1 | 40 | 10 |
| 13 | 11 | 0 | 1 | 40 | 10 |
| 7 | 12 | -1 | 1 | 40 | 3 |
| 9 | 13 | 0 | 1 | 40 | 10 |
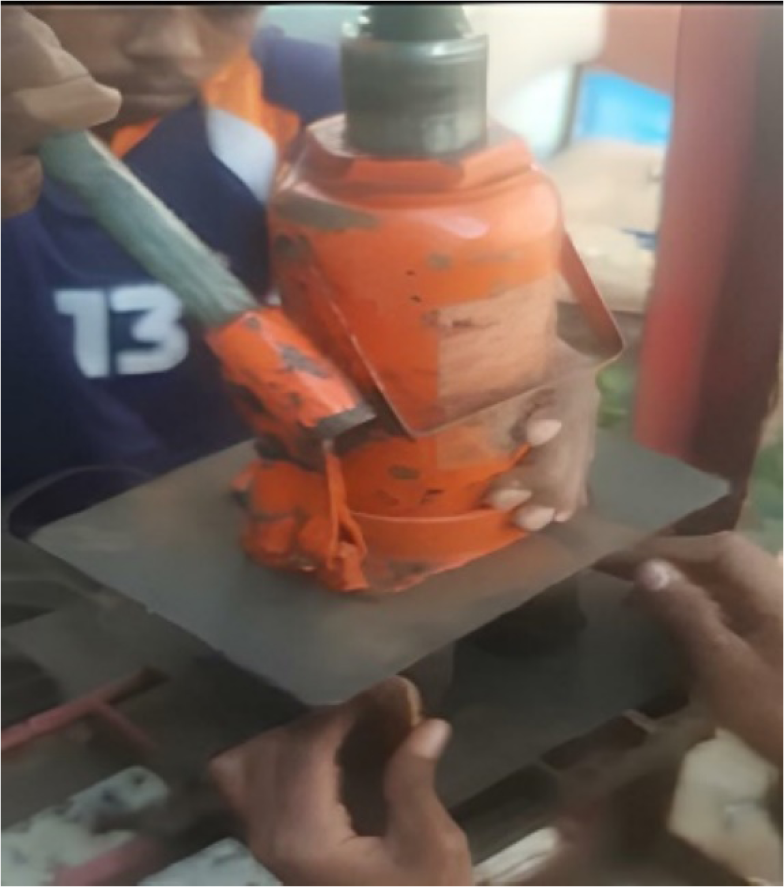
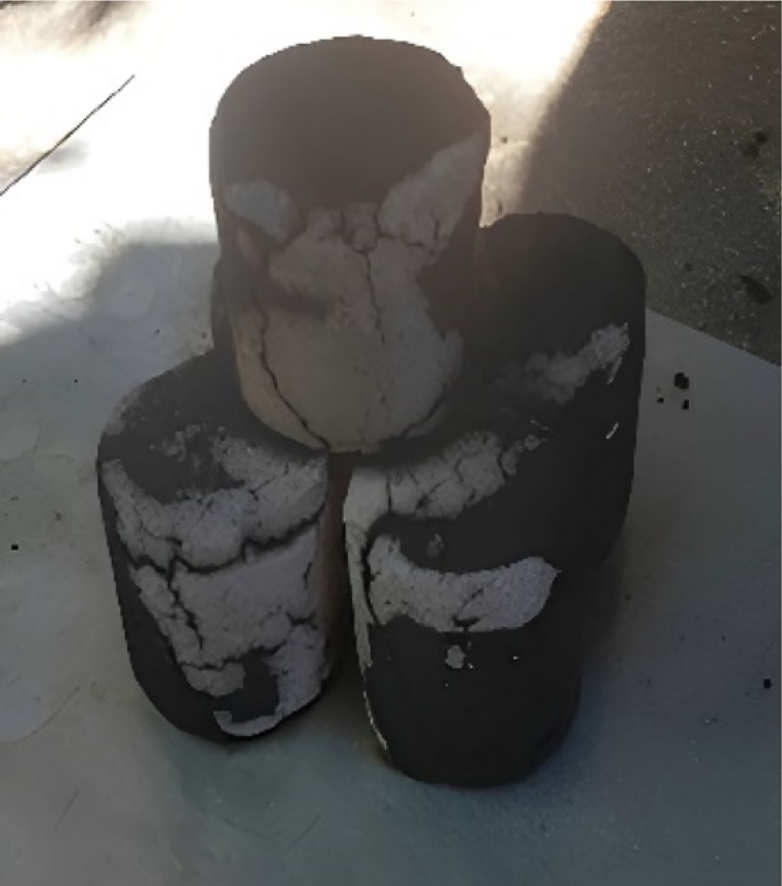
Subsequently, tapioca adhesive was mixed with water in a weight/volume ratio 1:8 and boiled until thickened. The prepared binder material was then combined with finely powdered kesambi leaves, and the resulting mixture was moulded into briquettes with a diameter of 4 cm and a height of 8 cm using a moulding tool, as depicted in Figure 1. The produced briquettes were air-dried for 10 days under sunlight. The biobriquettes produced and directed to combustion are presented in Figure 2.
Briquette moulding equipment
Briquettes
Various attributes of the biobriquettes were ascertained, including moisture content (MC), evaluated using ASTM D3173 [18] by comparing it with the dry weight of the briquettes. Ash content was determined by subjecting the sample to a 600 °C heat for 2 hours ASTM D1102-84 [19]. Volatile matter (VM) was measured per the standard ASTM D3175 [20] by heating the briquettes to 900 °C for 7 minutes. The fixed carbon (FC) represents the carbon fraction of the briquettes, excluding MC, ash content, and VM, according to ASTM D3172 [21]. Briquette density [g/cm3] was derived by comparing mass and volume [22]. The calorific value [MJ/kg] was assessed using ASTM D5865 [23]. Total phenol [mgGAE/g] was determined via the Folin-Ciocalteu method. The model's suitability was assessed using the lack of fit test and coefficient of determination.
The results of optimising moisture content, ash, volatile matter, fixed carbon, briquette density, calorific value, and total phenolics are presented in Table 2. F-values corresponding to these response parameters, including MC, ash content, VM, FC, briquette density, calorific value, and total phenol, were significant at P<0.05 for particle size and binder ratio.
The response for the combination of particle size and binder ratio treatments
| Std | Run | Particle size | Binder ratio | MC (wet basis) | Ash content | VM | FC | Briq. density | Calorific value | Total phenol |
|---|---|---|---|---|---|---|---|---|---|---|
| [mesh] | [%] | [%] | [%] | [%] | [%] | [g/cm3] | [MJ/kg] | [mgGAE/g] | ||
| 7 | 1 | 40 | 3 | 5.39 | 3.48 | 13.63 | 77.50 | 0.44 | 14.97 | 1.24 |
| 4 | 2 | 60 | 15 | 7.42 | 1.75 | 16.99 | 73.83 | 0.58 | 15.79 | 0.71 |
| 5 | 3 | 12 | 10 | 3.64 | 3.02 | 15.06 | 78.28 | 0.51 | 14.74 | 1.62 |
| 6 | 4 | 70 | 10 | 4.67 | 1.65 | 15.82 | 77.86 | 0.62 | 15.94 | 0.77 |
| 3 | 5 | 20 | 15 | 5.64 | 2.54 | 14.54 | 77.28 | 0.47 | 14.64 | 1.26 |
| 1 | 6 | 20 | 5 | 5.63 | 3.28 | 14.61 | 76.49 | 0.45 | 15.00 | 1.49 |
| 2 | 7 | 60 | 5 | 3.64 | 2.87 | 14.20 | 79.30 | 0.50 | 15.78 | 0.99 |
| 12 | 8 | 40 | 10 | 4.01 | 2.16 | 15.25 | 78.58 | 0.45 | 15.25 | 0.81 |
| 11 | 9 | 40 | 10 | 4.34 | 2.14 | 14.37 | 79.15 | 0.52 | 15.45 | 0.99 |
| 8 | 10 | 40 | 17 | 8.46 | 2.31 | 16.11 | 73.11 | 0.53 | 15.06 | 0.65 |
| 9 | 11 | 40 | 10 | 3.65 | 2.56 | 14.42 | 79.37 | 0.51 | 15.37 | 0.98 |
| 13 | 12 | 40 | 10 | 4.49 | 2.84 | 14.22 | 78.44 | 0.45 | 15.00 | 0.79 |
| 10 | 13 | 40 | 10 | 6.07 | 2.12 | 14.25 | 77.55 | 0.54 | 15.65 | 1.10 |
Table 3 depicts the results of the lack of fit tests for the response parameters. The tests conducted on the response parameters, including MC, ash content, VM, FC, briquette density, calorific value, and total phenol, yield results that are not significant, indicating the appropriateness of the models in predicting the relationship between particle size and binder ratio.
Evaluation of mathematical models for moisture content, ash content, volatile matter, and fixed carbon response parameters
| Response | MC (wet basis) | Ash content | VM | FC | Briq. density | Calorific value | Total phenol |
|---|---|---|---|---|---|---|---|
| [%] | [%] | [%] | [%] | [g/cm3] | [MJ/kg] | [mgGAE/g] | |
| Model | Quadratic | Linear | Quadratic | Quadratic | Quadratic | Linear | Quadratic |
| F-Value | 8.38 | 13.40 | 14.39 | 26.40 | 4.63 | 17.46 | 15.25 |
| P-Value | 0.01 | 0.00 | 0.00 | 0.00 | 0.03 | 0.00 | 0.00 |
| Lack of Fit | 0.15 | 0.98 | 0.37 | 0.20 | 0.24 | 0.70 | 0.39 |
| R² | 0.86 | 0.73 | 0.91 | 0.95 | 0.77 | 0.78 | 0.92 |
| Adjusted R² | 0.75 | 0.67 | 0.85 | 0.91 | 0.60 | 0.73 | 0.86 |
| Predicted R² | 0.70 | 0.54 | 0.75 | 0.88 | 0.44 | 0.63 | 0.76 |
| Adeq Precision | 9.18 | 10.76 | 13.18 | 15.55 | 7.63 | 12.28 | 12.70 |
The R² value is close to 1 for the response parameters MC, ash content, VM, FC, briquette density, calorific value, and total phenol. It shows the data that fit the model and that the model represents the observed data correctly. The difference between the Adjusted R² and Predicted R² values for this parameter is less than 0.2, which indicates a reasonable fit to the resulting model and meets the criteria. In addition, the Adeq Precision value for this response parameter is greater than 4, indicating an excellent fit of the model to the data.
The outcomes of the Anova test shown in Table 4 indicate the significance of the quadratic model in the VM parameter, with particle size and binder ratio treatments yielding F-values surpassing the corresponding P-values.
Anova of the moisture content parameter
| Sources | Sum of squares | df | Mean square | F-value | P-value | |
|---|---|---|---|---|---|---|
| Models | 23.11 | 5 | 4.62 | 8.38 | 0.01 | significant |
| A − particle size | 0.19 | 1 | 0.19 | 0.35 | 0.57 | |
| B − binder ratio | 8.29 | 1 | 8.29 | 15.04 | 0.01 | |
| AB | 3.56 | 1 | 3.56 | 6.45 | 0.04 | |
| A² | 0.19 | 1 | 0.19 | 0.36 | 0.57 | |
| B² | 10.31 | 1 | 10.31 | 18.70 | 0.00 | |
| Residual | 3.86 | 7 | 0.55 | |||
| Lack of Fit | 0.38 | 3 | 0.13 | 0.15 | 0.93 | not significant |
| Pure Error | 3.48 | 4 | 0.87 | |||
| Cor Total | 26.97 | 12 |
The model of moisture content (MC, [%]) can be expressed through the following equation:
(1)
A particle size that is too fine can complicate the mixing and compaction process, resulting in a higher water content in the briquettes. The amount of binder used to produce kesambi leaf briquettes is an important factor in achieving the ideal MC level in the final product. An insufficient binder can cause the briquettes to crumble easily, while an excessive amount will make the briquettes difficult to burn.
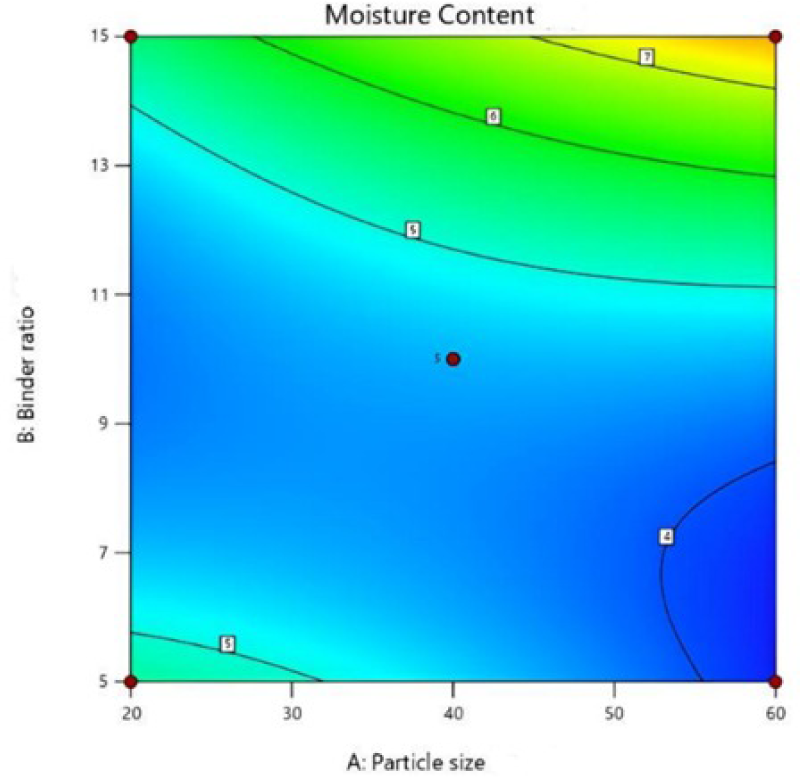
Figure 3 and Figure 4 depict the MC response parameter through both the surface and contour plots, showcasing a clear trend. These visualisations indicate that utilising a finer particle size (smaller mesh) and minimising binder usage tend to decrease MC levels. The amount of binder utilised is critical to the MC response calculation. Low binder content can lead to high MC in briquettes, hindering effective burning and producing excessive smoke.
Torrefaction emerges as a viable solution to enhance the attributes of standard briquettes and mitigate moisture absorption during storage, as noted by [24]. Research outcomes indicate that a blend of rice husk and peanut shell briquettes exhibits MC ranging from 3.96% to 5.65% [25].
The moisture content parameters' contour response
The moisture content parameters' surface plot
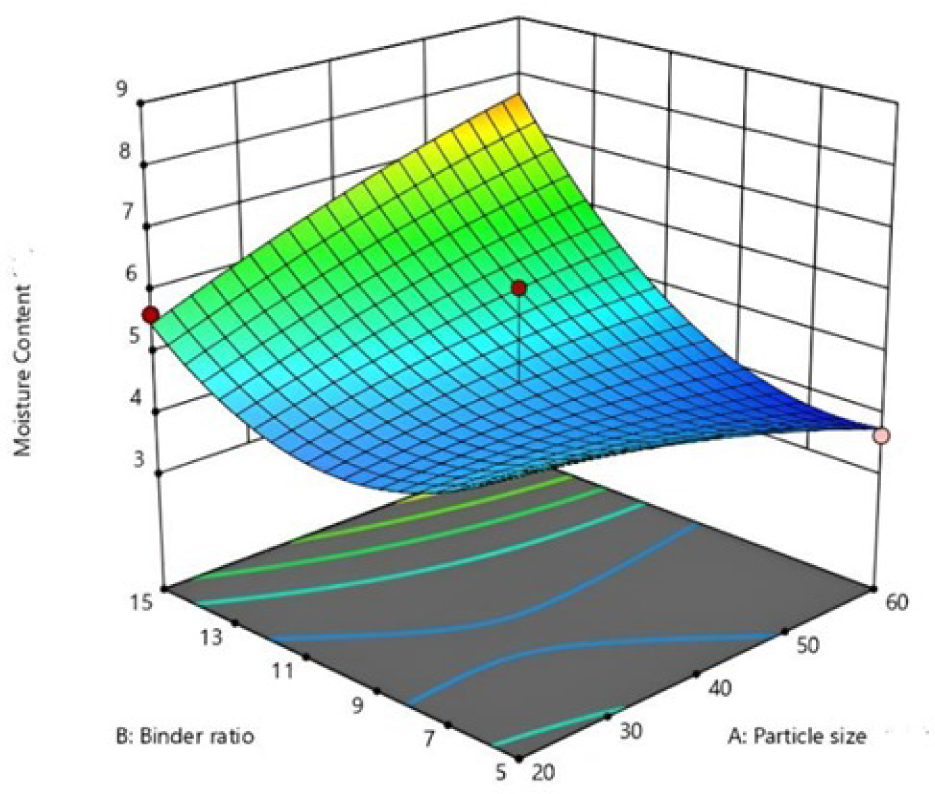
The production of biobriquettes utilising coconut shell charcoal, a biomass composite material, yields an MC of 5.8% [26]. Charcoal briquettes demonstrate greater hydrophobic properties than biomass briquettes (control), implying reduced MC compared to the control sample. Furthermore, higher binder content leads to increased VM and MC, greater charcoal briquette content, and reduced FC [27].
The outcomes of the Anova test are significant, specifically when employing a linear model (without interaction) for the ash content response variable. The treatments involving particle size and binder ratio exhibit an F-value that surpasses the corresponding P-value (Table 5).
Anova of the ash content parameter
| Sources | Sum of squares | df | Mean square | F-value | P-value | |
|---|---|---|---|---|---|---|
| Models | 2.76 | 2 | 1.38 | 13.40 | 0.00 | significant |
| A − particle size | 1.23 | 1 | 1.23 | 11.90 | 0.01 | |
| B − binder Ratio | 1.54 | 1 | 1.54 | 14.89 | 0.00 | |
| Residual | 1.03 | 10 | 0.10 | |||
| Lack of Fit | 0.62 | 6 | 0.10 | 0.99 | 0.53 | not significant |
| Pure Error | 0.42 | 4 | 0.10 | |||
| Cor Total | 3.79 | 12 |
The model of ash content [%] can be expressed through the following equation:
(2)
Figure 5 and Figure 6 visually represent the corresponding contour and surface plots.
The ash parameters' contour response
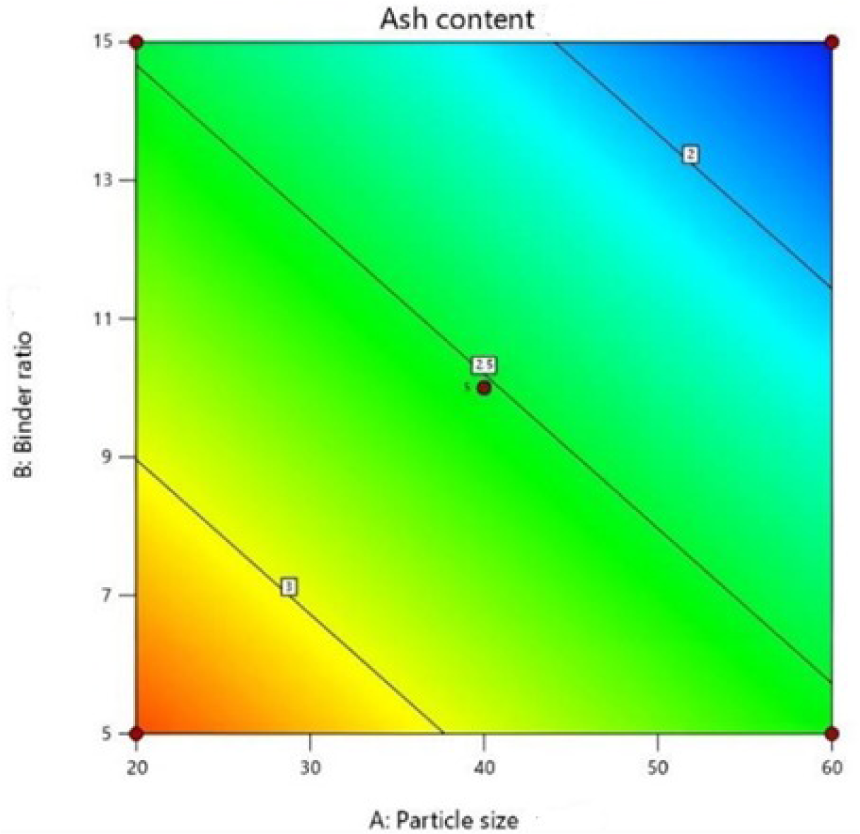
The ash content parameters' surface plot
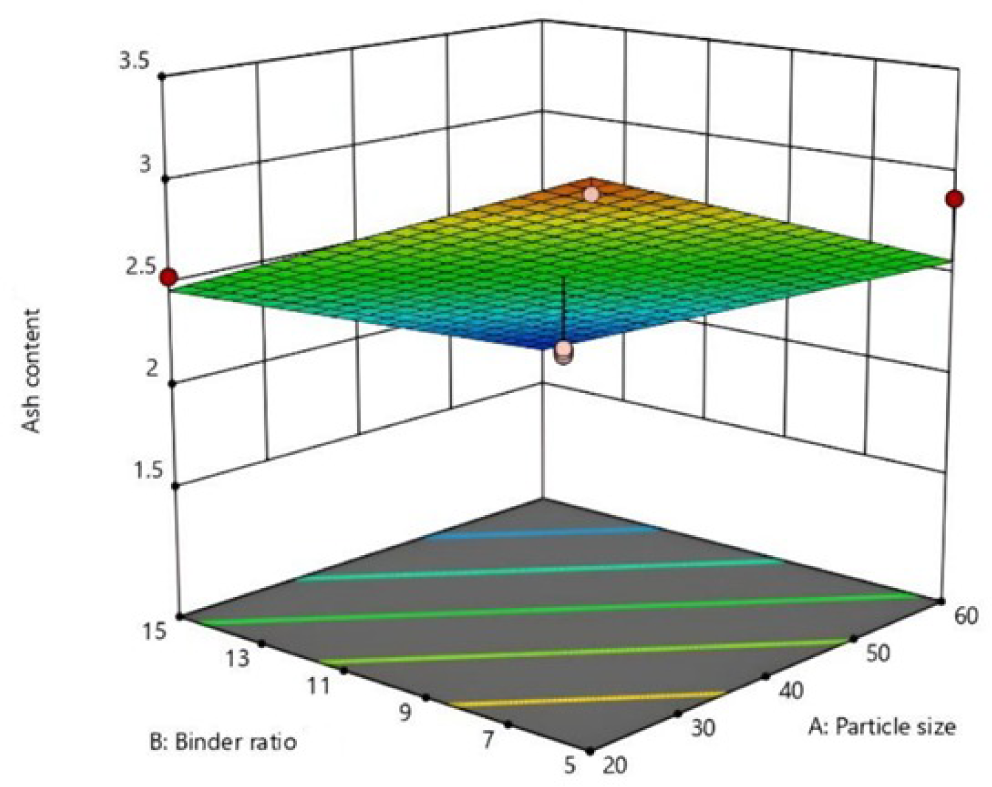
These graphics show a trend where lower ash content is correlated with finer particle sizes (corresponding to smaller mesh values) and an increased binder ratio. The binder ratio significantly impacts the ash content response, demonstrating its importance. Surprisingly, particle size and binder quantity have no visible effect on the amount of ash in kesambi leaf briquettes. It has been found that using kesambi leaf with a finer particle size (60 mesh) tends to result in less ash production. This feature not only facilitates the attainment of lower moisture contents in the briquettes but also provides an additional benefit of a significant increase in surface area. Moreover, the amount of binder used in the process of creating torrefied kesambi leaf briquettes has a significant effect on the final ash concentration. When there is not enough binder, the briquettes are likelier to break and produce increased ash.
The outcomes of the Anova test in Table 6 show the significance of the quadratic model in the VM parameter, indicating that particle size and binder ratio treatments yield F-values surpassing the corresponding P-values.
Anova of volatile matter parameter
| Sources | Sum of squares | df | Mean square | F-value | P-value | |
|---|---|---|---|---|---|---|
| Models | 9.64 | 5 | 1.93 | 14.39 | 0.00 | significant |
| A − particle size | 1.22 | 1 | 1.22 | 9.11 | 0.024 | |
| B − binder ratio | 4.87 | 1 | 4.87 | 36.37 | 0.00 | |
| AB | 2.05 | 1 | 2.05 | 15.33 | 0.01 | |
| A² | 1.41 | 1 | 1.41 | 10.56 | 0.01 | |
| B² | 0.19 | 1 | 0.19 | 1.40 | 0.27 | |
| Residual | 0.94 | 7 | 0.13 | |||
| Lack of Fit | 0.21 | 3 | 0.07 | 0.37 | 0.78 | not significant |
| Pure Error | 0.73 | 4 | 0.18 | |||
| Cor Total | 10.58 | 12 |
The model of volatile matter (VM, [%]) can be expressed through the following equation:
(3)
When kesambi leaves are torrefied, an increase in particle size causes a decrease in VM. This phenomenon arises from the larger particle size accelerating the breakdown of organic substances in the biomass, producing volatile gases. Subsequently, these gases dissipate, leaving behind a more stable biomass. Intricate changes in VM within kesambi leaf briquettes are also a result of the complex interaction between particle size and binder ratio. Low binder ratios can cause VM to rise, making combustion difficult and producing significant smoke.
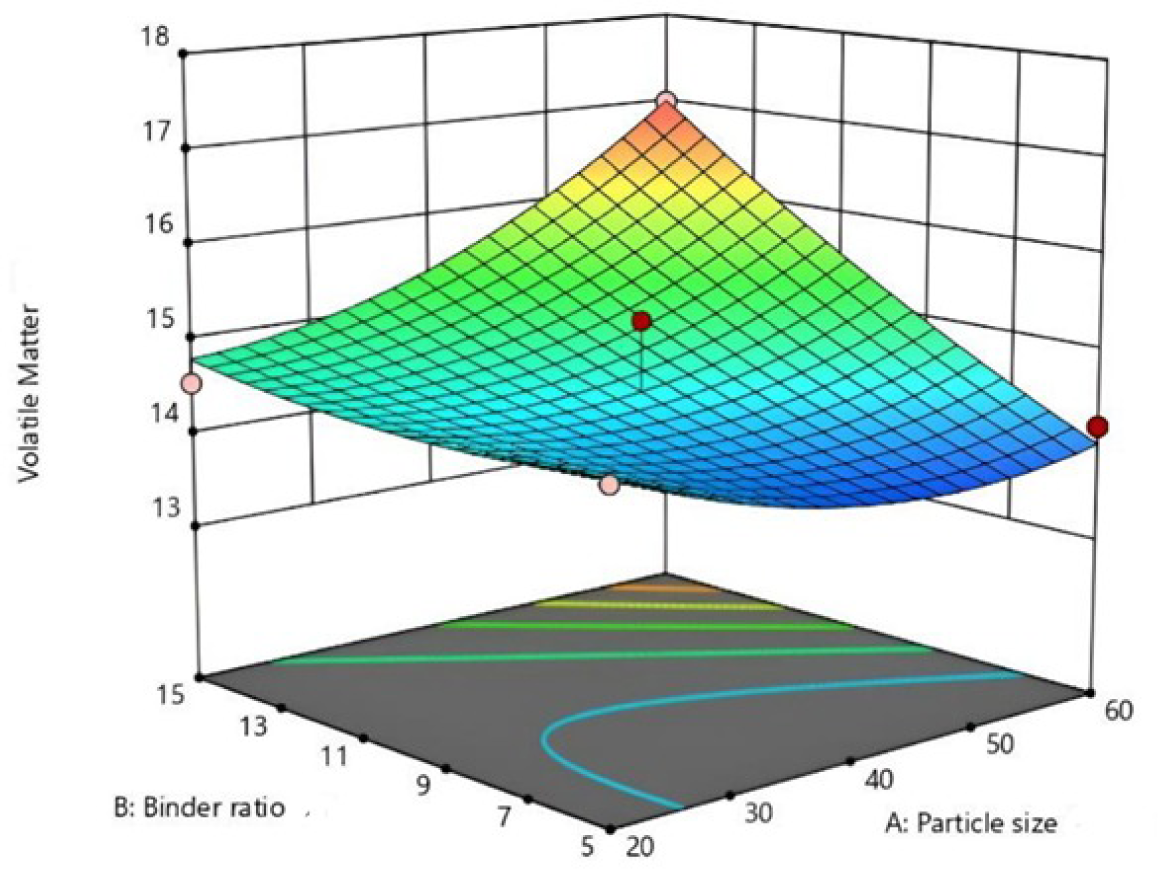
Surface plots and contours show the variation in VM in striking detail in Figures 7 and 8. These graphics highlight the tendency for lower binder ratios, smaller mesh values, and finer particle sizes to result in lower VM.
In the production process of torrefied kesambi leaf briquettes, the interaction effect between particle size and the amount of binder significantly influences the volatile matter produced. The VM parameter represents the proportion of combustible elements, making it crucial for determining the heating value of the fuel. The results revealed that particle size impacted VM in burnt kesambi leaf briquettes, with finer particles indicating increased VM in the produced briquettes. Due to their larger specific surface area, finer particles promote enhanced binder absorption and moisture absorption.
The volatile matter parameters' contour response
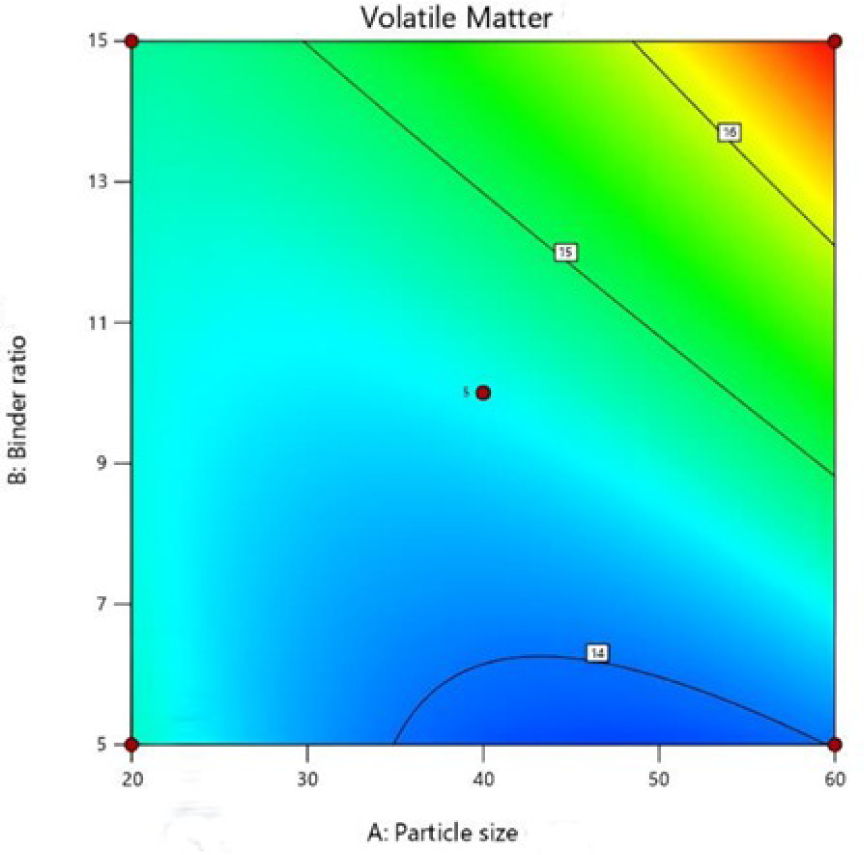
The volatile matter parameters' surface plot
Increased MC and binder ratio in briquettes speed up the breakdown of organic matter, resulting in increased VM. Binder quantity further plays a role in influencing VM within briquettes and kesambi leaves. A lower binder content translates to diminished VM due to decelerated organic matter decomposition. The VM of briquettes produced from tannery solid waste is between 1.61% and 4.56% [28].
The outcomes of the Anova test in Table 7 show the significance of the quadratic model in the FC parameter, with particle size and binder ratio treatments yielding F-values surpassing the corresponding P-values.
Anova of fixed carbon parameter
| Sources | Sum of squares | df | Mean Square | F-value | P-value | |
|---|---|---|---|---|---|---|
| Models | 43.64 | 5 | 8.73 | 26.40 | 0.00 | significant |
| A − particle size | 0.19 | 1 | 0.19 | 0.5783 | 0.47 | |
| B − binder Ratio | 14.80 | 1 | 14.80 | 44.76 | 0.00 | |
| AB | 9.79 | 1 | 9.79 | 29.62 | 0.00 | |
| A² | 0.49 | 1 | 0.49 | 1.48 | 0.26 | |
| B² | 18.84 | 1 | 18.84 | 56.98 | 0.00 | |
| Residual | 2.31 | 7 | 0.33 | |||
| Lack of Fit | 0.29 | 3 | 0.09 | 0.19 | 0.89 | not significant |
| Pure Error | 2.02 | 4 | 0.5 | |||
| Cor Total | 45.96 | 12 |
The model of fixed carbon (FC, [%])can be expressed through the following equation:
(4)
Figures 9 and Figure 10 visually represent the contour and surface plots associated with the fixed carbon response parameter. Using finer particles in torrefied kesambi leaf briquettes significantly increases the FC content. This pattern emerges because smaller particles facilitate the rapid breakdown of organic matter in biomass, resulting in a more stable fraction of carbon. Additionally, higher binder ratios contribute to higher FC content in kesambi leaf briquettes. The increased binder ratio prolongs the time biomass interacts with larger particle sizes, allowing more organic matter to break down and raising the FC content.
The fixed carbon parameters' contour response
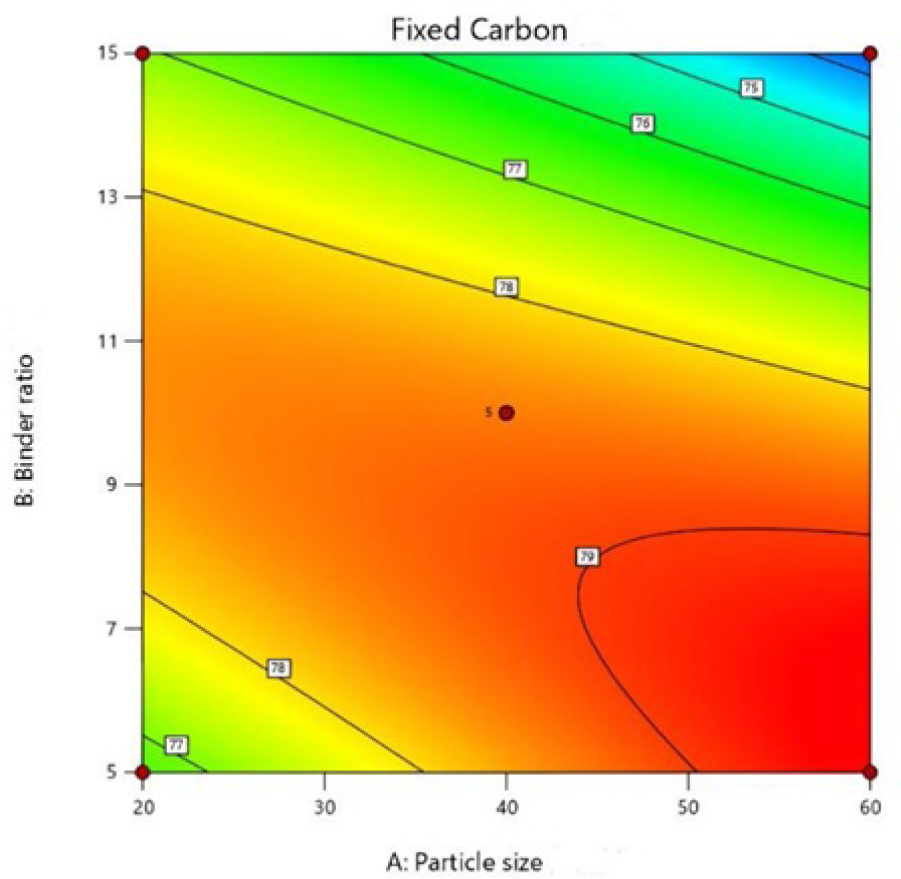
The results indicate that particle size significantly influences the fixed carbon content in kesambi leaf briquettes. Finer particles contribute to an increase in the fixed carbon content of the resulting briquettes, primarily due to their larger surface area, promoting enhanced binding and water absorption. Moreover, the amount of binder also has a notable impact on the fixed carbon content of kesambi leaf briquettes.
The fixed carbon parameters' surface plot
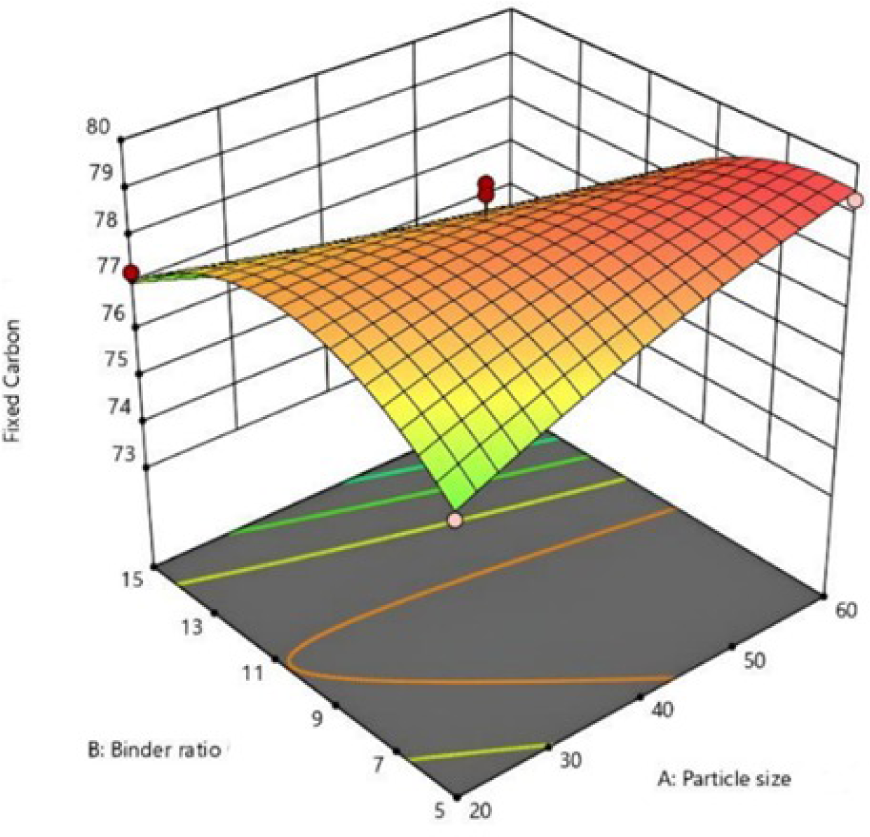
Increasing the torrefaction particle size inherently increases the fixed carbon content in kesambi leaves. This effect is attributed to the larger particle size, which accelerates the decomposition of organic matter in the biomass, resulting in a more stable FC content. A higher binder ratio also increases FC content in processed kesambi leaves. This dynamic is driven by the higher binder ratio, which extends the duration of interaction between biomass and larger particle sizes, promoting increased decomposition of organic matter and an elevated FC content. The proximate analysis illuminates that sawdust briquettes witness a 38.15% surge in FC content and a substantial 70.69% reduction in MC, fostering an enhanced combustion quality [29].
The binder ratio further influences the FC content response, and the interaction between particle size and binder ratio causes fluctuations in FC content in kesambi leaf briquettes. A lower binder ratio increases the FC content, leading to ignition challenges and increased smoke production.
The outcomes of the Anova test in Table 8 show the significance of the quadratic model in the density parameter, with both particle size and binder ratio treatments yielding F-values that surpass the corresponding P-values.
Anova of the density parameter
| Sources | Sum of square | df | Mean Square | F-value | P-value | |
|---|---|---|---|---|---|---|
| Models | 0.03 | 5 | 0.01 | 4.63 | 0.03 | significant |
| A − particle size | 0.01 | 1 | 0.01 | 10.28 | 0.01 | |
| B − binder ratio | 0.01 | 1 | 0.01 | 5.22 | 0.06 | |
| AB | 0.00 | 1 | 0.00 | 0.68 | 0.44 | |
| A² | 0.01 | 1 | 0.01 | 5.66 | 0.05 | |
| B² | 0.00 | 1 | 0.00 | 0.69 | 0.43 | |
| Residual | 0.01 | 7 | 0.00 | |||
| Lack of Fit | 0.00 | 3 | 0.00 | 0.24 | 0.86 | not significant |
| Pure Error | 0.01 | 4 | 0.00 | |||
| Cor Total | 0.03 | 12 |
The model of density [g/cm3] can be expressed through the following equation:
(5)
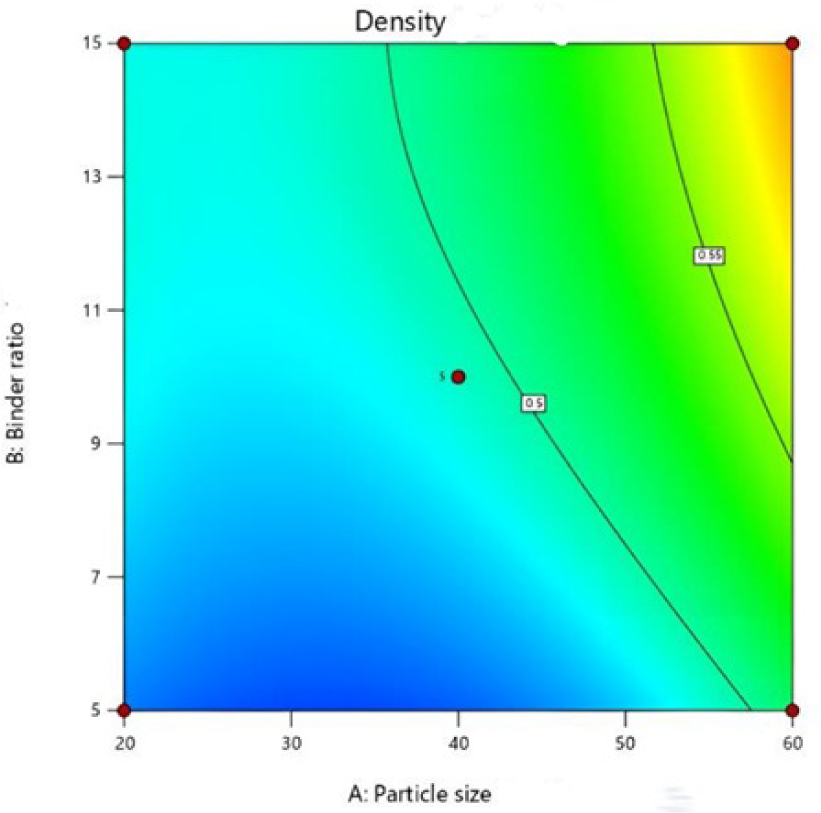
Figure 11 and Figure 12 show the contour and surface plots depicting the briquette density response parameter.
The density parameters' contour response
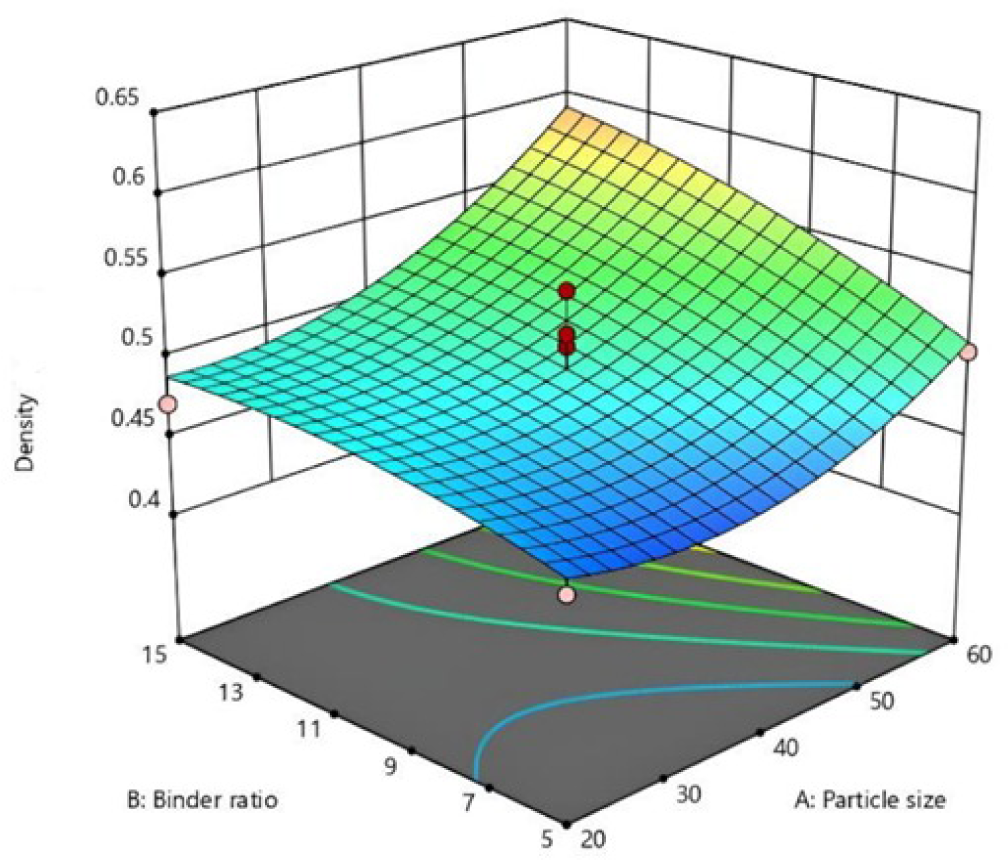
The density parameters' surface plot
The interaction between particle size and binder volume influences the density of kesambi leaf briquettes. A low amount of binder can cause briquettes to burn more easily and produce a lot of smoke. Optimal briquette density is important in increasing the calorific value of briquettes, facilitating transportation, and increasing storage effectiveness. In the production scheme of torrefied kesambi leaf briquettes, consideration of the interaction between particle size and binder ratio is the most important thing.
A higher briquette density is achieved through precise control of particle size. The expansion of the surface area of tiny particles enhances water absorption. Briquette density increases with higher moisture content and binder ratios.
Binder quantity further punctuates the ebbs and flows of kesambi leaf briquette density. Limited binder quantities correspond to lower briquette density, as the protracted decomposition of organic matter translates into less compact briquettes. The briquettes' bulk density and calorific value are 0.7−0.8 g/cm3 and 6400−6700 kcal/kg respectively [30].
The outcomes of the Anova test in Table 9 show the significance of the linear model in the calorific value parameter, with both particle size and binder ratio treatments yielding F-values that surpass the corresponding P-values.
Anova of the calorific value parameter
| Sources | Sum of squares | df | Mean square | F-value | P-value | |
|---|---|---|---|---|---|---|
| Models | 1.64 | 2 | 0.82 | 17.46 | 0.00 | significant |
| A − particle size | 1.63 | 1 | 1.63 | 34.80 | 0.00 | |
| B − binder ratio | 0.01 | 1 | 0.01 | 0.12 | 0.73 | |
| Residual | 0.47 | 10 | 0.05 | |||
| Lack of Fit | 0.24 | 6 | 0.04 | 0.70 | 0.67 | not significant |
| Pure Error | 0.23 | 4 | 0.06 | |||
| Cor Total | 2.11 | 12 |
The model of calorific value [MJ/kg] can be expressed through the following equation:
(6)
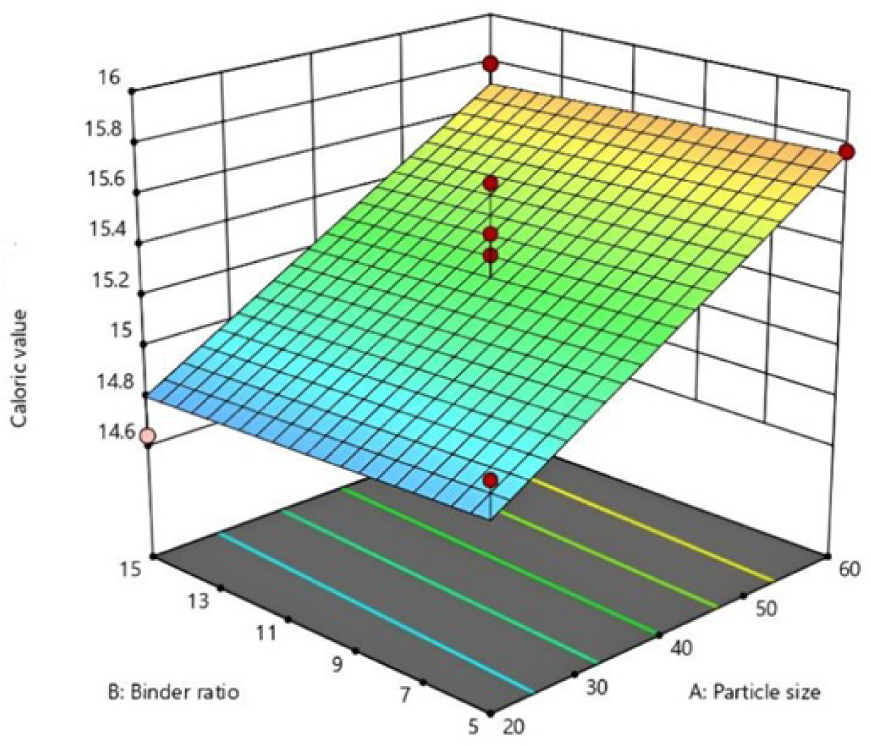
The response of calorific value parameters is elucidated through surface plots and contour plots in Figures 13 and 14, with particle size identified as a crucial factor in the heating value response. The calorific value of kesambi leaf briquettes results from the interplay between particle size and binder content. Notably, the combined effect of particle size and binder ratio does not significantly influence the ash content in kesambi leaf briquettes. All research findings indicate that the calorific value of kesambi leaf briquettes is influenced by particle size. A higher calorific value is associated with a finer particle size. This phenomenon can be explained by finer particles offering a larger specific surface area, promoting more efficient chemical reactions during briquetting. Additionally, finer particles can absorb moisture and binders better, enhancing the quality of the produced briquettes.
The calorific value of kesambi leaf briquettes is influenced by the amount of binder used. Opting for a lower binder concentration yields a higher calorific value due to the slower decomposition of organic material in kesambi leaf particles, resulting in denser briquettes.
Empirical evidence from diverse studies underscores the realm of calorific value. Coconut husk waste biobriquettes tout a calorific value of 21065.47 kJ/kg with 60-mesh particle size and 120 bar briquetting pressure, showcasing the dynamic interplay of parameters [31]. Distinctly, rubber seed biomass biobriquettes clinch the zenith with a calorific value of 6836 cal/g from samples with 80-mesh particle size and 250 °C temperature, while the nadir is at 5371 cal/g for 200-mesh particle size and 750 °C [32]. In the gasification of wood sawdust, the highest cold gas efficiency and maximum calorific value are 66.36% and 2.84 MJ/Nm3, respectively [33].
The calorific value parameters' contour response

The calorific value parameters' surface plot
The metamorphosis of candlenut fruit skin waste into briquettes translates into an upgraded biofuel quality, escalating calorific value from 17.00 MJ/kg for raw material to about 18.00 MJ/kg for briquettes [34]. The zenith of quality in mixed rice husk and coffee husk briquettes materialises with a 60-mesh particle size, culminating in a peak calorific value of 17.422 MJ/kg [35]. Mangrove charcoal is very helpful for increasing calorific value since it produces 5919 cal/g of mangrove wood charcoal briquettes [36]. The binder with 15% starch had the highest calorific value, 4678.7 cal/g [37]. For domestic use and small-scale domestic industrial applications, sawdust briquettes with a calorific value of 26918.02 kcal/kg are suitable [38].
The outcomes of the Anova test in Table 10 demonstrate the significance of the quadratic model in the total phenol parameter, as both particle size and binder ratio treatments yield F-values surpassing the corresponding P-values.
Anova of total phenol parameter
| Sources | Sum of squares | df | Mean square | F-value | P-value | |
|---|---|---|---|---|---|---|
| Models | 1.00 | 5 | 0.20 | 15.25 | 0.00 | significant |
| A − particle size | 0.64 | 1 | 0.64 | 48.38 | 0.00 | |
| B − binder ratio | 0.23 | 1 | 0.23 | 17.33 | 0.00 | |
| AB | 0.00 | 1 | 0.00 | 0.08 | 0.79 | |
| A² | 0.14 | 1 | 0.14 | 10.44 | 0.01 | |
| B² | 0.00 | 1 | 0.00 | 0.14 | 0.72 | |
| Residual | 0.09 | 7 | 0.01 | |||
| Lack of Fit | 0.02 | 3 | 0.00 | 0.39 | 0.77 | not significant |
| Pure Error | 0.07 | 4 | 0.02 | |||
| Cor Total | 1.09 | 12 |
The model of total phenol [mgGAE/g] can be expressed through the following equation:
(7)
Figures 15 and Figure 16 display the contour plot and response surface of total phenol parameters. Coarser particle sizes, characterised by a larger mesh combined with a small binder ratio, increase the total phenol content. The role of particle size proves to be highly influential in the overall response of phenol. As the empirical data show, particle size effectively regulates the overall phenol concentration in kesambi leaf briquettes.
The total phenol parameters' contour response
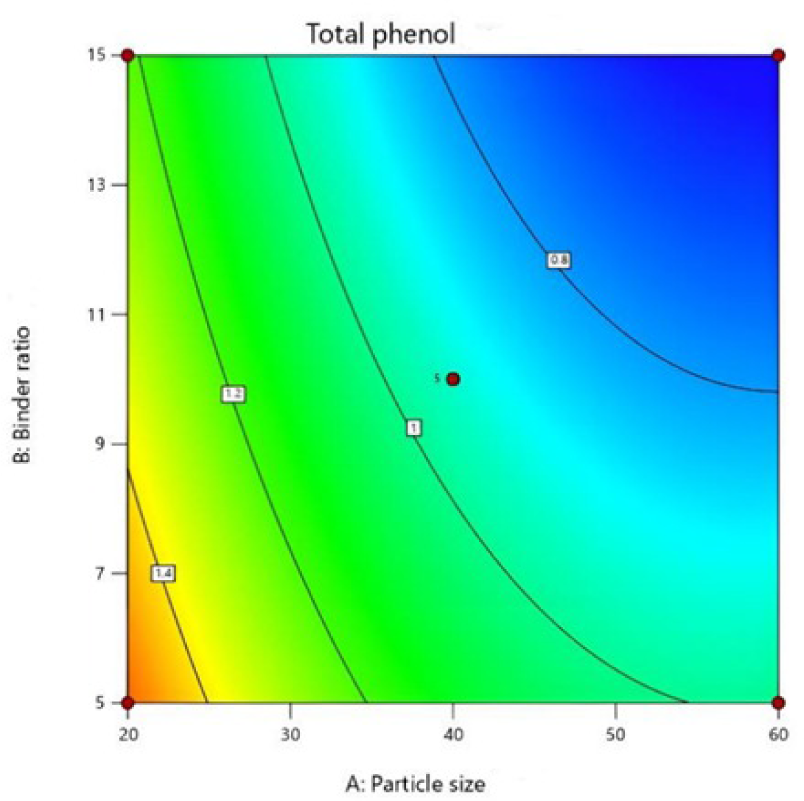
A notable pattern emerges: higher overall phenol content correlates with coarser particle size. This correlation can be explained by the larger pores created by coarse particles, allowing for increased airflow inside the briquettes. Consequently, burning produces more smoke containing phenolic chemicals.
The total phenol parameters' surface plot
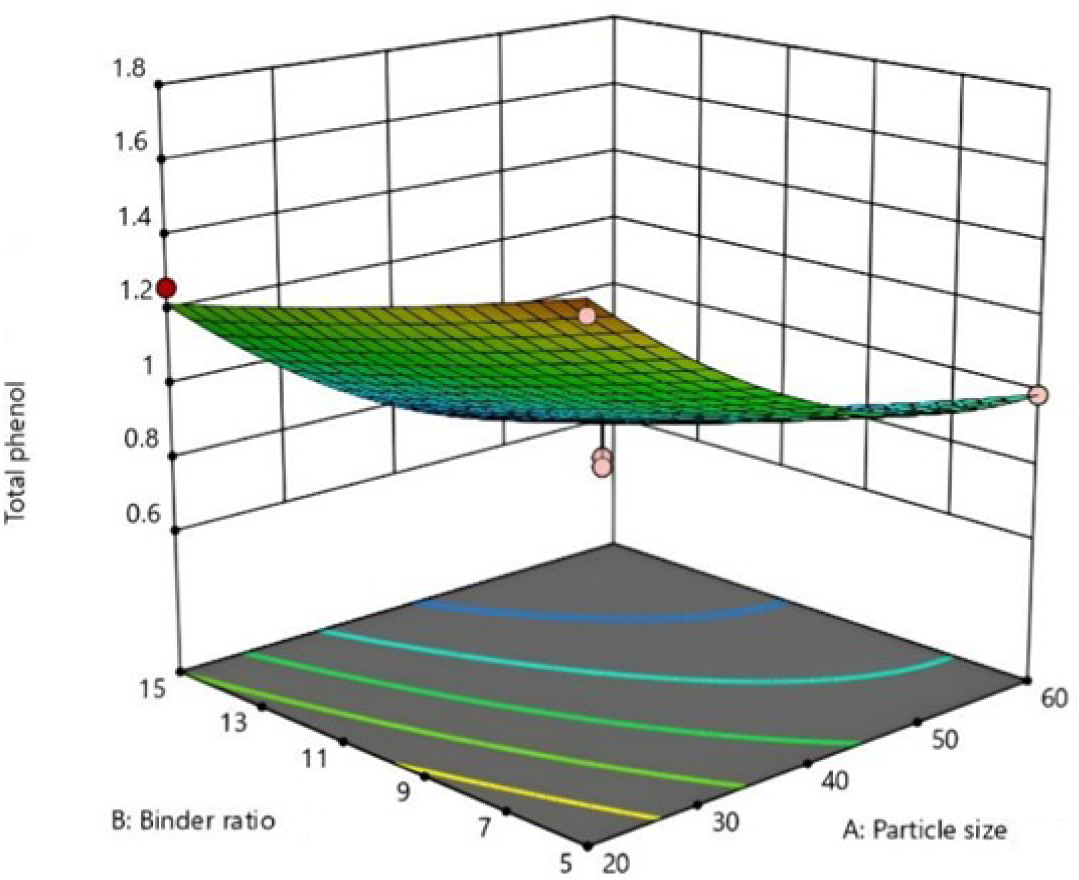
Adjusting the binder amount is an alternative to influence the overall phenol content. Opting for a lower binder quantity may reduce overall phenol concentration. It is attributed to the formation of denser briquettes as the organic content in kesambi leaf particles breaks down more slowly due to the reduced binder.
Table 11 summarises a rubric for assessing particle size and binder ratio optimisation. This rubric is based on the main objective of achieving peak fixed carbon content (FC) and calorific value, which are the most important parameters for maximising briquette calorific value.
Optimisation of particle size and binder ratio criteria
| Name | Goal | Lower limit | Upper limit | Lower weight | Upper weight | Importance |
|---|---|---|---|---|---|---|
| A − particle size | is in range | 20 | 60 | 1 | 1 | 3 |
| B − binder ratio | is in range | 5 | 15 | 1 | 1 | 3 |
| MC [%] | is in range | 3.64 | 8.46 | 1 | 1 | 3 |
| Ash content [%] | is in range | 1.65 | 3.48 | 1 | 1 | 3 |
| VM [%] | is in range | 13.63 | 16.99 | 1 | 1 | 3 |
| FC [%] | maximise | 73.11 | 79.37 | 1 | 1 | 5 |
| Briquette density [g/cm3] | is in range | 0.44 | 0.62 | 1 | 1 | 3 |
| Calorific value [MJ/kg] | maximise | 14.64 | 15.94 | 1 | 1 | 5 |
| Total phenol [mgGAE/g] | is in range | 0.65 | 1.62 | 1 | 1 | 3 |
Figure 17 shows that the mixture of particle size and binder ratio selected for validation is at a particle size of 60 mesh with a binder ratio of 5%. This pair corresponds to a peak desirability value of 0.93.
Desirability of the particle size and binder ratio
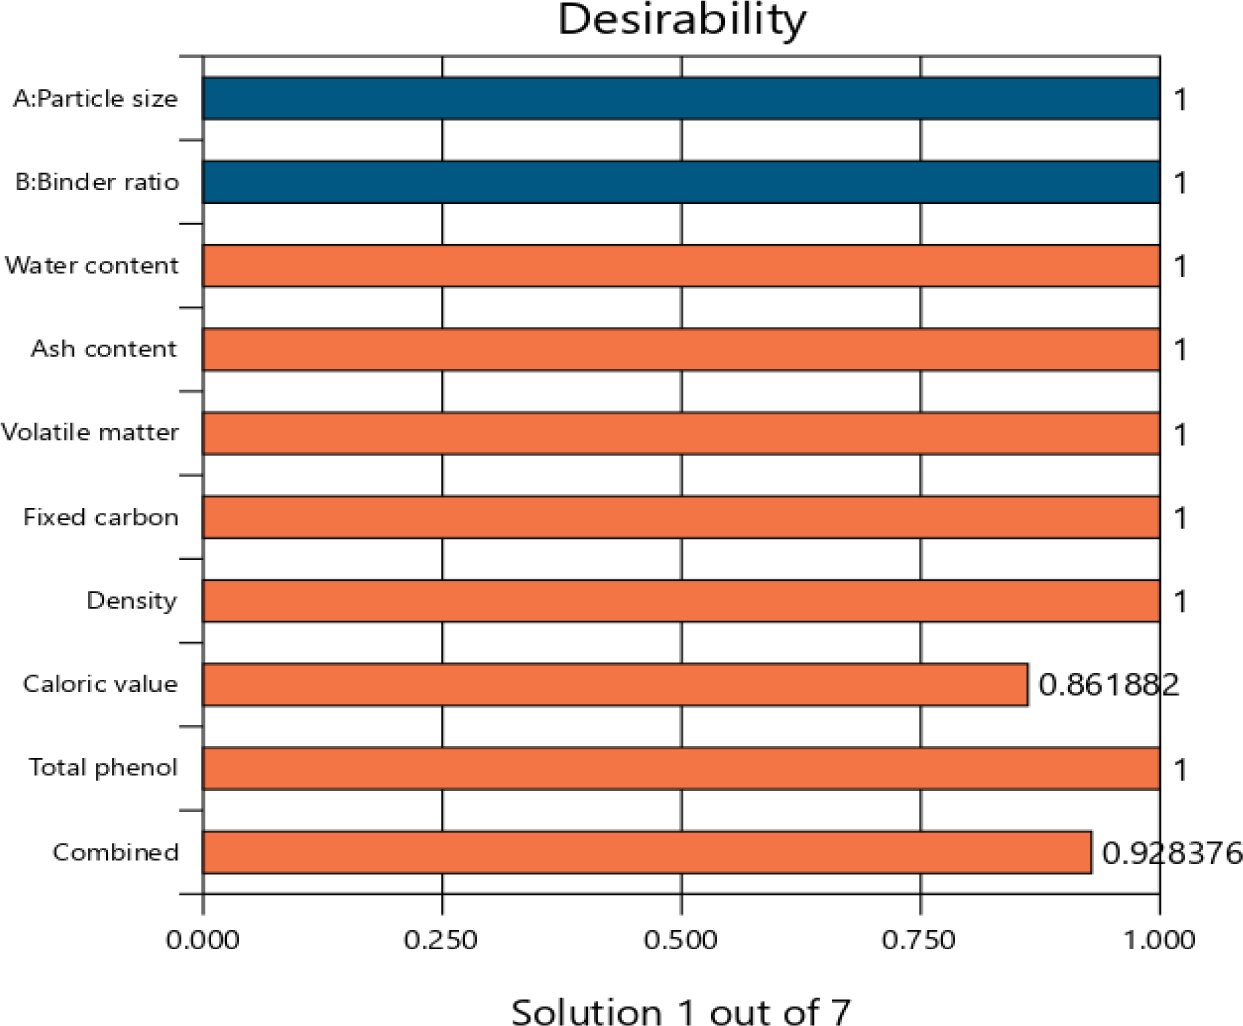
The resultant response parameters encompass MC at 3.76% ± 0.74; ash content at 2.56% ± 0.32; VM at 14.01% ± 0.37; FC at 79.48% ± 0.58; briquette density at 0.51 g/cm³ ± 0.03; calorific value at 15.76 MJ/kg ± 0.22; and total phenol content at 0.99 mgGAE/g ± 0.11 all aligning with the selected particle size and binder ratio.
Particle size and binder ratio underwent empirical testing, and the laboratory results were compared to discern their accuracy. Table 12 shows data mean values were obtained, and the investigation's results indicate that the calorific value of 15.91 MJ/kg obtained from torrefied kesambi leaves in this study is still less than the 20.80 MJ/kg calorific value obtained from kesambi stems [3]. These response parameter values comfortably fall within the 95% CI and 95% PI ranges.
By confirming that the model's projected range closely matches the real world, confirmatory testing validates the model's accuracy in predicting response parameters like MC, ash content, VM, FC, briquette density, calorific value, and total phenol. As encapsulated in Table 12, the coefficients reveal the mathematical underpinnings of the particle size and binder ratio model response.
Response verification of the particle size and binder ratio model
| Solution 1 of 5 response | Pred Mean | Pred Median | Std Dev | n | SE Pred | 95% PI low | Data mean | 95% PI high |
|---|---|---|---|---|---|---|---|---|
| MC [%] | 3.76 | 3.76 | 0.74 | 1 | 0.95 | 1.52 | 3.37 | 5.99 |
| Ash content [%] | 2.56 | 2.56 | 0.32 | 1 | 0.37 | 1.74 | 2.28 | 3.39 |
| VM [%] | 14.01 | 14.01 | 0.37 | 1 | 0.47 | 12.91 | 14.83 | 15.12 |
| FC [%] | 79.48 | 79.48 | 0.57 | 1 | 0.73 | 77.74 | 79.53 | 81.21 |
| Briquette density [g/cm3] | 0.51 | 0.51 | 0.03 | 1 | 0.04 | 0.41 | 0.57 | 0.61 |
| Calorific value [MJ/kg] | 15.76 | 15.76 | 0.22 | 1 | 0.25 | 15.20 | 15.91 | 16.31 |
| Total phenol [mgGAE/g] | 0.99 | 0.99 | 0.11 | 1 | 0.15 | 0.65 | 0.95 | 1.34 |
It is important to encapsulate that an elevation in particle size, in conjunction with an optimal binder quantum, exerts a dichotomous influence on MC, ash content, VM, FC, briquette density, calorific value, and total phenol.
In conclusion, this research demonstrates that the combination of particle size and an optimal binder ratio has varying effects on moisture content (MC), ash content, volatile matter (VM), fixed carbon (FC), density of briquettes, calorific value, and total phenol. The optimal point for particle size response is 60 mesh with a binder ratio of 5%, resulting in an MC of 3.37%, ash content of 2.28%, VM of 14.83%, and FC of 79.53%. Briquette density remains at 0.57 g/cm3, the calorific value increases to 15.91 MJ/kg, and total phenol is measured at 0.95 mgGAE/g.
The research findings suggest that using torrefied kesambi leaves with a binder produces less energy than using kesambi wood to produce se'i (smoked) meat. Therefore, further research is needed to enhance the calorific value of kesambi leaves or explore other parts of the kesambi plant, such as kesambi twigs or branches.
| FC | fixed carbon content | [%] |
| MC | moisture content | [%] |
| VM | volatile matter content | [%] |
| Anova | Analysis of variance |
| CI | Confidence Interval |
| df | Degrees of freedom |
| GAE | Gallic Acid Equivalent |
| PI | Prediction Interval |
| Pred | Predicted |
| Std Dev | Standard Deviation |
| SE | Standard Error |
- ,
Sustainable Development Goal Indicators as the Foundation for a Holistic Impact Assessment of Access-to-Energy Projects ,Journal of Sustainable Development of Energy, Water and Environment Systems , Vol. 10 (2), 2022, https://doi.org/https://doi.org/10.13044/j.sdewes.d9.0400 - ,
Conversion of lignocellulose biomass to bioenergy through nanobiotechnology ,Journal of Sustainable Development of Energy, Water and Environment Systems , Vol. 11 (2), 2023, https://doi.org/https://doi.org/10.13044/j.sdewes.d11.0442 - , Plant resources of South-East Asia, jil.11: auxiliary plants, 2007
- ,
A review on biomass torrefaction process and product properties for energy applications ,Industrial Biotechnology , Vol. 7 (5),pp 384–401 , 2011, https://doi.org/https://doi.org/10.1089/IND.2011.7.384 - ,
Energy production from biomass (part 2): conversion technologies ,Bioresour Technol , Vol. 83 (1),pp 47–54 , 2002, https://doi.org/https://doi.org/10.1016/S0960-8524(01)00119-5 - ,
Biomass upgrading by torrefaction for the production of biofuels: A review ,Biomass and Bioenergy , Vol. 35 (9), 2011, https://doi.org/https://doi.org/10.1016/j.biombioe.2011.06.023 - , Torrefaction for biomass upgrading - ręczne notatki,” Proc. 14th European Biomass Conference, 2005
- ,
Effects of temperature and residence time on continuous torrefaction of spruce wood ,Fuel Processing Technology , Vol. 134 ,pp 387–398 , 2015, https://doi.org/https://doi.org/10.1016/J.FUPROC.2015.02.021 - ,
Progress in biomass torrefaction: Principles, applications and challenges ,Prog Energy Combust Sci , Vol. 82 ,pp 100887 , 2021, https://doi.org/https://doi.org/10.1016/J.PECS.2020.100887 - ,
Pyrolysis of microalgae residues - A Kinetic study ,Bioresour Technol , Vol. 199 , 2015, https://doi.org/https://doi.org/10.1016/j.biortech.2015.08.069 - ,
Torrefaction of wood and bark from Eucalyptus globulus and Eucalyptus nitens: Focus on volatile evolution vs feasible temperatures ,Energy , Vol. 93 , 2015, https://doi.org/https://doi.org/10.1016/j.energy.2015.10.007 - ,
Effect of Temperature and Duration of Torrefaction on the Thermal Behavior of Stem Wood, Bark, and Stump of Spruce ,Energy Procedia , Vol. 105 ,pp 551–556 , 2017, https://doi.org/https://doi.org/10.1016/j.egypro.2017.03.355 - ,
Effect of Torrefaction Temperature, Residence Time and Particle Size on the Properties of Torrefied Food Waste ,Indonesian Journal of Chemistry , Vol. 19 (3),pp 753–760 , 2019, https://doi.org/https://doi.org/10.22146/IJC.39718 - ,
Production of solid fuel by torrefaction using coconut leaves as renewable biomass ,International Journal of Renewable Energy Development , Vol. 5 (3), 2016, https://doi.org/https://doi.org/10.14710/ijred.5.3187-197 - ,
Green Coal: A New Energy Source from Leaves ,Energy Procedia ,pp 484–491 , 2016, https://doi.org/https://doi.org/10.1016/j.egypro.2016.10.207 - ,
Proximate And Ultimate Analysis Of Carbonized Rice ,Advanced Academic Research (Sciences, Technology and Engineering) , Vol. 6 (10), 2020 - ,
Conversion of Lignocellulose Biomass to Bioenergy Through Nanobiotechnology ,Journal of Sustainable Development of Energy, Water and Environment Systems , Vol. 11 (2), 2023, https://doi.org/https://doi.org/10.13044/j.sdewes.d10.0442 - ,
ASTM D3173 ,Statistics (Ber) , Vol. 03 , 2013, https://doi.org/https://doi.org/10.1520/D3173-11, A. D3173, February 2008 - ,
Astm D1102-84. Standard Test Method for Ash in Wood , 2013, https://doi.org/https://doi.org/10.1520/D1102-84R21 - ,
Standard test method for volatile matter in the analysis sample of coal and coke ,ASTM International , 2011, https://doi.org/https://doi.org/10.1520/D3175-20, ASTMD3175 - , Standard Practice for Proximate Analysis of Coal and Coke 1, Annual Book of ASTM Standards, 2021
- ,
Standard Test Methods for Density and Specific Gravity (Relative Density) of Plastics by Displacement, ASTM D2395-17 ,American Society for Testing and Materials , 2017, ASTM International - ,
Standard Test Method for Gross Calorific Value of Coal and Coke ,ASTM D5865 - 13 , 2013, https://doi.org/https://doi.org/10.1520/D5865_D5865M-19, ASTM - ,
Torrefied briquettes: technical and economic feasibility and perspectives in the Brazilian market ,Energy for Sustainable Development , Vol. 9 (3), 2005, https://doi.org/https://doi.org/10.1016/S0973-0826(08)60520-7 - ,
Development and Characterization of Agro-Allied Rice Husks and Ground nut Shell Waste Briquettes ,International Journal of Scientific and Academic Research , Vol. 03 (03),pp 01–06 , 2023, https://doi.org/https://doi.org/10.54756/IJSAR.2023.V3.3.1 - ,
Biocoal Characterization as an Environmentally Friendly Alternative Energy Innovation Composite Variations of Gasified Char with Coconut Shell Charcoal ,Indonesian Journal of Fundamental and Applied Chemistry , Vol. 7 (2),pp 68–79 , 2022, https://doi.org/https://doi.org/10.24845/ijfac.v7.i2.68 - ,
Pengaruh Variasi Kadar Perekat Tapioka Terhadap Karakteristik Briket Arang Limbah Kayu Sengon (Falcataria moluccana) ,Perennial , Vol. 17 (1),pp 5–11 , 2021, https://doi.org/https://doi.org/10.24259/perennial.v17i1.13504, (in Indonesian: “The Effect Of Variations In Tapioca Adhesive Contents On The Characteristics Of Sengon Waste Charcoal Briquettes (Falcataria moluccana) - ,
Energy Potentials of Briquette Produced from Tannery Solid Waste ,Makara Journal of Technology , Vol. 21 (3), 2018, https://doi.org/https://doi.org/10.7454/mst.v21i3.3429 - , Thermochemical Characteristics of Briquettes of The Low-Rank Coal Mixed with Charcoal Sawdust of Meranti Wood, IOP Conf Ser Earth Environ Sci, 2023
- ,
Quality evaluation of coconut shell activated carbon and its application as precursor for citronellal-scented aromatic briquette ,Rasayan Journal of Chemistry , Vol. 15 (3), 2022, https://doi.org/https://doi.org/10.31788/RJC.2022.1536799 - Densification of Product Torrefaction from Coconut Coir to Bio-briquette as Renewable Energy that Environmentally, 2018, http://isomase.org/IJERCE1.php
- ,
Science and Technology Indonesia Influence of Temperature and Particle Size on Heating Value of Bio briquete from Rubber Seed , Vol. 4 (2), 2019, https://doi.org/https://doi.org/10.26554/sti.2019.4.2.57-59 - ,
Effect of Air Supply Location and Equivalence Ratio on Thermal Performance of Downdraft Gasifier Fed by Wood Sawdust ,Journal of Sustainable Development of Energy, Water and Environment Systems , Vol. 11 (1), 2023, https://doi.org/https://doi.org/10.13044/j.sdewes.d10.0435 - ,
Physicochemical Characteristics of Biofuel Briquettes Made from Pecan (Carya illinoensis) Pericarp Wastes of Different Particle Sizes ,Molecules , Vol. 27 (3), 2022, https://doi.org/https://doi.org/10.3390/molecules27031035 - ,
Influence of Sieve Size on Calorific Value and Proximate Properties of Bio-Briquette Composites ,Journal of Ecological Engineering , Vol. 24 (7),pp 25–34 , 2023, https://doi.org/https://doi.org/10.12911/22998993/163309 - , Analysis mixed characterisation of Kalimantan coal and mangrove wood charcoal character as briquette raw material, IOP Conference Series: Earth and Environmental Science, 2021
- , Proximate and the Calorific Value Analysis of Brown Coal for High-Calorie Hybrid Briquette Application, Journal of Physics: Conference Series, 2017
- ,
MANAS Journal of Engineering Estimation of the moisture content, volatile matter, ash content, fixed carbon and calorific values of saw dust briquettes , Vol. 10 (1),pp 17–20 , 2022, https://doi.org/https://doi.org/10.51354/mjen