



The development trajectories of low and middle-income economies continue to display a paradoxical coexistence of economic progress and structural fragility. Measured by rising Gross Domestic Product (GDP) per capita, macroeconomic stabilisation, or deeper integration into global and regional frameworks, many countries appear to advance successfully along the conventional path of modernisation. Yet, these visible milestones often conceal persistent asymmetries in human capital formation, institutional quality, social inclusion, and environmental resilience. Despite progress in aggregate indicators, the capacity to sustain inclusive and ecologically balanced growth remains constrained. This paradox underscores a critical tension between the speed of economic convergence and the depth of developmental transformation.
The persistence of such dualities has long preoccupied development theorists. Early structuralist approaches highlighted the coexistence of traditional and modern sectors and viewed development as a process of labour reallocation and structural transformation [1]. Subsequent theories emphasised that development often proceeds through strategic imbalances and linkage effects that stimulate further economic activity and structural change [2]. In the institutional turn in the political economy of growth [3], the central insight has remained: development is not a linear accumulation process but an interaction among economic, social, and institutional subsystems that evolve at different speeds. However, the compression of these processes, when macroeconomic advancement accelerates beyond the adaptive capacity of social, institutional, and ecological systems, has not been adequately theorised. This paper introduces the concept of the Development Compression Trap (DCT) to capture such systemic imbalance.
DCT refers to a structural condition in which macroeconomic performance improves faster than the institutional, social, and ecological foundations required to sustain it. Existing research on the middle-income trap has primarily focused on growth slowdowns and the difficulty of sustaining convergence once countries exhaust the gains from factor accumulation and technological imitation [4]. Related studies emphasise that insufficient innovation capacity, low-quality human capital, and institutional upgrading can prevent economies from transitioning to higher-value-added activities [5]. The challenge is further intensified by global competitive pressures, which place middle-income countries between low-cost producers and innovation-driven advanced economies [6]. In contrast to the middle-income trap (MIT), which emphasises stagnation at intermediate income levels, DCT highlights asynchronous advancement, that is, the temporal and structural misalignment between quantitative expansion and qualitative deepening. The trap is thus not a static plateau but a dynamic imbalance: countries appear to progress economically yet accumulate vulnerabilities that make the progress fragile and reversible.
This framework builds on and extends the literature on compressed development [7], which depicts late developers as facing simultaneous pressures of industrialisation, globalisation, and social modernisation. Whereas compressed development emphasises simultaneity, the DCT identifies its pathological manifestation: a condition where overlapping reforms advance at uneven speeds, generating systemic compression and institutional fragility. In this sense, the DCT serves as an analytical bridge between the sequential growth trajectories described in [8] and the multi-speed reform dilemmas faced by late developers in an era of global interdependence [9].
Against this theoretical background, the central research question guiding this study is: How can we conceptualise and empirically identify development trajectories in which macroeconomic performance advances faster than the institutional, social, and ecological foundations needed to sustain it, and what are the structural implications of this imbalance for emerging economies?
This question motivates both the conceptualisation of the DCT and the development of a new methodological framework to diagnose such imbalances across domains and over time. The DCT framework contributes to three interrelated debates in the development literature. First, it expands the understanding of development traps beyond income stagnation to encompass multi-dimensional misalignments across human capital, growth structure, ecological sustainability, and institutional capacity. Second, it integrates economic and institutional perspectives, acknowledging that developmental disequilibria arise from interactions among domains rather than from deficiencies within any single domain. Third, it offers an operational methodology for identifying and quantifying compression through compression mapping, benchmarking, and efficiency analysis. These techniques reveal how imbalances evolve and how systemic inefficiencies accumulate across sectors and time.
Methodologically, the study combines cross-domain benchmarking with Data Envelopment Analysis (DEA) to capture efficiency-adjusted performance across four developmental domains: human capital, growth and structural transformation, environment and energy, and infrastructure and institutions. This approach permits the construction of a Development Compression Index (DCI), which measures the divergence between coverage (quantitative inputs) and outcomes (qualitative results). When aggregated across domains, these indices reveal the internal tensions of rapid but uneven development: rising educational attainment without learning quality, economic growth without productivity upgrading, environmental reform without enforcement, and infrastructure investment without institutional robustness.
While conceptually generalisable to all Emerging Market Economies (EMEs), the DCT framework is empirically illustrated using the case of Macedonia, a small, upper-middle-income country aspiring to European Union (EU) membership. Macedonia offers a revealing example of compressed development: an economy that has achieved macroeconomic convergence and social modernisation on paper, yet remains constrained by weak governance, limited capacity for innovation, and environmental vulnerability. Its trajectory exemplifies how partial modernisation and fragmented reforms can entrench fragility instead of resilience.
By situating the DCT within comparative development theory, this paper makes both conceptual and methodological contributions. Conceptually, it redefines the notion of a trap as an imbalance among interdependent systems rather than as mere stagnation. Methodologically, it operationalises this imbalance through quantitative tools that capture the rate and level differentials across developmental domains. The result is a unified analytical lens that links the macroeconomics of convergence with the micro foundations of institutional capacity and ecological sustainability.
The remainder of the paper proceeds as follows. Section 2 situates the DCT within competing analytical frameworks, reviewing the middle-income trap, compressed development, and institutional trap literatures. Section 3 introduces the methodological architecture of the DCT, detailing the construction of the compression index, the use of DEA frontier analysis, and the cross-domain integration of indicators. Section 4 presents empirical findings for Macedonia, highlighting patterns of compression across domains and their implications for long-term resilience. Section 5 concludes with theoretical and policy reflections, outlining how the DCT framework can inform both academic research and the design of integrated development strategies for emerging economies.
The concept of compressed development provides a crucial backdrop for understanding the DCT. The authors of [7] argue that late developers face simultaneous, overlapping challenges of industrialisation, social change, and globalisation, rather than the sequential trajectories observed in early industrialisers. This simultaneity generates compressed development patterns where states must manage multiple, often conflicting pressures with limited capacity. Paper [9] extends this argument by showing how middle-income countries often fail to form political coalitions capable of sustaining productivity-enhancing reforms, thus exacerbating vulnerabilities created by accelerated development. The concept of ‘compressed development’ is a supplement to the notion of ‘late development’ [8].
The MIT literature provides a second foundation. The authors of [10] empirically demonstrate that inequality, foreign aid dependency, and demographic pressures undermine the sustainability of growth, leaving economies stagnant at intermediate income levels. On the other hand, avoiding premature deindustrialisation requires industrial upgrading and proactive development of the service sector [11]. At the same time, [6] highlights the importance of industrial policy and innovation strategies to sustain global value chain upgrading, cautioning that passive integration risks confining economies to low-value segments. Paper [4] synthesises these insights into a systemic perspective: MITs should be seen as self-reinforcing bad equilibria in which weak human capital, fragile institutions, distorted incentives, and limited financing interact. Study [12] further emphasises the Asian tiger trapped experience, showing how premature liberalisation and governance weaknesses curtailed structural transformation. In addition, paper [13] identifies structural breaks that confirm MIT persistence in Latin America. Complementary analyses from another study [14] broaden the scope by embedding MIT into the political economy of globalisation, where external volatility interacts with domestic policy fragility.
Governance and institutional quality are consistently identified as decisive factors in development. Open contracting reforms in Low- and Middle-Income Countries (LMICs) illustrate both the potential and limits of governance innovation: reforms succeed only with broad coalitions and sustained political will [15]. At the same time, paper [16] highlights the feedback loop between institutional quality and economic growth, showing bidirectional causality, while the authors of [17] argue for a double trap, in which institutional fragility reinforces and is reinforced by middle-income stagnation. These studies highlight governance not just as a background factor but as a central mechanism that determines whether compressed and unequal development becomes trap-like.
The MIT framework has also been extended to regional inequalities. Study [18] focuses on the regional development trap demonstrating how EU regions can stagnate despite national-level convergence, with political discontent often emerging in areas unable to capture the benefits of globalisation and integration. For countries like Macedonia, which seek EU accession, these insights are critical: failure to address territorial disparities could reproduce regional traps within national development trajectories.
Existing diagnostic approaches to development provide useful precedents for the DCT framework, yet none fully capture the dynamics of asynchronous advancement across multiple domains. The DCT thus extends and synthesises several traditions. For example, recent scholarship integrates sustainability into debates about traps. Paper [13] highlights how MIT dynamics intersect with the Sustainable Development Goals, emphasising that inequality, weak governance, and environmental degradation reinforce one another, delaying convergence.
First, the Growth Diagnostics method [19] pioneered the use of decision trees to search for binding constraints on growth. Its value lies in prioritisation, but its scope is largely economic, treating governance and social resilience only indirectly. Similarly, the World Bank [20] and the Organisation for Economic Co-operation and Development (OECD) [21] apply cross-pillar assessments to identify constraints and opportunities, moving closer to multi-domain frameworks. Yet these instruments typically emphasise benchmarking and policy recommendations rather than temporal misalignment between economic advancement and institutional or social capacity. The Structural Gaps Approach [22] likewise focuses on multi-dimensional inequality but frames gaps as static differences rather than dynamic compressions.
Second, the DCT relates conceptually to the literature on development traps and misalignments. The regional development trap [18] shows how regions stagnate despite national convergence, while the compressed development framework [7] emphasises simultaneity and overload in late-developing economies. Both resonate with the DCT, but neither explicitly theorises how economic advancement can systematically outpace institutional or ecological depth. Likewise, the capability trap literature [23] demonstrates how countries adopt forms without function, particularly in governance, a pattern that closely parallels what this study terms institutional compression.
Finally, policy practice in the European Union [24] provides methodological parallels. The Macroeconomic Imbalance Procedure (MIP) employs a scoreboard of 14 indicators to detect vulnerabilities. While similar in diagnostic orientation, MIP is narrower in scope and largely macroeconomic, lacking integration of human capital, governance, or sustainability.
The authors of [3] argue that the nature of political and economic institutions fundamentally shaped the long-term trajectory of prosperity or stagnation. Inclusive institutions, those that distribute power broadly, ensure the rule of law, and foster innovation, create virtuous cycles of growth and resilience. By contrast, extractive institutions, where narrow elites monopolise power and suppress broad participation, generate persistent underdevelopment, even when short-term growth is achieved. Their framework underscores that geography, culture, or misguided policies alone cannot explain development outcomes; rather, institutional configurations determine whether societies converge toward sustained prosperity or remain trapped in cycles of inequality and fragility.
Building on this institutionalist foundation, recent scholarship has highlighted a spectrum of development traps, such as the middle-income trap, capability traps, and governance traps, all of which point to the systemic risks of incomplete or imbalanced progress (Table 1).
Framework |
Domains covered |
Focus |
Prioritisation logic |
Output type |
|||
|---|---|---|---|---|---|---|---|
Econ |
Hum |
Inst |
Env |
||||
DCT |
Yes |
Yes |
Yes |
Yes |
Rate & level misalignments; cross-domain compression mapping |
Diagnostic synthesis of binding gaps across pillars |
Diagnostic + reform sequencing (conceptual + empirical) |
Growth Diagnostics [19] |
Yes |
Part |
Part |
No |
Binding constraints to growth (decision tree) |
Marginal returns to relaxing constraints |
Diagnostic + policy priorities |
World Bank Systematic Country Diagnostic (SCD) |
Yes |
Yes |
Yes |
Yes |
Cross-pillar constraints & opportunities for shared prosperity |
Structured assessment; evidence-weighted |
Diagnostic + policy menu |
OECD Multi-dim. Country Reviews (MDCR) |
Yes |
Yes |
Yes |
Yes |
Multi-dimensional performance & bottlenecks |
Three-stage review; scorecards & narratives |
Diagnostic + recommendations + roadmap |
Economic Commission for Latin America and the Caribbean (ECLAC) Structural Gaps Approach [25] |
Yes |
Yes |
Yes |
Yes |
Inequality & productivity gaps; social cohesion |
Gap identification & closing strategies |
Diagnostic + policy orientation |
EU Macroecon. Imbalance Procedure (MIP) [26] |
Yes |
No |
Part |
No |
Macro/financial imbalance monitoring (scoreboard) |
Thresholds & auxiliary indicators |
Early warning + policy surveillance |
Capability Traps / PDIA [27] |
Part |
Part |
Yes |
No |
Form vs. function; problem-driven adaptation |
Iterative problem-solving; learning by doing |
Implementation & capability building |
Compressed Development [7] |
Yes |
Part |
Yes |
Part |
Simultaneity & overload in late development |
Conceptual (analytical narratives) |
Conceptual framework |
The DCT extends these debates by emphasising institutional weaknesses and structural misalignment between inputs and outcomes across multiple domains. Unlike frameworks that focus narrowly on income stagnation or governance failures, the DCT offers a unified diagnostic that reveals how economic, social, and environmental dimensions can advance unevenly, producing compressed and fragile development trajectories.
The literature on development traps increasingly emphasises that sustained development depends not only on economic growth but also on the institutional and structural capacities that support it. Fosu [28] synthesises evidence from successful developing economies and argues that long-term development is driven by structural transformation, productive diversification, state capability, and investments in human capital rather than by macroeconomic growth alone. Mkandawire [29] challenges the view that weak governance is an inherent characteristic of developing countries and demonstrates that developmental states can emerge when public institutions possess sufficient autonomy and capacity to coordinate long-term economic transformation. Ocampo [25] argues that structural heterogeneity, weak productive linkages, and macroeconomic vulnerability constrain dynamic efficiency and often generate low-growth trajectories despite market-oriented reforms. Collier [30] identifies a set of persistent development traps, including conflict, resource dependence, geographic disadvantages, and governance failures, which prevent countries from translating economic opportunities into sustained development outcomes.
More recent work shows that industrial upgrading in Brazil was driven by schooling and sectoral shifts. Still, institutional quality remained inconsistent [31], while Latin America has been caught in both middle-income and middle-technology traps, with innovation lagging behind industrial coverage [32] and reliance on marginal land limiting rural productivity gains in the LAC region [33]. Evidence from Africa echoes these findings: governance reforms have only partially improved manufacturing outcomes. Using the generalised method of moments (GMM), study [34] finds that gender-inclusive education only partially moderates governance effects on manufacturing value added, confirming that education inputs alone do not guarantee transformative outcomes, while [35] shows that institutional quality is positively linked to productivity but shaped by historical legacies. Meanwhile, education research consistently shows that enrolment gains have outpaced improvements in learning. While educational access has expanded significantly, learning outcomes remain weak in many developing regions, resulting in a persistent learning crisis [36]. Furthermore, evidence suggests that the quantity of education alone is insufficient unless accompanied by improvements in educational quality and cognitive skills [37].
The DCT framework offers three innovations. It (1) systematises compression mapping, comparing not only levels of attainment but also rates of progress across domains; (2) integrates human, economic, institutional, and ecological pillars within one diagnostic lens; and (3) interprets imbalances not merely as gaps but as syndromes of fragility, where lagging foundations undermine visible advancement. In doing so, DCT bridges the gap between single-domain trap theories and policy-oriented diagnostics, offering both conceptual novelty and practical applicability.
Despite their breadth, the MIT and compressed development literatures do not fully capture cases where economic advancement outpaces social and institutional fundamentals. The DCT framework addresses this gap. Unlike stagnation-based traps, DCT emphasises imbalance: countries like Macedonia may achieve upper-middle-income status and EU candidate status, yet simultaneously face brain drain, high youth NEET (Not in Education, Employment, or Training) rates, institutional distrust, perceptions of corruption, and fragmented policy coordination. These symptoms exemplify compressed development transformed into a trap: headline progress without corresponding depth in institutional and social resilience.
By synthesising insights from compressed development, MIT studies, governance and institutional traps, regional development trap frameworks, and sustainability debates, the DCT positions itself as a unifying concept. It explains not only why some countries stagnate, but also why others advance unevenly, progressing economically while remaining institutionally fragile and socially fragmented.
Despite the richness of these contributions, three main gaps remain in the development literature. First, existing frameworks, whether the middle-income trap, compressed development, or institutional trap, tend to examine stagnation or imbalance within single domains, such as growth, governance, or industrial structure, rather than across them. They therefore overlook the systemic interdependence through which progress in one area (for example, GDP growth) can conceal weaknesses in others (such as learning outcomes, institutional effectiveness, or environmental resilience). Second, most analytical tools used to diagnose development traps are either qualitatively descriptive or sector-specific, lacking a quantitative, cross-domain methodology to assess the relative pace of progress and the depth of structural transformation. As a result, they fail to capture the temporal and structural misalignments that emerge when macroeconomic advancement exceeds social or institutional adaptation. Third, comparative studies have rarely operationalised the interaction among the economic, social, and ecological domains within an integrated empirical framework. The absence of such multi-dimensional diagnostics leaves policymakers without the means to identify when and where rapid economic convergence becomes developmentally unsustainable. The DCT framework introduced in this paper addresses these gaps by providing a unified conceptual and empirical lens that quantifies multi-speed development, measures efficiency-adjusted imbalances across domains, and captures how asynchronous progress generates fragility rather than resilience.
The methodological approach builds on the recognition that development trajectories cannot be understood solely through economic growth or income convergence. Instead, the DCT framework conceptualises development as an interplay of domains advancing at different speeds, producing systemic misalignments. The methodology therefore integrates diverse data sources, organises them into four core domains with six cross-cutting themes (Figure 1), and applies a sequence of analytical techniques designed to capture imbalances across time, structure, and quality.
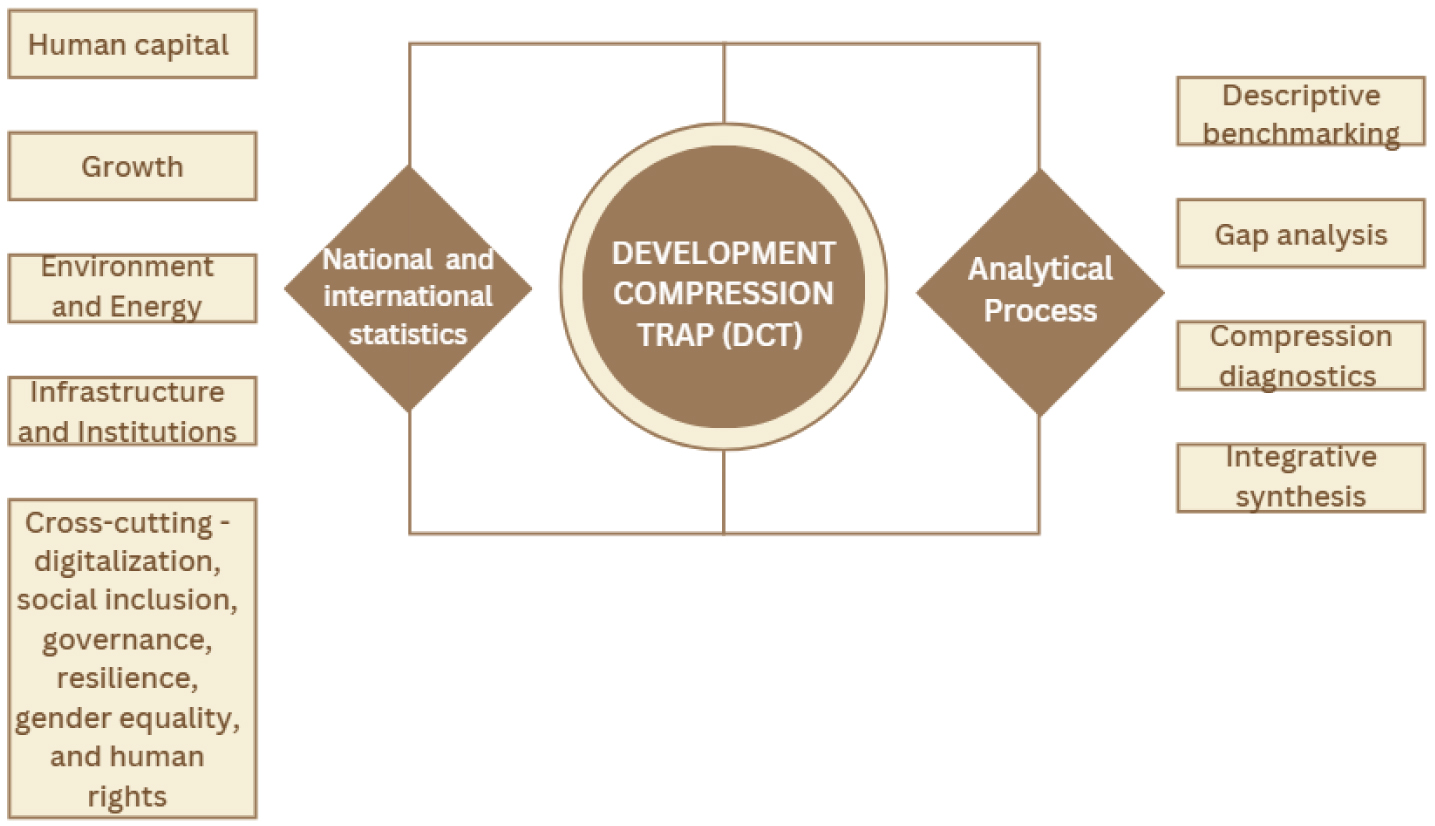
The DCT framework is grounded in the premise that sustainable development depends on the balanced evolution of human, economic, environmental, and institutional systems. Accordingly, the analysis is organised into four interrelated domains that represent the key dimensions through which development trajectories can be assessed and potential compression dynamics identified:
Human Capital – approached as a capability system rather than a stock of skills. Methodologically, this implies assessing both quantity (e.g., the share of tertiary graduates) and quality (e.g., learning outcomes as measured by the Programme for International Student Assessment, PISA). Employment absorption is assessed using labour market indicators that reveal whether educational outputs are matched with productive employment. Compression is diagnosed when, for instance, tertiary attainment increases but the innovation economy and Research and Development (R&D) sector remain stagnant, producing a skills–employment gap. Similarly, high coverage of social protection, combined with underfunded health systems, can reveal a trap where formal rights exist but substantive outcomes lag.
Growth – assessed through a dual lens: (i) headline expansion measured by GDP per capita and in Purchasing Power Parity (PPP), and (ii) structural upgrading measured by productivity and sectoral transformation. A key methodological innovation is the value-added mismatch test: comparing the employment share of sectors with their contribution to GDP. A large agricultural workforce contributing very little to total value added indicates structural compression, while high shares of low-productivity services despite rising GDP per capita indicate a fragile growth model. Trade competitiveness and export diversification are also analysed, with compression diagnosed when integration into EU markets occurs without a parallel upgrading of domestic innovation.
Environment and Energy – the environment-energy nexus is operationalised through sustainability diagnostics. Indicators of air quality, waste management, renewable penetration, and Greenhouse Gas (GHG) trajectories are interpreted as systemic stress tests of the development model. For example, declining air quality in urban centres despite rising incomes signals ecological compression: economic gains are achieved by externalising environmental costs, undermining long-term resilience. The methodology also employs a risk accumulation perspective, treating unmitigated environmental degradation as a deferred liability that compounds the compression trap.
Infrastructure and Institutions – institutions are assessed not only through the adoption of formal EU-aligned legislation but also through effectiveness measures: the rule of law in practice, corruption enforcement, and policy coordination the growth, human capital, infrastructure, institutions, and environment & energy domains, respectively. Infrastructure is treated both physically (roads, digital networks, energy systems) and institutionally (regulatory capacity, strategic coherence). Methodologically, this dimension is analysed using coupling analysis to test whether institutional frameworks are sufficiently robust to translate infrastructure investments into inclusive and sustainable outcomes. Weak coupling, where physical investments exist but institutional quality is low, is interpreted as a hallmark of compression.
Six transversal themes, digitalisation, social inclusion, governance, resilience, gender equality, and human rights, are treated as filters that run across all domains, rather than stand-alone categories. For instance, education outcomes are re-evaluated through gender and inclusion lenses; infrastructure is assessed against governance and resilience; environmental policies are connected to rights and equity concerns. This transversal integration avoids siloed assessments and highlights systemic interactions.
The DCT framework rests on the assumption that development trajectories are characterised by asynchronous progress across economic, social, institutional, and ecological systems. To test this proposition empirically, the study formulates the Stylised Fact (SF), which represents expected patterns of development compression derived from the conceptual framework. Each SF corresponds to a specific analytical domain and is expressed as a testable empirical proposition. These SF guide the construction of the DCI and the application of DEA to assess efficiency-adjusted imbalances across countries.
Economic, social, and institutional domains in emerging and transitional economies advance at different rates, generating measurable misalignments between quantitative expansion (Q) and qualitative outcomes (D). Formally, the DCI for at least one domain DCIp > 0, where p denotes a pillar or a domain (Education, Health, Research/Innovation, Environment, Institutions), indicating that coverage exceeds outcomes relative to an international benchmark.
The degree of compression differs systematically across domains. Specifically, domains that are capital-intensive and policy-visible (e.g., GDP growth, infrastructure investment) exhibit higher quantitative advancement than capability-intensive domains (e.g., human capital, institutional quality, environmental sustainability).
where DCIgrowth, DCIhuman, DCIinstitutions, and DCIenvironment denote the Development Compression Indices for the growth, human capital, infrastructure and institutions, and environment and energy domains, respectively. The proposition suggests that compression tends to be more pronounced in domains characterised by rapid quantitative expansion, such as economic growth, than in domains that depend on slower institutional, social, or environmental adaptation.
Countries with higher compression indices (i.e., larger input-output divergences) also exhibit lower efficiency scores in DEA frontier analysis. It suggests that developmental compression is associated with structural inefficiency: systems that expand in scale without improving conversion effectiveness:
where p∈{human,growth,environment,institutions}, DCIp denotes the Development Compression Index for pillar p, and DEAp denotes the corresponding Data Envelopment Analysis efficiency score.
Within the human capital pillar, quantitative expansion in education (enrollment, attainment) and health (coverage) outpaces qualitative outcomes (learning proficiency, life expectancy, health equity).
where Qhuman denotes the quantity or coverage dimension of human capital, Dhuman denotes the corresponding depth or outcome dimension. and DCIhuman represents the Development Compression Index for the Human capital pillar. It reflects a situation in which input accumulation is only partially translated into human development outcomes, resulting in fragile and low-return development gains.
Economic growth in emerging economies is primarily driven by extensive rather than intensive factors, resulting in a value-added mismatch in which employment structures lag sectoral productivity.
where Qgrowth denotes the quantity or coverage dimension of economic growth (e.g., output expansion, investment, and employment growth), Dgrowth denotes the corresponding depth or outcome dimension (e.g., productivity growth, innovation performance, and structural transformation), and DCIgrowth represents the Development Compression Index for the Growth pillar. It reflects a situation in which economic growth is not accompanied by proportional improvements in productivity, innovation, and structural transformation, indicating growth compression. For example, growth compression occurs when the share of agricultural employment exceeds the share of agriculture in GDP, indicating labour concentration in relatively low-productivity activities.
Proportional gains in environmental quality or sustainability outcomes do not accompany improvements in income and energy access.
where Qenvironment represents environmental and energy inputs (renewable deployment, environmental investments, policy adoption), while Denvironment represents environmental outcomes (emission intensity, environmental quality, resource efficiency), and DCIenvironment represents the Development Compression Index for the Environment and Energy pillar. It is a test of whether ecological resilience lags behind economic advancement; e.g., environmental compression may be reflected in situations where proportional reductions in greenhouse gas intensity do not accompany increases in renewable energy deployment.
Physical infrastructure development (transport, digital networks, energy systems) yields limited returns where institutional quality (rule of law, policy coordination) is weak.
where Qinstitution represents institutional and infrastructure provision, while Dinstitution represents governance effectiveness and institutional performance, and DCIinstitution represents the Development Compression Index for the Infrastructure and Institutions pillar. It examines whether weak institutional coupling transforms infrastructure gains into compressed outcomes.
Compression across multiple domains is mutually reinforcing: countries with high compression in one pillar (e.g., Human Capital) are more likely to exhibit compression in others (e.g., Growth or Environment), creating a pattern of system-wide fragility.
where DCIp and DCIq denote the DCI for pillars p and q, respectively. The simultaneous presence of positive compression indices across multiple domains indicates that development imbalances are not isolated phenomena but rather interconnected manifestations of a broader systemic constraint. It reflects a situation in which weaknesses in one domain reinforce compression in others, producing cumulative fragilities consistent with the DCT.
Overall, the reviewed SFs jointly test whether asynchronous advancement, the hallmark of the Development Compression Trap, is observable and measurable across multiple development domains. The compression mapping identifies where the imbalance occurs (SF1–SF4), and the DEA efficiency analysis quantifies its severity (SF3, SF7). The cross-domain perspective (SF8) examines whether development imbalances emerge simultaneously across multiple domains, indicating interconnected constraints rather than isolated sectoral deficiencies. Providing evidence in favour of these SFs empirically would support the proposition that rapid macroeconomic convergence without corresponding institutional, social, and ecological depth leads to compressed and fragile development trajectories.
The empirical analysis draws upon a combination of national statistics, international benchmarks, and strategic diagnostics. This triangulated design enhances robustness by integrating context-specific national data with externally validated international indicators. National statistics, primarily from Macedonia’s State Statistical Office, provide contextual precision, while international databases from the World Bank, OECD, Eurostat, United Nations Development Programme (UNDP), and World Health Organisation (WHO) ensure comparability across countries and over time.
In areas where national data coverage is incomplete or inconsistent, such as informal labour markets, institutional quality, or governance, comparable and reputable international datasets serve as corrective anchors. This hybrid evidence base ensures that the analysis captures both the internal dynamics of the Macedonian development trajectory and its relative position within the EU and broader EMEs.
This methodological architecture directly operationalises the Stylised Facts formulated in Section 4.3. In particular, compression mapping tests the Development Compression (SF1) and the Structural Imbalance (SF2) by identifying whether quantitative expansion outpaces qualitative outcomes across domains. The Efficiency Deficit (SF3) is assessed through DEA, while domain-specific Stylised Facts (SF4–SF7) are examined through pillar-level indices. Finally, the Cross-Domain Fragility Stylised Fact (SF8) is evaluated through inter-domain correlations among compression indices.
The central methodological innovation of this paper is the introduction of compression mapping, a diagnostic tool designed to identify temporal and structural misalignments across development domains. Rather than evaluating progress within each sector independently, compression mapping compares the relative pace and depth of progress among domains, revealing where economic advancement outstrips institutional or social adaptation. This approach operationalises SF1 by quantifying the degree to which domains evolve asynchronously.
Compression mapping assesses three forms of misalignment that correspond to the logic of SF2 and SF4–SF7:
Rates of progress (e.g., GDP growth versus productivity stagnation);
Levels of attainment (e.g., expansion of tertiary education without higher learning outcomes); and
Structural alignment (e.g., infrastructure investment without a corresponding increase in governance effectiveness).
Compression is identified when one dimension advances significantly faster than others, producing imbalances that accumulate into systemic vulnerabilities. For instance, high enrolment but poor learning outcomes indicate educational compression (SF4), while energy expansion without efficiency gains reflects ecological compression (SF6).
The DCI formalises these patterns into a measurable construct. The index captures the gap between quantity/coverage (Q) and outcomes/depth (D), testing whether improvements in scale translate proportionally into improvements in quality. This approach directly tests SF1 and SF3 by assessing whether systemic inefficiencies accompany quantitative expansion.
The DCI builds upon established precedents in development measurement. In education, the Learning-Adjusted Years of Schooling (LAYS) proposed by [38] combines schooling years and learning quality into a single outcome-sensitive indicator. Study [17] shows that such integrated metrics outperform traditional input-based measures in explaining growth. Similarly, the Human Capital Index [39] merges access and performance indicators across health and education dimensions.
Efficiency-based methodologies can also enrich the DCI framework. DEA models have been applied to measure sectoral efficiency in areas such as education [40], [41], research and innovation [42], and public administration [43]. These approaches evaluate how well inputs are converted into outcomes, aligning closely with the DCT’s focus on transforming quantitative expansion into qualitative depth. In the context of this study, DEA is used to test SF3 and SF7, and to identify whether weak institutional coupling reduces the efficiency with which resources are translated into outcomes.
The DCT methodology advances these strands by systematically applying compression and DEA across multiple development pillars, education, health, innovation, environment, and institutions, thus creating a unified empirical test of systemic imbalance (SF8).
A defining insight of the DCT framework is that economies may accumulate substantial quantities of human capital, infrastructure, or formal rights without achieving commensurate outcomes in learning proficiency, innovation, or health quality. To operationalise this imbalance, a Compression Index contrasting indicators of quantity/coverage (Q) and depth/outcomes (D) is defined.
Let p identify index pillars (Education, Health, Research/Innovation, Environment, Institutions). For each pillar p, the indicators are split into quantity/coverage Qp (denoting the extent of provision, scale) and depth/outcome Dp (denoting realised performance or effective absorption of those inputs).
This Q–D dichotomy allows us to assess whether institutional systems translate quantitative expansion into proportional qualitative gains, or whether a misalignment emerges, signalling compression. Each indicator is normalised relative to benchmark x(b) (the EU-27 average, for example):
where gk is a monotone transformation ensuring that increased values reflect improvement:
where U is a natural upper bound, often 100 for percentages.
Aggregating with weights wi, vi yields:
where: wi, vi ≥ 0, Σ wi = Σ vi = 1
The Compression Index is then defined as:
A positive Cp indicates that coverage levels in pillar p are closer to the benchmark than outcomes, signalling compression. In addition to this, pairwise matrices of indicators allow disaggregated diagnostics:
Furthermore, the compression index is calculated at the country level. For example, the index for education is defined as follows:
To ensure analytical transparency, each domain of the DCT framework is decomposed into sub-areas, each with associated indicators that are systematically classified as either quantity/coverage (Q) or outcomes (D). This distinction reflects the central methodological premise that development cannot be assessed solely by the expansion of resources, infrastructure, participation, or formal policy commitments, but also by the extent to which these conditions translate into tangible social, economic, institutional, and environmental outcomes. Consequently, the classification is based on the functional role of indicators within each sub-domain rather than on a strict input-output interpretation.
Table 2 summarises the four domains, their sub-areas, and the corresponding indicators with explicit Q/D classification.
Domain |
Sub-areas |
Quantitative inputs (Q) |
Outcomes (D) |
|---|---|---|---|
Human Capital |
Education |
Completion of compulsory schooling Retention rate (100 - early leavers) Tertiary attainment |
Preschool participation PISA proficiency (100 - low achievers) |
Research & Innovation |
Tertiary attainment as skills’ stock |
R&D employees R&D expenditure (% GDP) |
|
Health |
Total health expenditure (% GDP) |
Life expectancy Neonatal/infant/under-five mortality (flipped) Out-of-pocket share (flipped) |
|
Workforce |
Retention feeding the labour market |
Long-term unemployment (flipped) |
|
Growth |
Economic Development |
GDP per capita Consumption expenditure of households |
Employment in Hi-Tech sectors National debt Sovereign credit rating |
Agriculture |
Agriculture’s share of GDP |
Organic agricultural production |
|
Tourism |
Tourism contribution to GDP |
Bed utilization rate |
|
Youth & Sports |
Tertiary attainment Obesity rate Persons at risk at poverty Severe housing deprivation rate |
Participation in socio-economic activities |
|
Environment & Energy |
Energy |
Energy consumption (primary, final, households) Energy import dependency |
Renewable energy penetration Energy intensity Population unable to heat their homes |
Air Quality & Emissions |
GHG emissions per capita Biomass consumption per capita |
Number of deaths attributable to PM air pollution per 100,000 inhabitants |
|
Waste |
Waste generation |
Municipal waste recycling rate |
|
Biodiversity |
Forest area |
Share of protected areas |
|
Infrastructure & Institutions |
Physical Infrastructure |
Transport networks – length of roads Number of cars Internet use by individuals |
Number of victims in traffic accidents Citizens with basic and advanced digital skills |
Institutional Effectiveness |
E-government and electronic identification Budget deficit |
Rule of law Control of corruption Government effectiveness |
|
Public Services |
Salaries and benefits |
Budget deficit |
|
Innovation Ecosystem |
Fresh water |
Losses in the water supply network |
Quantity indicators capture developmental capacities, enabling conditions, or structural characteristics, whereas outcome indicators measure realised performance and developmental achievements. Compression arises when quantity measures improve without a commensurate improvement in outcomes, revealing systemic bottlenecks and inefficiencies.
For example, within the Youth sub-domain, tertiary attainment, poverty risk, obesity, and housing deprivation are treated as conditions that shape the opportunities available to young people, while participation in socio-economic activities represents the realised outcome of successful social and economic integration.
The DCT framework does not rely on estimated free parameters or calibrated coefficients. All indicators are derived directly from internationally reported statistics (Eurostat, World Bank, OECD, WHO and national statistical offices). The aggregation procedure is transparent and deterministic. Consequently, the framework does not fit the data via parameter tuning, but evaluates observable differences between the quantity (Q) and outcome (D) dimensions using predefined indicator sets. Several indicators are not reported annually. To maintain a consistent time series for the period 2018–2024, missing values were imputed using a transparent deterministic procedure. Missing intermediate observations were estimated as the average of adjacent years, while the nearest available observation replaced missing values at the beginning or end of the series. This approach preserves trend continuity while avoiding model-based estimation or parameter fitting.
The DCI captures the extent to which quantitative expansion is translated into qualitative outcomes within each development domain. By comparing coverage- and outcome-based indicators, it provides a direct measure of development compression and identifies domains where progress in scale exceeds progress in performance. However, the DCI remains an internal measure of imbalance and does not reveal whether the observed outcomes are efficient relative to countries operating under similar resource and coverage conditions.
On the other hand, DEA is selected because it is non-parametric, accommodates multiple inputs and outputs simultaneously, and does not require assumptions regarding the functional relationship between inputs and outputs, making it particularly suitable for multi-dimensional development assessments involving heterogeneous indicators. DEA evaluates the extent to which countries transform available inputs into desirable outcomes and identifies the distance from best observed practice. The combined application of the DCI and DEA, therefore, allows development trajectories to be assessed from two complementary perspectives: the DCI identifies the magnitude and location of compression, while DEA evaluates the efficiency with which development systems convert quantitative inputs into qualitative outcomes. Together, they provide a more comprehensive assessment of development imbalances and their implications for long-term resilience and sustainability. Each country is treated as a Decision-Making Unit (DMU), with inputs defined as coverage indicators (and undesirable outcomes, if applicable) and outputs as desirable outcomes.
The output-oriented Charnes, Cooper, and Rhodes’ (CCR) [44] model is implemented:
where x0 and y0 are country input and output vectors; X, Y represent the sample of peer economies; and ϕ is the proportional expansion required for country outcomes to reach the frontier given its inputs. A value ϕ > 1 implies that Macedonia underperforms relative to best practice, even after accounting for its coverage levels. For robustness, the Banker, Charnes, and Cooper’s (BCC) [45] model is additionally estimated with a convexity constraint to allow for variable returns to scale.
It should be noted that the efficiency assessment used in this study differs from a conventional DEA application, in which the efficiency frontier is determined endogenously by the best-performing DMUs in the sample. The objective of this analysis is not to identify relative efficiency among countries, but rather to evaluate the extent to which development outcomes converge toward the standards represented by the European Union benchmark. Consequently, the estimated efficiency scores should be interpreted as measures of developmental distance from the benchmark frontier. The DEA formulation is therefore used as a benchmarking tool to assess how effectively countries transform development inputs into outcomes relative to the benchmark, rather than to the best-performing country in the sample. The analytical sequence follows four interlinked stages designed to test the Stylised Facts and to operationalise the DCT framework empirically:
Descriptive Benchmarking. National indicators are benchmarked against EU-27 averages to establish comparative baselines. This stage tests the presence of cross-domain asymmetries anticipated by SF1 and SF2, providing the reference structure for subsequent efficiency analysis.
Gap Analysis. Discrepancies between macroeconomic performance and structural-social fundamentals are identified to evaluate whether quantitative expansion outpaces qualitative depth, as posited in SF1 and SF4–SF7.
Compression Diagnostics. The Development Compression Index (DCI) and DEA models are applied to quantify the magnitude of these imbalances and to assess efficiency-adjusted performance. This stage directly tests SF3 and SF7, revealing whether structural inefficiencies accompany visible progress.
Integrative Synthesis. Findings are consolidated into a cross-domain narrative that examines whether compression in one pillar correlates with compression in others, thereby testing SF8, the systemic or cross-domain fragility Stylised Fact.
This iterative process ensures that each pillar is interpreted in its broader systemic context. Weaknesses in education, for example, are re-evaluated in light of labour-market dynamics, while institutional fragility is analysed as a constraint on environmental enforcement. The resulting synthesis provides a multi-dimensional and efficiency-adjusted assessment of how partial modernisation and uneven reform sequencing generate a DCT.
Macedonia serves as an illustrative case for testing the DCT framework and associated Stylised Facts. The country has spent 22 consecutive years classified as a lower-middle-income economy. This stagnation reflects the persistence of structural bottlenecks and limited upward mobility within the global income hierarchy. Its trajectory embodies many of the systemic imbalances the DCT seeks to explain: rapid progress in macroeconomic and formal institutional indicators, but weak qualitative transformation in productivity, innovation, and resilience.
The empirical investigation combines benchmarking, compression mapping, and efficiency analysis (DEA) to test whether Macedonia’s development pattern exhibits the multi-speed advancement and systemic fragility hypothesised by the DCT. This section, therefore, addresses the following overarching expectation: that visible economic and social convergence in Macedonia coexists with underlying institutional and ecological inefficiencies, producing a compressed and ultimately fragile development trajectory (SF1–SF8).
To situate Macedonia’s experience within a broader empirical context, the analysis draws on comparable country studies employing growth diagnostics, stochastic frontier analysis, and trap-based methodologies. For instance, [46] identifies water, export, and capability bottlenecks in Jordan; [47] exposes persistent institutional and energy constraints in Pakistan; and [48] documents investment inefficiencies in resource-rich transition economies. In education, [49] shows for Mexico how efficiency frontiers reveal within-system disparities between inputs and outcomes, while [50] and [51] demonstrate how coordination failures and premature deindustrialisation have entrenched middle-income traps in South Africa. Similarly, [52] on Bangladesh and [31] on Brazil highlight how growth without institutional reform deepens stagnation. These precedents underscore that the DCT is not context-specific but rather part of a broader class of development pathologies where quantitative expansion outpaces qualitative upgrading.
Consistent with SF4 (human capital misalignment), Macedonia’s human capital trajectory reveals significant compression between educational attainment and learning outcomes. Access to education has expanded markedly, completion of compulsory schooling stands at 90%, upper-grade retention at 94%, and tertiary attainment at 38%, nearing the EU-27 average. Yet quality outcomes remain critically low: only 45% of 15-year-olds achieve basic proficiency in reading, mathematics, or science, the weakest performance in Europe.
The compression index confirms this imbalance: the education sub-area records a Q index of 0.73 and a D index of 0.39, resulting in a compression gap of 0.34 (Figure 2). Benchmarking against the EU amplifies the disparity (Q ratio: 0.98 vs D ratio: 0.46), while DEA efficiency remains low at 0.5, indicating that outcomes fall far short of the efficiency frontier. Limited preschool coverage (42%) further entrenches inequality at the starting point.
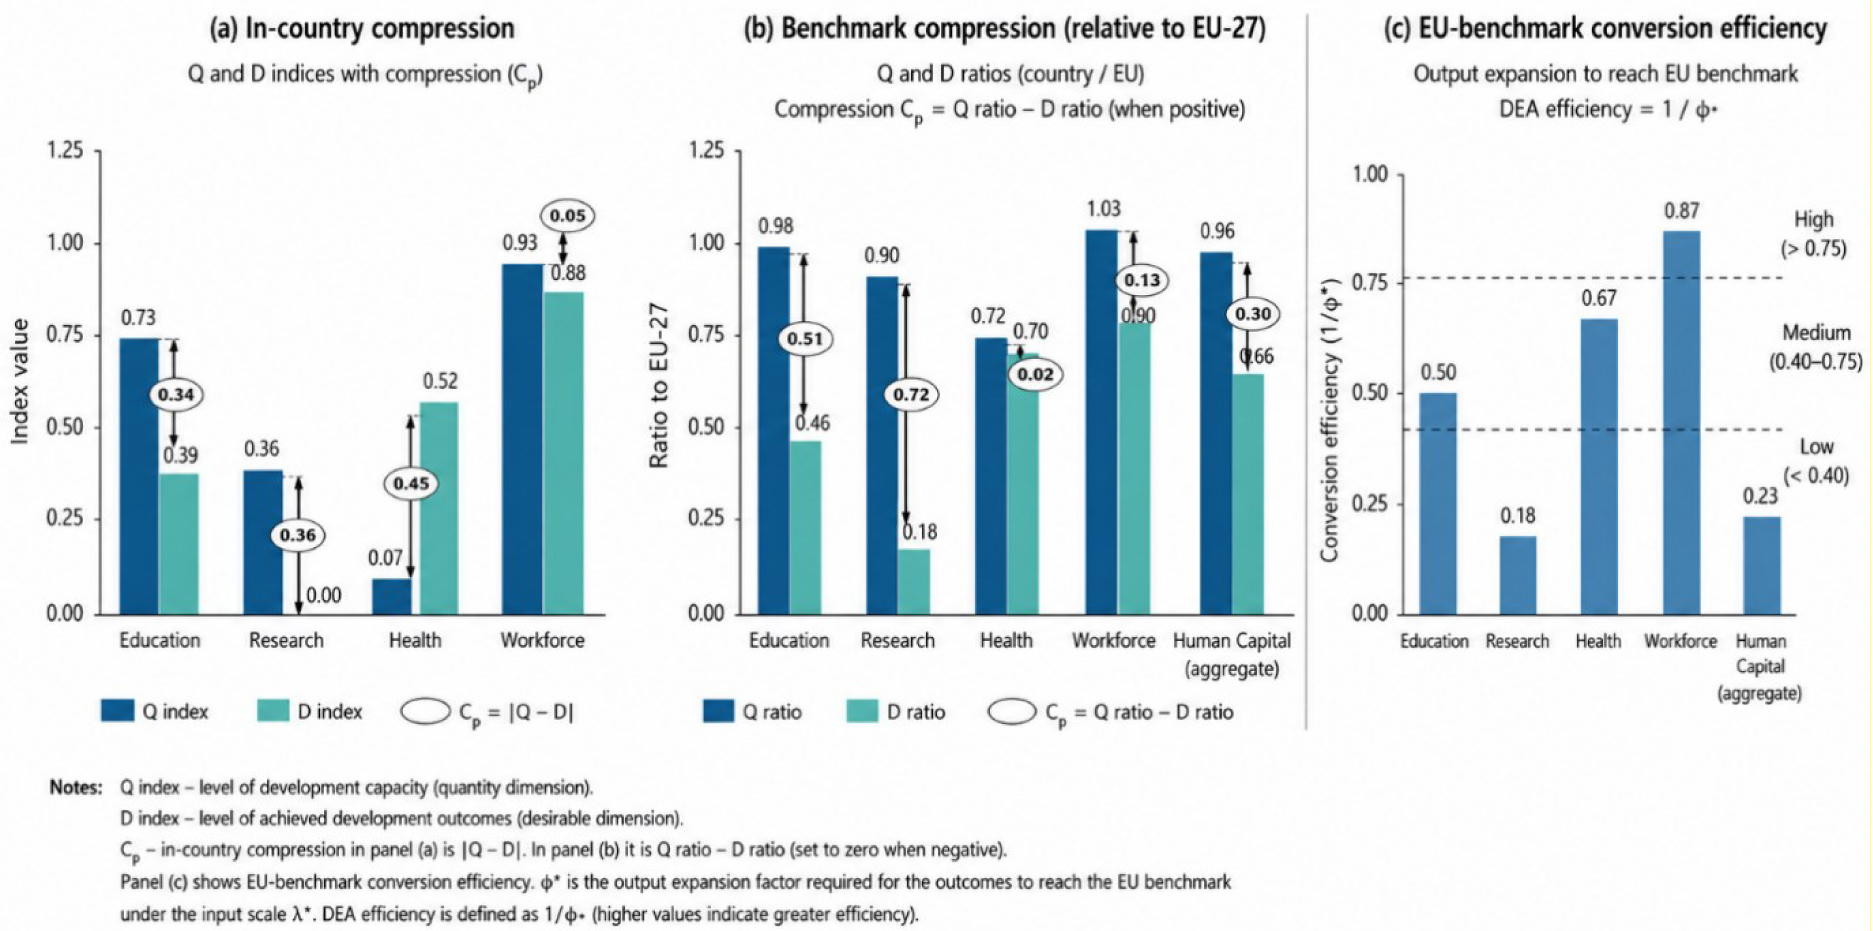
The research and innovation sub-domain exemplifies failure to absorb skills, a defining symptom of development compression. Despite an expanding tertiary-educated workforce, R&D employment (0.2% of total) and expenditure (0.4% of GDP) remain minimal. The compression gap reaches 0.36, and DEA efficiency collapses to 0.18, indicating that Macedonia realises less than one-sixth of the outcomes that comparable EU inputs would yield.
Labour market outcomes partially moderate this pattern but remain uneven. Although employment has improved, long-term unemployment persists, and NEET rates remain among the highest in the region. The workforce sub-area shows a small compression gap of 0.06, yet aggregate DEA efficiency is only 0.87, reflecting incomplete integration of educational outputs into productive employment.
In health, the compression pattern reverses. With limited inputs (health expenditure 7% of GDP), outcomes such as life expectancy (76 years) and infant mortality rates approach the efficiency frontier (DEA = 0.87). Nonetheless, weak financial protection (41% out-of-pocket spending) exposes systemic inequity.
At the aggregate level, Human Capital exhibits a compression index of +0.3 and a DEA efficiency score of 0.23. The results demonstrate that Macedonia’s quantitative expansion in education and employment has not translated into commensurate qualitative improvements, consistent with SF1 and SF4. This imbalance fuels the outmigration of skilled labour and traps the economy in a low-efficiency equilibrium typical of compressed development.
A temporal analysis of the Human Capital domain for the period 2018–2024 reveals a mixed pattern of development. The most significant improvement is observed in health, where DEA efficiency increased from 0.41 in 2018 to 0.99 in 2024. This progress is consistent with substantial reductions in neonatal mortality (from 5.7 to 1.1 deaths per 1,000 live births), infant mortality (from 7.4 to 2.5 deaths per 1,000 live births), and under-five mortality (from 8.4 to 2.8 deaths per 1,000 live births), accompanied by relatively stable health expenditure levels. Workforce performance remained relatively stable and comparatively strong throughout the period, with DEA scores increasing from 0.84 to 0.92. In contrast, education exhibited only modest fluctuations without a clear upward trend, while research remained persistently inefficient, with DEA scores below 0.22 across all years. As a result, aggregate Human Capital efficiency remained largely stagnant, fluctuating between 0.21 and 0.26, suggesting that improvements in health outcomes were insufficient to compensate for structural weaknesses in the education and research systems.
The Growth pillar, reflecting SF5 (growth without upgrading) and SF2 (structural imbalance), displays headline convergence but persistent fragility in structural transformation. GDP per capita and household consumption show moderate input levels (Q index 0.42), yet outcomes such as productivity and innovation-driven employment remain modest (D index 0.40). Benchmarking suggests an illusion of convergence; inputs reach 64% of EU levels while outcomes appear overstated at 148%, masking structural weaknesses.
Agriculture epitomises structural compression: it contributes 9% of GDP (nearly seven times the EU share) but delivers negligible modernisation outcomes (organic production 0.3%). DEA efficiency of 0.005 (Figure 3) confirms that Macedonia extracts less than 1% of the output frontier, representing a paradigmatic low-productivity trap.
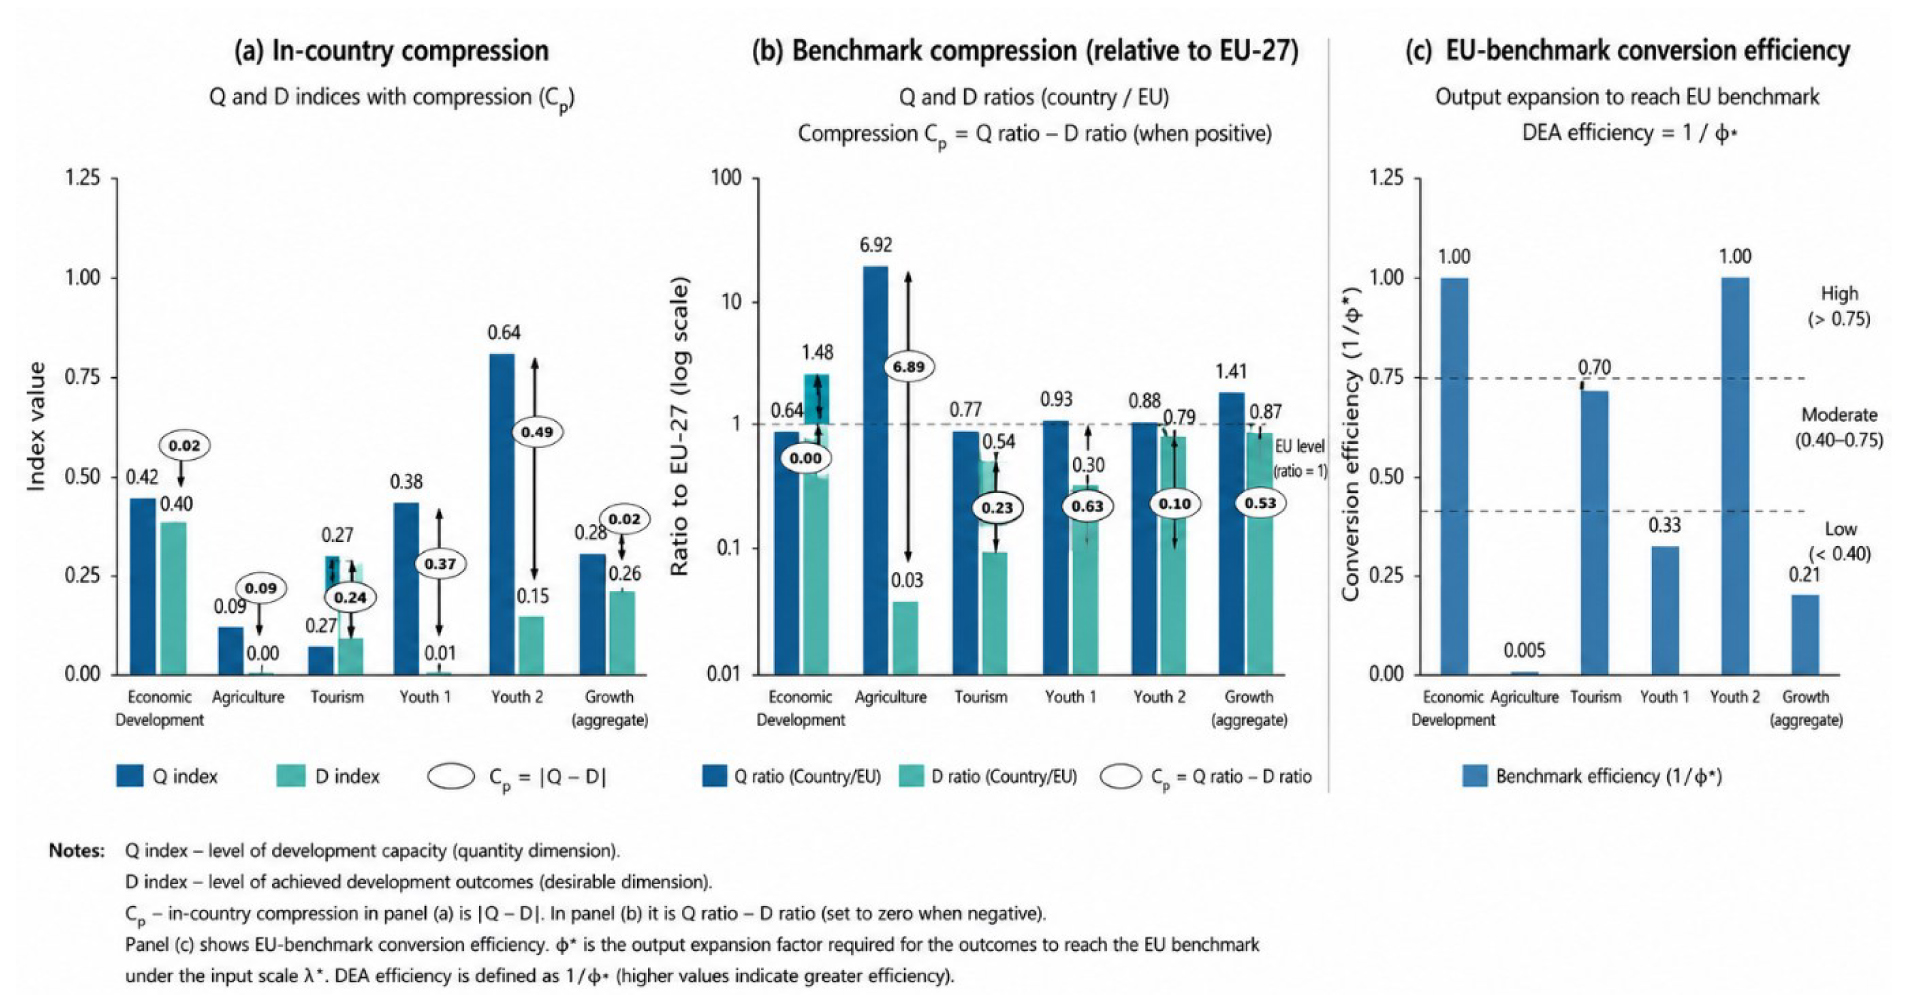
Tourism exhibits moderate compression (DEA 0.70), while the youth sub-domains reveal a severe capability pipeline failure. Tertiary attainment among youth (Q 0.38) contrasts with extremely low doctoral output (D 0.01), yielding a compression of +0.37 and DEA efficiency of 0.33. Although youth participation in civic activities has increased slightly, the conversion of educational capital into innovation or inclusion remains limited.
Aggregate results indicate apparent equilibrium (C +0.02) within Macedonia but significant inefficiency relative to the EU frontier (DEA 0.21). The pattern confirms that growth in scale has not been accompanied by upgrading in structure or productivity, validating SF1, SF2, and SF5.
The environmental pillar provides strong evidence for SF6 (environmental compression) and SF7 (institutional coupling). Macedonia demonstrates partial alignment with EU energy benchmarks; renewable penetration and forest coverage appear comparable, but outcome indicators reveal severe ecological inefficiencies.
Air quality is the clearest manifestation of compression. Despite moderate inputs (Q ratio 1.5), outcomes (D ratio 0.5) remain far below the EU 27 frontier, with pollution-related years of life lost more than double EU levels (DEA 0.37).
Energy indicators show structural inefficiency rather than shortage. The compression index of +0.54 and DEA efficiency of 0.68 (Figure 4) indicate that while energy coverage is adequate, conversion into sustainable outcomes is weak, with 24% of households unable to heat their homes.
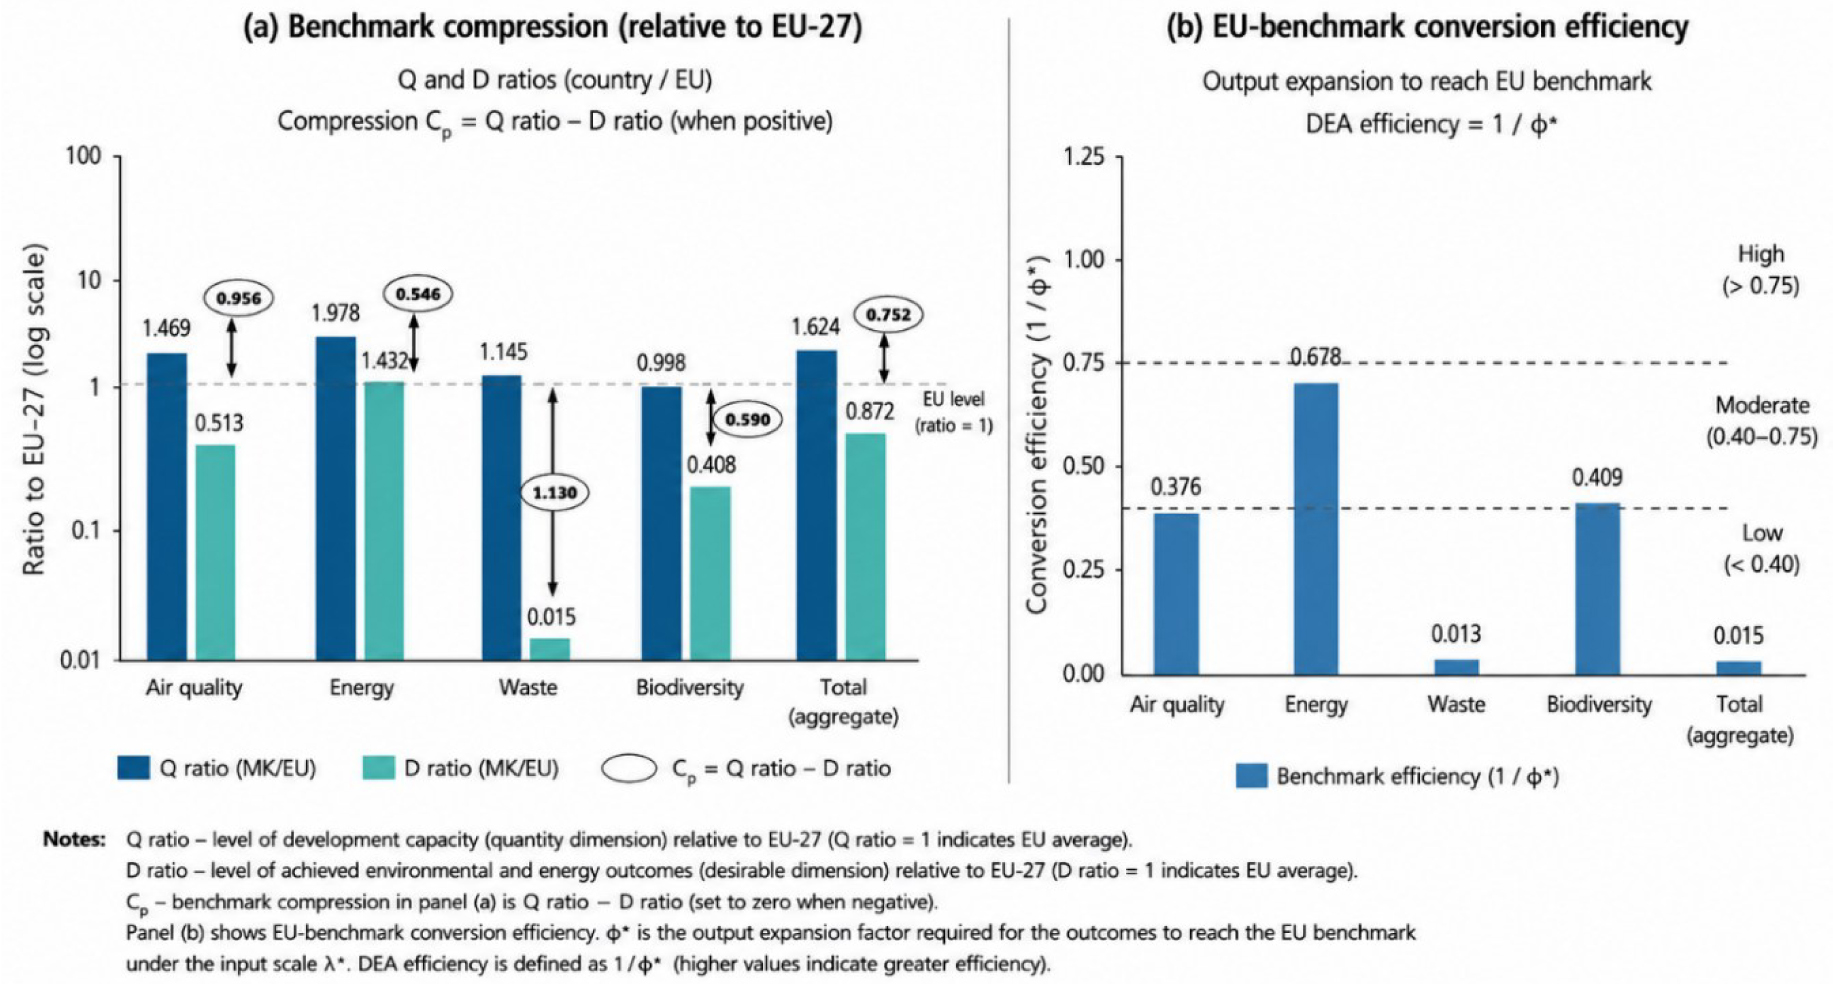
Waste management reveals the most extreme compression: near-EU input levels (Q 1.1) contrast with negligible recycling outcomes (D 0.015). DEA efficiency collapses to 0.01, exposing form without function, a classic institutional failure consistent with SF7.
At the aggregate level, Environment and Energy registers a compression index of +0.75 and a DEA efficiency of 0.015. The findings confirm that environmental progress at scale has not translated into ecological depth or institutional enforcement, exemplifying SF6 and reinforcing the DCT’s systemic logic.
The Environment and Energy domain showed limited overall improvement between 2018 and 2024, with aggregate DEA efficiency remaining extremely low and fluctuating between 0.01 and 0.02. Energy performance improved over the period, increasing from 0.82 in 2018 to 0.98 in 2024 and exceeding the benchmark in 2021, reflecting progress in energy efficiency and renewable energy deployment. Biodiversity also exhibited a positive trend, with DEA efficiency rising from 0.38 to 1.07, indicating a gradual convergence toward benchmark outcomes. In contrast, air quality remained persistently weak, with DEA scores declining from 0.35 to 0.30, suggesting that corresponding reductions in air pollution impacts did not accompany improvements in environmental and energy outcomes. Waste management remained the most compressed sub-area throughout the period, with DEA efficiency consistently around 0.01, highlighting a severe disconnect between waste generation and waste treatment outcomes. Consequently, the domain continues to exhibit substantial environmental compression, driven primarily by persistent inefficiencies in waste management and air quality.
Infrastructure and Institutions jointly test SF3 (efficiency deficit) and SF7 (institutional coupling). On aggregate, inputs (Q ratio 0.80) and outcomes (D ratio 0.64) appear balanced, yet disaggregation reveals deep asymmetries.
Transport infrastructure shows moderate alignment with EU standards and full DEA efficiency, but digitalisation exposes a hidden vulnerability: broadband coverage (2%) lags dramatically behind the EU (59%), while digital skills appear comparable. This artificial efficiency, DEA 1.00 (Figure 5), reflects low input baselines rather than genuine competitiveness.
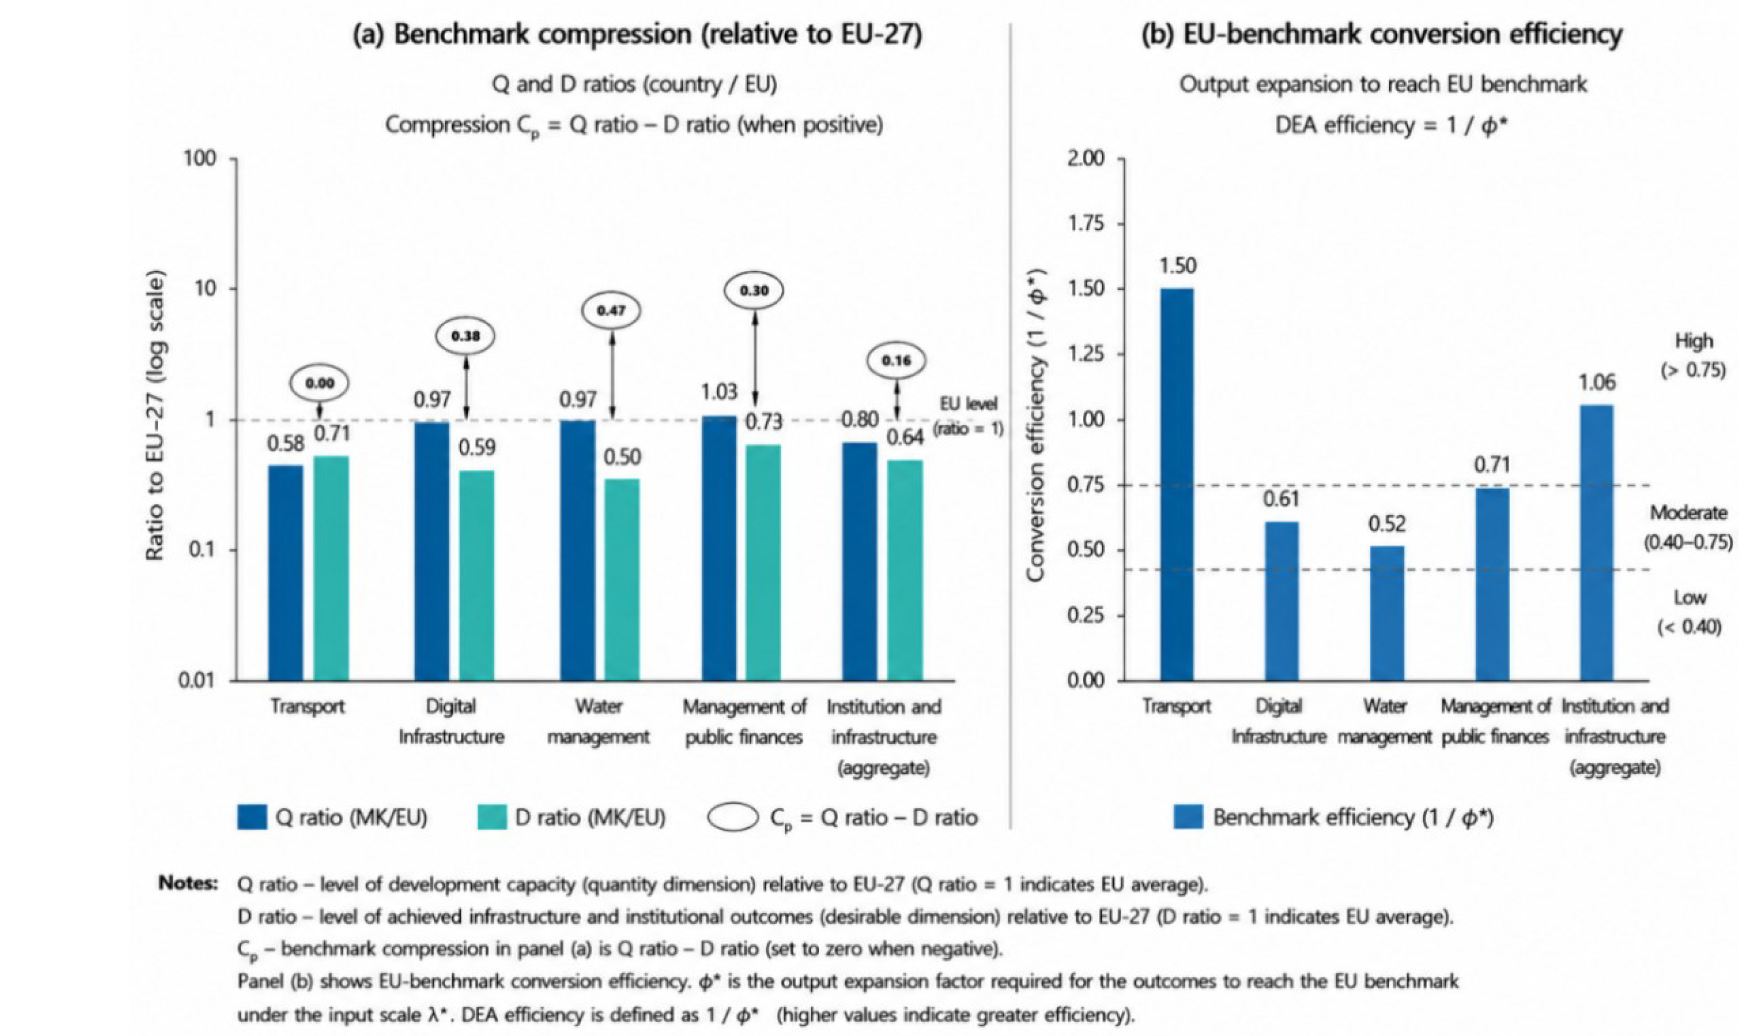
Water management displays acute compression (+0.47) and inefficiency (DEA 0.52) due to extreme network losses (62%). Public finances show similar fragility: high inputs (Q 1.03) and weaker outcomes (D 0.73) yield compression (+0.30) and DEA 0.71 (Figure 5), reflecting weak fiscal discipline despite substantial expenditure. Governance indicators (rule of law, corruption control) are moderately strong but not supported by commensurate investment in enforcement mechanisms, resulting in a mild compression (+0.10) and a DEA of 0.87.
Overall, this pillar embodies the coupling problem central to the DCT: physical and institutional infrastructures evolve asynchronously, producing the illusion of convergence without the resilience to sustain it.
Cross-cutting themes provide an integrative perspective consistent with SF8 (Cross-Domain Fragility). Although digitalisation, gender equality, and transparency have improved, these gains remain surface-level and weakly institutionalised.
Digitalisation shows strong uptake in connectivity but poor diffusion of digital skills among citizens, while SME productivity remains far below EU benchmarks. Social inclusion gains are offset by regional disparities, particularly in Polog and the Northeast, where per capita income remains at half the national average.
Governance and resilience frameworks exist in legislation but lack enforcement capacity; corruption control remains weak, and a law on critical infrastructure is still pending. Progress on gender equality is uneven: women dominate research roles but remain underrepresented in technical sectors and leadership.
The cross-cutting results reveal that advances in scale continue to exceed advances in depth. Gains in formal structures coexist with enduring fragilities in inclusion, resilience, and institutional enforcement. Macedonia’s overall trajectory thus reflects a compressed convergence pattern: visible modernisation masking systemic inefficiencies and vulnerability to shocks.
To assess the broader applicability of the Development Compression Trap (DCT) framework, a comparative analysis was conducted for selected Western Balkan and European Union countries, including Serbia, Montenegro, Bulgaria, Romania, Croatia, Slovenia, and Denmark. The analysis focused on the Human Capital and Environment & Energy pillars, which capture the social and ecological dimensions of development and offer an opportunity to examine whether the patterns observed in Macedonia are country-specific or part of a broader regional characteristic.
The results reveal a clear differentiation between advanced European economies, recent EU member states, and Western Balkan countries. Denmark and Slovenia consistently occupy the efficiency frontier in both pillars (Figure 6 and Figure 7), indicating a strong ability to translate investments and policy commitments into tangible outcomes. Croatia follows as an intermediate performer, achieving relatively balanced results and demonstrating limited evidence of developmental compression.
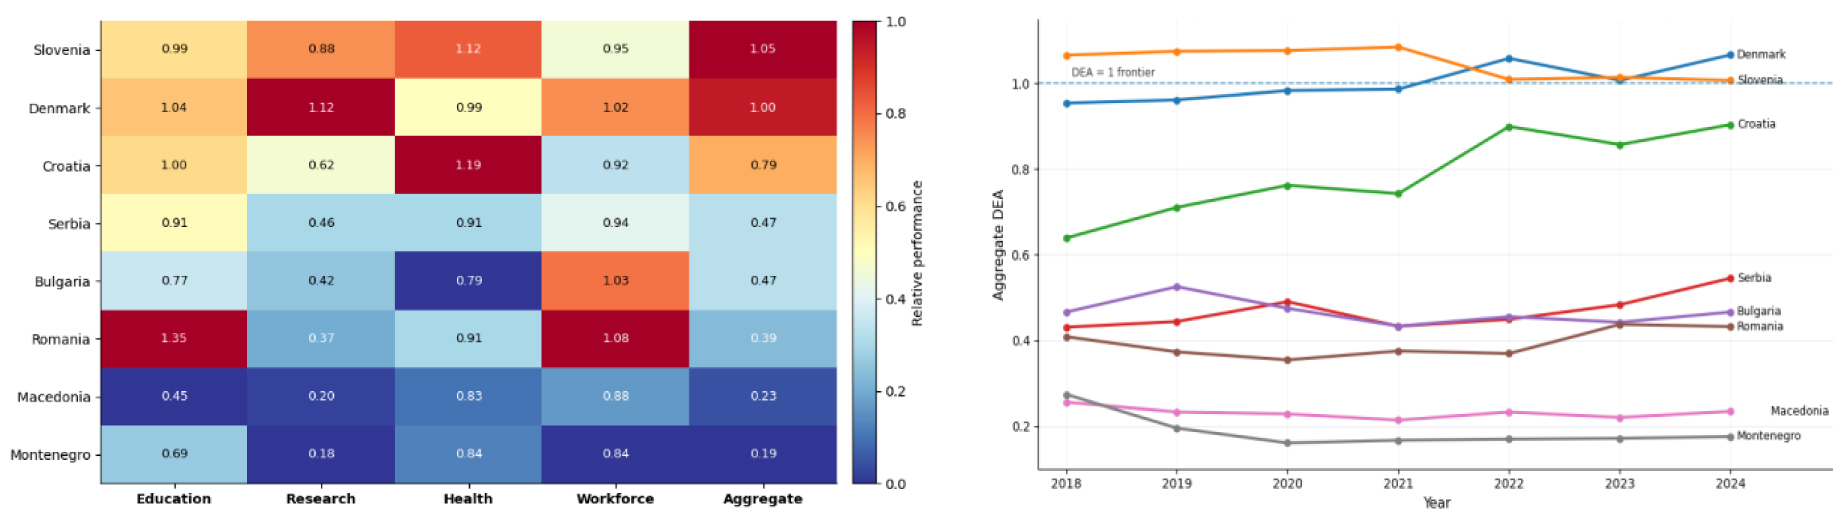
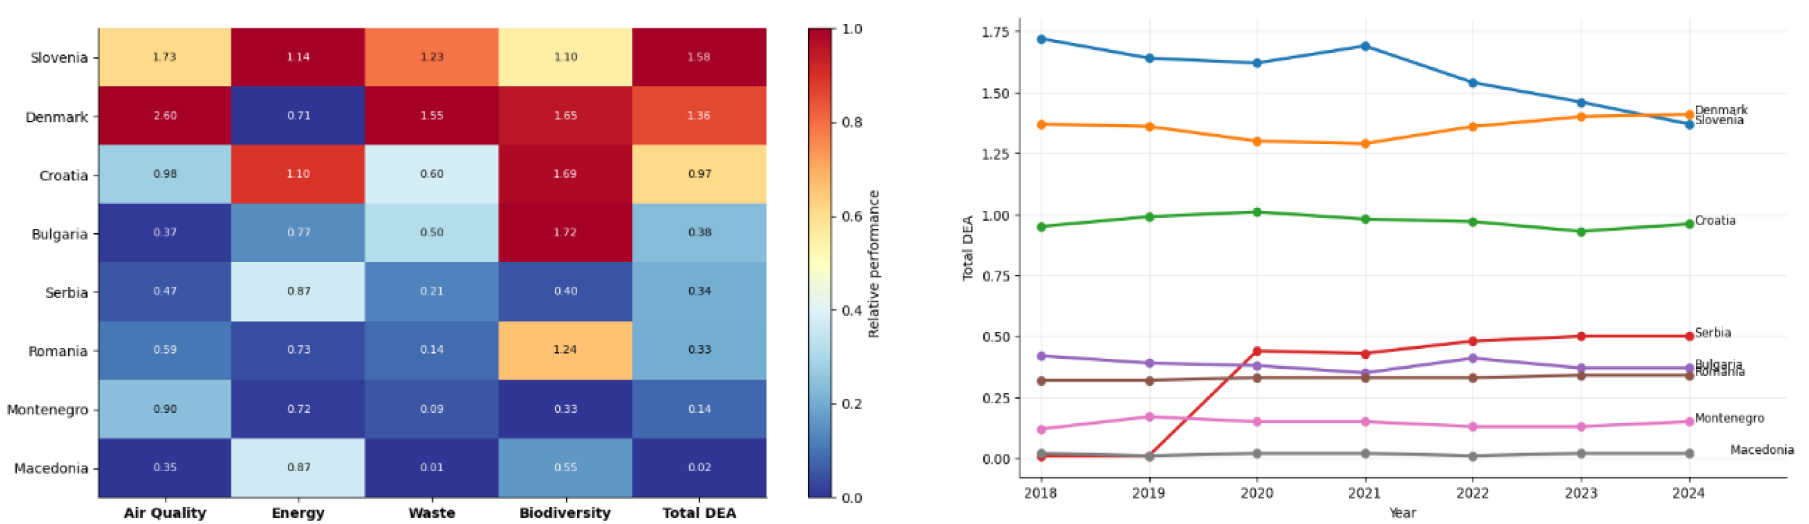
Bulgaria and Romania occupy a middle position. While both countries have substantially improved educational attainment, healthcare coverage, environmental protection measures, and energy transition indicators, the conversion of these investments into innovation performance, labour market outcomes, air quality improvements, and waste-management results remains less effective. This situation suggests moderate compression, in which progress in coverage exceeds progress in outcomes.
The most pronounced inefficiencies are observed among the Western Balkan countries. Although Serbia has demonstrated notable improvements in both human capital and environmental performance during recent years, particularly after 2020, its efficiency levels remain significantly below those observed in Croatia, Slovenia, and Denmark. Montenegro similarly exhibits persistent difficulties in transforming investments into outcomes, particularly in innovation and environmental management.
Among all analysed countries, Macedonia displays the strongest evidence of developmental compression. In the Human Capital pillar, improvements in educational participation and attainment have not been accompanied by comparable progress in learning outcomes, research performance, and innovation capacity. Similarly, in the Environment & Energy pillar, relatively strong performance in energy-related indicators and biodiversity protection coexists with extremely low waste-management efficiency and persistently weak air-quality outcomes. Consequently, progress achieved in individual dimensions fails to translate into balanced improvements across the broader development system.
Figure 6 and Figure 7 illustrate the average DEA efficiency scores for both pillars during 2018–2024. The results reveal a clear gradient extending from Denmark and Slovenia, through Croatia, Bulgaria, Romania, and Serbia, towards Montenegro and Macedonia. This pattern provides empirical support for the central proposition of the DCT framework: development becomes increasingly fragile when corresponding improvements in institutional effectiveness and outcome quality do not accompany quantitative expansion in education, environmental investments, and policy reforms.
This study introduced and applied the DCT as a framework for understanding how economies can display rapid convergence in scale while remaining structurally fragile in depth. In contrast to the middle-income trap, which focuses on stagnation, the DCT highlights temporal and structural imbalances in which macroeconomic progress outpaces institutional, social, and ecological capacities. The case of Macedonia illustrates this pattern vividly: education systems expand without improvements in learning outcomes, GDP growth occurs without productivity gains, environmental laws exist but are not enforced, and infrastructure investments advance faster than institutional effectiveness does.
The empirical application of compression mapping, EU benchmarking, and efficiency analysis demonstrates that quantitative expansion systematically exceeds qualitative progress. Across Human Capital, Growth, Environment, and Institutional domains, development advances in scale but not in quality. This compressed trajectory generates systemic fragility, leaving the economy vulnerable to shocks and undermining prospects for resilient, sustainable convergence.
The comparative assessment further demonstrates that the DCT is not unique to Macedonia but represents a broader challenge for many transition economies. The results reveal a clear gradient extending from highly efficient systems such as Denmark and Slovenia, through intermediate performers such as Croatia, Bulgaria, and Romania, to more compressed development trajectories observed in Serbia, Montenegro, and Macedonia. Importantly, the findings suggest that developmental compression is not merely a consequence of lower income levels but emerges when improvements in educational attainment, environmental investments, infrastructure, and policy commitments are not accompanied by corresponding gains in outcomes and institutional effectiveness. Macedonia consistently records some of the lowest efficiency values among the analysed countries, particularly within the Environment and Energy pillar. It offers additional support for the central proposition that development becomes fragile when quantitative expansion outpaces the institutional and societal capacities required to transform these inputs into sustainable outcomes.
The policy implications are clear. Development strategies must shift from expansion to depth, ensuring that qualitative outcomes match quantitative achievements. In Human Capital, this means prioritising the quality of learning, labour market absorption, and equitable access to healthcare. In the Growth domain, diversification and productivity upgrading are essential to reduce dependency on low-value sectors and strengthen innovation capacity. Environmental policy must focus on enforceable sustainability e measures accelerating renewable energy deployment, improving waste management, and protecting biodiversity. Institutional reform must prioritise the coupling between formal structures and effective implementation, ensuring that transparency, digitalisation, and infrastructure yield substantive outcomes. Because compression is systemic, reforms must be coordinated across domains rather than pursued in isolation; progress in one pillar cannot compensate for stagnation in another.
The empirical findings provide broad support for the stylised facts underlying the DCT framework. Positive compression indices were identified across all examined domains, confirming measurable development compression (SF1). The magnitude of compression varies substantially across domains, with Environment and Energy and Growth exhibiting the highest levels of imbalance, providing evidence of structural asymmetries in development trajectories (SF2). The analysis further supports the presence of human capital misalignment (SF4), growth without sufficient structural upgrading (SF5), environmental compression (SF6), and institutional coupling constraints (SF7). Finally, the simultaneous occurrence of compression across multiple domains suggests that development imbalances are not isolated sectoral phenomena but interconnected manifestations of a broader systemic pattern, consistent with SF8. Together, these findings support the central proposition of the DCT framework that quantitative expansion can advance more rapidly than qualitative transformation, generating structurally fragile development trajectories.
From an academic perspective, the DCT enriches the comparative development literature by reframing traps as multi-dimensional disequilibria rather than static episodes of stagnation. It provides a unified framework that links economic, social, and institutional dimensions of development through measurable indicators of imbalance and efficiency. Methodologically, it integrates compression indices with Data Envelopment Analysis to quantify how far countries lie from balanced and efficient trajectories, thus combining conceptual innovation with empirical rigour.
Importantly, the efficiency assessment presented in this study should be interpreted as a benchmark-oriented frontier analysis rather than a conventional DEA application. The European Union average was treated as a normative development frontier against which country performance was evaluated. This approach was selected because the objective was not to identify the best-performing country within the sample, but rather to assess the extent to which development outcomes converge toward the standards represented by the European Union. Consequently, the estimated efficiency scores should be interpreted as measures of developmental distance from the benchmark frontier rather than relative efficiency within the analysed sample.
Several limitations should nevertheless be acknowledged. Although the comparative analysis extends the framework beyond a single-country application, the assessment remains limited to a select group of European and Western Balkan economies and is constrained by data availability across the examined domains. Furthermore, the benchmark-oriented frontier approach does not allow the efficiency frontier to emerge endogenously from the observed performance of all countries. Future research should therefore expand the geographical coverage of the analysis, incorporate additional transition and emerging economies, and implement conventional CCR and BCC DEA models in which the performance of all decision-making units determines the frontier. Such extensions would enable a more comprehensive assessment of developmental compression across different institutional and economic contexts. Future studies should also incorporate qualitative evidence on state capacity, governance quality, and policy coordination mechanisms to better understand why developmental compression persists despite formal convergence.
Ultimately, sustainable convergence depends less on the speed of growth than on the coherence between economic expansion and institutional deepening. Recognising and addressing development compression is therefore essential for transforming rapid but fragile convergence into resilient, inclusive, and sustainable development.
- ,
Economic Development with Unlimited Supplies of Labour ,Manchester Sch. , Vol. 22 (2), :139-191, https://doi.org/10.1111/j.1467-9957.1954.tb00021.x - ,
The Strategy of Economic Development ,Yale University Press, New Haven , 1958 - , , Why Nations Fail: The Origins of Power, Prosperity, and Poverty, Crown Business, 2012
- ,
Caught in the Middle? the Economics of Middle-Income Traps ,J. Econ. Surv. , Vol. 31 (3), :771-7912017, https://doi.org/10.1111/joes.12175 - ,
Growth slowdowns redux ,Japan World Econ. , Vol. 32 , :65-84, https://doi.org/10.1016/j.japwor.2014.07.003 - ,
Confronting the Middle Income Trap: Insights from Small Latecomers ,Stud. Comp. Int. Dev. , Vol. 47 (2), :115-1382012, https://doi.org/10.1007/s12116-012-9110-y - , , Compressed development: Time and timing in economic and social development, 2020
- , Economic Backwardness in Historical Perspective - Lecture Three - Other Industrialized Countries than Britain., 1962
- ,
The Middle-Income Trap ,World Polit. , Vol. 68 (4), :608-6442016, https://doi.org/10.1017/S0043887116000095 - ,
An empirical approach to understanding the lower-middle and upper-middle income traps ,Int. J. Dev. Issues , Vol. 18 (2), :171-1902019, https://doi.org/10.1108/IJDI-09-2018-0138 - ,
Structural Change, Industrial Upgrading, and Middle-Income Trap ,J. Ind. Compet. Trade , Vol. 20 (2), :359-3942020, https://doi.org/10.1007/s10842-019-00330-3 - ,
Tigers Trapped: Tracing the Middle-income Trap through the East and Southeast Asian Experience ,Berlin Work. Pap. Money, Financ. Trade Dev. , https://econpapers.repec.org/RePEc:mtf:wpaper:1404 - ,
Towards Sustainable Development: Revisiting the Middle-Income Trap Hypothesis for the Southern Common Market Countries ,Probl. Ekorozwoju , Vol. 18 (2), :111-1202023, https://doi.org/10.35784/preko.3949 - ,
The Middle-Income Trap from a Schumpeterian Perspective ,SSRN Electron. J. , (521), 2018, https://doi.org/10.2139/ssrn.3187838 - ,
The political economy of open contracting reforms in low- and middle-income countries ,Governance , Vol. 38 (2), 2025, https://doi.org/10.1111/gove.12897 - ,
Institutions and Economic Growth: A Panel Granger Causality Analysis ,Glob. Acad. J. Econ. Bus. , Vol. 6 (6), :166-1772024, https://doi.org/10.36348/gajeb.2024.v06i06.003 - ,
The Double Trap in China—Multiple Equilibria in Institutions and Income and their Causal Relationship ,Open Economies Review , Vol. 34 (3), 2023, https://doi.org/10.1007/s11079-022-09693-3 - ,
The Geography of EU Discontent and the Regional Development Trap ,Econ. Geogr. , Vol. 100 (3), :213-2452024, https://doi.org/10.1080/00130095.2024.2337657 - ,
Growth Diagnostics ,Washingt. Consens. Reconsidered Towar. a New Glob. Gov. , (3), 2005, https://doi.org/10.1093/acprof:oso/9780199534081.003.0015 - ,
IBRD/IFC/MIGA/IDA Guidance - Systematic Country Diagnostic , 2021, World Bank Group - , , A Multi-dimensional Approach to the Post-COVID-19 World for Paraguay, 2024
- , , Time for Equality: Closing Gaps – Opening Trails, 2010
- , , Building State Capabilities, 2017
- ,
European Council, Regulation (EU) No 1176/2011 of the European Parliament and of the Council on the prevention and correction of macroeconomic imbalances , 2011https://eur-lex.europa.eu/TodayOJ/index.html - , , Beyond Reforms: Structural Dynamics and Macroeconomic Vulnerability. United Nations Economic Commission for Latin America and the Caribbean (ECLAC), 2005
- ,
European Commission, Rationale, Process, Application: A Compendium. Economic and Financial Affairs. The Macroeconomic Imbalance Procedure EUROPEAN ECONOMY , 2016, https://doi.org/10.2765/958247 - ,
Escaping Capability Traps Through Problem Driven Iterative Adaptation (PDIA) ,World Dev. , Vol. 51 , :234-244, https://doi.org/10.1016/J.WORLDDEV.2013.05.011 - ,
Achieving Development Success: Strategies and Lessons from the Developing World ,World Inst. Dev. Econ. Res. , 1-202013www.unu.edu - ,
Thinking about developmental states in Africa ,Cambridge J. Econ. , Vol. 25 (3), :289-3132001, https://doi.org/10.1093/cje/25.3.289 - , , The Bottom Billion: Why the Poorest Countries Are Failing and What Can Be Done about It, 2007
- ,
The role of human capital, structural change, and institutional quality on Brazil’s economic growth over the last two hundred years (1822–2019) ,Struct. Chang. Econ. Dyn. , Vol. 66 , :1-12, https://doi.org/10.1016/J.STRUECO.2023.04.003 - ,
The middle-income trap and the middle-technology trap in Latin America–practice comparison based on East Asian perspective ,Asian Rev. Polit. Econ. , Vol. 3 (1), :1-242024 31, https://doi.org/10.1007/S44216-024-00031-7 - ,
Structural change, marginal land and economic development in Latin America and the Caribbean ,Lat. Am. Econ. Rev. , Vol. 23 (1), :1-29, https://doi.org/10.1007/S40503-014-0003-5/TABLES/2 - ,
Governance and Structural Transformation in Africa: Thresholds of Lifelong Gender Inclusive Education ,Gender Issues , Vol. 41 (4), :1-34, https://doi.org/10.1007/S12147-024-09340-W/TABLES/10 - ,
Implications of institutional quality for macroeconomic productivity in sub-Saharan Africa ,Discov. Glob. Soc. , Vol. 3 (1), :1-26, https://doi.org/10.1007/S44282-025-00235-Z/TABLES/5 - ,
The quality vs. the quantity of schooling: What drives economic growth? ,Econ. Educ. Rev. , Vol. 30 (4), :765-773, https://doi.org/10.1016/J.ECONEDUREV.2011.01.005 - ,
Education in Africa: What Are We Learning? ,J. Afr. Econ. , Vol. 30 (1), :13-54, https://doi.org/10.1093/JAE/EJAA009 - ,
Learning-adjusted years of schooling (LAYS): Defining a new macro measure of education ,Econ. Educ. Rev. , Vol. 77 , , https://doi.org/10.1016/J.ECONEDUREV.2020.101971 - ,
The world bank human capital index: A guide ,World Bank Res. Obs. , Vol. 34 (1), :1-332019, https://doi.org/10.1093/wbro/lkz001 - ,
Un modelo inspirado en DEA para evaluar la eficiencia de la educación en los países de la OCDE (in Spanish, A DEA-inspired model to evaluate the efficiency of education in OECD countries) ,Rev. Metod. Cuantitativos para la Econ. y la Empres. , Vol. 31 , :329-3462021, https://doi.org/10.46661/revmetodoscuanteconempresa.4318 - ,
Data Envelopment Analysis (DEA) in the Educational Sciences ,J. Exp. Educ. , Vol. 90 (4), :10212021, https://doi.org/10.1080/00220973.2021.1906198 - ,
An international comparison of R&D efficiency: DEA approach ,Asian J. Technol. Innov. , Vol. 13 (2), , https://doi.org/10.1080/19761597.2005.9668614 - ,
The macroeconomic effects of public sector efficiency in advanced economies ,Int. Econ. , Vol. 182 (March), 2025, https://doi.org/10.1016/j.inteco.2025.100600 - ,
Measuring the efficiency of decision making units ,Eur. J. Oper. Res. , Vol. 2 (6), :429-444, https://doi.org/10.1016/0377-2217(78)90138-8 - ,
Some Models for Estimating Technical and Scale Inefficiencies in Data Envelopment Analysis ,Manage. Sci. , Vol. 30 (9), :1078-10921984, https://doi.org/10.1287/MNSC.30.9.1078 - ,
A Roadmap for Investment Promotion and Export Diversification: The Case of Jordan ,Cent. Int. Dev. Harvard Univ. , 2019, https://doi.org/10.2139/ssrn.3808860 - , Growth diagnostics, Pakistan Institute of Development Economics, 2016
- ,
Growth Diagnostics for a Resource-Rich Transition Economy: The Case of Mongolia ,World Bank Policy Res. Work. Pap. , 2007http://econ.worldbank.org - ,
School competition and efficiency in elementary schools in Mexico ,Int. J. Educ. Dev. , Vol. 46 , :23-34, https://doi.org/10.1016/J.IJEDUDEV.2015.09.015 - ,
, Policy co-ordination and growth traps in a middle-income country setting: The case of South Africa , 2014, https://doi.org/10.35188/UNU-WIDER/2014/876-6 - ,
The Middle-Income Trap and Premature Deindustrialization in South Africa ,Struct. Transform. South Africa , 237-260, https://doi.org/10.1093/OSO/9780192894311.003.0011 - ,
Bangladesh, a Middle Income Country by 2021: What Will it Take in Terms of Poverty Reduction? ,Bangladesh Dev. Stud. , Vol. XXXVII , 2014, https://doi.org/10.1596/18668