


One of the main challenges for the dissemination of renewables is the necessity of reliable and cost-effective energy storage systems [1]. New and improved energy storage technologies are required to overcome the non-dispatchability, which is the main challenge for the successful integration of large shares of renewable energy into the grid. Energy storage is proposed to tackle daily variations on the demand side, i.e., storing low-price energy during low-demand hours and utilizing it during high demand hours, when energy usually becomes more expensive [2]-[4].
For electrical energy storage, several technologies are available, with different scalability, density, and cost potentials. Most advanced energy storage technologies for wind or Photovoltaics (PV) are based on batteries. In this sense, Pan et al. present sodium ion batteries as a solution for large-scale renewable energy storage, mainly thinking in renewables [5]. Other authors introduce these large energy storage systems as a solution for the large-scale integration of wind power into the grid [6] and the possibility these systems offer for optimizing this integration [7]. High-speed mechanical flywheels are also an available technology for large scale mechanical energy storage. Bolund et al. present an overview of these systems using high speed technology [8]. Supercapacitors are presented as a new class of reversible electrochemical energy storage in [9]. This technology is based on redox reactions and are being envisaged for several applications to complement the storage batteries. Pneumatic storage [10], pumped storage [11], or energy vectors such as hydrogen [12] are well-known technologies available for large scale energy storage and their role in future generation of energy storage system is not dismissed. For thermal solar energy, different options are available or under development, depending on the application [13]. In power plants, molten salts are commonly used for thermal energy heat storage [14] being integrated with the solar system under different integration schemes [15], although steam has also been used [16], Phase Change Materials (PCM) [17]-[18] and thermochemical storage [19]-[21] are currently under development. At small scale, residential-level sensible heat storage [22] and PCM [23]-[24], are the most widespread.
A recent approach for grid-scale applications is based on Transcritical Carbon dioxide (CO2) charge and discharge cycles (TCO2) in combination with Thermal Energy Storage Systems (TESS) [25], also feasible and interesting for residential applications. This alternative has been discussed in scientific literature, where different configurations have been proposed along with calculations of efficiency and costs [26]-[28]. The potential of the TCO2-TESS concept has been demonstrated to be an economical alternative at power plant scale [29], including hybrid concepts with solar thermal storage [26], [30]. The integration of heat pumps into thermal power plants for large-scale electricity storage capacities with round-trip-efficiencies of 60% was studied in [31]. A Pumped Thermal Electricity Storage (PTES) system with thermal integration composed by a vapour-compression Heat Pump (HP) and an Organic Rankine Cycle (ORC) was proposed in [32]. The comparison between a generic PTES system and a Pumped Cryogenic Electricity Storage (PCES) system was performed in [33] revealing better overall performances of a PTES system than those of a PCES system. In [34], a Thermo-Electric Energy Storage (TEES) system for large scale applications based on CO2 cycles and ground heat storage was presented.
This paper explores the effect of introducing solar-originated high temperature heat, or other renewable-originated heat, on the performance of different configurations of TCO2-TESS cycles. An integrated electrical/thermal energy storage concept is proposed herein, to store surplus electricity from the grid or at local level, combined with local renewable-originated thermal energy. The system is originally conceived to integrate solar energy but can be extended to biomass, such integration enables electrical and thermal energy to be stored at different temperature levels and from different sources, simultaneously or sequentially. The advantage is the capacity of adapting to a variety of different sources, using electricity and thermal energy. This paper builds upon these concepts and analyses, extending the concept to a mixed thermoelectric/thermal energy storage system, taking advantage of the different temperature ranges of both systems.
The proposed system can be integrated within solar thermal power plants that could be converted to electrical system regulation plants, but also in small size systems at residential or district level for integrating different distributed generation technologies. The effect of different layouts and thermal energy integration is discussed in this paper. A base cycle with 8-hour discharge time is defined and the effect of different modifications as TEES and solar TEES are studied. Details of the models, parametric analyses -including solar technology alternatives-, and results from simulations are discussed. Round-trip efficiencies for the base case, without solar support and a pressure ratio of 9.4, are 52% for the cycle without solar input, and above 60% with solar support to increase turbine inlet temperature. Estimated Levelized Cost of Electricity (LCOE) values are in the range of those obtained for Pumped Hydro (PH) and Compressed Air Energy Storage (CAES), 90-140 USD/MWh [35], [36]. The global analysis shows the interest of advancing in the study and definition of this technology, probably integrated with solar power plants for exploiting synergies. The structure of the paper is the following. First, TEES concept is presented. Then, the different layouts under analysis are introduced and the parameters for performance evaluation and model assumptions are defined. Following, the results obtained from the numerical analysis are presented, without and with renewable resource support. Finally, a preliminary economic analysis is presented to identify LCOE range for the analysed integrations.
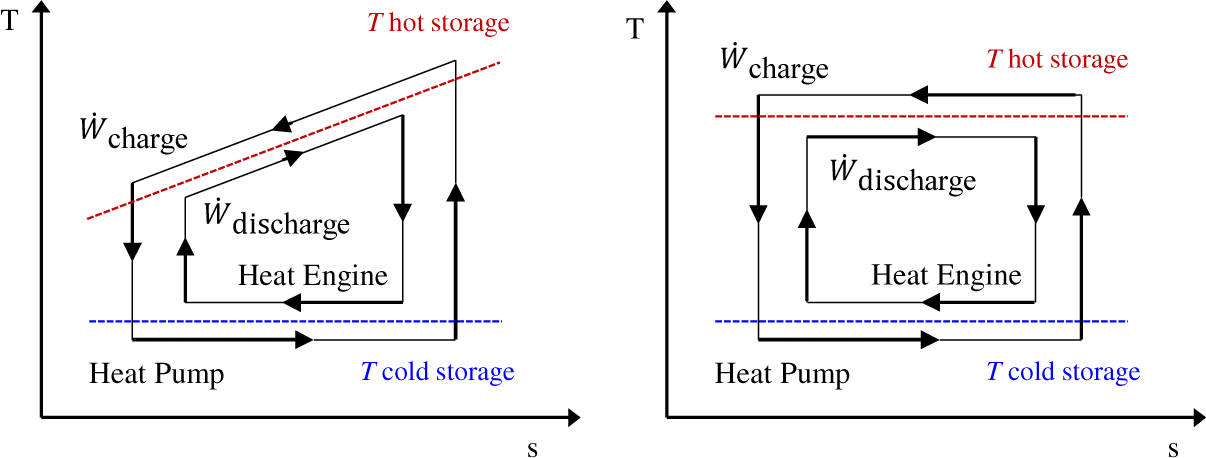
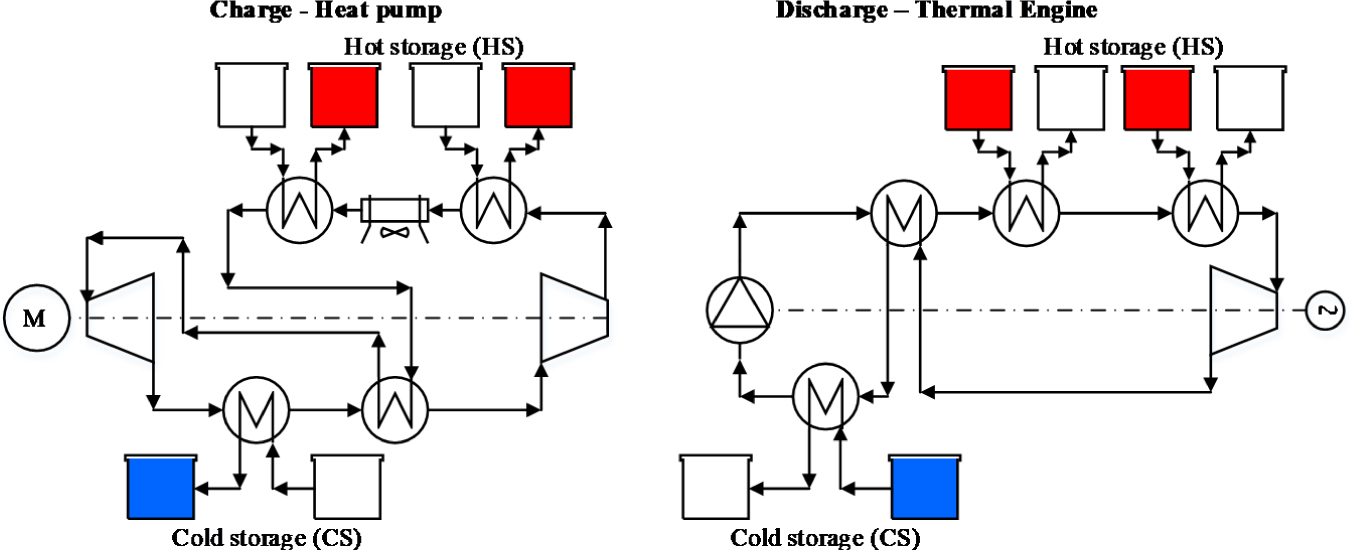
TEES is based on the dual operation of a heat pump (charge cycle)/thermal engine (discharge cycle) in the global system. During the charge cycle, a HP converts electricity to heat, which is stored, usually as sensible heat. In the discharge period, this heat is used in a thermal engine, where energy is partially recovered. This electricity storage concept was patented by Cahn [37], and has been widely studied recently [26], [27], [38]. Figure 1 presents the concept for heat exchange at variable and constant temperatures. These T-s diagrams have been selected to show the relevance of adequate integration profiles for the charge/discharge processes [38]. An adequate heat exchange evolution design in both charge and discharge processes, with quasi-parallel evolution of temperature profiles between evolving streams, enables optimization of the energy storage process, maximizing its efficiency. This criterion restricts layout design and the selection of working fluids.
TCO2-TESS concept with well integrated temperature profiles
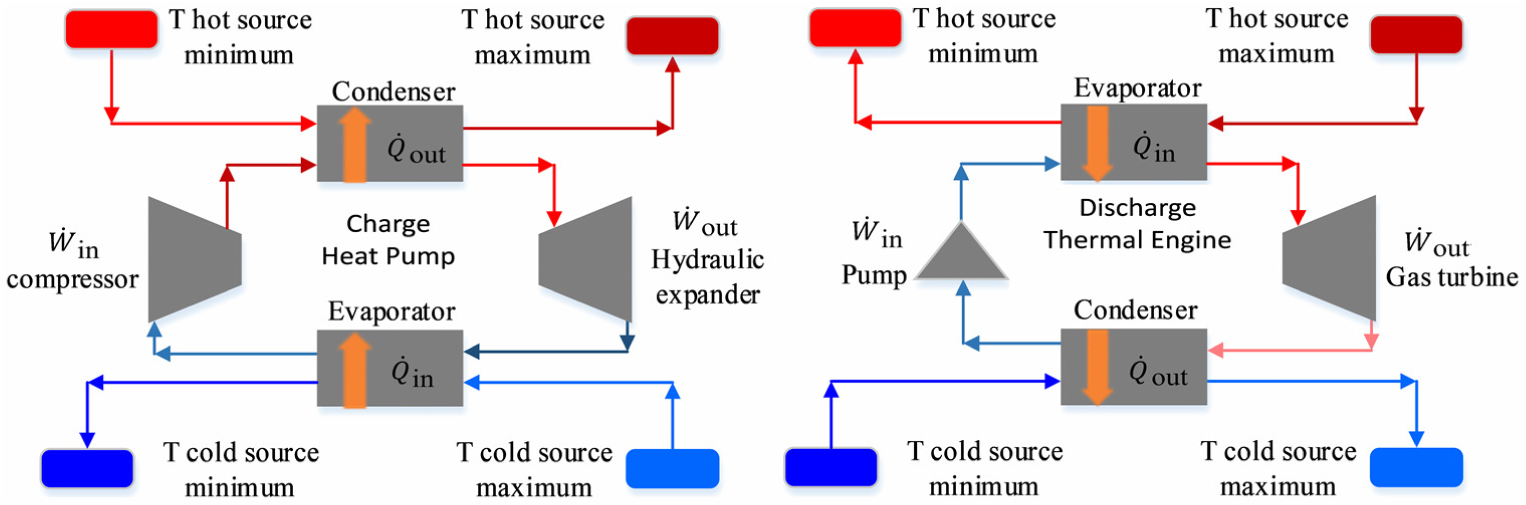
The basic arrangement consists on a thermodynamic cycle that can operate in two modes, charge/discharge, as shown in Figure 2. During the charge cycle, energy is removed from a medium (cold source) and transferred to a medium at a higher temperature (hot source). This is possible by adding energy through a heat pump that consumes electricity. During the discharge cycle, the system operates in the opposite direction, with a different plant layout: energy is removed from the hot source and transferred to the cold source, while producing mechanical energy in a thermal engine.
TCO2-TESS charge/discharge processes
Charge and discharge cycles can use different working fluids, but CO2 is adequate for heat and work exchange processes in the temperature range of this application. CO2 is stable throughout the entire temperature range. CO2 can easily reach its supercritical state (7.38 bar and 31.1 °C) which allows a better temperature profile match to the temperature of the heat source than fluids with an isothermal subcritical evaporation [39]. The CO2 transcritical power cycle allows that thermal integration between cycles and the storage occurs at small temperature difference due to the relatively constant CO2 heat capacity. This way, the compressor outlet temperature can be increased and a greater part of the heat of condensation can be stored at high temperature [27].
Considering the layout proposed in Morandin et al. [27] as a reference, the charge cycle consists of:
CO2 compression beyond critical point, from a low-pressure level (> 40 bar) and sub-ambient temperatures, to high pressure (> 120 bar) and moderate temperature (120 °C);
Heat rejection to hot source;
Flash or controlled (turbo) expansion to the low-pressure level in the two-phase region;
Heat absorption from the cold source, until a specific superheated level is reached.
Energy can be transferred until either the cold source has been depleted or the hot source is completely full. The discharge cycle follows:
Fluid compression from low temperature-low pressure liquid state to a high-pressure level;
Heat addition from the hot source;
Fluid expansion in a thermal turbine, obtaining mechanical work;
De-superheating and condensation with heat rejection to the cold source.
This section presents the layouts analysed herein as well as the definition of the global parameters used in the evaluation of performance. The main assumptions are also described. As aforementioned, the layout proposed in Morandin et al. [27] was taken as a reference, and modifications are added to improve the profiles and performances of charge-discharge cycles.
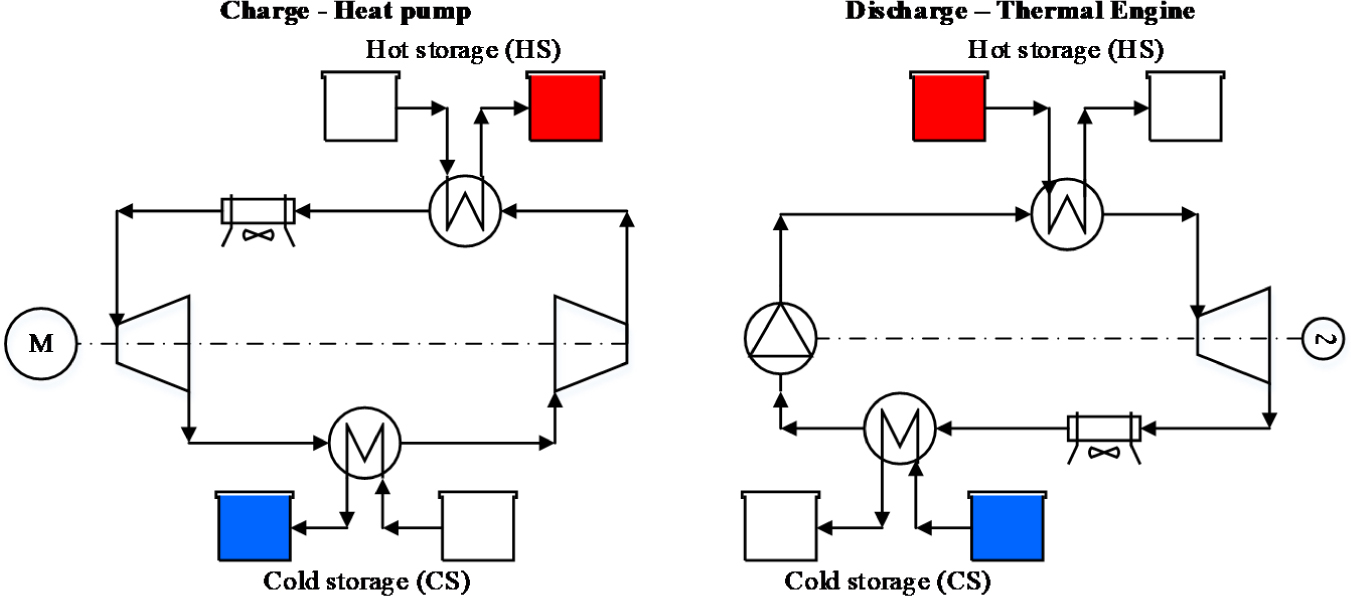
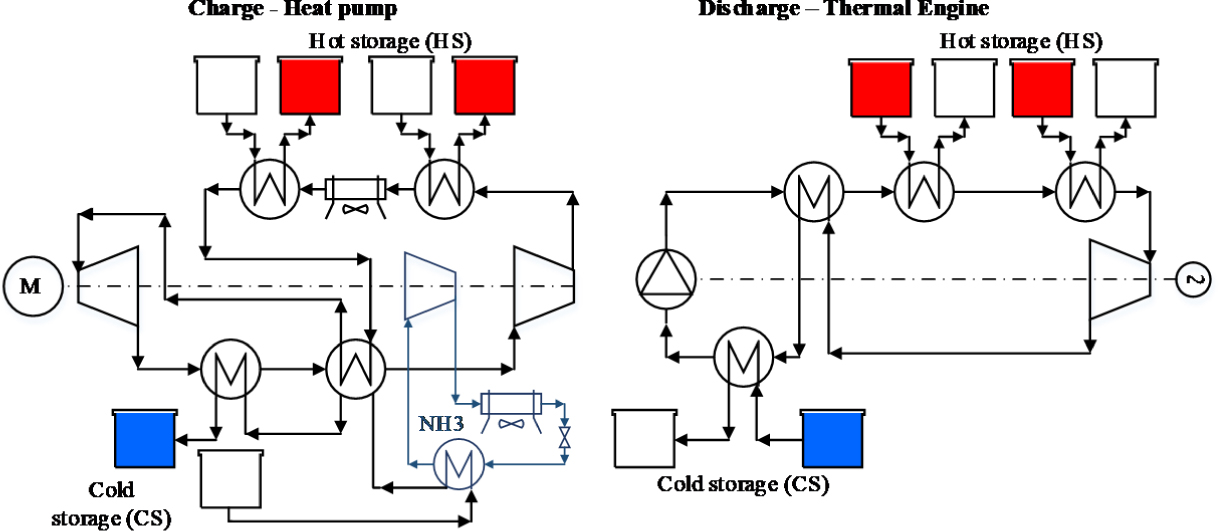
Different cycle configurations are analysed herein. The reference cycle is shown in Figure 3 and presented as Layout A. This cycle consists on the combination of a simple HP charge cycle and a simple Thermal Engine (TE) discharge cycle, where two tanks are used on both hot and cold sides. Derived layouts include modifications aimed at decreasing irreversibilities in the charge/discharge processes, decreasing temperature differences between heat exchange streams, and increasing efficiency of the energy storage system. Layout B (Figure 4) includes a sequential expansion and a recuperative layout in the discharge stage. Layout C (Figure 5) includes reheating and heat storage at different temperature levels and Layout D (Figure 6) adds heat storage at two different temperature levels and an ammonia cycle to improve the charge cycle performance. The ammonia cycle would improve the low temperature operation although additional safety and management measures would be required.
TCO2-TESS Layout A (reference layout)
TCO2-TESS Layout B (reference layout with recuperative cycle during discharge)
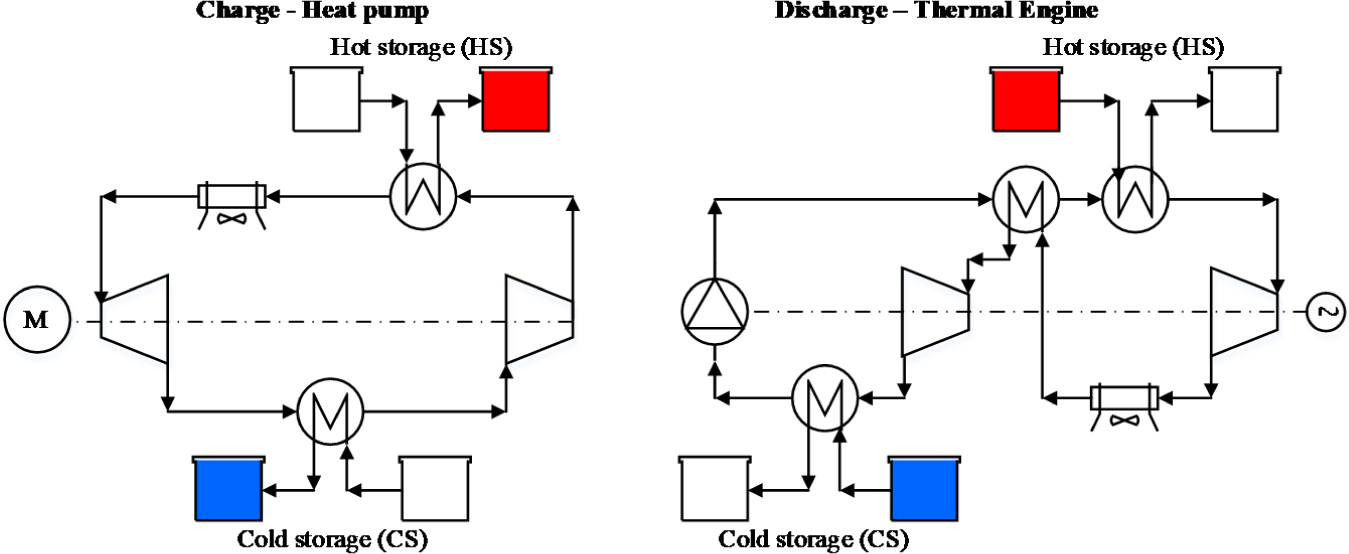
TCO2-TESS Layout C (reference layout with reheating and heat storage at different temperatures)
TCO2-TESS Layout D [reference layout with Ammonia (NH3) cycle in the charge cycle and heat storage at different temperatures]
These TEES integrations are studied in detail in section 4.1, in section 4.2, these layouts are extended to accommodate renewable-originated heat (from solar or biomass). This integration, TEES-thermal storage, combines the heat produced in a HP (from electricity) with heat produced by local thermal sources. Therefore a single thermal energy storage system is able to store energy from different sources: electricity (wind, PV) and local thermal renewable resources (solar, geothermal, biomass). Within this context, Figure 7 presents two potential integrations for Layout A: during the charge or discharge processes. Although not graphically represented, the same integration is applied to the remaining layouts.
TCO2-TESS reference layout with solar resource support during the charge cycle (top) and during the discharge cycle (bottom)
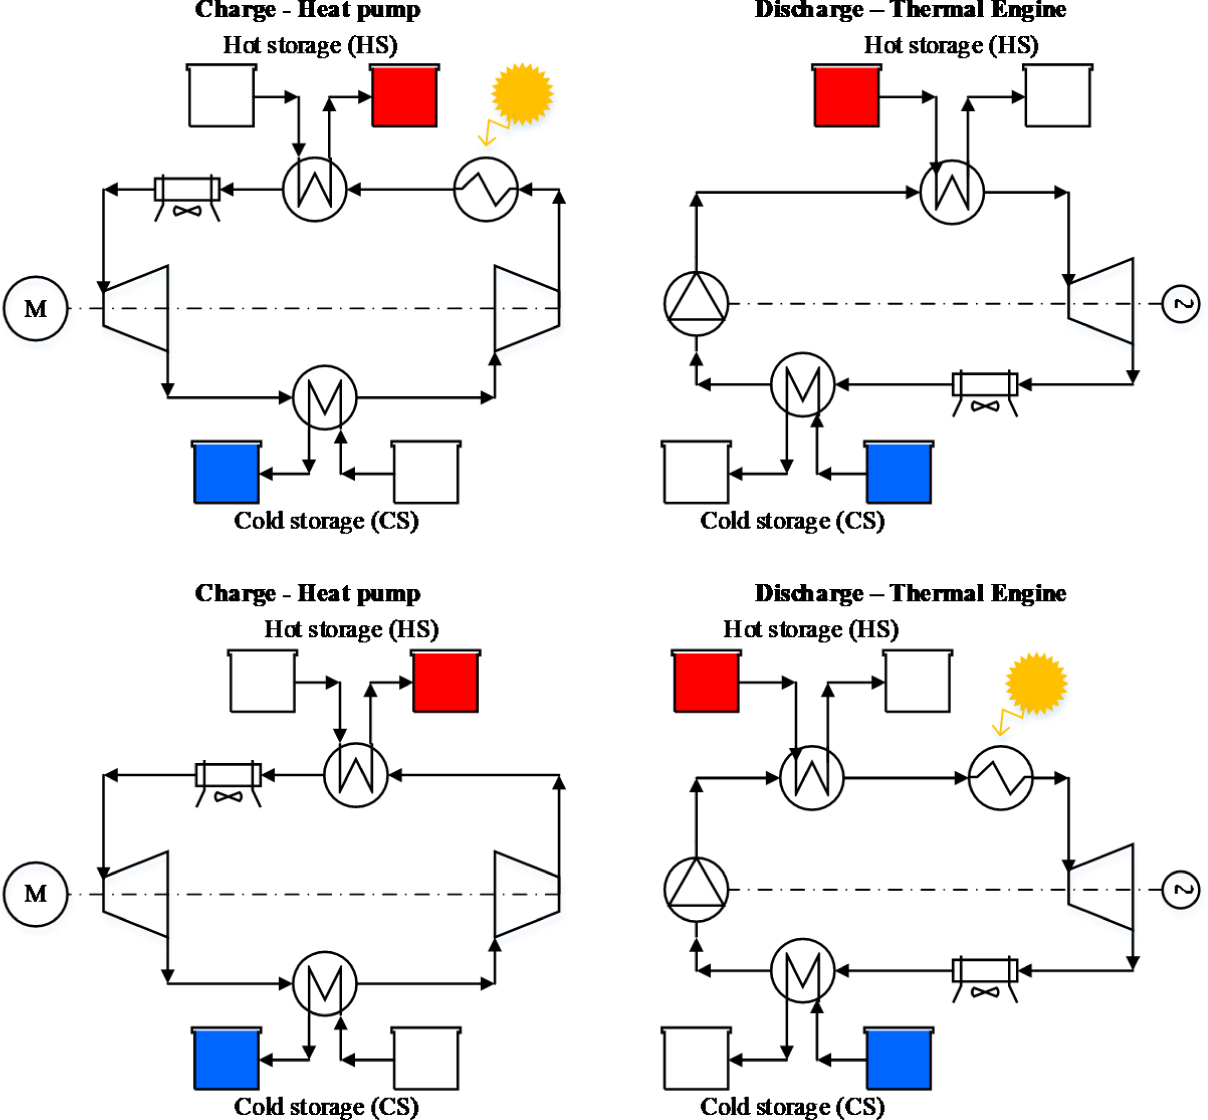
These integrations can be considered independently or as different strategies to be applied depending on the availability of resources.
For evaluation of the performance of these cycles the following parameters have been used.
Round trip efficiency (ηRT) evaluates the ratio between power generated in the thermal engine
where τD is the discharge time, τC is the charge time, ηTΕ is the thermal engine efficiency,
The round trip efficiency is the most relevant parameter for TEES cycles without additional heat. Some of its importance is lost when applied to TEES systems combined with direct thermal heat storage, and then other parameters (discharge cycle efficiency, heat pump coefficient of performance, and round trip efficiency neglecting heat storage losses) must be taken into account.
Discharge cycle efficiency is evaluated by the thermal engine efficiency (ηTE):
Heat pump coefficient of performance (COPHP):
Round trip efficiency neglecting heat storage losses (ηRT):
For base Layout D, with the addition of a NH3 cycle, the charge/discharge round trip efficiency (ηRT) is defined considering the additional energy consumption for the NH3 cycle
When additional thermal heat is added, additional relevant information is given by mechanical efficiency (ηmech) defined as:
And from the exergy efficiency (ηex) defined as:
where the heat exergy is given by:
where the performance of the cooling and heating system is given by:
where
The aforementioned layouts were implemented in the Engineering Equation Solver (EES), using lumped models based on the implementation of continuity and energy equations for each subsystem and completed with heat transfer models. Reference for the model structure was based on [15]. Assumptions on the cycle parameters and corresponding variation range were taken from [27], [38], presented in Table 1 and Table 2, respectively. These values are extrapolated from commercial axial turbines. For application of this concept, specific equipment for working with transcritical CO2 should be developed.
Main assumptions of the cycle
Minimum temperature difference |
ΔΤmin = 4 °C |
Turbine isentropic efficiency (TE) |
ηRT = 0.88 |
Pump isentropic efficiency (TE) |
ηB = 0.85 |
Isentropic efficiency of hydraulic turbine (HP) |
ηTH = 0.85 |
Compressor isentropic efficiency (HP) |
ηC = 0.86 |
NH3 compressor efficiency (3 stages with intercooling) |
Variation range of variables
Upper and lower limits |
||
|---|---|---|
HP low pressure (p1) |
[bar] |
[17:33] |
HP high pressure (p3) |
[bar] |
[100:200] |
Condenser outlet temperature (T3) |
[K] |
[274:300] |
TE low pressure (p8) |
[bar] |
[20:37] |
TE high pressure (p7) |
[K] |
[100:200] |
Evaporator outlet temperature TE (T7) |
[bar] |
[373:450] |
NH3 cycle low pressure |
[bar] |
[1.5:3] |
NH3 cycle high pressure |
[bar] |
[12:15] |
This section presents the main results from the simulation of the different layouts. Firstly, analyses of the layouts without renewable resource support are presented for identification of correct integration and main characteristics of the thermo-electrical energy storage with electrical power input as single source. Secondly, analyses are extended to the integration of additional renewable thermal sources, analysing the effect of combined electrical power/thermal sources. These analyses consider solar thermal energy as the renewable source, however, these results can be extended to include biomass waste heat.
Figure 8 shows T-s diagrams with the most appropriate value of pressure after simulations [27] obtained for each integration. The HP charge cycle is represented in red, and the discharge cycle with thermal engine is shown in blue. Reference Layout A is presented at the top, followed by Layout B, with reheating before compressor and recuperative layout at expansion, Layout C with heat storage at two temperature levels, and at the bottom, Layout D is shown, considering an ammonia cycle.
T-s diagrams - Layout A: reference layout (a); Layout B: recuperative cycle in discharge (b); Layout C: partial expansion (c); Layout D: with ammonia cycle NH3 (d); HP (red), TE (blue), NH3 (green)
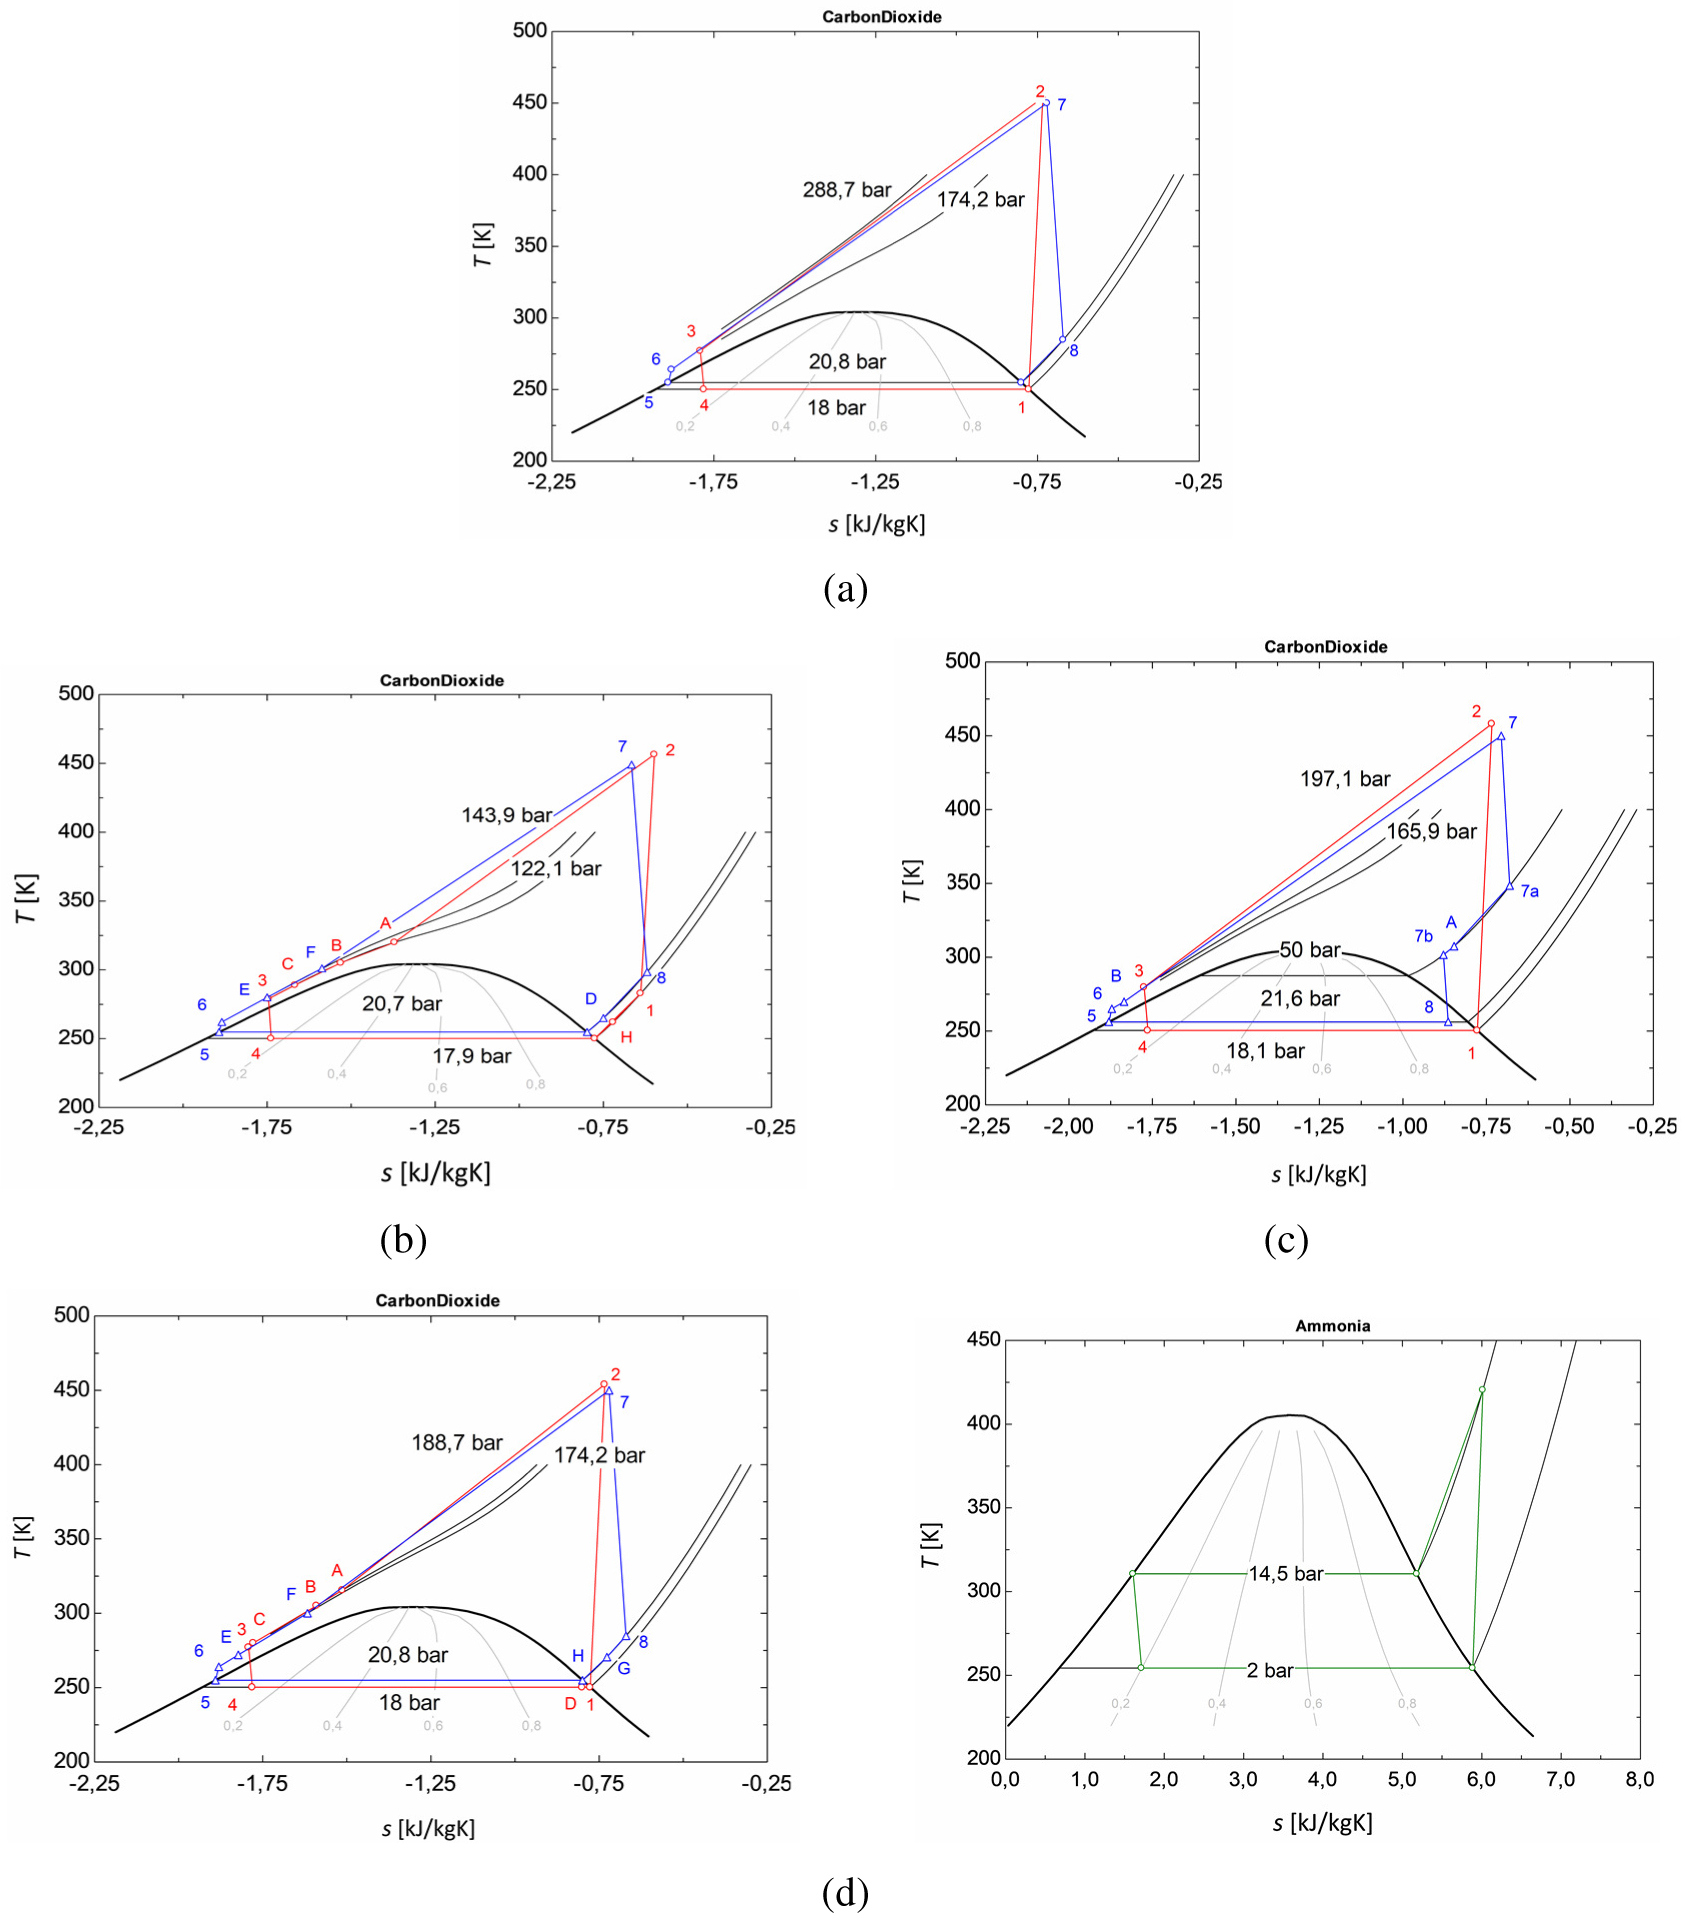
The global results obtained for these most appropriate values of parameters are presented in Table 3. The results for extensive magnitudes are expressed in terms of 1 kg CO2 circulating in the cycle, making the analysis non-dependent of global system size at this conceptual preliminary stage.
Analysis of Table 3 reveals how round-trip efficiency increased by 3% with the addition of the NH3 cycle compared to the reference layout. This is due to the smaller charge/discharge ratio, even though the addition of a NH3 cycle (as the small ratio between CO2 and NH3 masses) results in a smaller increase in the total consumption that is not compensated by the additional power obtained with the extra expansion. Layout D has no surplus energy due to the additional adjustment between NH3 mass flow and charging hours. With additional heat exchangers and heat storage at two temperature levels on the hot side, the energy at the condenser is affected because only a fraction of the condensed energy of the HP is stored (COP of the heat pump decreases). In an opposite direction, the thermal engine efficiency is increased due to waste heat recuperation from turbine exhaust, thus reducing the contribution from storage. In Layout A, a relatively simple layout, the charging hours must be increased by 9.3% to achieve sufficient energy on the cold side and surplus energy on the hot side. For Layout A, global round trip efficiency ηRT is 56.47%. Layout D presents better energy integration, without surplus energy on the hot side, with a higher round trip efficiency, 59.6%. Layout D presents a more complex integration, which would probably not be considered in smaller plants or residential applications. Compared with Layout D, Layout C presents good energy integration with relatively low energy surplus on the hot side (0.9%) and the best round trip efficiency within the analysed layouts, 61.37%. Layout B, recuperative cycle with double expansion, presented higher complexity, and its best solution yielded a relatively lower round trip efficiency (ηRT = 57.96%) than Layout C, with 0.1% surplus energy.
Best values of parameters for TEES without renewable resources
Layout A |
Layout B |
Layout C |
Layout D |
||
|---|---|---|---|---|---|
Heat [kW/kg CO2] |
373.3 |
370.8 |
324.4 |
343.4 |
|
398.9 |
390.5 |
376.8 |
383.1 |
||
251.5 |
247.1 |
254.8 |
1,306 |
||
313.2 |
260.4 |
291.4 |
297.4 |
||
Electric power consumed/generated [kW/kg CO2] |
137.6 |
140.6 |
130.6 |
137.6 |
|
15.72 |
16.8 |
11.07 |
15.72 |
||
17.39 |
16.46 |
13.99 |
17.39 |
||
103.1 |
92.08 |
99.39 |
103.1 + 349.9 |
||
Charge/discharge hours ratio [-] |
hCS;A |
1.068 |
1.053 |
1.164 |
1.116 |
hHS;A |
1.245 |
1.054 |
1.144 |
1.115 |
|
Charge/discharge energy ratio [-] |
Eexcess;A |
1.093 |
1.001 |
1.009 |
1 |
Efficiency |
COP HP;A [-] |
3.064 |
2.996 |
2.713 |
2.818 |
ηTE;A [%] |
21.48 |
19.36 |
22.37 |
22.37 |
|
ηRT;A [%] |
56.47 |
57.96 |
61.37 |
59.6 |
|
This section extends analyses for the integration of a renewable heat source, combining simultaneous energy storage from electrical and thermal sources. A single storage system is able to store power and heat. This storage concept can be applied to different power ranges, from residential applications to power plants, for surplus solar thermal heat and electricity (i.e., excess nocturnal wind production in some periods). The effect of the additional heat on the previous cases increases the discharging capacity and also the charge/discharge time ratio. Figure 9 presents the T-s diagrams for Layout A (single expansion with solar energy) and Layout C (sequential expansion with solar energy).
T-s diagrams for Layout A, single expansion with solar (left), and Layout C, sequential expansion with solar (right)
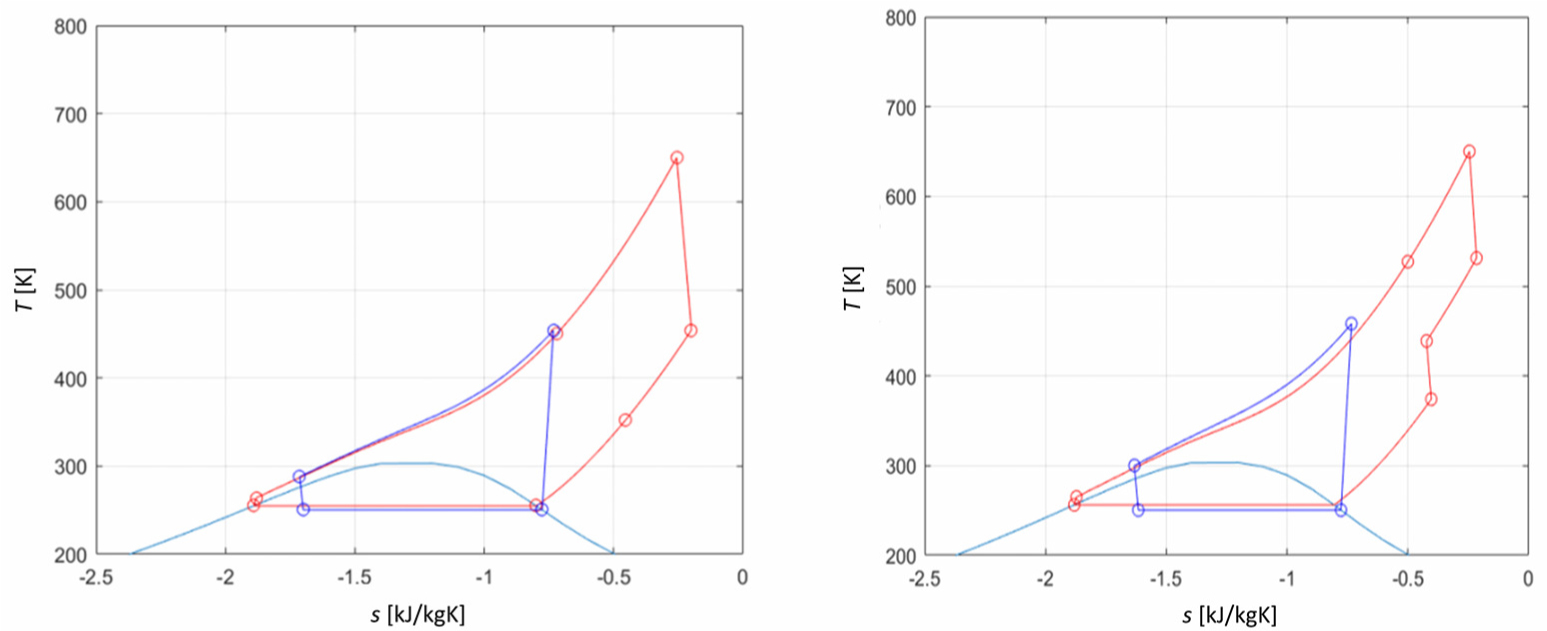
The temperature range for solar applications considered herein is 200-800 °C, and analyses carried out for Turbine Inlet Temperatures (TIT) between 450 K and 1,000 K (without and with solar contribution, respectively). Figure 10a presents Turbine Exhaust Temperatures (TET) and power as a function of TIT, for a fixed expansion ratio in Layout A. An increase in the expansion ratio is required to avoid excessively high temperatures at the condenser, increasing the required stored energy and charging time Figure 10b.
Effect of TIT during the discharge cycle [work and exhaust temperatures (left) and surplus energy and charging hours (right)]
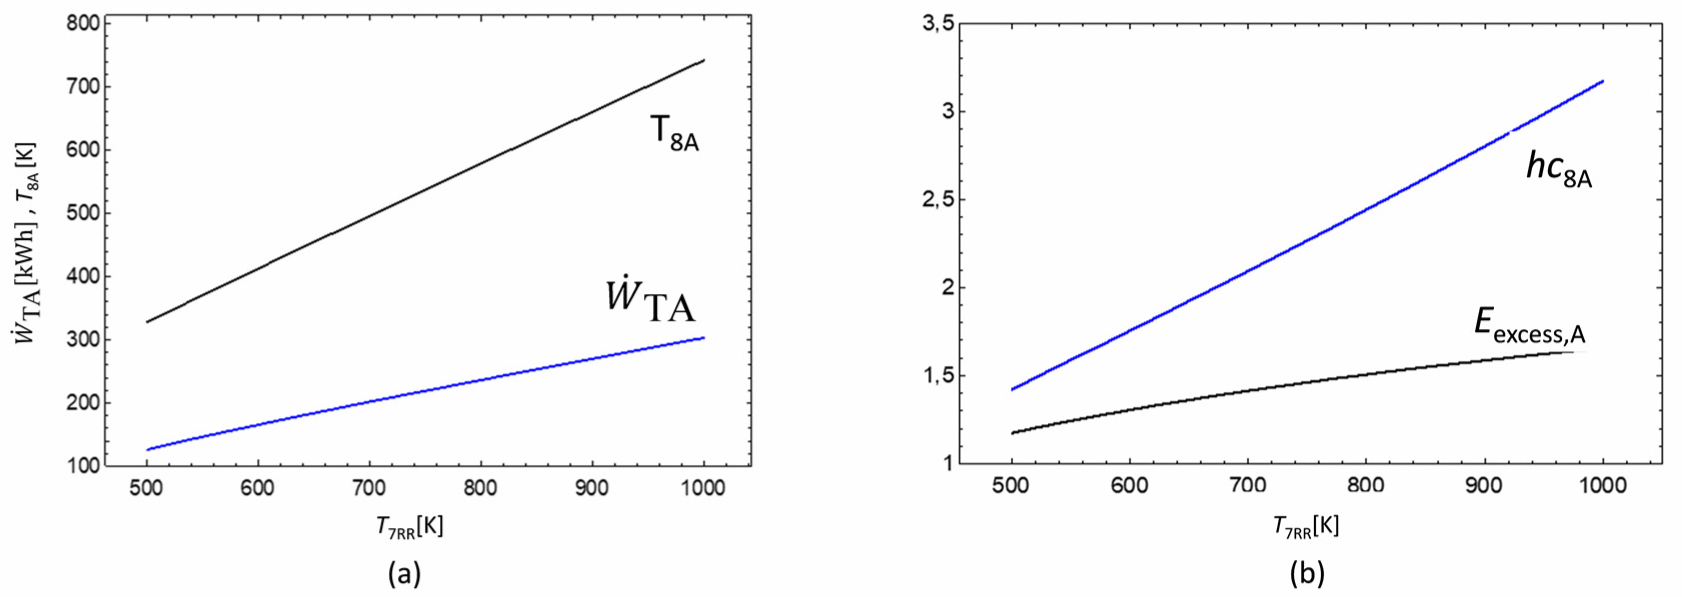
The charge/discharge ratio affects the remaining variables of the cycle. When only the low pressure varies, low pressure during charge must also vary to maintain reasonable differences between evaporation during charge and condensation during discharge. In this case, the energy stored depends only on charging time, which is directly proportional to the turbine outlet temperature, as more time will be spent to evacuate heat in the condenser of the thermal engine.
The following figures show the effect of pressure variation in the cycles with renewable resource support, distinguishing between integration during charge and during discharge. Two adjustments were considered: modification of the discharge cycle only, maintaining the charge cycle parameters obtained from previous analyses, and modification of both charge/discharge cycles, maintaining the best value of ratios obtained previously.
Due to mechanical constraints, the maximum pressure was limited to 300 bar, the maximum expansion ratio was limited to 15, resulting in a cold focus temperature of 10 °C. This temperature is suitable for cool storage, even in hot climates with high solar resource availability.
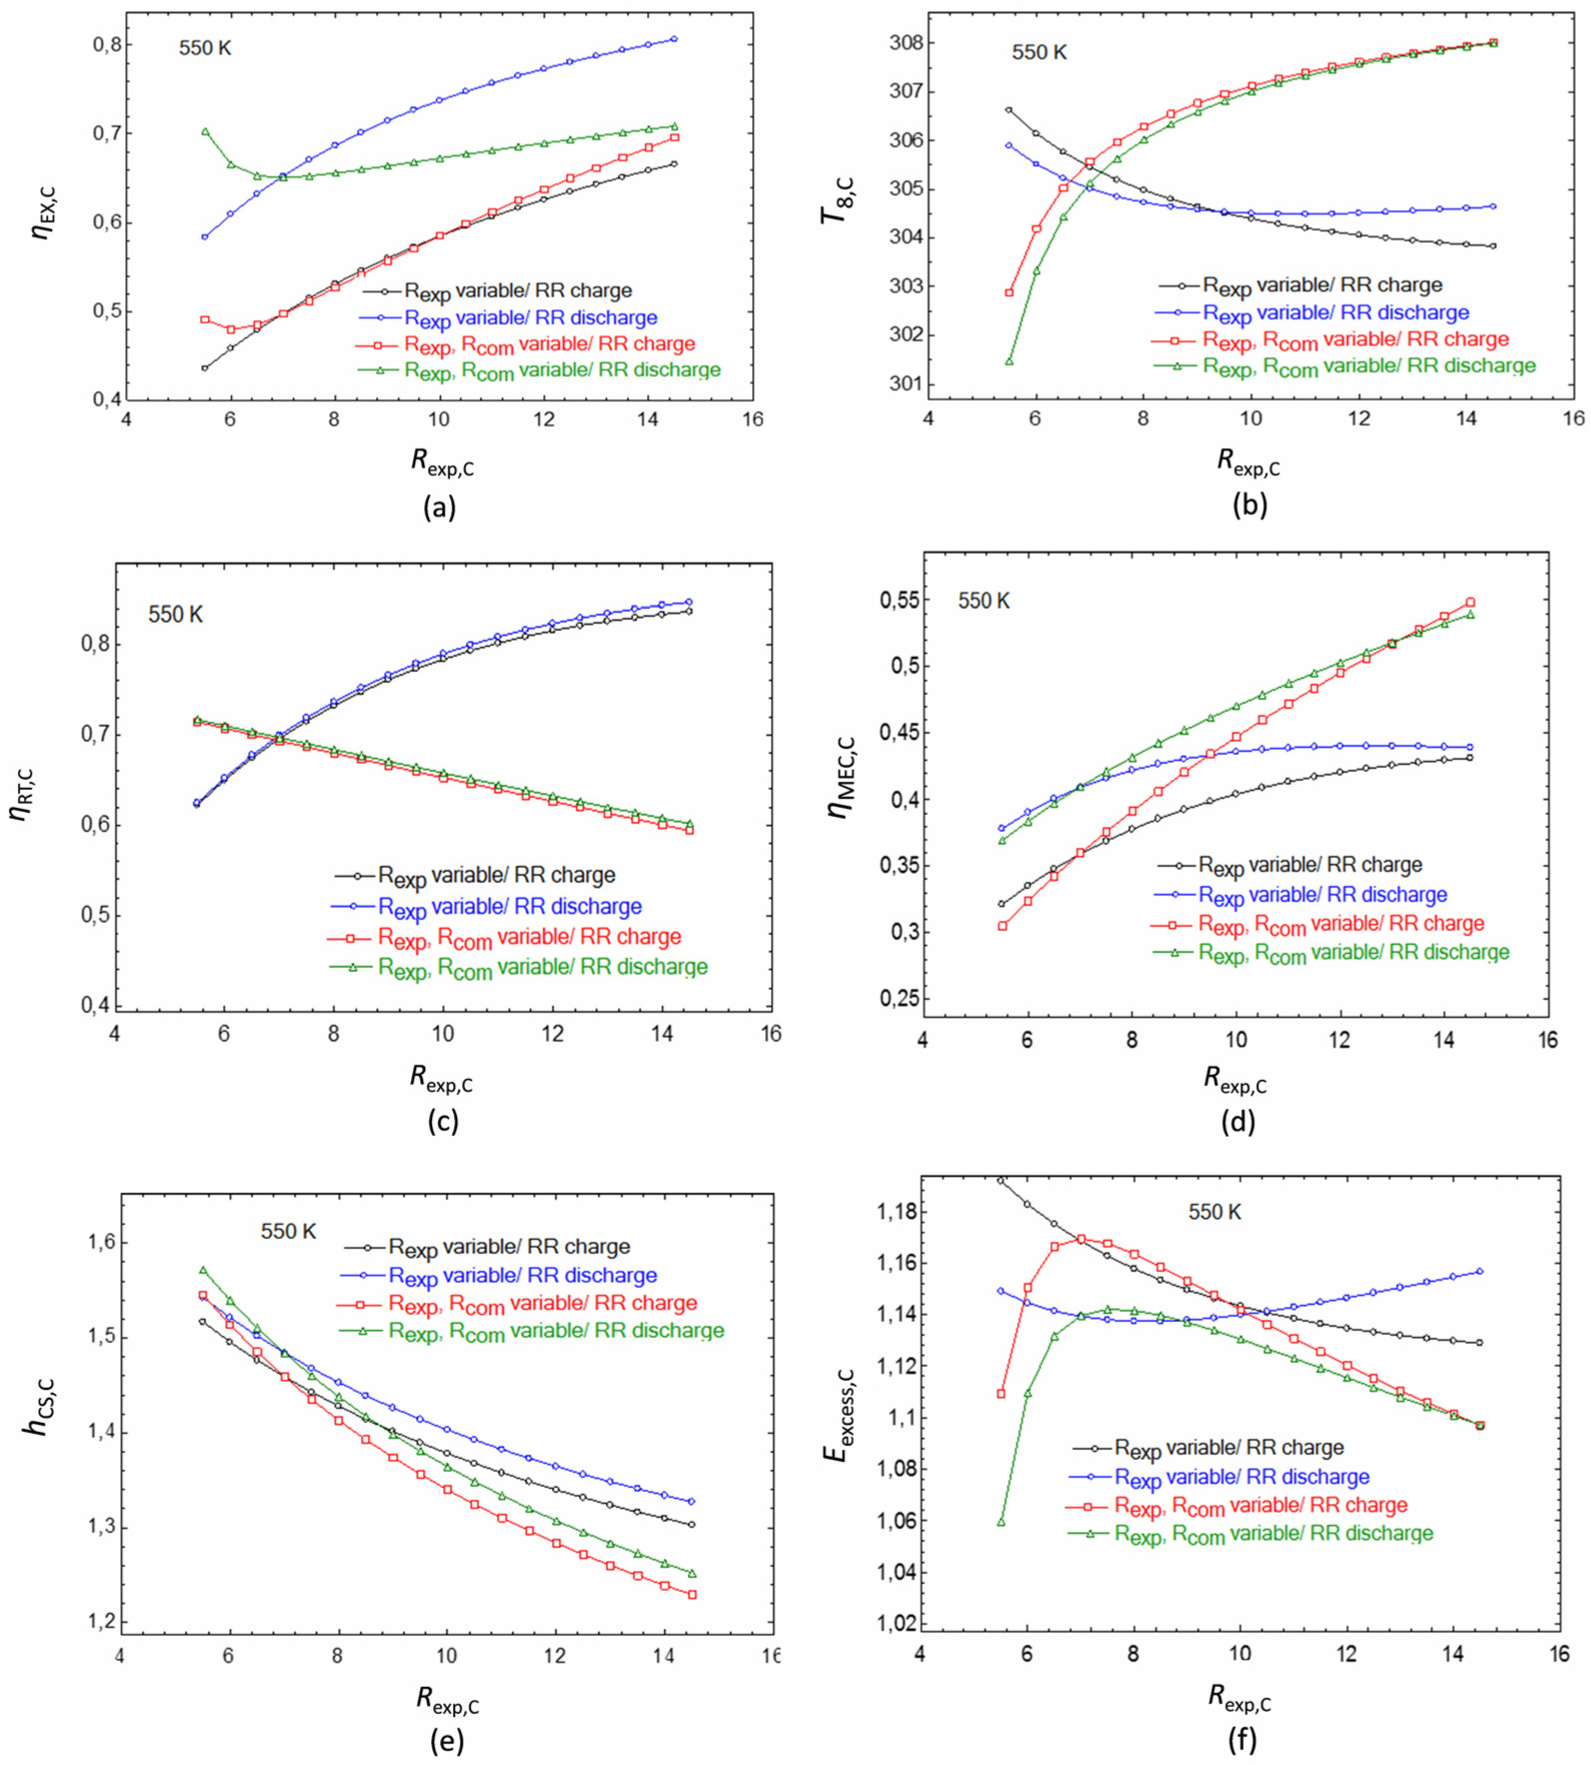
Figure 11 shows the effect of modifying the discharge expansion ratio on the system performance, under these assumptions of Layout A. The analysis includes Renewable Resources (RR) during charge and discharge cycles, and two options for charge/discharge cycles: modification of discharge cycle (Rexp) only, and modification of discharge cycle (Rexp) according to the pressure ratio during the charge cycle (Rcom). It is suggested to improve the evolution of charge/discharge temperature profiles.
Layout A - TIT 550 K: exergy efficiency (a); mechanical efficiency (b); round trip efficiency (c); surplus energy (d) as a function of expansion ratio
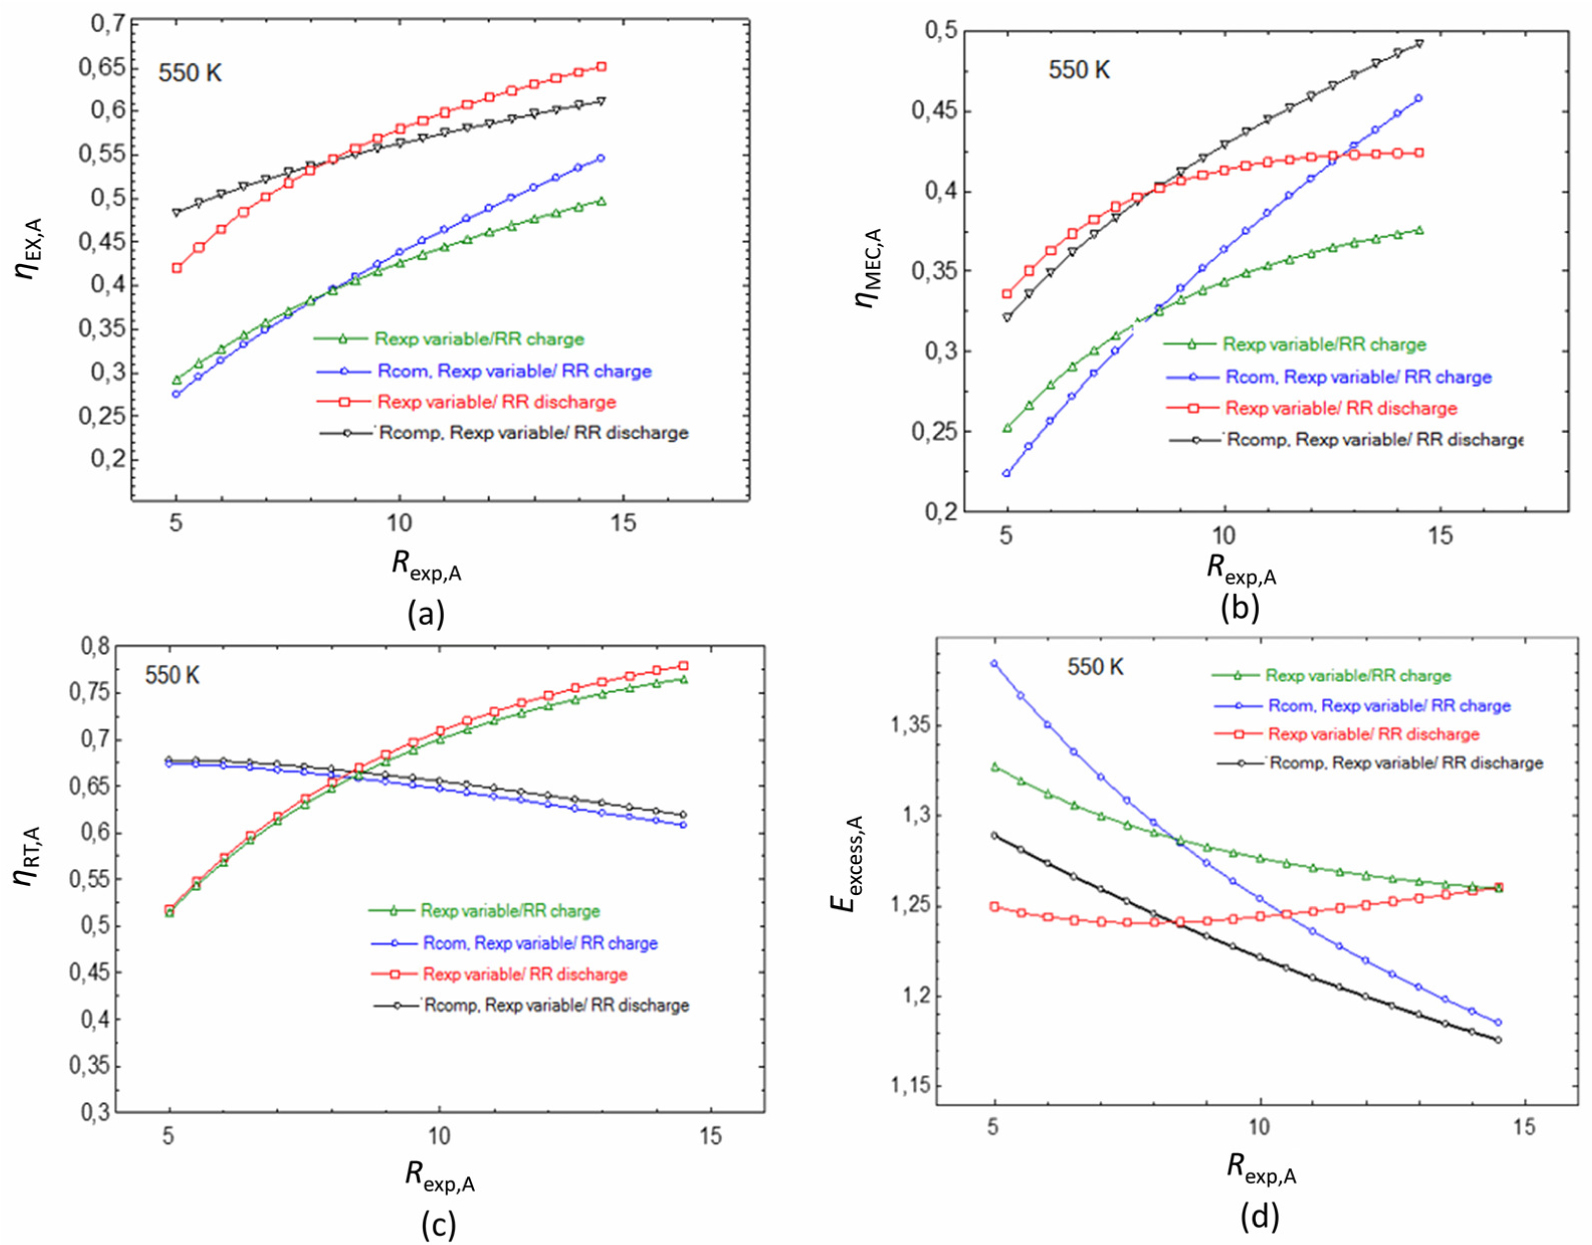
From Figure 11 it can be observed that when renewable resource is applied during the charge cycle, exergy efficiency is clearly increased. A higher increase in turbine power is obtained than with the useful heat obtained from variation of pressure ratios during charge and discharge. However, if renewable heat is applied to the discharge cycle, better global parameter values are obtained when only the discharge process is modified. With variable pressure ratios, higher mechanical efficiencies can be reached. When varying pressure and expansion ratios during charge/discharge, energy consumption is increased during the charge cycle. However, the increase in the compressor outlet temperature causes a greater reduction in thermal energy demand than the increase in energy consumption during the charge cycle. Regarding constant temperature, supply of thermal energy is increased. The effect of expansion ratio on surplus energy can be verified in Figure 11d. Round trip efficiency, which only evaluates electrical power, is reduced by the charge/discharge adjustment with variable expansion and pressure ratios. However, the round trip efficiency increases if the charge cycle is not modified.
Table 4 presents the main parameters for the best operation performance at 550 K and 950 K.
Layout A - best obtained results with renewable resource (TIT 550 K and 950 K)
Renewable resource during charge |
||||||||
|---|---|---|---|---|---|---|---|---|
Modified parameter |
TFC;A |
Rexp Opt. |
Rcom |
ηex;A |
ηmech;A |
ηRT;A |
Eexcess;A |
hCS;A |
P7 |
550 K |
14.5 |
10.48 |
0.4977 |
0.3757 |
0.7651 |
1.26 |
1.379 |
P7 and P2 |
14.5 |
18.15 |
0.5463 |
0.4575 |
0.6081 |
1.185 |
1.326 |
|
P7 |
950 K |
14.5 |
10.48 |
0.1847 |
0.1552 |
0.9449 |
2.014 |
2.693 |
P7 and P2 |
14.5 |
18.15 |
0.1931 |
0.1648 |
0.751 |
1.944 |
2.589 |
|
Renewable resource during discharge |
||||||||
Modified parameter |
TFC;A |
Rexp Opt. |
Rcom |
ηex;A |
ηmech;A |
ηRT;A |
Eexcess;A |
hCS;A |
P7 |
550 K |
14.5 |
10.48 |
0.6521 |
0.4238 |
0.779 |
1.26 |
1.413 |
P7 and P2 |
14.5 |
18.15 |
0.6118 |
0.4918 |
0.6192 |
1.176 |
1.358 |
|
P7 |
950 K |
14.5 |
10.48 |
0.4251 |
0.3181 |
0.954 |
1.653 |
2.729 |
P7 and P2 |
14.5 |
18.15 |
0.4001 |
0.3189 |
0.7514 |
1.6 |
2.623 |
|
With additional thermal energy, although the importance of the round trip efficiency is decreased, values as high as 0.94 are obtained. This evidences how modifications in charge/discharge cycles maximize the remaining parameters. When the heat source is applied to the discharge cycle, the adjustment of both cycles penalizes exergy efficiency but increases mechanical efficiency, meanwhile surplus energy and charging time are reduced. Figure 12 presents analyses for Layout D, with additional heat supply.
Layout D - TIT 550 K: exergy efficiency (a); temperature in B (b); round trip efficiency (c); mechanical efficiency (d); charging time (e); heat pump power consumption (f) as a function of expansion ratio
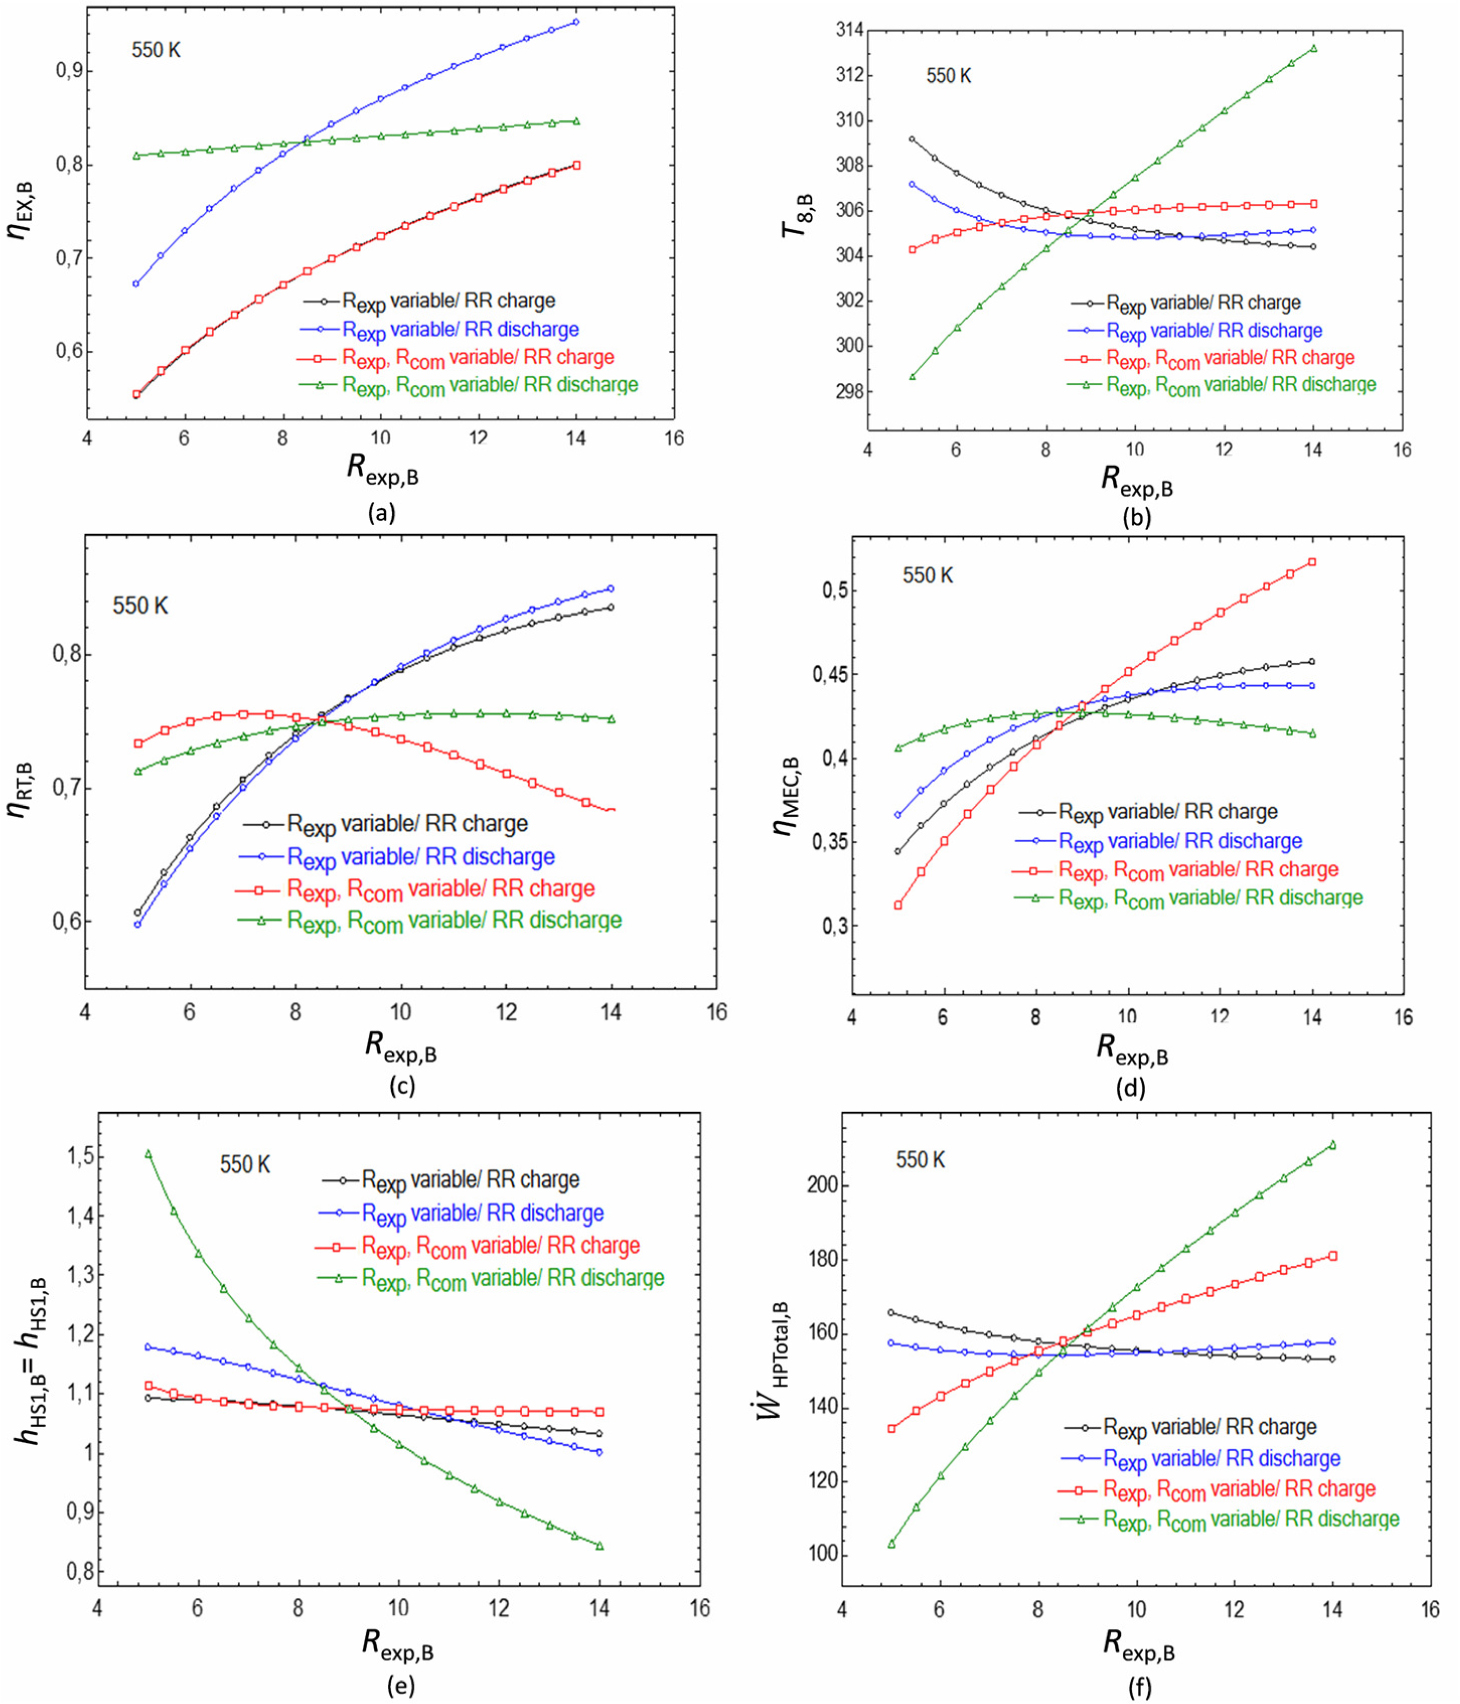
As in the previous case, exergy efficiency increases along with the expansion ratio, because of a higher increase in the expansion work. Air fan systems control temperature in B, evacuating excess heat. Figure 12b presents the effects of regulating temperature in B. The charge/discharge time ratio is set by the hot side constraints, as in the cold side the ammonia cycle compensates any energy unbalance. Variations can be analysed as a function of energy charge and charging time, a combination required by the CO2 and NH3 cycles. Energy charge increases with pressure ratio, more pronouncedly with RR during the charge cycle (increased NH3 mass flow). When the heat source is applied to the discharge CO2 cycle, consumption increases more in comparison with consumption decrease in the NH3 cycle. When only the discharge cycle is modified, energy consumption depends on the charging time. This is directly reflected on the round trip efficiency, as shown by Figure 12c, which increases along with the expansion ratio for a fixed charge cycle. When varying charge and discharge with RR during charge, initially the round trip efficiency increases but then decreases. With RR during discharge, the increase in consumption is compensated by the reduced charging time. In the other cases, total consumption is almost constant and the output energy during discharge is increased. The charge/discharge time ratio is almost constant. This cycle has zero energy excess because of the adjustment between the charge cycles. Table 5 presents main global parameters for best operation performance at 550 K and 950 K.
Layout D - best values of parameters with RR, for TIT 550 K and 950 K
Renewable resource during charge |
|||||||||
|---|---|---|---|---|---|---|---|---|---|
Modified parameter |
TFC;B |
Rexp Opt. |
Rcom |
ηex;B |
ηmech;B |
ηRT;B |
Eexcess;B |
hHS;B |
|
P7 |
550 K |
14.5 |
10.49 |
0.8085 |
0.4591 |
0.8377 |
1 |
1.029 |
0.08912 |
P7 and P2 |
14.5 |
18.15 |
0.8072 |
0.5241 |
0.6745 |
1 |
1.096 |
0.06703 |
|
P7 |
950 K |
14.5 |
10.49 |
0.5278 |
0.3447 |
1.172 |
1 |
1.033 |
0.3897 |
P7 and P2 |
14.5 |
18.15 |
0.5294 |
0.3537 |
1.037 |
1 |
1.027 |
0.3833 |
|
Renewable resource during discharge |
|||||||||
Modified parameter |
TFC;B |
Rexp Opt. |
Rcom |
ηex;B |
ηmech;B |
ηRT;B |
Eexcess;B |
hCS;B |
|
P7 |
550 K |
14.5 |
10.49 |
0.9613 |
0.4427 |
0.8534 |
1 |
0.993 |
0.1038 |
P7 and P2 |
14.5 |
18.15 |
0.8495 |
0.4134 |
0.7588 |
1 |
0.8278 |
0.1607 |
|
P7 |
950 K |
14.5 |
10.49 |
0.6193 |
0.3404 |
1.18 |
1 |
0.993 |
0.4118 |
P7 and P2 |
14.5 |
18.15 |
0.5952 |
0.3327 |
1.092 |
1 |
0.8278 |
0.5376 |
|
When only the discharge cycle is modified, round trip efficiency is increased as compressor power is not affected. Turbine work is increased. With RR during discharge, mechanical and exergy efficiencies are increased but differences are reduced at higher temperatures. When both charge and discharge cycles are modified, mechanical efficiency is increased but differences are small. For Layout D with RR during discharge, charging time can be lower than discharging time.
Figure 13 presents the effects of expansion ratio variations for Layout C.
Layout C - TIT 550 K: exergy efficiency (a); temperature in B (b); round trip efficiency (c); mechanical efficiency (d); charging time (e); surplus energy (f) as a function of expansion ratio
Mechanical efficiency, combining both power and heat sources, is significantly increased when charge and discharge cycles are modified. The increase in power consumption during charge is fully compensated by the decrease in additional heat supply. Round trip efficiency follows the same trend than reference Layout A. As in previous cases, for higher expansion ratios, the charging time is reduced because of the lower temperature of turbine exhaust. Lower charge/discharge time ratios are achieved, due to the decrease in T3. This reduces quality at the turbine exhaust, increasing the available latent heat at evaporator. There is less surplus energy when both charge and discharge cycles are modified.
Figure 14 presents exergy and round trip efficiencies for Layout C, at TIT 950 K. At higher temperatures, trends are similar, but differences between the alternative options are reduced due to the greater share of thermal heat stored.
Layout C - TIT 950 K: exergy efficiency (a) and round trip efficiency (b)
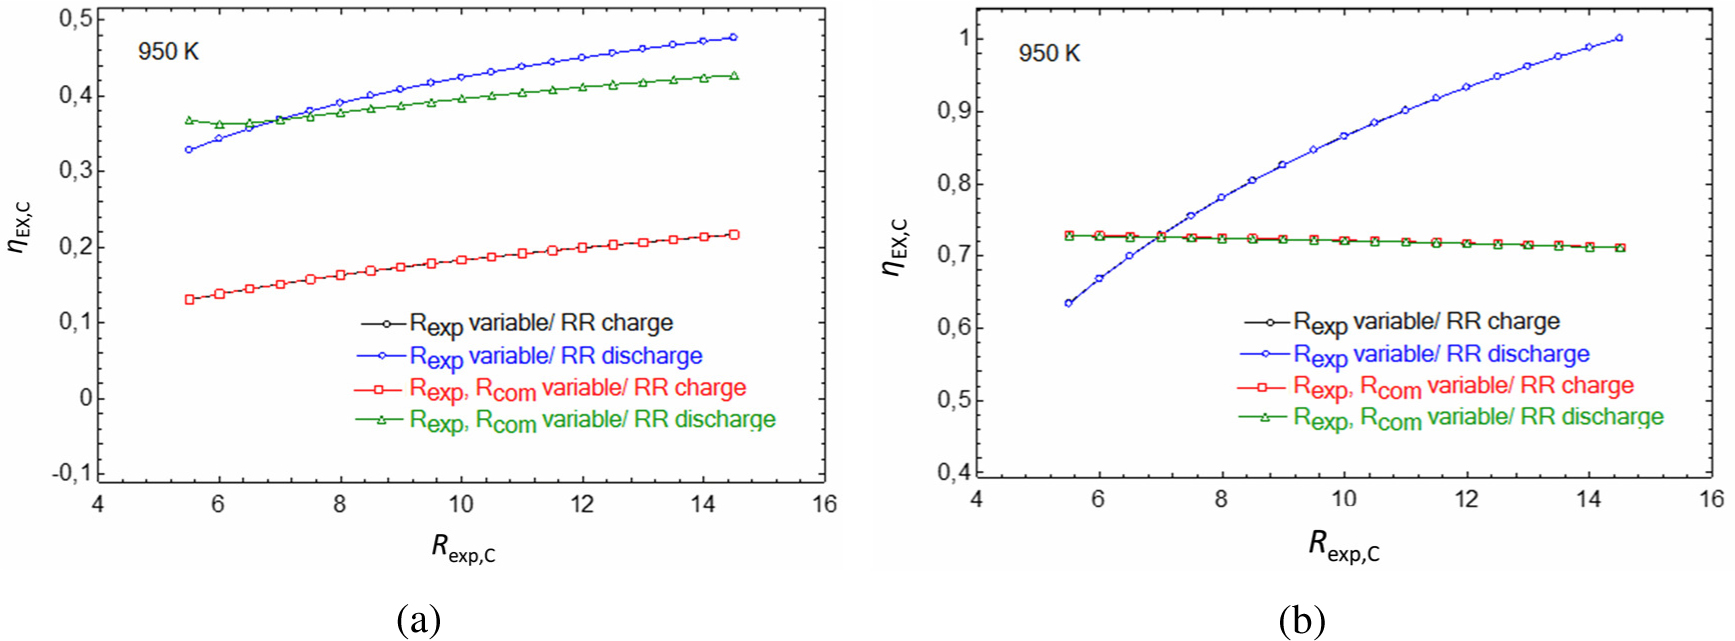
At low pressures, the increase in exergy efficiency is not as significant as in TIT 550 K, where higher efficiencies were achieved at higher expansion ratios. The decrease in surplus energy at higher expansion ratios was smaller. Table 6 presents main global parameters for best operation performance at 550 K and 950 K.
Layout C - best values of parameters for TIT at 550 K and 950 K
Renewable resource during charge |
||||||||
|---|---|---|---|---|---|---|---|---|
Modified parameter |
TFC;C |
Rexp Opt. |
Rcom |
ηex;C |
ηmech;C |
ηRT;C |
Eexcess;C |
hCS;C |
P7 |
550 K |
14.5 |
6.82 |
0.6659 |
0.4311 |
0.8359 |
1.129 |
1.304 |
P7 and P2 |
14.5 |
14.23 |
0.6957 |
0.5481 |
0.5942 |
1.097 |
1.229 |
|
P7 |
950 K |
14.5 |
6.82 |
0.2167 |
0.1679 |
1.00 |
1.863 |
2.60 |
P7 and P2 |
14.5 |
14.23 |
0.2229 |
0.182 |
0.7121 |
1.809 |
2.452 |
|
Renewable resource during discharge |
||||||||
Modified parameter |
TFC;C |
Rexp Opt. |
Rcom |
ηex;C |
ηmech;C |
ηRT;C |
Eexcess;C |
hCS;C |
P7 |
550 K |
14.5 |
6.82 |
0.8065 |
0.4391 |
0.8461 |
1.157 |
1.327 |
P7 and P2 |
14.5 |
14.23 |
0.7066 |
0.5391 |
0.6015 |
1.107 |
1.252 |
|
P7 |
950 K |
14.5 |
6.82 |
0.4765 |
0.3235 |
1.00 |
1.53 |
2.626 |
P7 and P2 |
14.5 |
14.23 |
0.4271 |
0.3213 |
0.7118 |
1.527 |
2.478 |
|
For high temperatures and renewable resource in the discharge cycle, variations in the charge cycle do not affect significantly the main parameters. However, the best obtained pressure ratio after simulations almost doubles, increasing the requirements of the compressor. For renewable resource in the charge cycle, the improvements of modifying both charge and discharge cycles are clearer.
The analysed layouts presented differences in constructive configuration and parameters. For reference Layout A, when charge and discharge cycles were modified complementarily, a clear improvement of global parameters was obtained. Achievement of the same power output in with unaltered charge cycle, more heat supply is required (obtained externally from heat exchangers and/or storage). Best result of modification of the charge cycle requires a pressure ratio increase of 73%. For high temperatures, cycle A is the best option with complementary charge/discharge variations.
Layout D presents a more complex integration but enables the obtainment of parameter values that were not possible with the other configurations. The addition of the ammonia cycle enables additional adjustments for energy storage, allowing energy to be balanced in any operation condition. However, with Layout D no clear advantage was obtained when renewable thermal energy was added and cycles were adapted by varying charge and discharge cycles simultaneously. This resulted in a higher pressure ratio, up to 18.
Regarding Layout C, intermediate results between Layouts A and D were obtained. With a single heat pump cycle, the layout was simpler than Layout B. Higher energy integration than in Layout A was obtained with the addition of heat exchangers and heat storage at two temperatures. For Layout C, there were no relevant differences when the charge cycle was modified, even at high temperatures.
Selection of one layout for a specific application will depend on investment costs and complexity. Possibilities for energy systems evolve from A to D, with C being an intermediate option. Depending on the type of application (i.e., power plant or residential), a specific layout is selected. Layouts D and C provide the best global parameters. Regarding the operation temperatures, those between 550 K and 750 K with simultaneous variation of both charge/discharge cycles provide better results. With higher temperatures, 750-950 K, modification of the charge cycle in Layouts D and C gives interesting results. The temperature range 550-750 K can be applied to small scale power and heat energy storages in residential applications. Intermediate temperatures can be utilized at power plant scale with parabolic trough technology plants. The temperature range 750-950 K corresponds to temperatures reached in concentrated solar towers and parabolic dishes. This double source integration (power/heat) enables the compensation of variations in the availability of one source, increasing the contribution of the other. Although the analyses presented herein have shown integrations in the charge or discharge cycles as being independent, they could be combined in function of the availability of resources and operation strategy.
This section presents an economic analysis based on the gross estimation of investment and operational costs, in terms of LCOE, which is defined as the normalized energy cost that provides a Net Present Value (NPV) equal to capital and operational expenditures throughout the lifetime of the analyzed system. LCOE is expressed as [40]:
where I refers to capital expenditure (USD/MWh), Le is the energy cost (USD), M is maintenance expenditures (USD), R is repair expenditures (USD), F is the financial cost (USD), E1 refers to the annual energy produced (MWh/year), r is the discount rate, and n is the lifetime considered.
Table 7 shows the annual energy balance and estimated costs for a 100 MW reference plant with daily storage discharge hours, and operating with an additional heat supply at 550 K. Estimated values of the equipment are extrapolated from in house data and adjusted from expressions adjusted to the evolution of the Chemical Engineering Index [41]. Charging time and power consumption for each layout corresponds to the ratio calculated.
Estimated annual energy balance and costs for a 100 MW plant
A Charge |
A Charge/ discharge |
D Discharge |
D Charge/ discharge |
C Discharge |
C Charge/ discharge |
|
|---|---|---|---|---|---|---|
Energy generated [MWh/year] × 1,000 |
316.8 |
316.80 |
316.80 |
316.80 |
316.80 |
316.80 |
Energy consumption [MWh/year] × 1,000 |
376.56 |
473.76 |
343.80 |
426.96 |
344.52 |
484.56 |
Thermal energy from renewable resource [MWh/year] × 1,000 |
390.24 |
155.88 |
283.50 |
122.51 |
323.53 |
40.79 |
Estimated investment cost [M USD] |
195.98 |
250.343 |
232.038 |
277.01 |
194.84 |
271.46 |
O&M costs [M USD/year] |
5.87 |
7.51 |
6.96 |
8.31 |
5.84 |
8.14 |
Consumed energy cost [M USD/year] |
7.91 |
9.95 |
7.22 |
8.97 |
7.23 |
10.16 |
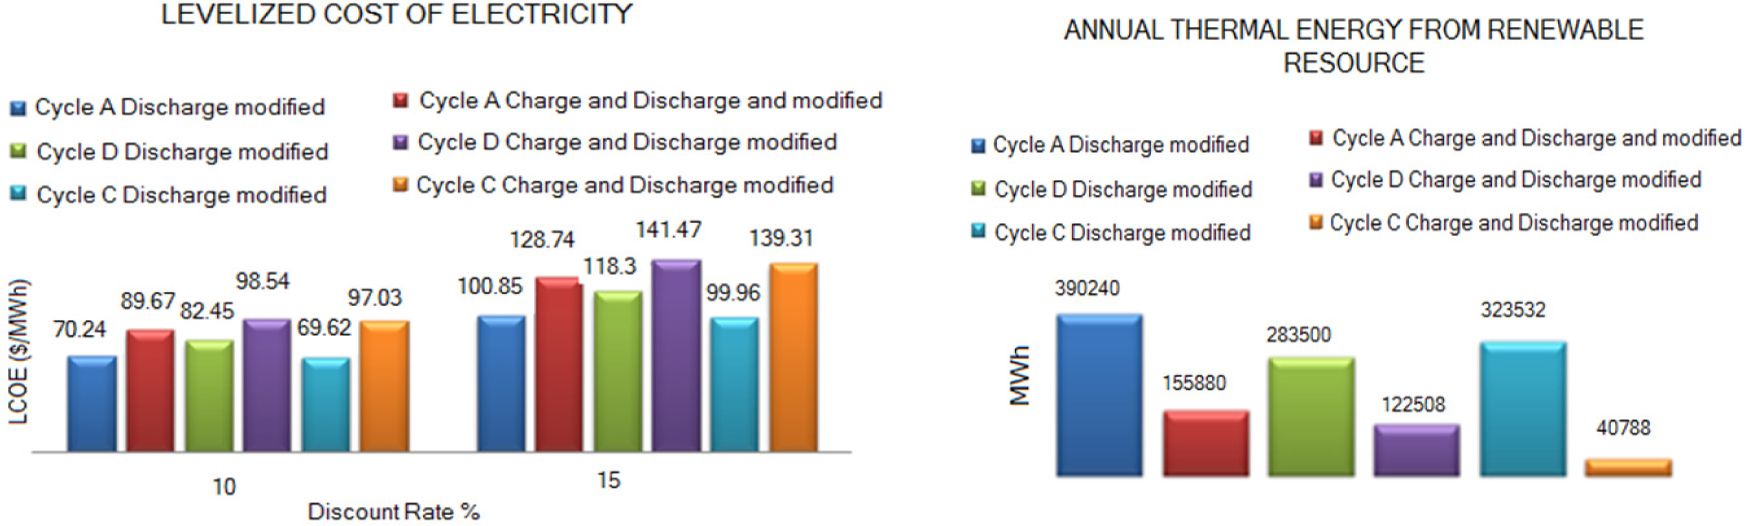
In this analysis for Layout D the additional costs associated safety issues for ammonia cycle have not been included, and they will slightly penalize the outcomes of this layout. Annual energy costs for the charge cycle were those associated with off-peak periods. Considering the daily electricity market pool in Spain for year 2015, the mean tariff for off-peak electricity was 21 USD/MWh. Figure 15 shows LCOE along with the estimated annual thermal energy supplied by the low temperature solar source for the different layouts. Most of the values presented herein are below the ones presented in [42] for CAES and Pumped Hydroenergy Storage (PHS). There is a clear economic interest in advancing in the study of these integrations.
Estimated annual thermal energy from renewable resource and LCOE for Layouts A, C and D
This manuscript addressed the concept of thermoelectric energy storage, using surplus electricity for thermal energy storage based on the use of a transcritical CO2 cycle, which was extended herein through the integration of local thermal energy storage. The integrated concept combines power/heat storage using electricity and thermal energy as sources. Electricity can be originated from surplus capacity of the electric grid or produced at local generation devices (wind, PV). Thermal energy sources include solar, biomass or geothermal (cold side). The combined integration presents synergies and advances in comparison with separate systems for power or heat storage. The systems proposed herein enable integration, within a single system, of different renewable sources such as wind or solar, operating at different temperature ranges and for different applications, from residential to power plant scales. Depending on the temperature range and application, different solar technologies and strategies should be considered.
Among the layouts analysed herein, Layout C, which presented modifications in the discharge cycle only, presented the best economic performance, although required a higher thermal energy contribution. Generally, when thermal resource availability is limited, the most adequate option is to modify both charge and discharge cycles. Then selection will depend on the complexity and thermal resource availability. The lowest LCOE value was obtained for Layout C, due to lower investment costs as the power required by the compressor and turbine are smaller. However, these devices require higher thermal energy contribution. Modifications of both charge and discharge cycles provided higher compressor outlet temperatures during the charge cycle, and a lower contribution of the additional solar thermal resource was required. For temperatures between 550 K and 750 K, simultaneous variation of both charge/discharge cycles could improve results. However, when considering higher temperatures, 750-950 K, modifications in the charge cycle for Layouts C or D did not result in an advantage.
The LCOE values obtained herein were in the range 90-140 USD/MWh. Global analysis highlighted the interest of advancing in the study and definition of TCO2-TESS technologies, probably integrated with solar power plants for the exploitation of possible synergies. The integration within solar thermal power plants could convert these into regulated power plants, which compensate peak/off peak periods, either at the electric grid scale or for residential/district levels, integrating distributed generation technologies.
This work was supported as part of the ClimACT project (SOE1/P3/P0429EU) within the InterregSudoe Programme, funded by European Regional Development Funds.
- ,
Multi-objective Optimized Management of Electrical Energy Storage Systems in an Islanded Network with Renewable Energy Sources under Different Design Scenarios ,Energy , Vol. 64 , :648-6622014, https://doi.org/10.1016/j.energy.2013.11.065 - ,
Are Fundamentals Enough? Explaining Price Variations in the German Day-ahead and Intraday Power Market ,Energy Economics , Vol. 54 , :376-3872016, https://doi.org/10.1016/j.eneco.2015.12.013 - ,
The Contribution of Heat Storage to the Profitable Operation of Combined Heat and Power Plants in Liberalized Electricity Markets ,Energy , Vol. 41 (1), :75-822012, https://doi.org/10.1016/j.energy.2011.06.048 - ,
Look Before You Leap: The Role of Energy Storage in the Grid ,IEEE Power and Energy Magazine , Vol. 10 (4), :75-842012, https://doi.org/10.1109/mpe.2012.2196337 - ,
Room-temperature Stationary Sodium-ion Batteries for Large-scale Electric Energy Storage ,Energy & Environmental Science , Vol. 6 (8), :p 23382013, https://doi.org/10.1039/c3ee40847g - ,
Large-scale Integration of Wind Power into Different Energy Systems ,Energy , Vol. 30 (13), :2402-24122005, https://doi.org/10.1016/j.energy.2004.11.001 - ,
Optimization of Integrated Photovoltaic-wind Power Generation Systems with Battery Storage ,Energy , Vol. 31 (12), :1607-16182006, https://doi.org/10.1016/j.energy.2005.10.032 - ,
Flywheel Energy and Power Storage Systems ,Renewable and Sustainable Energy Reviews , Vol. 11 (2), :235-2582007, https://doi.org/10.1016/j.rser.2005.01.004 - ,
Electrochemical Supercapacitors: Energy Storage Beyond Batteries ,Current Science , Vol. 79 (12), :1656-16612000 - ,
The Role of Compressed Air Energy Storage (CAES) in Future Sustainable Energy Systems ,Energy Conversion and Management , Vol. 50 (5), :1172-11792009, https://doi.org/10.1016/j.enconman.2009.01.032 - ,
Pumping Station Design for a Pumped-storage Wind-hydro Power Plant ,Energy Conversion and Management , Vol. 48 (11), :3009-30172007, https://doi.org/10.1016/j.enconman.2007.07.015 - ,
Performance of a Stand-Alone Renewable Energy System Based on Energy Storage as Hydrogen ,IEEE Transactions on Energy Conversion , Vol. 19 (3), :633-6402004, https://doi.org/10.1109/TEC.2004.827719 - ,
A Review of Solar Collectors and Thermal Energy Storage in Solar Thermal Applications ,Applied Energy , Vol. 104 , :538-5532013, https://doi.org/10.1016/j.apenergy.2012.11.051 - ,
Cyclic Operation of Molten-salt Thermal Energy Storage in Thermoclines for Solar Power Plants ,Applied Energy , Vol. 103 , :256-2652013, https://doi.org/10.1016/j.apenergy.2012.09.043 - ,
Analysis of Two Heat Storage Integrations for an Organic Rankine Cycle Parabolic Trough Solar Power Plant ,Energy Conversion and Management , Vol. 125 , :353-3672016, https://doi.org/10.1016/j.enconman.2016.03.067 - ,
Thermal Energy Storage Technologies and Systems for Concentrating Solar Power Plants ,Progress in Energy and Combustion Science , Vol. 39 (4), :285-3192013, https://doi.org/10.1016/j.pecs.2013.02.001 - ,
State of the Art on High-temperature Thermal Energy Storage for Power Generation, Part 2 - Case Studies ,Renewable and Sustainable Energy Reviews , Vol. 14 (1), :56-722010, https://doi.org/10.1016/j.rser.2009.07.036 - ,
A Review on Phase Change Energy Storage: Materials and Applications ,Energy Conversion and Management , Vol. 45 (9-10), :1597-16152004, https://doi.org/10.1016/j.enconman.2003.09.015 - ,
Thermochemical Energy Storage of Concentrated Solar Power by Integration of the Calcium Looping Process and a CO2 Power Cycle ,Applied Energy , Vol. 173 , :589-6052016, https://doi.org/10.1016/j.apenergy.2016.04.053 - ,
Optimizing the CSP-Calcium Looping Integration for Thermochemical Energy Storage ,Energy Conversion and Management , Vol. 136 , :85-982017, https://doi.org/10.1016/j.enconman.2016.12.093 - ,
Power Cycles Integration in Concentrated Solar Power Plants with Energy Storage Based on Calcium Looping ,Energy Conversion and Management , Vol. 149 , :815-8292017, https://doi.org/10.1016/j.enconman.2017.03.029 - ,
Sustainable Thermal Energy Storage Technologies for Buildings: ,A Review, Renewable and Sustainable Energy Reviews , Vol. 16 (5), :2394-24332012, https://doi.org/10.1016/j.rser.2012.01.058 - ,
Phase Change Materials and Thermal Energy Storage for Buildings ,Energy and Buildings , Vol. 103 , :414-4192015, https://doi.org/10.1016/j.enbuild.2015.06.007 - ,
Phase Change Material (PCM) Storage for Free Cooling of Buildings—A Review ,Renewable and Sustainable Energy Reviews , Vol. 18 , :607-6252013, https://doi.org/10.1016/j.rser.2012.10.034 - ,
Thermodynamic Analysis of a Novel Energy Storage System with Carbon Dioxide as Working Fluid ,Renewable Energy , Vol. 99 , :682-6972016, https://doi.org/10.1016/j.renene.2016.07.048 - ,
Thermoeconomic Analysis of a Solar Enhanced Energy Storage Concept Based on Thermodynamic Cycles ,Energy , Vol. 45 (1), :358-3652012, https://doi.org/10.1016/j.energy.2012.02.010 - ,
Conceptual Design of a Thermo-electrical Energy Storage System Based on Heat Integration of Thermodynamic Cycles - Part B: Alternative System Configurations ,Energy , Vol. 45 (1), :386-3962012, https://doi.org/10.1016/j.energy.2012.03.033 - ,
Thermoeconomic Performance and Optimization of a Novel Cogeneration System using Carbon Dioxide as Working Fluid ,Energy Conversion and Management , Vol. 145 , :265-2772017, https://doi.org/10.1016/j.enconman.2017.04.103 - ,
Thermoeconomic Design Optimization of a Thermo-electric Energy Storage System Based on Transcritical CO2 Cycles ,Energy , Vol. 58 , :571-5872013, https://doi.org/10.1016/j.energy.2013.05.038 - ,
Isothermal Transcritical CO2 Cycles with TES (Thermal Energy Storage) for Electricity Storage ,Energy , Vol. 49 , :484-5012013, https://doi.org/10.1016/j.energy.2012.09.057 - ,
Integration of Heat Pumps into Thermal Plants for Creation of Large-scale Electricity Storage Capacities ,Applied Energy , Vol. 184 , :506-5222016, https://doi.org/10.1016/j.apenergy.2016.10.045 - ,
A Novel Pumped Thermal Electricity Storage (PTES) System with Thermal Integration ,Applied Thermal Engineering , Vol. 121 , :1051-10582017, https://doi.org/10.1016/j.applthermaleng.2017.04.127 - ,
Performance Optimization and Comparison of Pumped Thermal and Pumped Cryogenic Electricity Storage Systems ,Energy , Vol. 106 , :260-2692016, https://doi.org/10.1016/j.energy.2016.03.053 - ,
Thermo-Electric Energy Storage Involving CO2 Transcritical Cycles and Ground Heat Storage,Applied Thermal Engineering , Vol. 108 , :1418-14282016, https://doi.org/10.1016/j.applthermaleng.2016.07.063 - ,
Calculation of Levelized Costs of Electricity for Various Electrical Energy Storage Systems ,Renewable and Sustainable Energy Reviews , Vol. 67 , :908-9202017, https://doi.org/10.1016/j.rser.2016.09.043 - ,
System Design and Economic Performance of Gravity Energy Storage ,Journal of Cleaner Production , Vol. 156 , :317-3262017, https://doi.org/10.1016/j.jclepro.2017.04.043 - ,
Thermal Energy Storage by Means of Reversible Heat Pumping, US4089744 A , 1976 - ,
Electrothermal Energy Storage with Transcritical CO2 Cycles ,Energy , Vol. 45 (1), :407-4152012, https://doi.org/10.1016/j.energy.2012.03.013 - ,
Thermodynamic Analysis of a Transcritical CO2 Power Cycle Driven by Solar Energy with Liquified Natural Gas as its Heat Sink ,Applied Energy , Vol. 92 , :194-2032012, https://doi.org/10.1016/j.apenergy.2011.10.021 - ,
Alternative Approach to Determining the Preferred Plant Size of Parabolic Trough CSP Power Plants ,Proceedings of the ASME 2011 Turbo Expo: Turbine Technical Conference and Exposition , 1053-10622011 - ,
Design Analysis of Thermal Systems , 1987 - ,
Electricity Storage Handbook in Collaboration with NRECA ,Sandia Report, , 2013