


Sour Water (SW) are aqueous wastes from many operations in oil refineries. Hydrogen sulfide (H2S) and Ammonia (NH3) are the most common SW contaminants, besides eventual presence of phenols and cyanides. Thus, SW needs treatment before reuse or discharge, avoiding damages to processes and to the environment [1], [2]. For this purpose, Sour Water Stripper Units (SWSU) are the common process solution for stripping H2S and NH3 and to recover reusable water [3], [4].
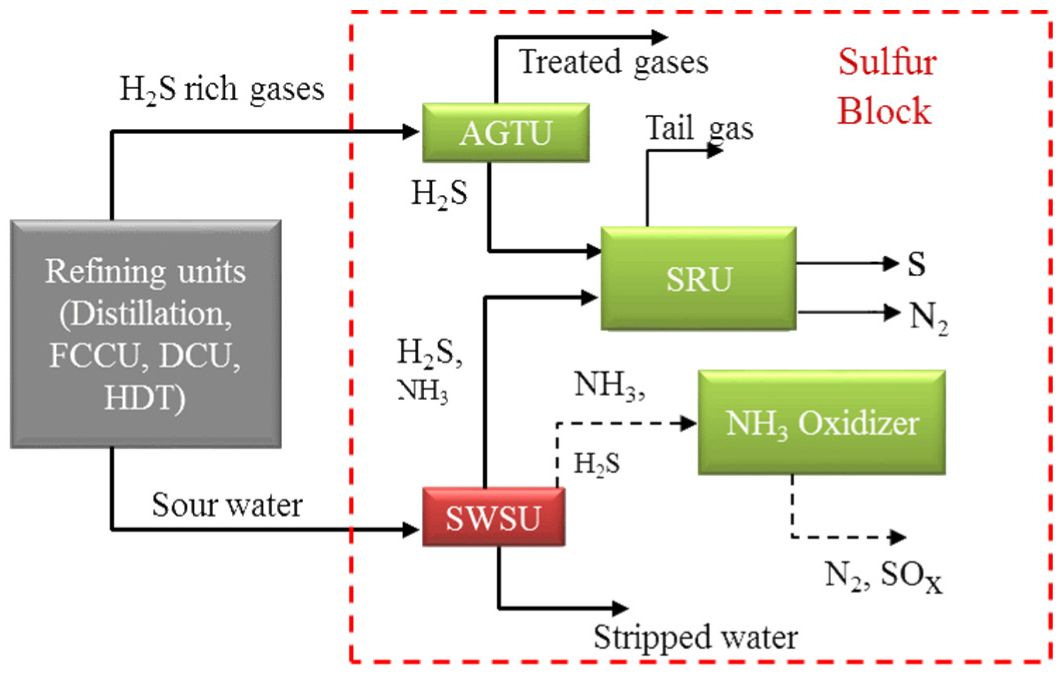
Figure 1 shows the insertion of a two-stage SWSU in a refinery process scheme. SW streams are generated when stripping steam is condensed into atmospheric and vacuum distillation columns. Fluid Catalytic Cracking Units (FCCU), Delayed Coking Units (DCU) and Hydrotreating (HDT) units produce gas hydrocarbon streams with high H2S content, which is absorbed in water quenches or in Amine Gas Treating Units (AGTU), generating SW wastes in the former and, in the latter, H2S gas which is dispatched to Claus plants for sulfur production. Additionally, stringent environmental constraints lead HDT units to operate with higher severity for increasing removal of sulfur and nitrogen compounds from fuels, leading to waste SW from quench water with high H2S and NH3 contents. In other words, much of the H2S and NH3 is removed from refinery units by the injections of washing or quenching water, generating SW. FCCU and DCU also generate SW with H2S and NH3 from the condensation of injected steam for stripping and aeration or from water washing of liquid hydrocarbon streams. Sour water from hydrotreating units contains almost exclusively NH3 and H2S and possibly traces of Carbon dioxide (CO2), is classified as non-phenolic. Phenolic SW typically comes from FCCU and DCU, and contains, besides NH3 and H2S, other contaminants like heat stable salts, Hydrogen cyanide (HCN), phenols and caustic, typically in the range of 100 to 300 ppmw [5], [6]. SW streams should be sent to SWSU to produce reusable water and to dispatch H2S and NH3 to Claus and ammonia plants, respectively, avoiding emissions generated by otherwise flaring such waste gases (a practice not too uncommon in the past) [7]-[9].
Sulfur block units and SWSU
The growing intensity of regulatory constraints for aqueous effluents and the demand for enhanced energy efficiency have increased the relevance of SW stripping processes. Based on steady state simulation, Lee et al. [10] proposed guidelines for improving stripper performance through changes in the operating condition and process structure to reduce steam consumption (generally, a SW stripper has high steam demand) and lower ammonia concentration in the treated wastewater and stabilize operation. Furthermore, when the NH3 composition of the feed increases, the column pressure rises rapidly, causing operation to become unstable [11]. Lee et al. [10], [11] proposed a scheme to control the column pressure and used dynamic simulation to present improved controllability of the scheme to cope with abnormal situations which may occur in a real plant. Yélamos et al. [12] employed dynamic simulation to evaluate repercussions from process faults in SW process responses. Process modifications are proposed to increase energy performance and improve sulfur recovery. Kazemi et al. [4] proposed application of vapor recompression systems to enhance energy efficiency and reduced energy requirements of sour water distillation system. Sharma and Nag [13] claim reduced losses of H2S from the feed stabilization tank, through installation of an upstream hot-feed flash drum.
The set of AGTU, SWSU and SRU units define the so-called sulfur block of refineries. Sulfur block units are essentially environmental control units. They allow upstream units to generate revenue, keeping refinery operation in accordance with safety, environmental and health requirements. The purpose of the sulfur block is to comply with these requirements while assuring high degree of reliability of the units, with minimum energy consumption [8].
A conventional Claus sulfur recovery unit is able to process an acid gas feed with a maximum NH3 content in the range of 2-4% by volume. Larger values may lead to inadequate burning and increased Nitrogen oxides (NOx) production. Residual NH3 may lead to ammonium salt deposit, causing plant disturbances and even a plant shutdown. Modifications in SRU design, such as adding air and acid gas preheating and using a two-zone reaction can allow higher NH3 content in the SRU feed. However, with these modifications, the maximum NH3 content normally accepted in the combined feed to SRU is 25% by volume [14].
Most known crude oils have nitrogen content lower than 0.25%, being classified as low nitrogen oils. A study published in 2002 showed the significant difference between the nitrogen content in a typical Brazilian oil, 0.5% w/w, and the Light Arab oil, with 0.1% w/w [15]. Guarnieri et al. [16] showed that the Brazilian oils processed in 2015 had a mean total nitrogen content of 0.334% w/w, being classified as high nitrogen oils. High nitrogen content oils lead to high NH3 content in the SRU feed. In some cases, 55% v/v of NH3 was observed in the overall acid gas feed to SRU [17], with almost all of this NH3 mainly coming from SWSU.
Depending on the nitrogen content of the refinery crude feed and the characteristics of the Claus SRU, the SWSU can be conducted in a single stage or in more complex SWSU with two stages to adequately split H2S and NH3. An example of this type of approach is the Waste Water Treatment (WWT) process developed by Chevron [18]. The correct split of H2S and NH3 eliminates SRU problems such as catalyst deactivation, plugging in condensers and seals, lower operating factors and the diluent effect that increases the size of the unit [7].
Considering the high levels of nitrogen in Brazilian crudes, the high severity processes for sulfur removal from automotive fuels, and the NH3 limits to SRU’s feed, a significant number of SWS units in Brazilian refineries is configured with two-stages. According to Brazilian legislation, two-stage SWSU should be designed for a minimum H2S recovery of 90% in the first stripping stage [19].
In a two-stage SWSU, H2S is stripped in the first stage (SWSU-1) and sent to a SRU. The remaining H2S and almost the totality of NH3 are sent to the second stripping stage (SWSU-2), being removed from water and sent to an oxidizer, where H2S is converted to SOx, contributing to plant emissions. To minimize Sulfur oxide (SOx) emissions, H2S recovery in the SWSU-1 should be maximized. However, due to the limitation in H2S/NH3 split, large amounts of NH3 are sent to SRU whenever separation limit is crossed, causing operational disturbances and eventual unit shutdown.
Selective separation of H2S and NH3 in the SWSU-1 depends on the operating conditions and it has a thermodynamic limit, hereinafter named separation limit point. In addition, the higher the recovery of H2S required in the SWSU-1, the greater the amount of NH3 carried in the acid gas stream to SRU. The SWSU-2 can be compared to the column used in the one stage process, whose main purpose is to treat water for disposal or reuse. Since contaminant specifications are met in the treated water at the bottom of this column, all volatile contaminants present at the bottom of the SWSU-1 will be present in the ammonia gas stream at the top of the second stripping column. Consequently, both the purity of the acid gas stream, from first stage, and the ammonia gas stream, from second stage, depend strictly on the operation of the first stripping column [20].
The higher the required H2S recovery, the tighter the operating range, requiring a more robust control strategy, to minimize the effects of process disturbances. Such disturbances, if not treated correctly, can lead to SOx emissions increase and damages to SRU’s. Therefore, determining the appropriate operating range that provides maximum H2S recovery required in the SWSU-1 without exceeding the NH3 limit in the acid gas is of great relevance, and the literature lacks in model-based approaches to forecast impacts of operational conditions on these SWSU responses.
This work evaluates the first stripping stage of a two-stage sour water stripping unit and proposes a set of Response Surface (RS) models to characterize the separation limit point in the SWSU-1, based on its main input variables. The separation limit point is characterized considering two performance variables, maximum H2S recovery and NH3 content in acid gas stream, and three operational variables, maximum reboiler duty, temperature of the sensitive column stage and the difference between reboiler input and output temperature. RS models were developed based on data obtained by simulation of a two-stage SWS unit in Aspen HYSYS® process simulator. RS models were validated against a separate data set equally generated by simulation, presenting very satisfactory results. RS models results were also compared to data from a real SWS plant, enabling to compare the first stage stripping operation point in relation to the predicted limit point. Another relevant contribution of this work derives from the fact that the NH3 content in the acid gas to SRU is not measured in a plant, while the RS models predictions are a plausible basis for constructing a software-based sensor, to support plant operation.
Also, the first stripping stage of a SWS unit was dynamically simulated in Aspen HYSYS® process simulator, using the typical controls of a SWS plant. The reboiler duty control is usually configured as a ratio control between the steam flowrate to the reboiler and the sour water feed rate to the H2S stripping column. However, this control is not efficient when disturbances occur in other input variables, such as the feed column temperature and the sour water composition. These disturbances often lead to instabilities in the H2S stripping column, frequently leading to deviations to flare, by the actuation of the plant interlock system, increasing SOx plant emissions. For simplicity, in this work, the reboiler duty was adopted as manipulated variable instead of the steam flow to the reboiler. Alternatively, the RS model was used to generate a set-point for the ratio control, based on input variables. The performances of the two types of control were compared, and the proposed control strategy outperformed the traditional control scheme.
The use of surrogate models to represent complex phenomena has increased in the last years. The main advantages of this approach is the computational simplicity and reduction in computational time and resources [21]. Models based on Kriging interpolation were used to substitute sour water strippers in a large optimization of a sour water plant located in Germany [22]. The present work presents surrogate models developed for relevant responses of the studied process, that can be used to improve control strategies. In this way, the first and second subsections of methods present the description of the process studied and its challenging narrow operational range. The other subsections present the response surface method used to generate the surrogate models, as well as its application in the improvement of the reboiler duty control of the H2S stripper column.
The first stripping stage of a SWS unit consists of a distillation column ‒ a H2S stripper column ‒ fed by pre-heated sour water stream at the top. A reboiler provides energy to generate stripping steam to remove the pollutants. An appropriate operation pressure of the stripper column ensures that H2S is preferably removed in the first stripping stage while NH3 is maintained in the liquid stream at the column bottom. The effluent gases at the top of the column are cooled in a condenser and the liquid and vapor phases are separated in the top drum. The H2S rich gas from top drum is sent to SRU, and the liquid phase returns to the sour water feed tank. To reduce steam consumption in the reboiler, a heat exchanger is used to heat the sour water stream and to cool down the bottom stream from the stripper column.
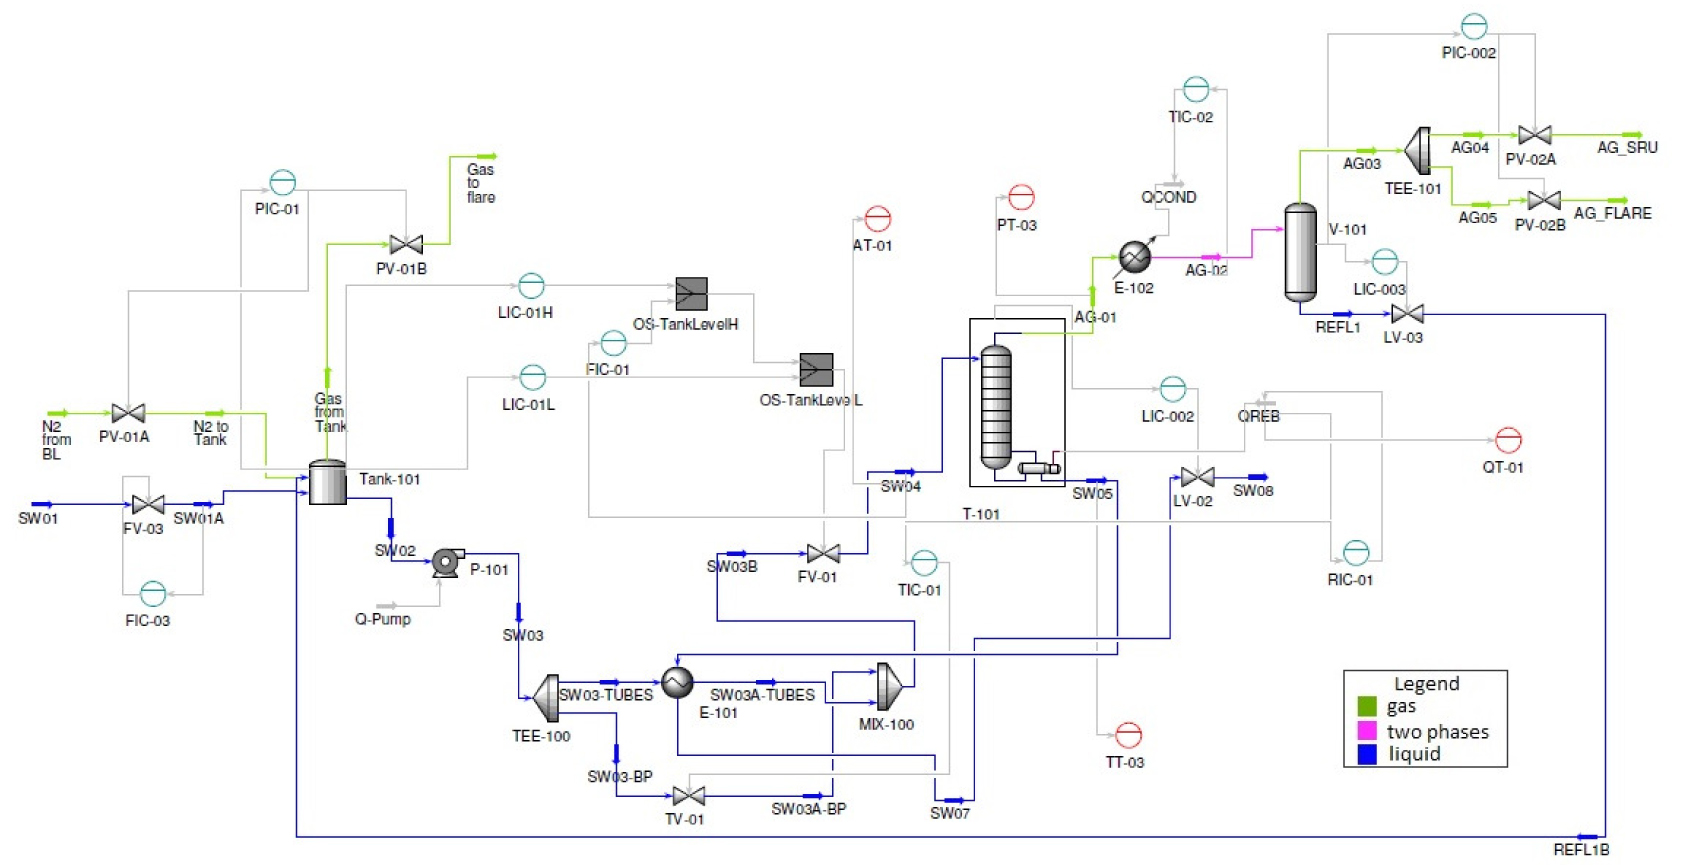
SWSU-1 was evaluated by simulation with Aspen HYSYS®. A flowsheet of the first stripping stage is shown in Figure 2. This work consider sour water stream to be composed of water, NH3 and H2S. Considering a sour system, involving equilibrium of ionic species, the thermodynamic model Sour PR of the simulator was adopted, which combines the Peng-Robinson equation of state and the Wilson’s API Sour Model† for handling sour water systems. In the Sour PR model, the K-values for the aqueous phase are calculated using Wilson’s API-Sour method to account for the ionization of H2S, CO2 and NH3 in the aqueous water phase.
Flowsheet of the first stripping stage simulated in Aspen HYSYS®
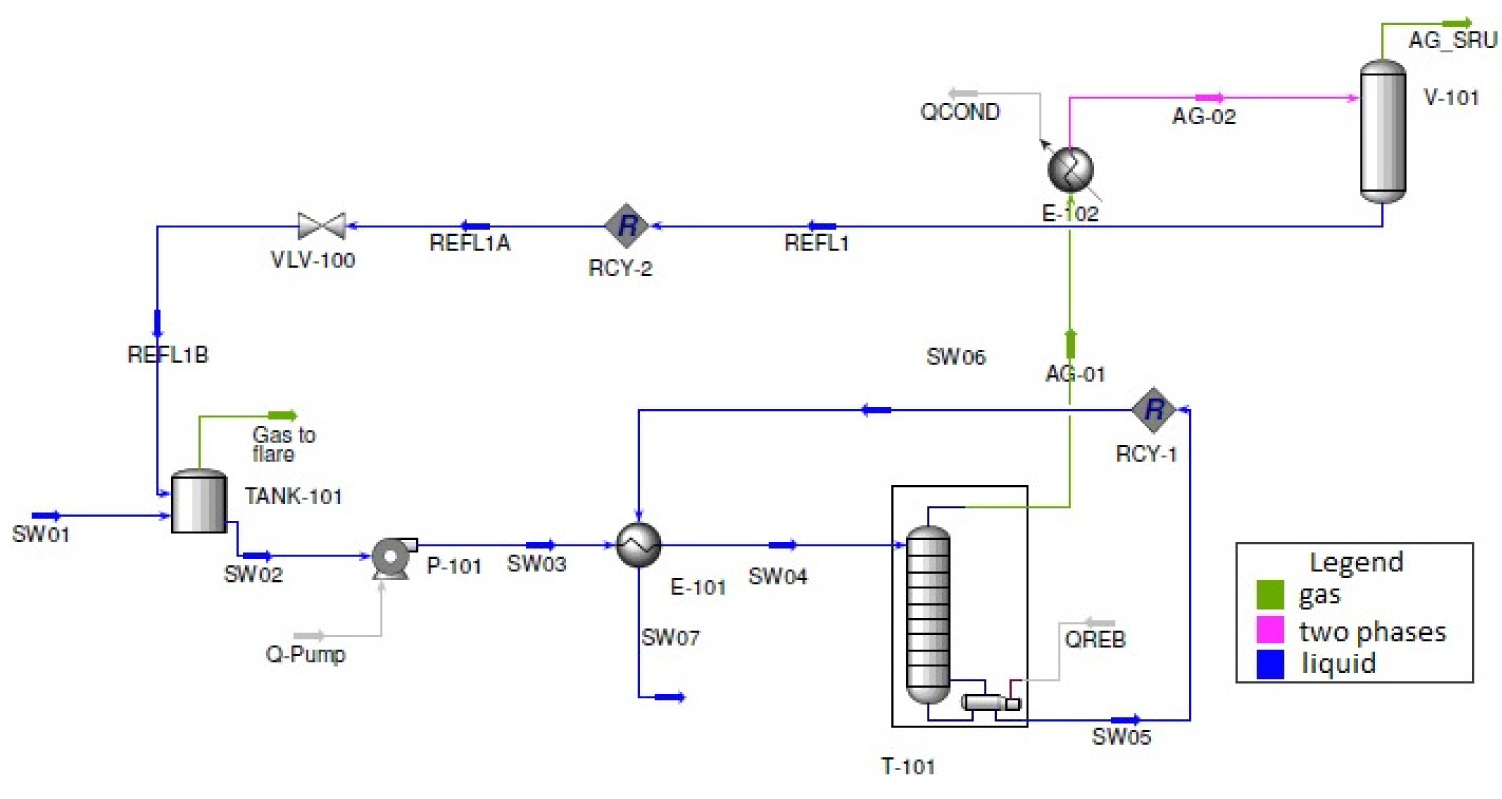
Simulation runs considered a H2S stripper column, with the following variables defined: sour water feed composition, pressure and temperature, stripper column operating pressures, top drum pressure and temperature. Reboiler duty (Qreb) was varied and process responses-H2S recovery and NH3 content in the acid gas – were analyzed. Table 1 shows the simulation inputs of the base case. Streams and equipment items refers to Figure 2.
Aspen HYSYS® simulation inputs – base case
| Input | Value | Input | Value |
|---|---|---|---|
| SW01 flowrate [kmol/h] | 8,200 | T-101 pressure [bar] | 7.0 |
| H2S in SW01 [molar ppm] | 1,000 | T-101 theoretical stages | 11 |
| NH3 in SW01 [molar ppm] | 2,000 | V-101 temperature [°C] | 90 |
| Tank-101 pressure [bar] | 1.5 | V-101 pressure [bar] | 6.9 |
| SW04 temperature [°C] | 130 | Qreb [×107 kJ] | 2.32-2.51 |
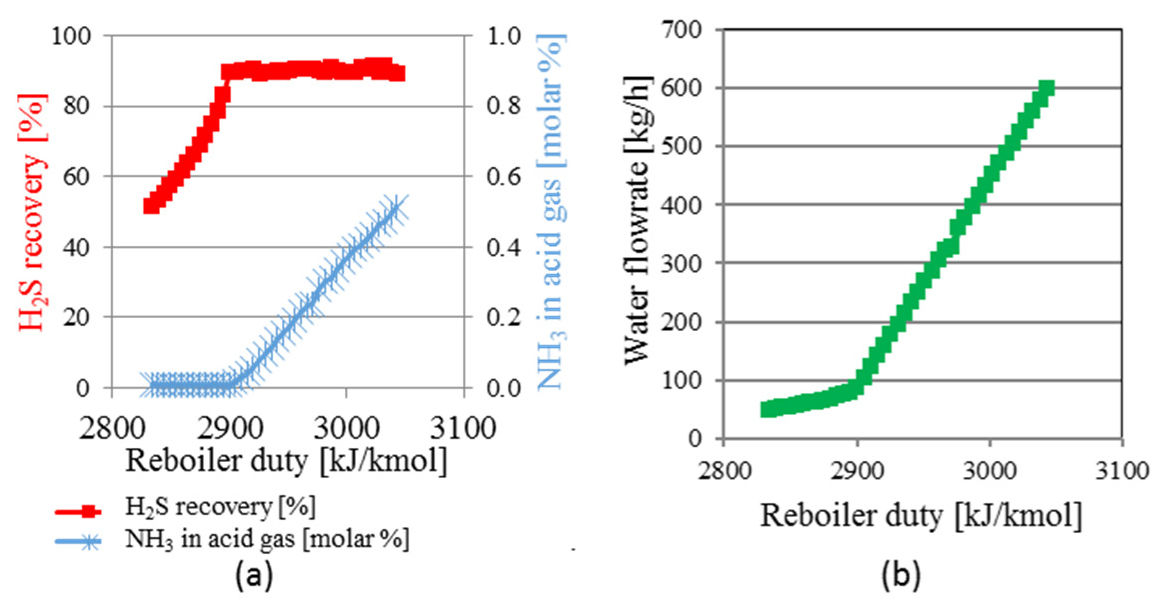
Example response curves are shown in Figure 3a and Figure 3b, evidencing the separation limit point of the H2S stripper column, which represents the maximum H2S recovery without exceeding the NH3 limit in the acid gas to SRU. In Figure 3a, H2S recovery is defined as the percentage of the H2S originally in the sour water stream that is found in the acid gas stream to SRU. H2S recovery increases linearly with reboiler duty increase, until a limit where it assumes an asymptotic behavior. Parallelly, the NH3 content in the acid gas stream is very low and nearly independent of the reboiler duty, in low to moderate duties, until a threshold is reached where a steep ascent occurs. The change in behavior of both curves occurs at the same value of reboiler duty. Below this point, it is possible to obtain an acid gas stream rich in H2S and with very low NH3 contents. Above this duty value, a large amount of NH3 is sent to the acid gas stream with increased amount of water. This point is hereinafter defined as the separation limit point of the H2S stripper column and identified by the “*” symbol.
H2S recovery, NH3 content in the acid gas (a) and water flowrate in the top stream (b)
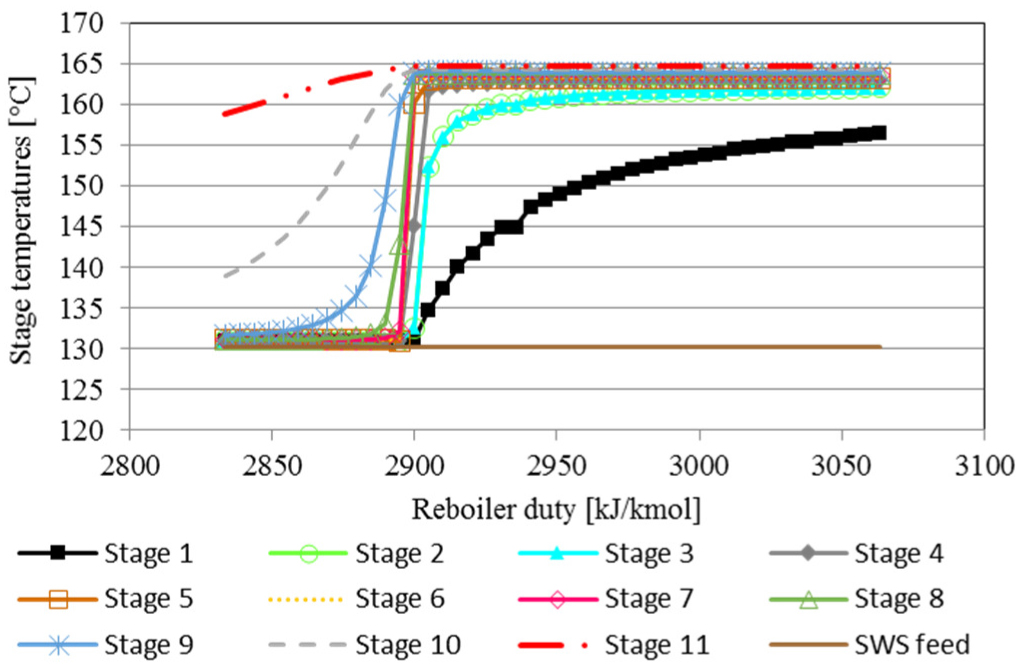
The separation limit point also presents a significant change in the behavior of the equilibrium stages temperatures of the H2S stripper column, as shown in Figure 4. As the equilibrium stage 5 exhibits the major temperature increase at the separation limit point, it was chosen as a sensitive stage to characterize the transition from normal operation to the operational limit. Equilibrium stages 10 and 11 present the reboiler inlet and outlet temperature, respectively. The temperature of stage 11 is constant along the evaluated range of reboiler duty, while the reboiler inlet temperature increases progressively with increasing reboiler duty. Thus, the difference between the inlet and outlet reboiler temperatures, and the temperature of the sensitive stage could be used for monitoring process performance.
H2S stripper column – outlet stage temperatures
This study was developed applying Response Surface Method (RSM) to obtain empirical models to characterize the separation limit point of the H2S stripper column. RSM consists of a set of mathematical and statistical techniques that are based on fitting empirical models to experimental data obtained from an experimental design [23]. For this purpose, the following Factors (variables that can be changed independently of each other) and Responses (measured values from experiments with the H2S stripper) were considered.
Operating pressure of the H2S stripper column (P);
Molar ratio H2S:NH3 in the feed of the sour water stripping unit
; NH3 content in the feed of the sour water stripping unit (
); Bottom and feed temperatures difference of the H2S stripper column (dTbf).
Reboiler duty divided by the molar flow rate of the sour water unit feed at the separation limit point (Q*reb), herein named ‘reboiler duty/feed ratio’, which represents the amount of energy required to reach the operating limit point. This response has a practical importance for monitoring the unit and delimits the region considered as normal operation;
Maximum H2S recovery (
), defined as percentage of the H2S originally in the sour water unit feed that is found in the acid gas stream to SRU, at the separation limit point; NH3 molar fraction in the acid gas to SRU at the separation limit point (
); Difference between the inlet and outlet reboiler temperatures at the separation limit point (dT*reb);
Stage 5 temperature at the separation limit point (T*sens).
A three level factorial experimental design was carried out considering the levels of factors. Combining the three levels of each factor listed in Table 2, a set of 81 experimental points was generated. For each point, the curve of the response variables versus reboiler duty was constructed using Aspen HYSYS® process simulator, according to the flowsheet simulation presented in Figure 2, to obtain the responses at the separation limit point of the H2S stripper column. As the experimental data was obtained from a process simulator, the experiments are referred to as pseudo-experiments and the results as pseudo-experimental. Also, because of the use of a process simulator to obtain experimental data, experimental replicates were not considered.
Levels of factors for three factorial pseudo-experimental design
| Factor | Minimum | Medium | Maximum | Unit |
|---|---|---|---|---|
| P | 7.0 | 10.0 | 13.0 | [bar] |
| H2S/NH3 | 0.50 | 0.75 | 1.00 | [molar fraction] |
| 2,000 | 7,000 | 12,000 | [molar ppm] | |
| dTbf | 35 | 40 | 45 | [°C] |
First and second order RS models, RS O(1) and RS O(2), respectively, were tested specifying a 95% confidence level for the estimation of model parameters. The use of logarithmic function in the model factors and responses was also evaluated. The general form of the models tested is given in eqs. (1-5).
RS O(1) model:
RS O(1) model with logarithmic function in the factors:
RS O(2) model:
RS O(2) model with logarithmic function in the factors:
RS O(2) model with logarithmic function in the factors and responses:
After model parameters estimation, selection of the best RSM for each response was based out considering the total quadratic Sum of deviation (SoS) between observed (Ȳi) and predicted values (Yi), as shown in eq. (6). If the logarithmic function is applied to the response, the total quadratic sum of deviation assumes the form shown in eq. (7):
The first stripping stage of a SWS Unit (SWSU-1) was dynamically simulated in Aspen HYSYS® process simulator, with flowsheet shown in Figure 5.
Flowsheet of the first stripping stage simulated in Aspen HYSYS® dynamic
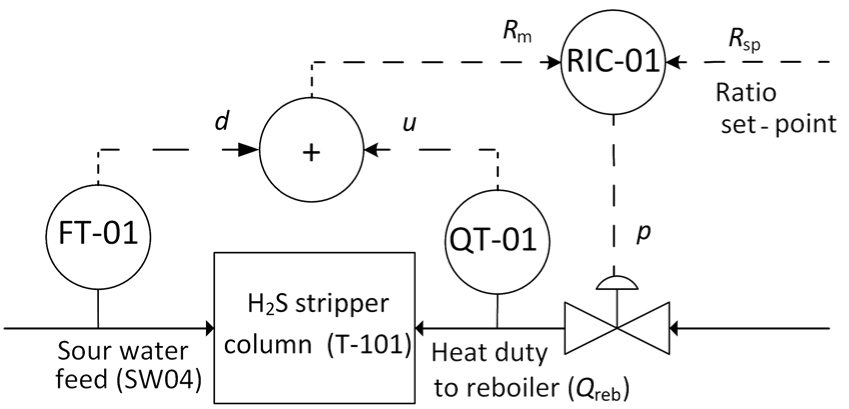
The objective of the reboiler duty control is to ensure that the H2S stripping column operates with H2S recovery greater than 90%, but without exceeding the operational limit. Typically, the steam flow to the reboiler is manipulated by a ratio control between the reboiler duty (i.e. steam flow rate) and the flowrate of sour water to the H2S stripping column, as shown in Figure 6. The H2S recovery is not a real-time measured variable, and the set-point adjustments of the ratio control are performed by operators, based on laboratory analysis. However, this control is not efficient when disturbances occur in other input variables, such as the stripping column temperature.
Ratio control for H2S stripping column reboiler duty [Rm = reboiler duty (u)/sour water flowrate (d)]
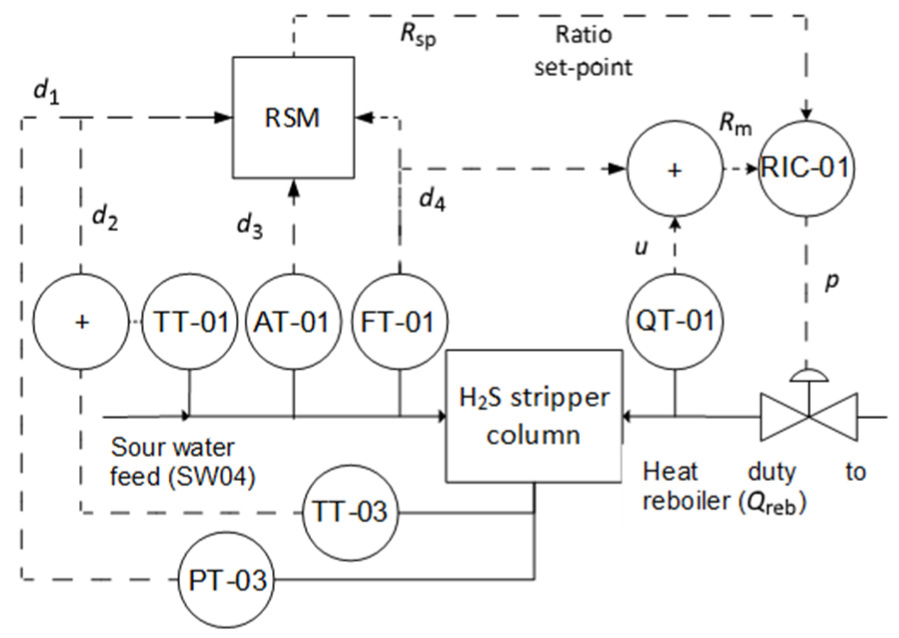
Alternatively, the proposed RS model of maximum reboiler duty was used in the dynamic simulation for generating the set-point for the ratio control, as shown in Figure 7. The advantage of this control is that it considers the main disturbances in the input variables, which are the RS model factors. The factors ‘pressure and difference between the bottom and feed column temperature’ are measured online, while the factors ‘NH3 content in the sour water stripping unit feed and H2S/NH3 in the sour water stripping unit feed’ could be measured online or made available by laboratory analysis. However, since the unit has a feed tank with high residence times, usually at least 24 hours, the composition changes are very slow. Thus, the RS model can be used even when the feed composition is not analyzed online.
RS model generating a set-point to the ratio control for reboiler duty
This section presents the main results of the parameter estimation of the Response Surface (RS) models. Results obtained by the RS models are compared with data from an industrial plant. Additionally, the control performance of RS model for response Q*reb is presented.
Table 3 shows the SoS values of RS models tested for each response. Considering SoS values shown in Table 3, the first order RS models did not adequately fit pseudo-experimental data. The pseudo-experimental data from responses Q*reb and dT*reb were best fitted by second order RS models, while, for responses
SoS values for the RS models adjusted
| SoS | |||||
|---|---|---|---|---|---|
| RS model | Q*reb | dT*reb | T*sens | ||
| RS O(1) | 14,664 | 50.00 | 6.07 × 10⁻⁵ | 0.587 | 51.20 |
| RS O(2) | 2,576 | 6.59 | 1.97 × 10⁻⁶ | 0.011 | 1.25 |
| RS O(1) with logarithmic function in the factors | 26,140 | 41.45 | 1.37 × 10⁻⁴ | 2.080 | 29.50 |
| RS O(2) with logarithmic function in the factors | 2,818 | 5.94 | 5.54 × 10⁻⁶ | 0.014 | 0.98 |
| RS O(2) with logarithmic function in the factors and response | - | - | 6.49 × 10⁻² | - | - |
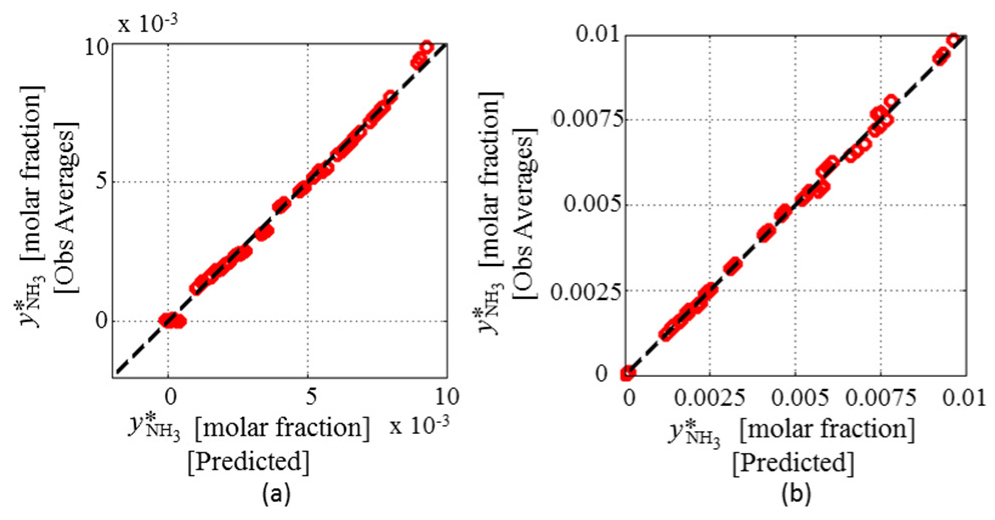
Graphics in Figure 8 show the pseudo-experimental data versus data obtained from RS models selected for these responses, where the selected RS models satisfactorily fit the pseudo-experimental data. For the response
Pseudo-experimental data versus RS models predictions: Q*ref (a);
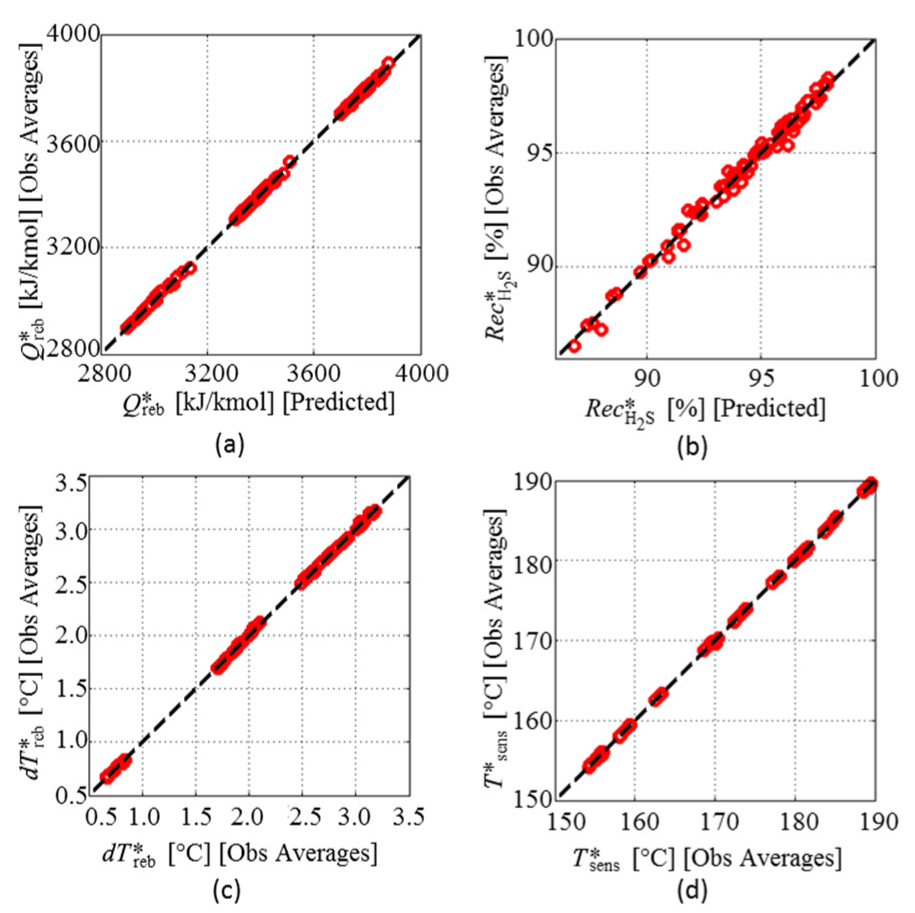
Pseudo-experimental data versus data obtained for
Thus, the RS model for responses Q*reb and dT*reb assumes the general form shown in eq. (3). Eq. (4) shows the general RS model for responses
Parameters for eqs. (8-10)
| Parameter | Value | ||||
|---|---|---|---|---|---|
| Q*reb | dT*reb | T*sens | |||
| β0 | −214.1581 | −54.8927 | −38.5585 | 0.69095 | −149.2927 |
| β1 | 12.92072 | 17.4201 | −3.01618 | −0.069157 | 28.62749 |
| β2 | 167.9344 | 15.0981 | −0.130218 | 0.047053 | 0.2818981 |
| β3 | 0.02004824 | 2.52028 | 6.77369 | 7.8734e-5 | 31.08375 |
| β4 | 86.27724 | 63.0701 | 0.0482556 | −0.009105 | 75.31365 |
| β5 | −0.1418282 | −1.2393 | 0.337921 | 0.001914 | 4.103202 |
| β6 | −25.91956 | −2.62974 | −0.00929769 | −0.014712 | 0.1022157 |
| β7 | −1.717497e-7 | −0.404415 | −0.402079 | −4.0196e-9 | −1.741923 |
| β8 | −0.06338734 | −8.30768 | −0.997239 | 0.00014313 | −9.191473 |
| β9 | 0 | −7.93498 | −0.00625166 | 0.0036349 | −0.2375542 |
| β10 | 9.898006e-5 | 0.492826 | 0.179581 | 3.0097e-006 | −0.5026822 |
| β11 | 0.184494 | −3.00288 | −0.202485 | 0.00042952 | −0.3415789 |
| β12 | 0.009780665 | 1.03976 | −0.0240886 | 9.8799e-006 | −0.1523916 |
| β13 | −3.157246 | −0.565251 | 0.0820588 | −0.0017944 | 0.375056 |
| β14 | −0.0004702 | 0.703422 | 0.624623 | 3.6763e-6 | −1.332023 |
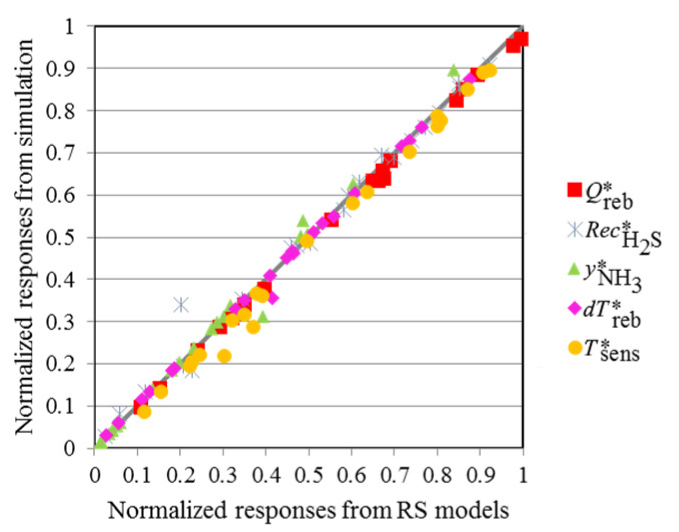
The RS models obtained were validated using a separate data set composed of 21 points for each response, also generated by simulation. The responses obtained by the RS models are presented in a normalized form and plotted against the values obtained by simulation in Aspen HYSYS® (Figure 10). The points of all the responses are very close to the diagonal line, indicating that the RS models show an excellent predictive capability.
RS models responses versus responses from Aspen HYSYS® simulation
RS models allow the estimation of process responses as a function of the selected factors, and permits a sensitivity analysis of the effect of each factor on the responses studied.
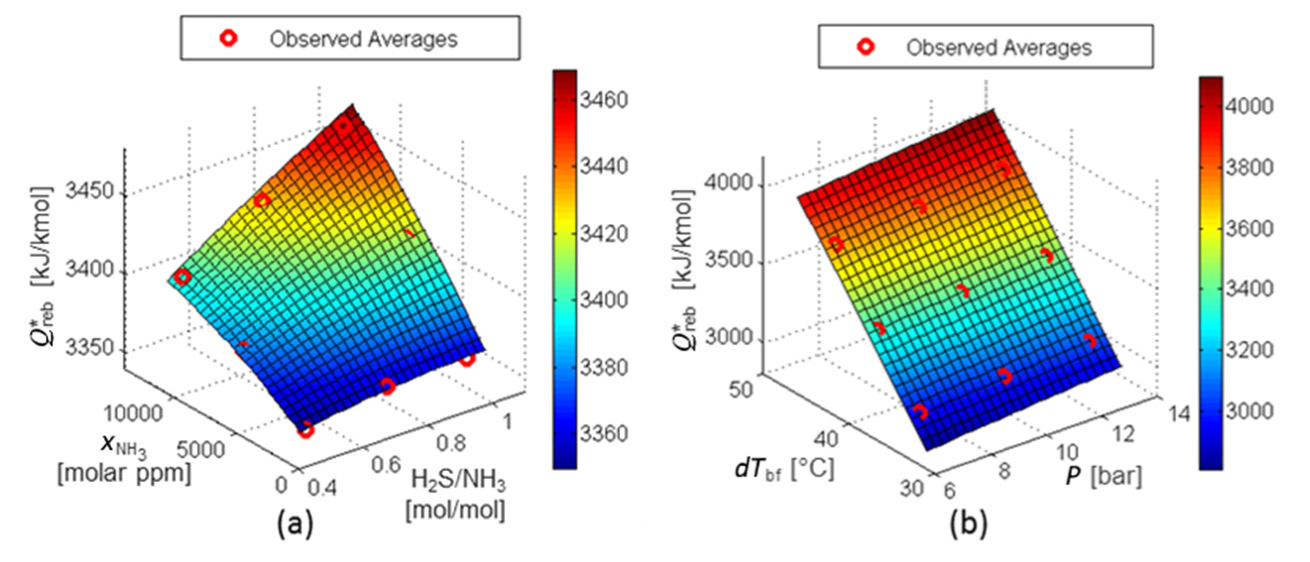
Figure 11 shows the response surfaces for Q*reb. Each surface is presented with two factors, while the remaining factors are maintained at their mean values. Figure 11a shows that the effect of the (H2S/NH3) factor on the reboiler duty at the operation limit point depends on the NH3 content in the sour water (
RS for Q*reb: factors
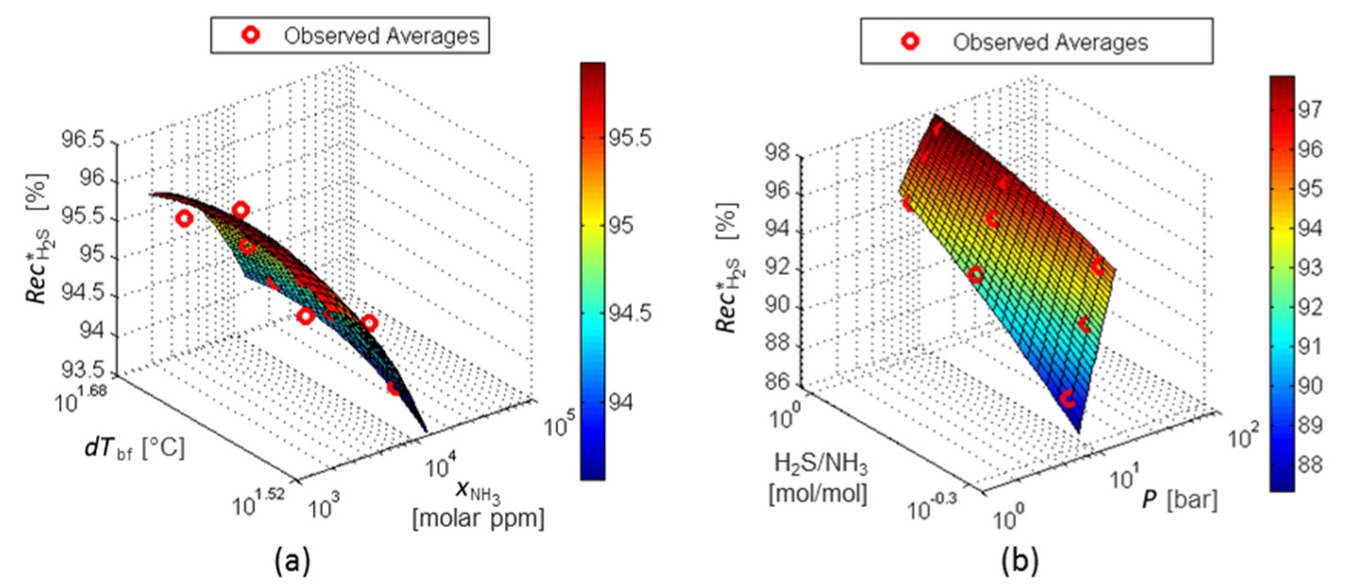
In Figure 12a, the influence of dTbf on
RS for
In Figure 13a, (H2S/NH3) has no impact on the NH3 content in the acid gas at the separation limit point (
RS for
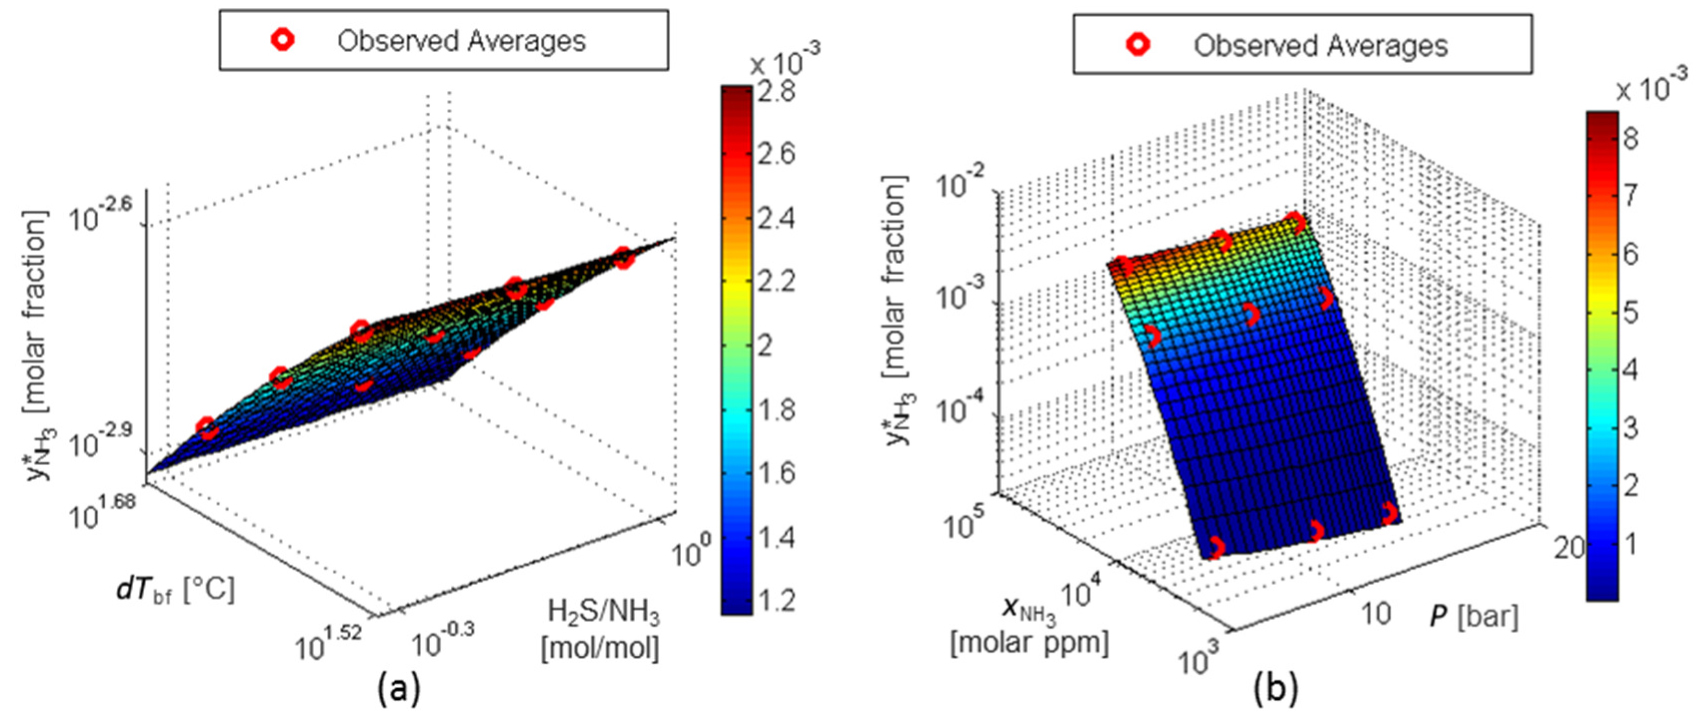
Figure 14a and Figure 14b shows that the factors (P) and (H2S/NH3) have almost no influence on response dT*reb . Otherwise, the higher the dTbf and the higher the
RS for dT*reb: factors dTbf and P (a) and factors
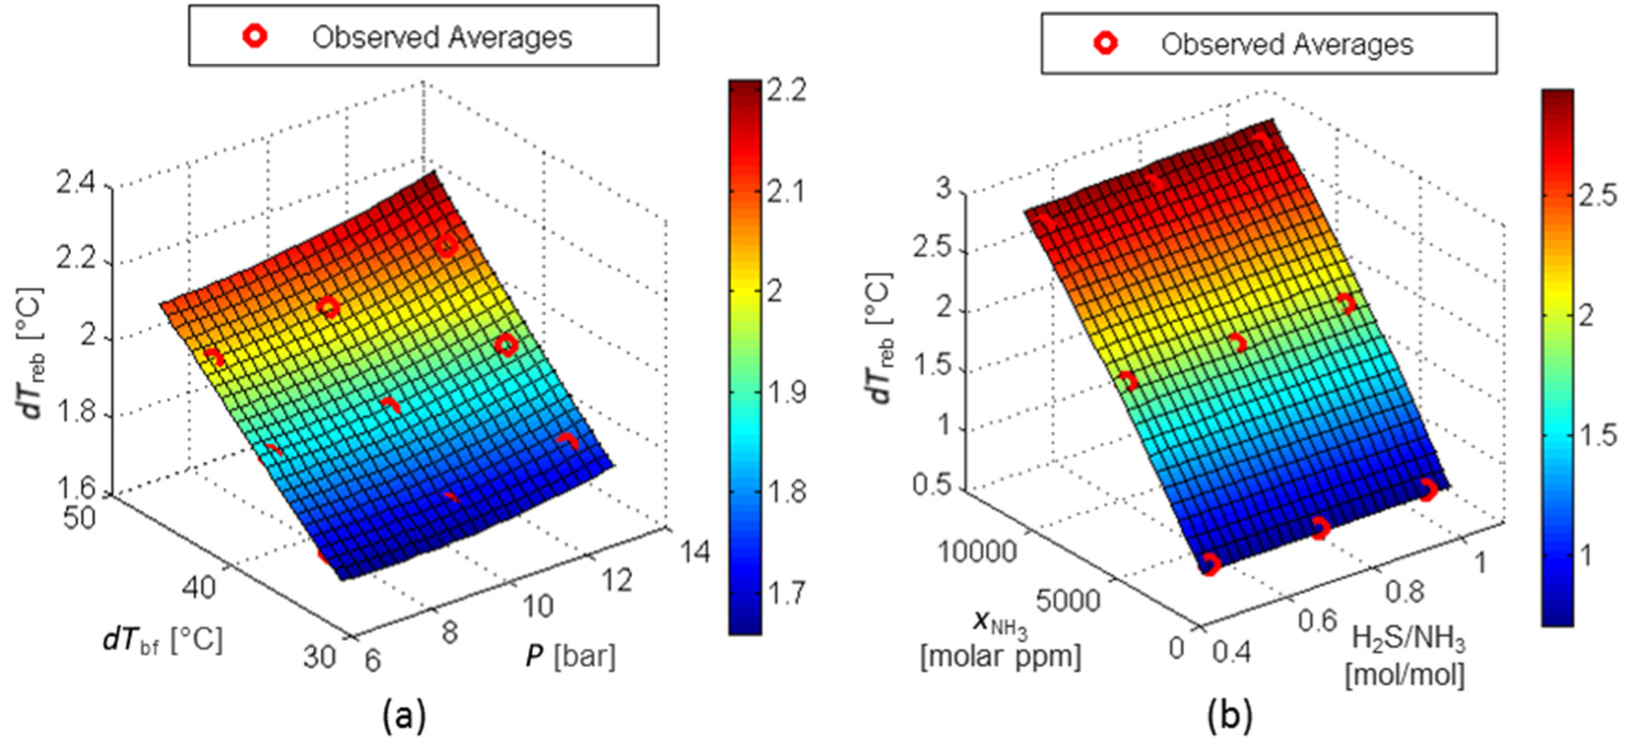
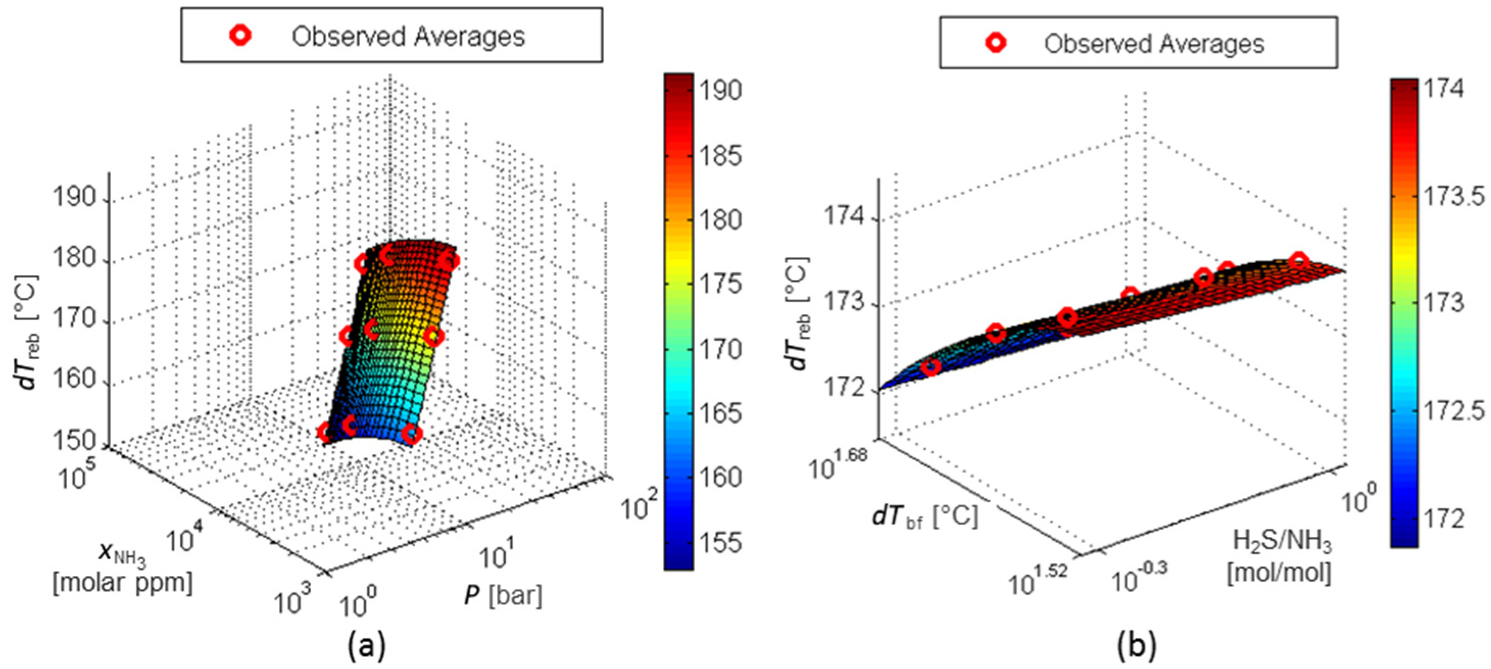
Figure 15a and Figure 15b shows that the effect of the factor (H2S/NH3) on the response T*sens is negligible and the influence of the factor dTbf is very small. Variations of the NH3 content in the sour water over the studied range can lead to variations up to 10 °C in T*sens. Nevertheless, the operating pressure is the most important factor for this response, as the higher operating pressure leads to higher sensitive stage temperatures, reaching variations up to 20 °C in the evaluated range of pressure.
RS for T*sens: factors
The results of the RS model for responses Q*reb,
Data period of the SWS plant corresponds to 65 hours of typical operation. As shown in Figure 16a, the reboiler duty from SWS plant (Qreb_plant) was under the maximum reboiler duty for normal operation provided by RS model (Q*reb). Yet, the difference between the inlet and outlet reboiler temperatures (dTreb_plant) is supposed to be larger than its value at the separation limit point obtained by RS model dT*reb. This behavior is also observed in Figure 16a. Moreover, as previously shown in Figure 4, at normal operation, the SWS top temperature is very close to the feed temperature (dTbf_plant).
RS model results compared to plant data – typical operation
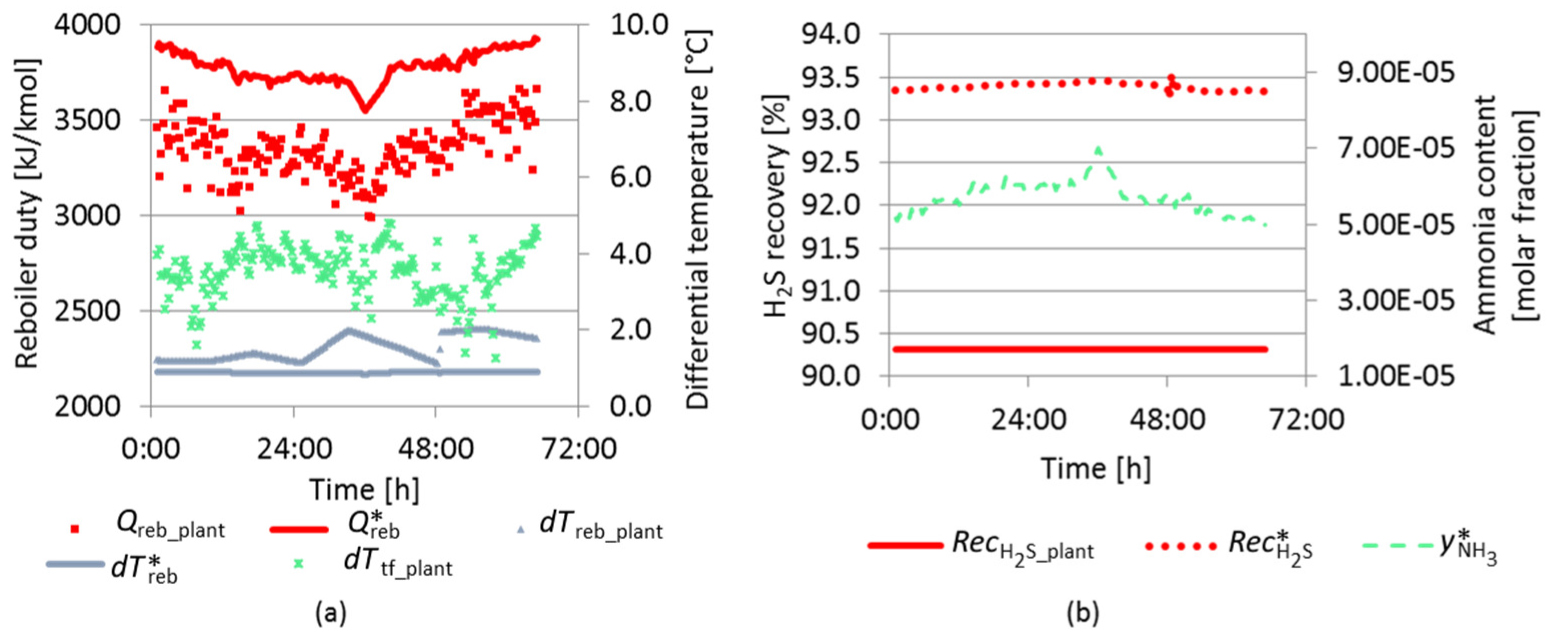
Figure 16b shows that the H2S recovery (
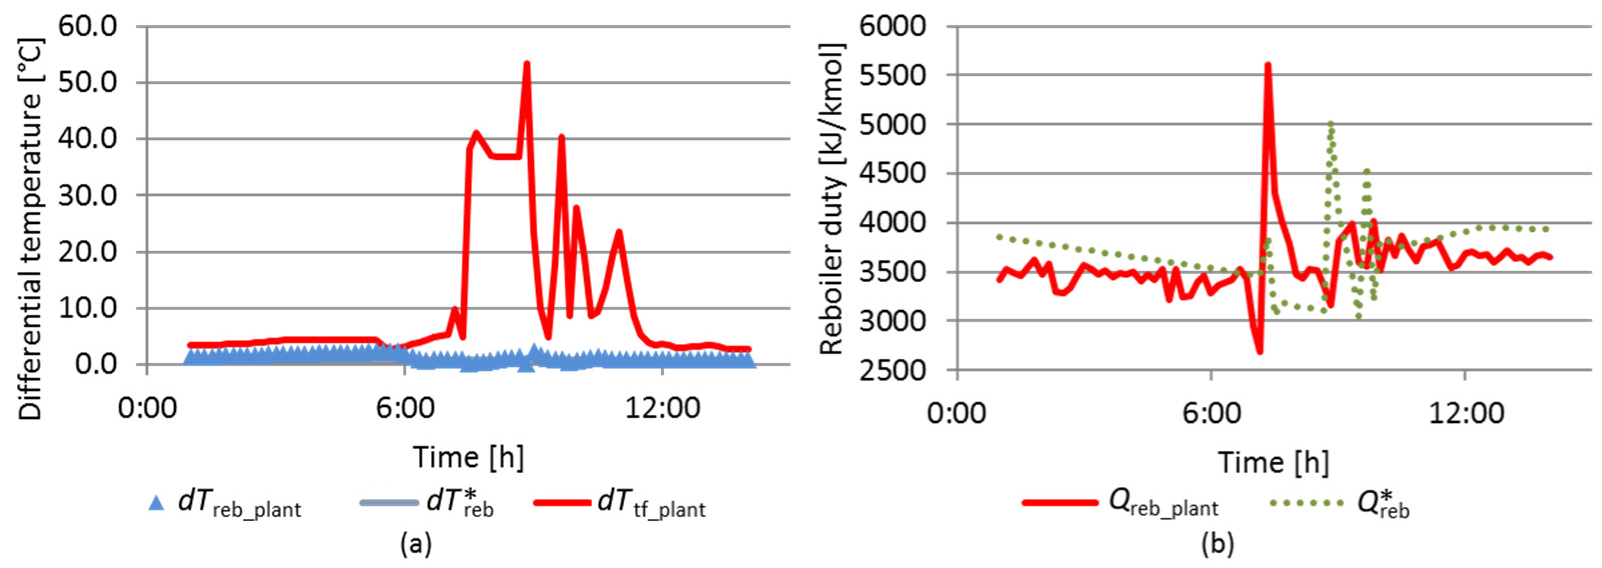
Figure 17 shows another sample of plant data achieved from a period of 14 hours when disturbances to the H2S stripper column leads to an operating condition that crosses the separation limit point. As an evidence of this situation, the difference between the top column temperature and the feed column temperature (dTbf_plant) reaches values up to 50 °C, against values around a few degrees in normal operation. During this period, the difference between the inlet and outlet reboiler temperatures (dTreb_plant) assumes nearly the limit value calculated by RS model (dT*reb) (Figure 17a). It is interesting to note that it occurs when reboiler duty from plant data became higher than the maximum reboiler duty for normal operation provided by RS model (Figure 17b). Clearly, RS model has a potential use as software-based sensor to support plant operation.
RS model results compared to plant data – disturbance
As described previously, the reboiler duty control of the H2S stripping is typically performed by a ratio control of the vapor flow to the reboiler and the sour water flow to the column (Rdf). In the dynamic simulation, the variable reboiler duty was adopted instead of the vapor flow to the reboiler, for simplicity.
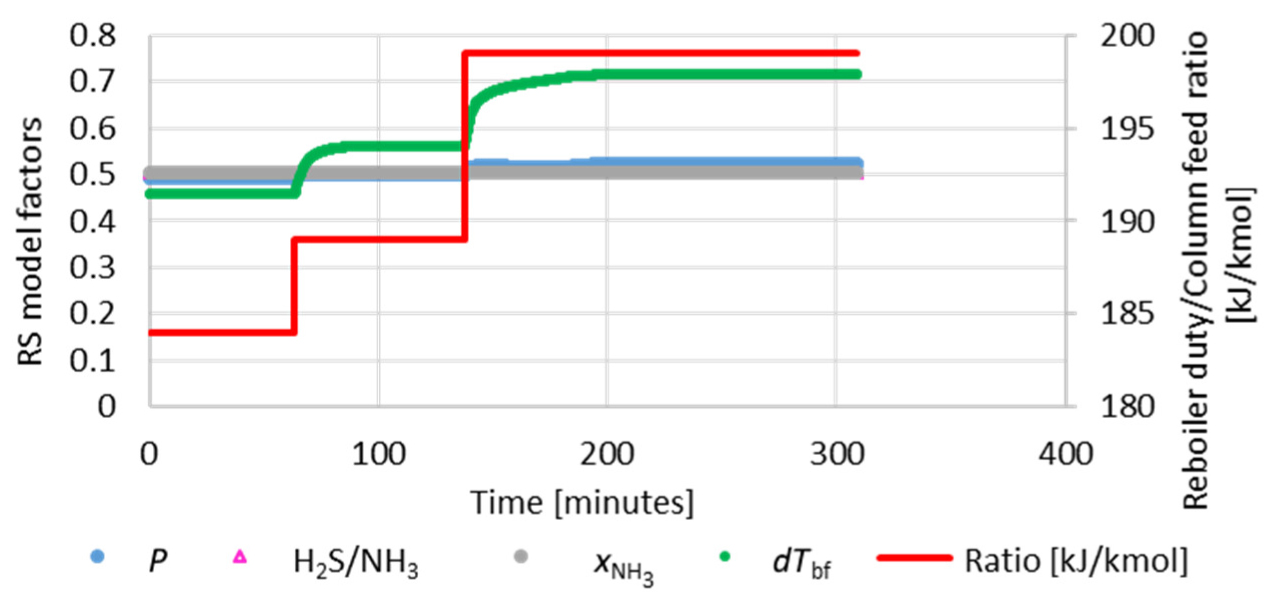
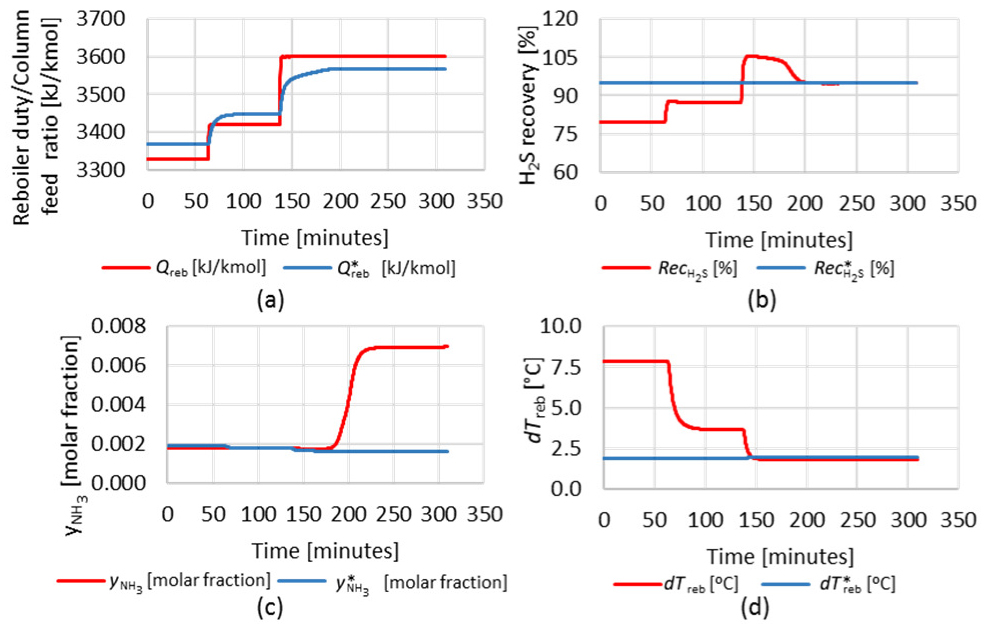
To evaluate the predictive capacity of RS models in the dynamic simulation, a sequence of two steps was performed in the set-point of the traditional ratio control (total simulation time horizon of 309 minutes). Figure 18 shows the RS model factors and the Rdf ratio. Graphics in Figure 19 show the behavior of the RS model responses and the dynamic response of the process. In the first step, Qreb is less than Q*reb, indicating that the H2S stripper column is operating under the operating limit point. In the second step, Qreb is greater than Q*reb, and the process goes through the operating limit point. At this point, the NH3 content in the acid gas (
RS model factors and ratio between reboiler duty and H2S stripper column feed
RS model responses and dynamic simulation responses: reboiler duty per molar flowrate of the sour water feed (a); H2S recovery (b); NH3 in the acid gas stream (c) and difference between the inlet and outlet reboiler temperatures (d)
Next, a sequence of three steps was performed in the set-point of the H2S stripper column feed temperature controller, +1 °C, +1 °C and −2 °C. An increase in the feed column temperature leads to a reduction in the variable dTreb. Figure 20 compares the process response in two situations, with the conventional ratio control (a) to (e), considering a total simulation time horizon of 600 minutes, and with the response surface model generating the set-point for the ratio control (f) to (j), in a total simulation time horizon of 1,000 minutes.
Traditional ratio control: RS model factors (a); steam to feed ratio (b); H2S recovery (c); NH3 in acid gas (d); differential reboiler temperature (e), RS model giving a set-point for the ratio control: RS model factors (f); steam to feed ratio (g); H2S recovery (h); NH3 in acid gas (i) and differential reboiler temperature (j)
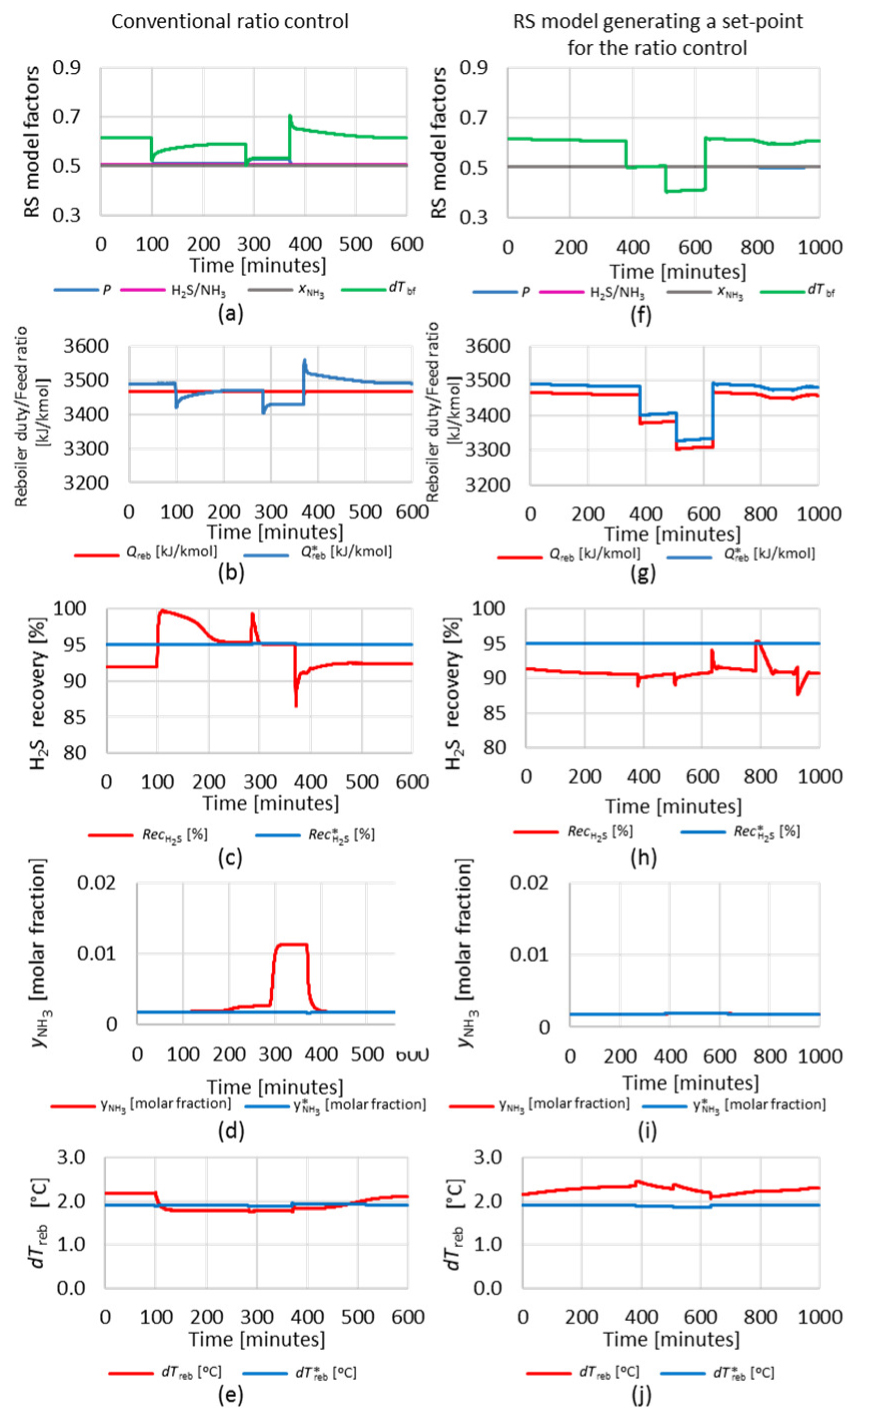
It can be observed that, as expected, the disturbance in the column feed leads to changes in the process response variables, which are not corrected by the conventional ratio control. There is no change in the variable reboiler duty (Qreb). In the second step, the process goes to a condition over the operating limit point. Therefore, a great increase in the NH3 content in the acid gas (
On the other hand, the use of the RS model to generate a set-point for the ratio control was very efficient, keeping the process stable throughout the all period of disturbances in H2S stripper column temperature. The variable Qreb was adjusted according to the value calculated by RS model (Q*reb), multiplied by a factor of 0.993, to keep the system slightly below the separation limit point. There was no significant increase in the NH3 content in the acid gas, and H2S recovery remained stable.
The new control strategy developed in this work has the potential to minimize SOx emissions in two ways. Firstly, by allowing the H2S stripper column to operate more steadily, it makes possible to operate closer to the separation limit point, with higher H2S recovery. The second way is by reducing the deviations of the acid gas from SRU to flare.
As an example of this potential of emission reduction, consider as a basis of comparison, the normal operation of a SWSU, where 90% of the H2S in the sour water feed is sent to SRU and only 10% of H2S, which is stripped in the second stage, resulting in SOx emission. The sour water flow of the base case previously described is also considered. Table 5 presents the potential of reducing SOx emissions, calculated as Sulfur dioxide (SO2), in these two situations.
SWSU emissions
| SOx emission (kg/h of SO2) | |
|---|---|
| Base – 90% H2S recovery | 52 |
| 91% H2S recovery | 47 |
| Event of acid gas deviation to flare | 525 |
The increase of one percentage point in H2S recovery implies in a 10% reduction in SOx emissions. When the deviation of the acid gas to flare occurs, the entire H2S inventory of the SWSU becomes SO2 emission. Thus, a control strategy that allows more stable operation of the plant has the potential for reduction of SOx emissions.
This work uses the RS method to obtain empirical models for responses of interest to the first stripping stage of a two-stage SWS unit, as a function of its main inputs (factors). The main objective of these models is to infer the separation limit point of the H2S stripping column, adequately predicting process responses. Also, comparisons with a real plant data shows that the RS models can adequately characterize the separation limit point.
Additionally, the RS model developed for the estimation of the reboiler duty at the separation limit point (Q*reb) was used in the dynamic process model to generate a set-point for the reboiler duty ratio controller. This new controller configuration showed excellent results to control the process under disturbances in the temperature of the H2S stripper column feed. Also, the new control strategy has the potential to minimize SOx emissions, by allowing the H2S stripper column to operate more stably. Therefore, it is possible to operate closer to the separation limit point, with a higher H2S recovery and to reduce the deviations of the acid gas from SRU to flare.
- ,
Retrofit of Sour Water Networks in Oil Refineries: A Case Study ,Chemical Engineering and Processing: Process Intensification , Vol. 48 (4), :892-9012009, https://doi.org/10.1016/j.cep.2008.12.002 - ,
Troubleshooting and Solving a Sour-water Stripper Problem ,Chemical Engineering (United States) , Vol. 120 (11), :28-342013 - , Treatment of Oilfield and Refinery Wastes, Waste Treatment in the Process Industries, 2006
- ,
Development of a Novel Processing System for Efficient Sour Water Stripping ,Energy , Vol. 125 , :449-4582017, https://doi.org/10.1016/j.energy.2017.02.135 - ,
Stripping Phenolic Water ,Sulphur , Vol. 344 (February), :1-42013 - ,
Fine Tune the Design of Sour-water Strippers using Rate-based Simulation ,Chemical Engineering (United States) , Vol. 121 (6), :42-462014 - ,
An Automated Environmental and Economic Evaluation Methodology for the Optimization of a Sour Water Stripping Plant ,Journal of Cleaner Production , Vol. 44 , :56-682013, https://doi.org/10.1016/j.jclepro.2012.12.002 - ,
Designing for Sulphur Removal and Storage: Part I ‒ Selection of Technologies for the Sulphur Block must Serve Legislative Demands and the Efficient Operation of Upstream Processes ,Petroleum Technology Quarterly , (Q2), 75-842010 - ,
Treatment Technologies for Petroleum Refinery Effluents: A Review ,Process Safety and Environmental Protection , Vol. 89 (2), :95-1052011, https://doi.org/10.1016/j.psep.2010.11.003 - ,
Improvement in Steam Stripping of Sour Water Through an Industrial-scale Simulation ,Korean Journal of Chemical Engineering , Vol. 21 (3), :549-5552004, https://doi.org/10.1007/BF02705486 - ,
Dynamic Simulation of the Sour Water Stripping Process and Modified Structure for Effective Pressure Control ,Chemical Engineering Research and Design , Vol. 80 (2), :167-1772002, https://doi.org/10.1205/026387602753501889 - ,
Enhancing Abnormal Events Management by the use of Quantitative Process Hazards Analysis Results ,Industrial and Engineering Chemistry Research , Vol. 48 (8), :3921-39332009, https://doi.org/10.1021/ie800405n - ,
Process Developed for Enhanced H2S Recovery from Sour-water Strippers ,Oil and Gas Journal , Vol. 107 (18), :44-492009 - ,
Processing NH3 Acid Gas in a Sulphur Recovery Unit ,Gas , (x), 1-122010 - , Hydrocraking – A Way to Produce High Quality Low Sulphur Middle Distillates, Proceedings of the 17th World Petroleum Congress, 2002
- , Nitrogênio Nos Petróleos Brasileiros: Estudo Sobre A Distribuição Em Cortes, Proceedings of the Rio Oil & Gas Expo and Conference, 2016
- ,
Processing High-Ammonia Acid Gas in a SRU’s , - , , Gas Purification, 1997
- , Conselho Nacional do Meio Ambiente (CONAMA), Resolution number 436, Official Journal of the Union, 2011
- ,
Sour Water Stripping Part 3: WWT Technology , - ,
Advances in Surrogate Based Modeling, Feasibility Analysis, and Optimization: A Review ,Computers and Chemical Engineering , Vol. 108 , :250-2672018, https://doi.org/10.1016/j.compchemeng.2017.09.017 - ,
Large Scale Optimization of a Sour Water Stripping Plant using Surrogate Models ,Computers & Chemical Engineering , Vol. 92 , :143-1622016, https://doi.org/10.1016/j.compchemeng.2016.04.039 - ,
Response Surface Methodology (RSM) as a Tool for Optimization in Analytical Chemistry ,Talanta , Vol. 76 (5), :965-9772008, https://doi.org/10.1016/j.talanta.2008.05.019