


Energy demand is globally increasing, the building sector being responsible for almost 40% in the European Union [1]. Less than two year remains until the entry into force of the provisions of the European Directive on the energy performance in buildings for all the new buildings, the new public buildings being already addressed by this Directive since 1st of January 2019 [1]. Renewable based energy mixes should be implemented in the energy efficient built environment to reach the imposed Nearly Zero Energy Status following an algorithm addressing as main steps: the evaluation of the energy demand, applying measures to reduce this energy demand, evaluation of the renewable potential of the implementation site, assessment of the available surfaces to install the renewable based energy systems, etc. [2]. A continuous growth is reported on newly implemented renewable energy systems worldwide, solar hot water capacity increasing to 456 GWth in 2016, coming in fourth place after hydropower (1,096 GW), bio power (504 GW) and wind power (487 GW) capacities [3]. Important advancement in the power sector (hydro-, bio-, wind- and solar energy based) is reported also regionally, e.g. inJapan aiming at a power grid supplied 100% by renewable energy [4], followed by cogeneration heat and power plant as reported in Katulic et al. [5], solar/geothermal based thermal energy systems implemented starting from individual buildings up to district scale for space heating [6] and associated services [7] or combined space heating and cooling [8]. Also, the share of biofuels use in transport sector is increasing, new types (e.g. biobutanol) being proposed as a potential sustainable biofuel [9], despite the controversial debate of biofuels versus food competition [10]. Space heating represents the largest share in the energy demand of the built environment in temperate and cold climates [11], thus the use of solar thermal collectors to convert solar into thermal energy for space heating, and for domestic hot water production, represents a challenge in these climates because the number of sunshine hours is rather low during the cold seasons, when heating is needed [12]. One solution consists of developing and implementation of evacuated tube solar thermal collectors providing better yearly thermal energy output with up to 33% in comparison with flat plate solar thermal collectors [13]. Additionally, during sunny winter days, the solar elevation angle is low, thus, for optimally tilted solar thermal collectors (considering the full year) the received solar energy is further decreased. To compensate for these drawbacks, the number of solar thermal collectors must be increased, however, this large conversion surface generates significant problems during summer due to stagnation and overheating. Various solutions to tackle this problem are reported in literature, one of these being the use of vertically installed solar thermal collectors, on the so-called solar thermal facades [14]. Technical limitations occur in these cases, as the shape and size of the available space on the building facade optimally oriented and its colour [15]. Several studies can be found in literature, addressing the possible solutions to implement the solar thermal collectors in the buildings facades [16], [17], numerical simulations of solar thermal facades [18] as well as experimental assessment of their performances but only for a few numbers of days [19].
New solar thermal collectors with nonrectangular shapes and different colours (red, blue, green) [20] were developed in the Renewable Energy Systems and Recycling Research Centre (RESREC), part of the R&D Institute of the Transilvania University of Brasov, Romania. The nonrectangular shape (trapeze) and relatively small size (0.63 m2) of the novel solar thermal collectors were chosen to increase the coverage of the building’s facades, e.g. 218% [21] and, along with nonconventional colours (red, blue, green, etc.), to improve the architectural acceptance of solar facades [22]. Experimental optimization was done on these novel flat plate solar thermal collectors based on an indoor testing rig [23]. After indoor performance assessment, a black coloured demonstrator was implemented on the southern facade of an outdoor testing rig to evaluate its infield conversion efficiency along with a commercial (rectangular, 2.1 m2) flat plate solar thermal collector used as a reference [24]. Further, other various coloured solar thermal collectors were developed at demonstrator level, vertically installed on the southern facade of the outdoor testing rig and their performances (thermal power output, specific thermal energy output, conversion efficiency) have been experimentally assessed. The results for an entire year (2017) are discussed in this paper for the trapeze and commercial solar thermal collectors installed on a southern oriented facade.
The efficiency of the solar thermal facade with nine trapeze and one commercial flat plate solar thermal collectors is obtained based on measured values during year 2017 using:
(1)
where the specific thermal energy of the solar thermal facade (Et) is calculated using:
(2)
The thermal power of the solar thermal facade (Pt) is calculated using:
(3)
where ṁ [kg/s] is the measured mass flow rate of the fluid through the solar thermal collector, c [J/kg°C] is the specific heat at constant pressure of the antifreeze thermal fluid, t i,to [°C] are the measured solar thermal collector inlet/outlet temperatures, Sa [m2] is the absorber area of the solar thermal collector.
The solar energy received by the solar thermal facade (Es) is calculated with:
(4)
where Gn is the global solar irradiance received by the solar thermal facade calculated with:
(5)
where Bn is the direct solar irradiance received by the solar thermal facade, calculated with:
(6)
The available direct solar irradiance (B) is onsite measured with a sample rate of one per minute.
The incidence angle (ν) is calculated based on the pairs of altitude and azimuth angles defining the solar ray direction (α and () and the normal to the solar thermal collector (αn and (n) with:
(7)
The solar altitude angle (α) and solar azimuth angle (() vary with the Earth declination ((), site latitude (() and hour angle (ω), all of them being calculated with well-known equations as in [25], [26].
Dn is the diffuse solar irradiance received by the solar facade, calculated using:
(8)
where Dh is the measured horizontal diffuse solar irradiance and αn is the altitude angle of the solar façade.
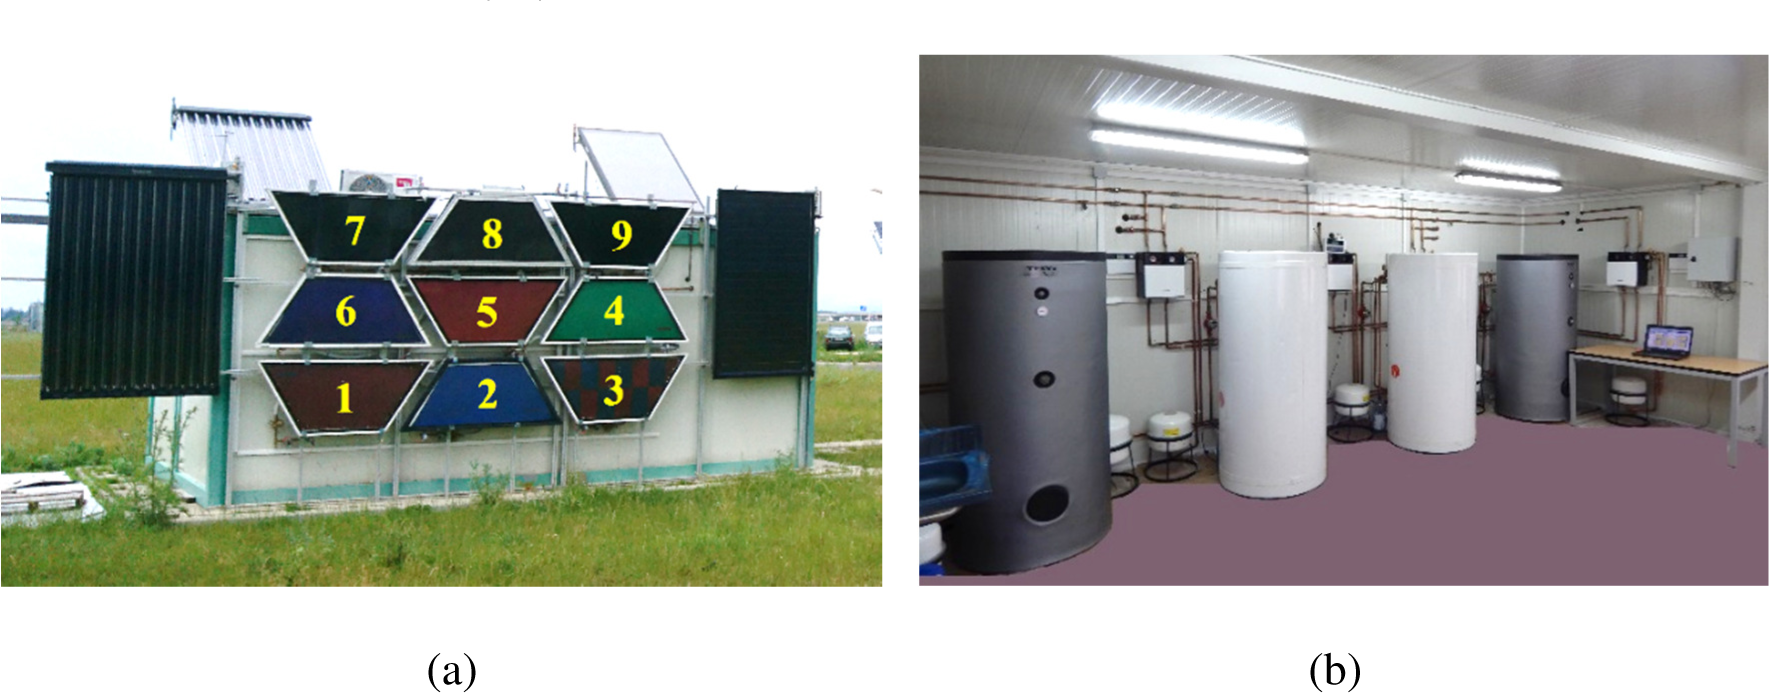
A new Research and Development Institute was developed in the Transilvania University of Brasov, Romania with a complex research infrastructure focusing on renewable energy systems implemented in the energy efficient built environment. An outdoor testing rig for solar thermal collectors was developed particularly for facade’s integration of the novel flat plate solar thermal collectors with trapeze shapes and various absorber colours. The outdoor testing rig allows the implementation of solar thermal collectors on the southern facade as well as on the other facades (E or W) and on the rooftop (Figure 1a). Identical storage tanks for domestic hot water, controllers and the monitoring systems are installed inside the outdoor testing rig (Figure 1b). The solar thermal collectors can be individually connected to the storage tanks or can be grouped and interconnected serially or in parallel, to evaluate their conversion efficiency. The entire system is monitored: the volumetric flow rate is measured in each circuit and each solar thermal collector is equipped with temperature sensors at the inlet and outlet connections, allowing thus to evaluate the thermal output. Nine flat plate solar collectors with trapeze shape, small size (0.63 m2) and various colours (black, blue, green, red, etc.) are installed on the southern facade along with two commercial (a rectangular flat plate and an evacuated tubes) solar thermal collectors. Two similar commercial collectors are installed on the rooftop, at a yearly optimal tilt angle of 35°. The trapeze collectors 1...3 and 4…6 are serially connected to individual storage tanks and 7…9 are connected in parallel to another storage tank for preliminary testing. The commercial solar thermal collectors are grouped by type and connected to separate storage tanks.
Outdoor testing rig for solar thermal collectors: exterior view (a), storage tanks, controllers and monitoring system (b)
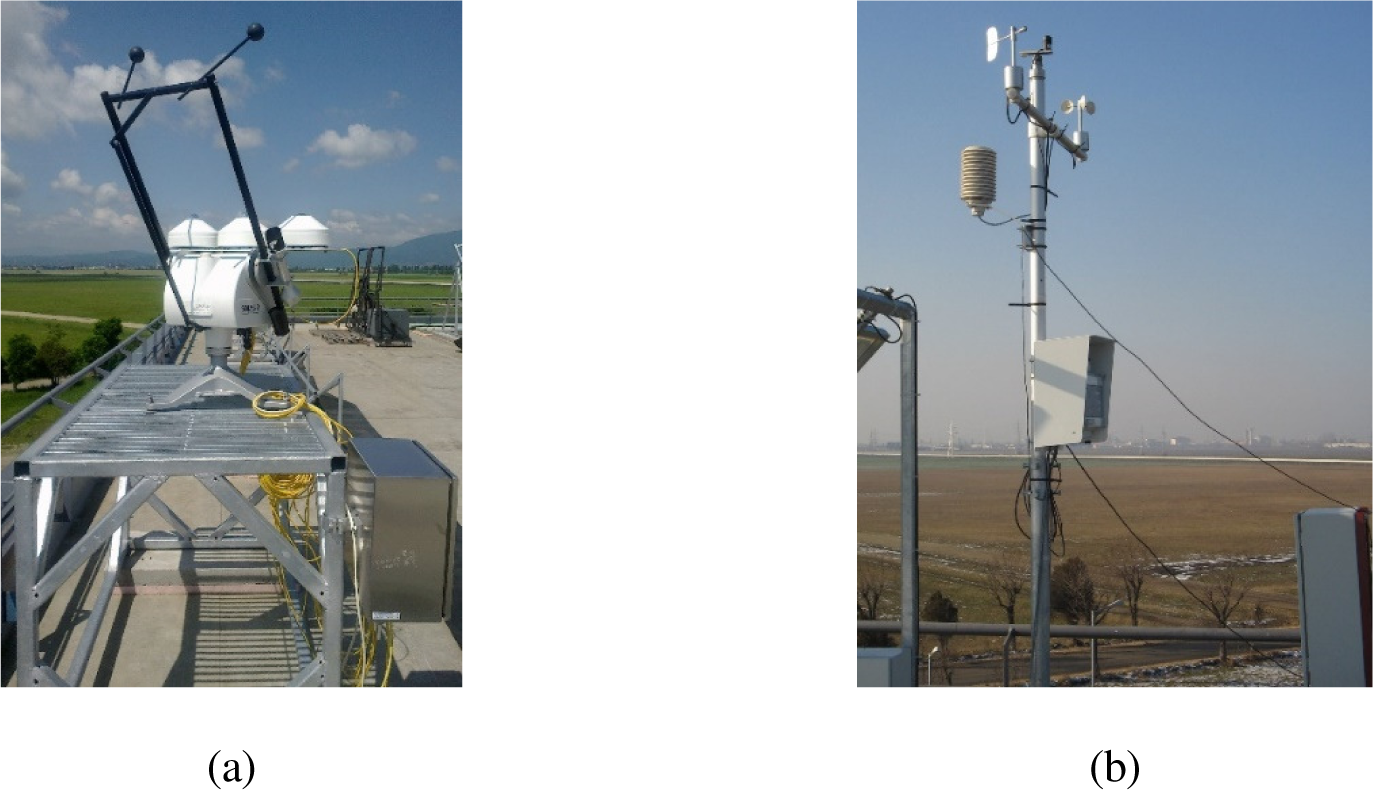
A Kipp & Zonen Solys 2 Sun Tracker (Figure 2a) and a DeltaT weather station (Figure 2b) are installed on the RESREC building rooftop, nearby the outdoor testing rig for solar thermal collectors. The Sun Tracker is equipped with a CHP1 pyrheliometer (1% accuracy) measuring the direct solar irradiance (B), a CMP22 pyranometer (0.5% accuracy) measuring the horizontal global solar irradiance (Gh) and a shadowed CMP22 pyranometer measuring the horizontal diffuse solar irradiance (Dh). The weather station is equipped with a RHT2 sensor (±0.1 °C temperature precision and 2% RH accuracy) measuring the outdoor air temperature and relative humidity, an AN4 anemometer (±0.5 m/s accuracy) measuring the wind speed, a WD4 wind vane (±2% accuracy) measuring the wind direction and a RG2 rain gauge (±2% accuracy) for precipitation. Data are continuously monitored at a sample rate of 1 per minute and stored in local data loggers wherefrom they are downloaded monthly to a database developed on a personal computer.
Meteorological parameters monitoring system: Solys2 Sun tracker weather station (a) and DeltaT weather station (b) installed on the laboratory rooftop
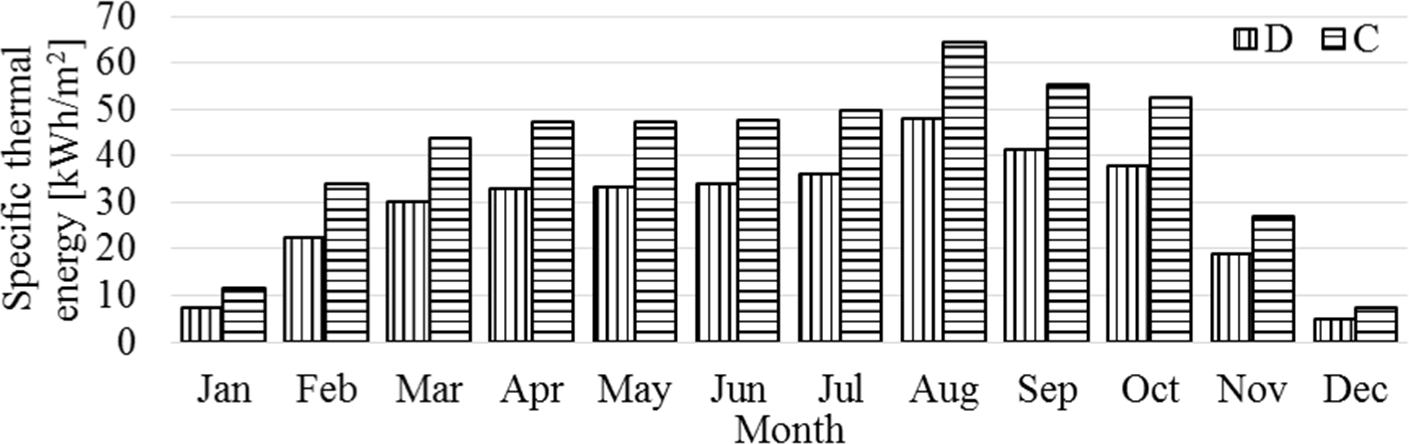
The data monitored during the entire year 2017 were processed based on the measured values: beam solar irradiance and diffuse solar irradiance in the horizontal plane, flow rate, inlet and outlet temperature for each solar thermal collector, the nine trapeze demonstrators (D) solar thermal collectors produced 1,969 kWh/year during 2017, representing 347.27 kWh/m2/year while the commercial (C) solar thermal collector produced 1,023 kWh/year representing 487.14 kWh/m2/year. Thus, the specific thermal energy of the trapeze collectors is 28.71% lower than that of the commercial collector. The thermal energy was used to prepare domestic hot water. The monthly specific thermal energy produced by the two types of solar thermal collectors implemented on the southern facade of the outdoor testing rig are plotted comparatively in Figure 3. The results show an even distribution covering the summer and transition months (March – October), thus avoiding the overheating issue during the summer months, it is to be mentioned that during February and November also a significant specific thermal energy output was registered.
Monthly specific thermal energy produced by the novel demonstrators (D) having trapeze shape and by the commercial (C) solar thermal collector
The solar energy received in the vertical plane of the solar thermal facade was calculated based on the onsite measured direct (B) and horizontal diffuse (Dh) solar irradiance and the monthly received solar energy values are plotted in Figure 4. The yearly received solar energy reaches a total value of 808 kWh/m2. The beneficial effect of lower altitude solar angle is observed during the January and February winter months, this effect is not evidenced in November and December because of the fewer sunny days in these months (four sunny days in November and only one partial sunny day in December).
Monthly received solar energy calculated based on onsite measured solar irradiance and monthly mean outdoor air temperature
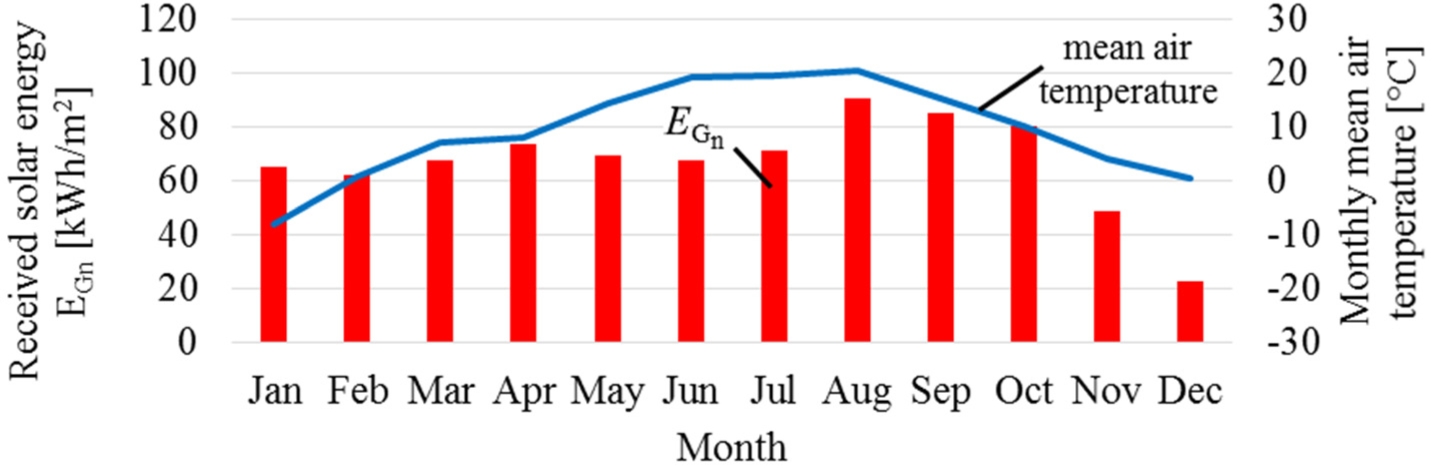
The variation of the monthly efficiency in the solar thermal conversion over the year 2017 is presented in Table 1 for the entire set of nine trapeze demonstrators (D) and for the commercial (C) solar thermal collector does not accurately follow the amount of input solar energy (Figure 4). The main reason is related to the outdoor temperature, which was as low as –24.5 °C during January with an average temperature of −7.8 °C compared to December, when the lowest temperature was −8.4 °C and the average temperature was 0.67 °C. As result, despite the fact that the solar energy received in January (65.6 kWh/m2) was almost three times higher than in December (22.9 kWh/m2), the thermal energy output in January (7.4 kWh/m2) is only 1.5 times higher than in December (4.87 kWh/m2). Similar results are obtained for the commercial solar collector (11.44 kWh/m2 in January and 7.42 kWh/m2 in December, resulting a ratio of 1.54).
The monthly efficiency of the trapeze demonstrators shows, as expected, lower values than the commercial solar thermal collector, due to its higher perimeter to area ratio of each collector that generates larger heat losses in the trapeze demonstrator [23]. Of course, this drawback can be reduced by optimizing the design of the trapeze demonstrator. Even so, the efficiency losses can be compensated by the increased area of the building’s facades which can be covered by trapeze solar thermal collectors in comparison with larger, commercial ones. Considering the example given in Visa et al. [24], where on the southern facade of a residential building only three commercial solar thermal collector can be installed (7.11 m2) and by using trapeze demonstrators, the surface of the solar facade can be increased to 15.47 m2. The yearly thermal energy output, calculated based on the specific thermal energy output obtained in 2017, will be of 3,464 kWh/year for commercial solar thermal collectors, and 5,373 kWh/year for trapeze demonstrators. That means a gain of 55% in thermal energy and increased architectural acceptance of the solar collectors on the building’s facades.
Monthly efficiency of the nine trapeze demonstrators (D) and one commercial (C) vertically installed solar thermal collectors
| Collector type | Monthly efficiency of the solar thermal collector | |||||||||||
|---|---|---|---|---|---|---|---|---|---|---|---|---|
| Jan. | Feb. | Mar. | Apr. | May | Jun. | Jul. | Aug. | Sep. | Oct. | Nov. | Dec. | |
| D | 0.11 | 0.36 | 0.44 | 0.45 | 0.48 | 0.50 | 0.50 | 0.53 | 0.48 | 0.47 | 0.39 | 0.21 |
| C | 0.17 | 0.54 | 0.65 | 0.64 | 0.68 | 0.70 | 0.69 | 0.71 | 0.65 | 0.65 | 0.56 | 0.32 |
A solar thermal facade consisting of nine novel flat plate solar thermal collectors with trapezoidal shape and various colours is described in the paper. This solar thermal system is a part of a complex research infrastructure developed in the RESREC of the Transilvania University of Brasov, Romania. The monthly specific thermal energy output and efficiency of the trapezoidal solar thermal collectors, obtained based experimental values, are presented comparatively with a commercial (rectangular) flat plate solar thermal collector. During 2017, the nine trapezoidal solar collectors (with a total area of 5.67 m2) produced 1,969 kWh of thermal energy to prepare domestic hot water, while the commercial solar collector (with an area of 2.1 m2) has a thermal energy output of 1,023 kWh/year.
Comparing the specific thermal energy output, 347.27 kWh/m2/year in the case of trapezoidal demonstrators, and 487.14 kWh/m2/year for commercial collector, results that the trapezoidal demonstrators have a specific energy output 28.72% lower than commercial one.
This disadvantage could be reduced, eliminated or even transformed into a gain by increasing the covered surface of a given building’s facades with the new trapezoidal solar thermal collector (e.g. a gain of 55% in thermal energy output as presented in the paper).
The results show that the thermal output depends not only on the amount of solar radiation but also it strongly depends in the cold season on the average outdoor air temperature. As example, for trapezoidal demonstrators, in December, with an average outdoor air temperature of 0.67 °C and a received solar energy of 22.92 kWh/m2, the thermal energy output was 4.87 kWh/m2 resulting a monthly efficiency of 0.21, in January, with an average outdoor air temperature of −7.8 °C and a received solar energy of 65.62 kWh/m2, the thermal energy output was 7.40 kWh/m2 resulting a monthly efficiency of 0.11.
The type of connections between the collectors (serial/parallel), the number of the solar collectors connected in serial/parallel and their colour influence on the thermal energy production and on their efficiency will be further investigated using the research infrastructure of this complex.
| B | available direct solar irradiance | [W/m2] |
| Bn | direct solar irradiance received by the solar thermal collector | [W/m2] |
| c | specific heat at constant pressure of the thermal fluid | [J/kg°C] |
| Dh | infield measured diffuse horizontal solar irradiance | [W/m2] |
| Dn | diffuse solar irradiance received by the solar thermal collector | [W/m2] |
| Es | solar energy received by the solar thermal collector | [kWh/m2] |
| Et | specific thermal output of each solar thermal collector | [kWh/m2] |
| Gh | infield measured global horizontal solar irradiance | [W/m2] |
| Gn | global solar irradiance received by the solar thermal collector | [W/m2] |
| ṁ | mass flow rate of the fluid through the solar thermal collector | [kg/s] |
| Pt | thermal power of solar thermal collector | [W] |
| Sa | solar thermal collector absorber area | [m2] |
| ti | solar thermal collector inlet temperature | [°C] |
| to | solar thermal collector outlet temperature | [°C] |
| α | solar altitude angle | [°] |
| αn | solar thermal collector altitude angle | [°] |
| δ | Earth declination | [°] |
| η | solar thermal collector efficiency | [-] |
| ϕ | latitude | [°] |
| ν | incidence angle | [°] |
| ω | hour angle | [°] |
| ψ | solar azimuthal angle | [°] |
| ψn | solar thermal collector azimuthal angle | [°] |
- , Directive 2010/31/EU on the Energy Performance of Buildings, Official Journal of the European Union, 2010
- ,
Improving the Renewable Energy Mix in a Building Towards the Nearly Zero Energy Status ,Energy and Buildings , Vol. 68 (Part A),pp 72-78 , 2014, https://doi.org/https://doi.org/10.1016/j.enbuild.2013.09.023 - , , Renewables 2017, Global Status of Renewables, 2017
- ,
Operation Strategy for a Power Grid Supplied by 100% Renewable Energy at a Cold Region in Japan ,Journal of Sustainable Development of Energy, Water and Environment Systems , Vol. 2 (3),pp 270-283 , 2014, https://doi.org/https://doi.org/10.13044/j.sdewes.2014.02.0022 - , Optimization of Cogeneration Power Plant Operation Coupled with Heat Storage Tank Used for District Heating of Zagreb Area, Croatia, Proceedings of the 7th Dubrovnik Conference on Sustainable Development of Energy, Water and Environment Systems, 2012
- ,
Performance Analysis of a Hybrid District Heating System: A Case Study of a Small Town in Croatia ,Journal of Sustainable Development of Energy, Water and Environment Systems , Vol. 3 (3),pp 282-302 , 2015, https://doi.org/https://doi.org/10.13044/j.sdewes.2015.03.0022 - ,
Future Services for District Heating Solutions in Residential Districts ,Journal of Sustainable Development of Energy, Water and Environment Systems , Vol. 2 (2),pp 127-138 , 2014, https://doi.org/https://doi.org/10.13044/j.sdewes.2014.02.0012 - ,
Possibility of Heat Pump use in Hot Water Supply Systems ,Journal of Sustainable Development of Energy, Water and Environment Systems , Vol. 4 (3),pp 203-215 , 2016, https://doi.org/https://doi.org/10.1387/ausart.15960 - ,
Biobutanol as a Potential Sustainable Biofuel ‒ Assessment of Lignocellulosic and Waste-based Feedstocks ,Journal of Sustainable Development of Energy, Water and Environment Systems , Vol. 1 (2),pp 58-77 , 2013, https://doi.org/https://doi.org/10.13044/j.sdewes.2013.01.0005 - ,
A Pathway to Energy and Food Security with Biodiesel ,Journal of Sustainable Development of Energy, Water and Environment Systems , Vol. 4 (3),pp 242-261 , 2016, https://doi.org/https://doi.org/10.13044/j.sdewes.2016.04.0020 - ,
Modelling and Control of Collecting Solar Energy for Heating Houses in Norway ,Journal of Sustainable Development of Energy, Water and Environment Systems , Vol. 5 (3),pp 359-376 , 2017, https://doi.org/https://doi.org/10.13044/j.sdewes.d5.0147 - ,
Future Trends for Solar Energy Use in Nearly Zero Energy Buildings ,Advances in Solar Heating and Cooling ,pp 547-569 , 2016, https://doi.org/https://doi.org/10.1016/B978-0-08-100301-5.00020-5 - ,
Comparison of the Energy Performance Between Flat-plate and Heat Pipe Evacuated Tube Collectors for Solar Water Heating Systems under Mediterranean Climate Conditions ,Journal of Sustainable Development of Energy, Water and Environment Systems , Vol. 7 (1),pp 87-100 , 2019, https://doi.org/https://doi.org/10.13044/j.sdewes.d6.0228 - , Novel Solar-Thermal Collectors/Array with Increased Architectural Acceptance for Building Integration, in:, Building Integration of Solar Thermal Systems Design and Applications Handbook, 2017
- ,
Towards an Improved Architectural Quality of Building Integrated Solar Thermal Systems (BISTS) ,Solar Energy , Vol. 81 (9),pp 1104-1116 , 2007, https://doi.org/https://doi.org/10.1055/s-2007-991206 - ,
Review and Analysis of Solar Thermal Facades ,Solar Energy , Vol. 135 ,pp 408-422 , 2016, https://doi.org/https://doi.org/10.1016/j.solener.2016.06.006 - ,
Solar Facades: A Review ,Building and Environment , Vol. 91 ,pp 152-165 , 2015, https://doi.org/https://doi.org/10.1016/j.buildenv.2015.01.007 - ,
Building-Facade Integrated Solar Thermal Collectors: Energy-Economic Performance and Indoor Comfort Simulation Model of a Water Based Prototype for Heating, Cooling, and DHW Production ,Renewable Energy , Vol. 137 ,pp 20-36 , 2019, https://doi.org/https://doi.org/10.1016/j.renene.2018.01.059 - ,
Performance Assessment of Facade Integrated Glazed Air Solar Thermal Collectors ,Energy Procedia , Vol. 115 ,pp 353-360 , 2017, https://doi.org/https://doi.org/10.1016/j.egypro.2017.05.032 - ,
Urban Acceptance of Facade Integrated Novel Solar Thermal Collectors ,Energy Procedia , Vol. 48 ,pp 1429-1435 , 2014, https://doi.org/https://doi.org/10.1016/j.egypro.2014.02.161 - , Infield Output of a New Solar-Thermal Facade with Increased Architectural Acceptance, Techconnect Briefs, Materials for Energy, Efficiency and Sustainability, 2017
- ,
Facades Integrated Solar-Thermal Collectors – Challenges and Solutions ,Energy Procedia , Vol. 112 ,pp 176-185 , 2017, https://doi.org/https://doi.org/10.1016/j.egypro.2017.03.1080 - ,
Design and Experimental Optimisation of a Novel Flat Plate Solar Thermal Collector with Trapezoidal Shape for Facades Integration ,Applied Thermal Engineering , Vol. 90 ,pp 432-443 , 2015, https://doi.org/https://doi.org/10.1016/j.applthermaleng.2015.06.026 - ,
Outdoor Performance of a Trapezoidal Solar Thermal Collector for Facades Integration ,Renewable Energy , Vol. 137 ,pp 37-44 , 2019, https://doi.org/https://doi.org/10.1016/j.renene.2018.01.101 - , , Solar Energy Engineering: Processes and Systems, 2014
- ,
, Solar Engineering of Thermal Processes , 2013