


Crude oil production is as much about produced water as it is about energy production [1]. The production of crude oil and natural gas leads to generation of produced water, sometimes in greater volumes than the crude oil and natural gas and this volume increases as the oilfield age. For crude oil wells nearing the end of their productive lives, produced water can make up as much as 98% of the fluid brought to the surface [2]. In the United States of America (USA), produced water comprises approximately 98% of the total volume of exploration and production waste generated by the oil and gas industry [3]. It is therefore the largest volume of waste generated by the oil and gas industry [4]. Additionally, across Nigeria, the estimated average crude oil to produced water production is 1:1, therefore, approximately two million barrels of produced water is generated daily due to crude oil production in Nigeria [3], [5]. Excessive water production has continued to remain a challenge to operators since the beginning of petroleum industry to date. Produced water is toxic, it contains traces of hydrocarbon such as polycyclic aromatic hydrocarbons and alkylphenols which are relatively resistant to biodegradation and could cause adverse effects to marine organisms [6]. The properties of the formation water in its natural state and the process of crude oil production are chiefly responsible for toxicity of produced water. Production chemicals used during production and the resulting hydrocarbon are the sources of produced water toxicity and the resulting toxicity has been shown to increase across the production process [7]. Benzene, toluene, ethylbenzene, xylene isomers and phenols are found in produced water as soluble but toxic compounds. The solubility of these compounds in produced water has made their removal challenging [8].
Produced water may come with high volumes of crude oil and suspended solids. In most places for offshore discharge, the treatment requirement has been focused on only reduction of the amount of oil and grease in produced water [9]. This has allowed operators to legally discharge produced water which has been toxified with production chemicals into the environment. The dissolved sodium, calcium and magnesium salts which are often referred to as Total Dissolved Solids (TDS) in produced water has also raised its own challenges as they have been found to cause chocking and clogging in pipelines, formation of scales in boilers leading to fuel inefficiency, overheating and scale deposition [10].
Although hydrocarbon recovery, injection for disposal, surface discharge, evaporation, commercial disposal and application for beneficial use are the known management options for produced water, the constituents of the production chemicals in use at the facility are of great significance in deciding the option to employ [11]. The chemical compounds present in produced water could be traced to the following broad categories: chemical additives (such as corrosion inhibitors, scale inhibitors, biocides, etc., used in crude oil production process), additional additives (e.g. gelling and foaming agents, cross linkers, friction reducers, etc., used for well simulation treatments) and geogenic substances such as salts, heavy metals, hydrocarbon and radioactive materials brought to the surface during development [12]. The production chemicals are used to control corrosion of the equipment, formation of hydrates and scales, wax deposition, asphaltene precipitation, bacteria activities, release of hydrogen sulphide, and to resolve emulsions [13]. Studies have shown that production chemicals such as corrosion and scaling inhibitors also affect oil – water separation [14]. The results of a research conducted on offshore location in Nigeria’s Niger Delta where produced water is being discharged into the water body after treatment show that the offshore waters were contaminated with Total Petroleum Hydrocarbon (TPH), nitrite, sulphate, phosphate, nickel and zinc in the dry season, whereas Benzene, Toluene, Ethyl benzene, Xylene (BTEX), Polycyclic Aromatic Hydrocarbon (PAH), cobalt, nitrite, total nitrogen, sulphate, phosphate and zinc were the contaminants in the wet season (rainy periods). The sediments were also contaminated by barium, chromium, copper, iron, nickel, lead, vanadium, zinc, petroleum hydrocarbon in the dry season and by BTEX, PAH, phenols, arsenic, cadmium, chromium, copper, iron, nickel, lead, vanadium, zinc with TPH in the wet season [15].
Production chemicals perform various roles at different stages of crude oil production. They are generally named according to their function and some of the commonly employed ones are grouped under these generic names: demulsifiers, corrosion inhibitors, paraffin inhibitors, biocides, hydrogen sulfide (H2S) scavengers, hydrate inhibitors, oxygen scavengers, water clarifiers, wax remover and defoamers [16].
Production chemicals are typically complex mixtures of various molecular compounds. Some of these chemicals are soluble in water and dissolve in produced water to make the discharged produced water toxic to the environment. Biocides, demulsifiers, corrosion inhibitors and scale inhibitors pose the greatest concerns for aquatic toxicity, but studies have shown that they may undergo reactions that reduce their toxicity before they are discharged or disposed [17]. Some of the physical and chemical properties of these production chemicals are highlighted in the subsequent sections.
Corrosion inhibitors are mostly water-soluble fluids and could be classified according to its mode of operation as either anodic, cathodic, vapour phase or film forming [18]. The Film Forming Corrosion Inhibitors (FFCI) are useful in the prevention of chloride, carbon dioxide (CO2) and H2S corrosion can be deployed in continuous injection or batch treatment. On the basis of this versatility, the FFCI are the mostly inhibitors for the protection of crude oil, condensate and gas production lines. The typical dosage of active FFCI components are often in the range of 10-100 ppm [19]. These corrosion inhibitors are adsorbed to the metal surface forming protective layer thereby preventing corrosive chemicals such as water and chloride ions from penetrating the surface of the metal [20]. Common corrosion inhibitors include acetaldehyde, acetone, ethoxylated octylphenol, nonylphenol, isopropanol, ethyl methyl derivatives, formic acid, isopropanol, thioglycolic acid, diethylenetriamine and naphtene acid imidazolines. In general, corrosion inhibitors are highly soluble, biodegradable and have low log values indicating that the chemicals are not likely to sorb to soils hence there is potential for leaching to groundwater. They are known to contain compounds that are toxic and/or carcinogenic [21].
Scale inhibitors are also water-soluble chemicals whose job is the prevention or retardation of the growth of inorganic scales. The process of scale inhibition is achieved through the adsorption of the chemicals onto the crystal surfaces. Some well-known scale inhibitors include amino-phosphonates, acrylamide, sodium, methanol, polycarboxylate, and ammonium bisulphate. Polyphosphates, phosphate esters, small nonpolymeric phosphonates, amino-phosphonates, poly-phosphonates, polycarboxylates, phosphino polymers, polyphosphinates and polysulphonates are also some common classes of scale inhibitors. The deployment of scale inhibitor in production process is site-specific, it is also dependent on the flow of fluid and the results of produced water analysis. Typically, a scale inhibitor dosage rate of 2-5 milligrams per litre (mg/L) is adequate to prevent scaling [22].
Biocides are used in oil and gas production to kill or eliminate micro-organisms which can cause Microbially Induced Corrosion (MIC) and fouling. They are basically of two types: oxidising and non-oxidising (organic) biocides. Oxidising biocides cause irreversible oxidation/hydrolysis of protein groups in the micro-organism and in the polysaccharides that bind the microorganisms to the surfaces of the equipment [23]. Ozone, hydrogen peroxide, chlorine, chlorine dioxide and bromine are the oxidising agents most commonly used as biocides [24], [25]. Non-oxidising organic biocides are less prone to cause corrosion than oxidising biocides, in fact, some can inhibit corrosion. Examples of non-oxidising biocides are aldehydes, bronopol, DPNPA, and acrolein [26].
Paraffin inhibitors are chemicals that have the capacity to affect the Wax Appearance Temperature (WAT) in the reservoir fluid during crude oil production [27]. These chemicals which are also referred to as wax crystal modifiers prevent the deposition of wax during crude oil production by modifying the structure of the wax crystals. Pour Point Depressants (PPDs) or flow improvers are another class of chemicals that alter the pour point of wax. There is a good deal of overlap in the chemistry and mechanisms of the two classes of chemicals, most wax inhibitors also function as PPDs. It is best practice to deploy wax inhibitors and PPDs into pipelines before the bulk temperature drops below the WAT [28]. The concentration of wax inhibitor or PPD needed depends on the severity of the wax problem, but 100-2,000 ppm covers most application needs. The main classes of wax inhibitors and PPDs are ethylene polymers and copolymers, comb polymers and miscellaneous branched polymers with long alkyl groups [20]. A mix of a weak to moderate wax solvent, such as toluene or xylene, and a strong wax solvent, such as cyclopentane or cyclohexane, can be deployed as wax inhibitor in cold climates. Ethylene/vinyl Acetate (EVA) copolymers in various solvents and cyclohexane are also good wax inhibitors and can be used to improve flow in pipelines [29].
The process of separating free water and the dissolved salts in the oil-water emulsion from the crude oil is called demulsification. Although the application of heat to emulsion has been shown to help in demulsification, carboxylate and naphtenate emulsions are not affected by heat thus the addition of a demulsifier remains the best way to resolve an emulsion. The concentration of the added demulsifier is usually in the range of 5-500 ppm based on the water phase. Enough mixing/dispersing is required to get the demulsifier to the oil-water interface, and time must be allowed for the coalesced droplets to phase separate. Some examples of demulsifiers include those containing an anionic surfactant (e.g., an alkylsulphosuccinate or alkylphosphonic acid, and their salts), a non-ionic surfactant (e.g., ethylene oxide/propylene oxide copolymer, ethoxylated fatty acid of polyethylene glycol, terpene alkoxylate, or modified alkanolamide), and a solvent base comprising blends of dibasic esters [20].
In crude oil production, when wax deposition cannot be prevented or when the prevention technique employed fail to deliver the required result, removal of the deposits becomes necessary in order to avoid production downtime or decreased production. Wax removing in pipeline is a common issue and many methods to achieve this have been developed. Trials of these methods in well tubing have recorded success in a few and these include mechanical removal methods, fused chemical exothermic reactions and wax-removing chemicals (paraffin solvents and dispersants) [29]. Two types of chemicals are commonly used for removing wax depositions, the first generates heat as a result of an exothermal chemical reaction, which occurs in the well when it is mixed with other specific chemicals or water, the second group of chemicals includes the solvents and dispersants that need to be added continuously to treat the oil [29]. A combination of sodium nitrite and ammonium chloride relying on the exothermal effects and the effervescence has been tried for wax deposit removal with reported success [30], [31]:
(1)
Gasoline, kerosene or benzol are the oldest wax solvents known. Although diesel condensate and toluene have also been used, xylene, carbon disulphide and carbon tetra chloride have been shown to do better [29]. Studies have shown that the temperature difference between the fluid within the pipeline and the wall of pipeline is the most important factor for wax deposition and that the amount of wax deposited decreases with increased flow [32].
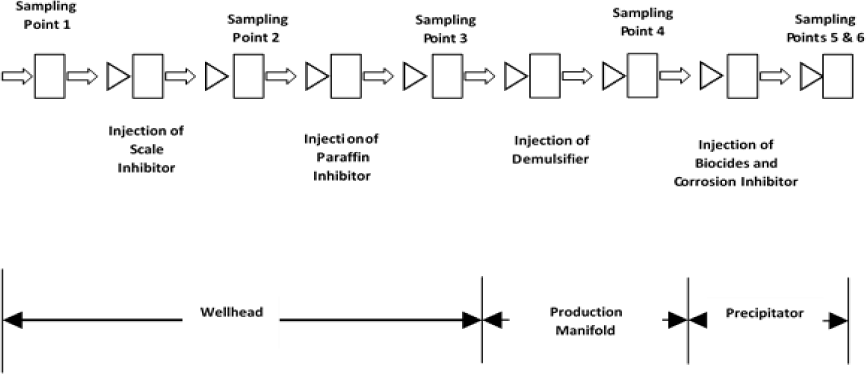
Produced water samples are collected at the Wellhead, the Production Manifold and downstream the Water Precipitator. In order to collect control sample, injection of scale inhibitor into the wellbore is temporary stopped for about 10 minutes and then the virgin sample is collected. This sample does not contain any form of production chemical. This activity is also carried out at each of the 6 sampling points by temporary stopping the injection of the concerned production chemical before the sample without that chemical is collected. Three samples of varying sizes are collected in the recommended containers at each point. The samples for physio-chemistry analysis were collected in two-litre plastic containers. The samples for metals and cations were collected in 300 ml plastic bottles while the samples for hydrocarbon concentration check were collected in 1,000 ml amber glass bottles. The samples for metals and cations and those for hydrocarbons were preserved with 3 ml nitric acid and 4 ml sulphuric acid, respectively. At these locations, the samples are collected downstream the point of chemical injection at each point as shown in Figure 1. These collected samples are taken to the laboratory for analysis to determine the concentrations of some selected compounds in them. In the analysis, the pollutants were considered as parameters in the produced water samples which were analysed following the provisions in the Standard Methods for the Examination of water and Wastewater by American Public Health Association (APHA) and the Recommended Practice for Analysis of Oilfield Waters (API RP – 45). The collection of samples at these points are carried out fortnightly over a 6 month period between November 17, 2017 and April 28, 2018.
Illustration of the production chemical injection points and the relative produced water sampling points along the crude oil production process in Izombe Flow Station
The main objective of the laboratory analysis is to monitor the variations in the concentration of some pollutants in the produced water sample due to injection of production chemicals. It will be used to further investigate the behaviour of the active ingredients of the production chemicals in the produced water sample as the produced water samples are subjected to heat and residence time. The produced water samples are subjected to application of heat in an oven set at different temperatures between 40 °C and 80 °C. The effect of residence time on the sample are also studied by conducting laboratory analysis on another set of samples at time intervals between 0 hours and 60 hours. The sampling and collection of produced water samples from the production facility prior to analysis in the laboratory took approximately 6-8 hours. This time is considered “zero” for the purpose of this research work and analysis. The results of the laboratory analysis are recorded.
The results obtained from the research on the influence of production chemicals on the quality of produced water at the Izombe Flow Station (IFS) has been compiled and discussed below.
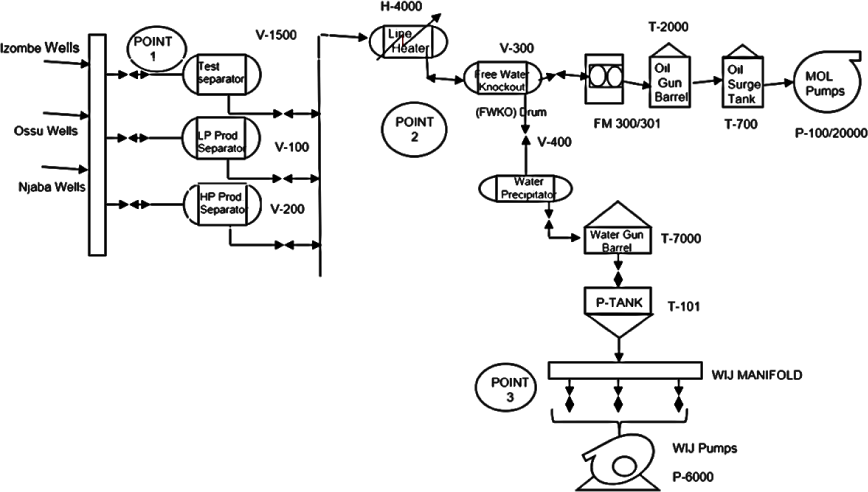
The IFS, which is currently operated by Addax Petroleum Development Nigeria Limited, is an onshore crude oil and natural gas facility located Oil Mining Lease (OML) 124 in Izombe, Oguta Local Government Area of Imo State, Nigeria. The flow station, which was commissioned on 6 June 1975, is a complete self-sufficient facility containing oil and gas production and processing systems: oil production process, gas compression and re-injection systems and produced water re-injection unit as contained in Figure 2. IFS was originally designed to receive 37,000 barrels per day of well fluids from Izombe, Ossu, Njaba and Jisike fields. However, the current crude oil production of the facility is 3,300 barrels per day and the crude oil-produced water ratio is 0.3.
Simplified produced water process flow diagram for IFS
Considering the age of the fields, several production chemicals are employed for crude oil production in IFS. These chemicals are injected at different points along the production process at different times employing different methods. Table 1 provides detailed information on production chemicals use at IFS. The wax remover is not injected continuously but as scheduled fortnightly during the routine pigging operations through the Main Oil Line (MOL) that delivers stabilised crude oil to the export terminal. The wax remover is not involved in crude oil production and therefore not considered to play a role in this research.
Production chemicals used at IFS
S/N |
Production chemical |
Injection point |
Injection method |
Dosage [ppm] |
|---|---|---|---|---|
1 |
Scale inhibitor |
Wellhead |
Continuous |
5-10 |
2 |
Paraffin inhibitor |
Wellhead |
Continuous |
50-200 |
3 |
Demulsifier |
Production manifold |
Continuous |
10-15 |
4 |
Biocide |
Water precipitator |
Continuous |
500 |
5 |
Corrosion inhibitor |
Water precipitator |
Continuous |
5-10 |
6 |
Wax remover |
MOL |
Batch |
- |
The samples of produced water for this research work have been analysed at Taochem Limited’s laboratory in Port Harcourt, Rivers State, Nigeria. This laboratory is accredited by the Department of Petroleum Resources to provide consultancy services in production chemistry and auditing of laboratory services for Nigeria’s oil and gas industry. The results of the laboratory analysis have been relied upon for the predictions and conclusions in this research.
The influence of injection of production chemicals at the various sampling points on the quality of the produced water have been studied by laboratory analysis of the various samples of produced water captured at both upstream and downstream of the injection points along the production process as shown in Table 2. The results of the laboratory results have been analysed and presented for easy evaluation in Table 3.
Volumetric concentrations of the various pollutants in produced water samples as measured upstream the injection points
S/N |
Sample parameter |
Conc. at SP1 [ppm] |
Conc. at SP2 [ppm] |
Conc. at SP3 [ppm] |
Conc. at SP4 [ppm] |
Conc. at SP5 [ppm] |
Conc. at SP6 [ppm] |
|---|---|---|---|---|---|---|---|
1 |
Benzene |
0.180 |
0.220 |
0.480 |
0.500 |
0.170 |
0.120 |
2 |
Toluene |
0.160 |
0.190 |
0.490 |
0.520 |
0.140 |
0.120 |
3 |
Phenol |
0.620 |
0.680 |
0.700 |
0.720 |
0.210 |
0.180 |
4 |
Chromium |
0.780 |
0.820 |
0.860 |
0.890 |
0.780 |
0.720 |
5 |
Iron (× 10−1) |
0.386 |
0.410 |
0.423 |
0.497 |
0.272 |
0.198 |
6 |
Zinc |
0.160 |
0.180 |
0.190 |
0.220 |
0.200 |
0.190 |
7 |
Phosphates |
0.010 |
0.020 |
0.020 |
0.030 |
0.120 |
0.130 |
8 |
Ammonia (× 10−1) |
0.260 |
0.890 |
0.948 |
1.065 |
0.772 |
0.640 |
9 |
Nitrates (× 10−2) |
0.258 |
0.246 |
0.232 |
0.229 |
0.164 |
0.156 |
10 |
Salinity (× 10−4 ) |
0.686 |
0.766 |
0.880 |
0.990 |
0.860 |
0.837 |
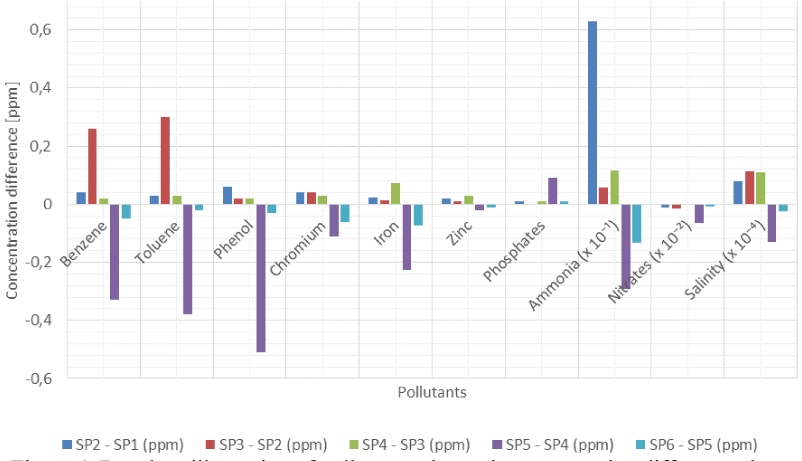
Pollutant volumetric concentration differences between sampling points
S/N |
Sample parameter |
SP2-SP1 [ppm] |
SP3-SP2 [ppm] |
SP4-SP3 [ppm] |
SP5-SP4 [ppm] |
SP6-SP5 [ppm] |
|---|---|---|---|---|---|---|
1 |
Benzene |
0.04 |
0.26 |
0.02 |
−0.33 |
−0.05 |
2 |
Toluene |
0.03 |
0.3 |
0.03 |
−0.38 |
−0.02 |
3 |
Phenol |
0.06 |
0.02 |
0.02 |
−0.51 |
−0.03 |
4 |
Chromium |
0.04 |
0.04 |
0.03 |
−0.11 |
−0.06 |
5 |
Iron (× 10−1) |
0.024 |
0.013 |
0.074 |
−0.225 |
−0.074 |
6 |
Zinc |
0.02 |
0.01 |
0.03 |
−0.02 |
−0.01 |
7 |
Phosphates |
0.01 |
0 |
0.01 |
0.09 |
0.01 |
8 |
Ammonia (× 10−1) |
0.63 |
0.058 |
0.117 |
−0.293 |
−0.132 |
9 |
Nitrates (× 10−2) |
−0.0122 |
−0.0132 |
−0.0035 |
−0.0647 |
−0.0078 |
10 |
Salinity (× 10−4 ) |
0.08 |
0.114 |
0.11 |
−0.13 |
−0.023 |
The production process is made up of equipment designed to operate at different temperatures. In order to fully assess the impact of the operating temperatures of these equipment on the produced water content that flow through them, samples of produced water have been subjected to different temperatures for 2 minutes each in an oven in the laboratory. The results of this exercise are recorded in Table 4.
Average influence of heat on the volumetric concentration of pollutants in produced water across the production facility
S/N |
Sample parameter |
37 °C [ppm] |
40 °C [ppm] |
50 °C [ppm] |
60 °C [ppm] |
70 °C [ppm] |
80 °C [ppm] |
|---|---|---|---|---|---|---|---|
1 |
Benzene |
0.278 |
0.243 |
0.212 |
0.170 |
0.140 |
0.108 |
2 |
Toluene |
0.270 |
0.243 |
0.220 |
0.193 |
0.167 |
0.140 |
3 |
Phenol |
0.518 |
0.490 |
0.467 |
0.437 |
0.410 |
0.382 |
4 |
Chromium |
0.808 |
0.827 |
0.852 |
0.882 |
0.913 |
0.940 |
5 |
Iron (× 10−1) |
0.364 |
0.368 |
0.373 |
0.377 |
0.382 |
0.387 |
6 |
Zinc |
0.190 |
0.203 |
0.215 |
0.228 |
0.245 |
0.258 |
7 |
Phosphate |
0.055 |
0.070 |
0.100 |
0.137 |
0.162 |
0.192 |
8 |
Ammonia (× 10−1) |
0.763 |
0.775 |
0.802 |
0.830 |
0.850 |
0.880 |
9 |
Nitrates (× 10−2) |
0.214 |
0.230 |
0.250 |
0.273 |
0.297 |
0.320 |
10 |
Salinity (× 10−4) |
0.837 |
0.847 |
0.860 |
0.868 |
0.880 |
0.898 |
As produced water is transported from the Wellhead to the Water Gun Barrel from which it is injected back to the reservoir, time elapsed. In order to evaluate the minimum influence of residence time on the pollutant concentrations in produced water, laboratory analysis have been conducted on produced water samples. The results of the laboratory test are recorded in Table 5.
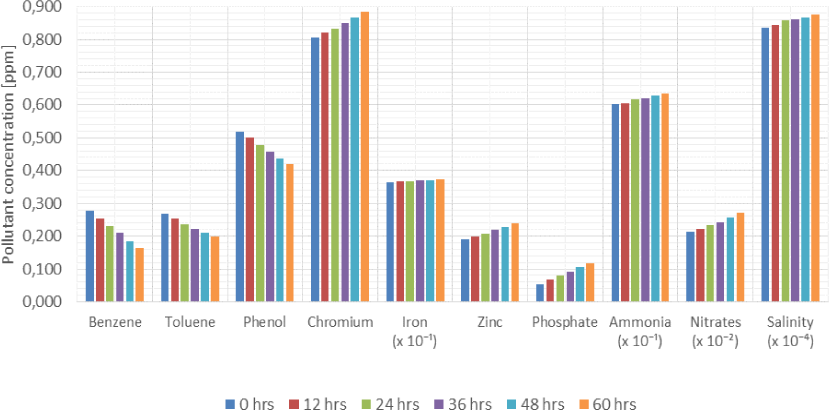
Average influence of residence time on the volumetric concentration of pollutants in produced water across the production facility
S/N |
Sample parameter |
0 hrs [ppm] |
12 hrs [ppm] |
24 hrs [ppm] |
36 hrs [ppm] |
48 hrs [ppm] |
60 hrs [ppm] |
|---|---|---|---|---|---|---|---|
1 |
Benzene |
0.278 |
0.255 |
0.232 |
0.210 |
0.183 |
0.163 |
2 |
Toluene |
0.270 |
0.253 |
0.237 |
0.223 |
0.210 |
0.198 |
3 |
Phenol |
0.518 |
0.502 |
0.478 |
0.458 |
0.438 |
0.420 |
4 |
Chromium |
0.807 |
0.820 |
0.832 |
0.850 |
0.867 |
0.883 |
5 |
Iron (× 10−1) |
0.364 |
0.366 |
0.368 |
0.369 |
0.371 |
0.373 |
6 |
Zinc |
0.190 |
0.200 |
0.208 |
0.220 |
0.227 |
0.238 |
7 |
Phosphates |
0.055 |
0.067 |
0.078 |
0.090 |
0.105 |
0.118 |
8 |
Ammonia (× 10−1) |
0.603 |
0.605 |
0.616 |
0.621 |
0.628 |
0.635 |
9 |
Nitrates (× 10−2) |
0.214 |
0.223 |
0.233 |
0.242 |
0.256 |
0.270 |
10 |
Salinity (× 10−4) |
0.837 |
0.843 |
0.858 |
0.863 |
0.868 |
0.876 |
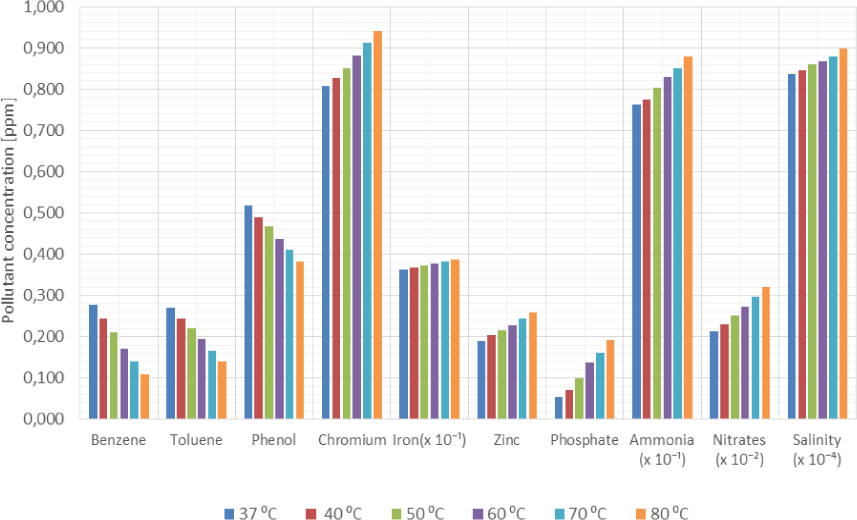
The concentrations of benzene, toluene, phenol, chromium, iron, zinc, phosphates, ammonia, nitrates and salinity in the produced water have been considered in the analysis of the results from the laboratory. Figure 3 and Figure 4 show that except for nitrates the concentrations of pollutants in produced water increased between Sampling Point 1 (SP1) and SP4 as production chemicals are injected into the process. There is, however, a continuous decrease in the concentration of all pollutants except phosphates between SP4 and SP6 not minding that biocides and corrosion inhibitors are injected upstream SP5 and SP6, respectively.
Figure 5 and Figure 6 also show that while benzene, toluene and phenol concentrations decreased when produced water samples are subject to heat, the concentrations of chromium, phosphates, nitrates and ammonia increased in the samples. The salinity of the samples marginally increased while the concentrations of iron ions remained relatively stable.
Figure 7 indicates that if time is allowed to elapse, the concentration of benzene, toluene and phenol in a produced water sample will decrease while the concentration of chromium, zinc, phosphate and nitrates will increase.
Pollutant volumetric concentration differences between sampling points due to injection of production chemicals
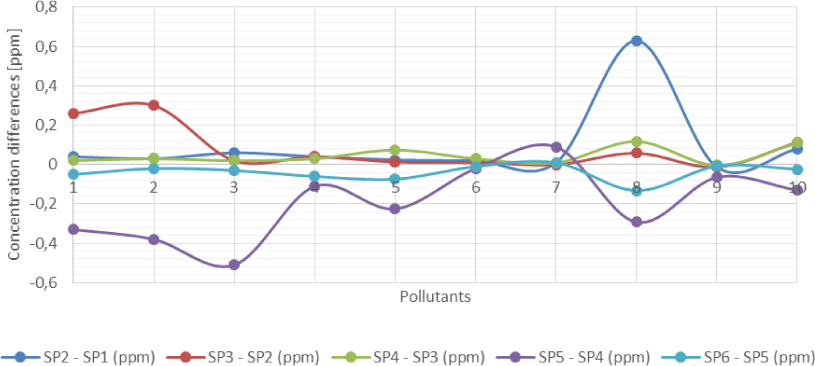
Bar chart illustration of pollutant volumetric concentration differences between sampling points
Average influence of heat on the volumetric concentration of pollutants in produced water across the production facility
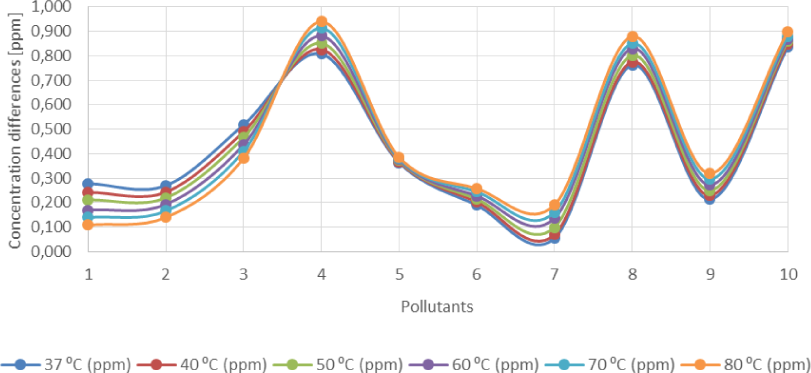
Bar chart illustration of the average influence of heat on the volumetric concentration of pollutants in produced water across the production facility
Bar chart illustration of the influence of residence time on the volumetric concentration of pollutants across the production facility
It was observed that at the introduction of a particular production chemical, the concentration of some pollutants increased significantly. This may have been due to the presence of the pollutant as a constituent in the make up of the chemical or due to reaction with other compounds. The percentage increase of volumetric concentrations of the particular pollutant could then be calculated at that point using the ratio of the change in volumetric concentration to the original concentration of the pollutant prior to addition of the chemical. In the case study, the introduction of scale inhibitor, paraffin inhibitor, demulsifier, biocides and corrosion inhibitor at the recommended rate for the process yielded an increase of 242%, 53%, 12.5%, 300% and −4.8% in the volumetric concentrations of ammonia, hydrocarbons, salinity, phosphates and nitrates in the produced water.
Produced water generated during production of crude oil in oilfields contain many compounds in levels that they are toxic to plant and animal. The source of the pollution has been traced to the interaction between the produced water and other compounds in the reservoir and the chemicals used during the crude oil production process. This fluid, which must be disposed or re-used, is also generated in huge volumes and therefore of great concern to operators and regulators in the oil and gas industry. Produced water treatment and management are therefore very huge markets in the oil and gas industry and the understanding of the influence of production chemicals on the quality of produced water from the oilfields is necessary.
The introduction of production chemicals into crude oil production process directly affects the quality of the resulting produced water from the process. The laboratory analysis and results indicate in the concentrations of most of the pollutants due to introduction of production chemicals up to SP4. The reduction in the concentrations of the pollutants between SP4 and SP6 could be explained by the existence of operating conditions aimed at reducing the concentration of pollutants which has been incorporated into the design of the production facility. It has also been shown that residence time and application of heat affects the concentration of pollutants in produced water samples. This is because of the chemical and physical characteristics of the constituent pollutants including their reactivity, solubility and boiling points. The active ingredients in some of the production chemicals also have the capacity to react with other compounds or change form when heat is applied to the produced water sample in which they are present.
The results of this research work will be vital in the future for consideration and design of production facilities aimed at reduction of pollutants concentration in the resulting produced water. It will give engineers and operators further knowledge on the reason for application of optimum operating conditions at the production process. The influence of process integration on the quality of produced water from crude oil production process could be further studied to access more knowledge on all that need to be done to reduce the toxicity of produced water from crude oil production process.
- , Water Management Associated with Oil and Gas Development and Production, The Magazine for Environmental Managers, Air and Waste Management Association, Pittsburgh, Pennsylvania, USA, 2017
- ,
Oil and Gas Production Wastewater: Soil Contamination and Pollution Prevention ,Applied and Environmental Science , Vol. 2016 ,pp 24 , 2016, https://doi.org/https://doi.org/10.1155/2016/2707989, Article ID 27079892016 - ,
Evaluation of the Physico-chemical Properties of Produced Water from Oil Producing Wells in the Niger Delta Area, Nigeria ,Journal of Applied Sciences and Environmental Management , Vol. 20 (4),pp 1113-1117 , 2016, https://doi.org/https://doi.org/10-4314/jasem.v20i4.27 - ,
A Review in Oil Exploration and Production Waste Discharges According to Legislative and Waste Management Practices in Malaysia ,International Journal of Waste Resources , Vol. 7 (1), 2016, https://doi.org/https://doi.org/10.4172/2252-5211.1000260 - , Produced Water Quality Characterisation of Wattenberg Field, MS.c. Thesis, 2013
- ,
Comparison of Produced Water Toxicity to Arctic and Temperate Species ,Ecotoxicology and Environmental Safety Journal , Vol. 201 (113),pp 248-258 , 2014, https://doi.org/https://doi.org/10.1016/j.ecoenv.2014.12.007 - , Environmental Control Technology for Oilfield Processes, Environmental Technology in the Oil and Gas Industry, 2016
- ,
Produced Water from Oil – A Review of the Main Treatment Technologies ,Journal of Environmental Chemistry and Toxicology , Vol. 2 (1),pp 23-27 , 2018 - ,
Oil and Grease as a Water Quality Index Parameter for the Conservation of Marine Biota ,Water , Vol. 11 (4),pp 856 , 2019, https://doi.org/https://doi.org/10.3390/w11040856 - ,
Evaluation and Management of Produced Water from Selected Oil Fields in Niger Delta, Nigeria ,Archives of Applied Sciences Research , Vol. 4 (1),pp 39-47 , 2012 - US Produced Water Volumes and Management Practices in 2012, Veil Environmental LLC, Annapolis, Maryland, USA, 2015, http://www.veilenvironmental.com/publications/pw/prod_water_volume_2012.pdf, [Accessed: 31-August-2019]
- , Is Reuse of Produced Water Safe? First, let’s Find out what’s in it, The Magazine for Environmental Managers, Air and Waste Management Association, 2017
- ExxonMobil, Chemicals Used in Crude Oil Production and Impacts for Imported Crudes, Irving, Texas, USA, 2007, https://www.concawe.eu/wp-content/uploads/2017/02/Additives_in_imported_Crude_Oil-2008-04063-01-E.pdf, [Accessed: 31-August-2019]
- ,
Produced Water Challenges; Influence of Production Chemicals on Flocculation ,MS.c. Thesis , 2010 - ,
Assessment of Pollution from Produced Water Discharges in Seawater and Sediments in Offshore, Niger Delta ,Environmental Earth Sciences , Vol. 76 (10),pp 359 , 2017, https://doi.org/https://doi.org/10.1007/s12665-017-6682-x - Future Markets Insights (FMI), Oilfield Production Chemicals Market: Increasing Exploration of Oil & Gas Reserves to Push Revenue Growth: Global Industry Analysis 2013-2017 and Opportunity Assessment 2018-2028, 2019, https://www.futuremarketinsights.com/reports/oilfield-production-chemicals-market, [Accessed: 31-August-2019]
- A White Paper Describing Produced Water from Production of Crude Oil, Natural Gas and Coal Bed Methane, US Department of Energy – National Energy Technology Laboratory, Chicago, USA, 2004, https://publications.anl.gov/anlpubs/2004/02/49109.pdf, [Accessed: ]
- , Working Party Report on the Use of Corrosion Inhibitors in Oil and Gas Production EFC39, European Federation of Corrosion, Maney Publishers, Leeds, England, UK, 2004
- , Production Chemicals for the Oil and Gas Industry (2nd ed.), CRC Press, Boca Raton, Florida, USA, 2014
- , Further Investigation on the Effect of Corrosion Inhibitor Actives on the Formation of Iron Carbonate on Carbon Steel, Conference Paper, NACE International, Houston, Texas, USA, 2009
- ,
Effect of Concentration and Temperature on Carbon Steel Corrosion Inhibition ,Journal of Bio and Tribo Corrosion , Vol. 3 (8), 2017, https://doi.org/https://doi.org/10.1007/s40735-016-0067-7 - How to Calculate Anti-scalant Feed Dosage, Harn R/O Systems Inc., Venice, Florida, USA, https://blog.harnrosystems.com/are-you-getting-the-most-value-out-of-your-scale-inhibitor, [Accessed: 02-September-2019]
- , Applied Microbiology and Molecular Biology in Oilfield Systems, in, Proceedings from the International Symposium on Applied Microbiology and Molecular Biology in Oil Systems (ISMOS-2), 2009
- , Interaction of Chemical Variation and Biocides Performance at Paper Machines, Ph.D. Thesis, School of Chemical Technology, Aalto University, Greater Helsinki, Finland, 2012
- ,
Petroleum Microbiology ,American Society for Microbiology, ASM Press, Washington D. C., USA , 2005, https://doi.org/https://doi.org/10.1128/9781555817589 - , Hydraulic Fracturing Chemical Selection and Design, Hydraulic Fracturing in Unconventional Reservoirs: Theories, Operations, and Economic Analysis, 2017
- ,
Experimental Investigation of Wax Deposition from Waxy Oil Mixtures ,Applied Petrochemical Research , Vol. 9 ,pp 77-90 , 2019, https://doi.org/https://doi.org/10.1007/s13203-019-0228-y - ,
Studies on the Influence of Polymeric Additives as Flow Improvers for Waxy Crude Oil ,Int. Org. of Scientific Research Journal of Engineering , Vol. 4 (7),pp 54-61 , 2014, https://doi.org/https://doi.org/10.9790/3021-04715461 - ,
Preventing and Removing Wax Deposition Inside Vertical Wells: A Review ,Journal of Petroleum Exploration and Production Technology , Vol. 9 ,pp 2091-2107 , 2019, https://doi.org/https://doi.org/10.1007/s13202-019-0609-x - ,
In Situ Heat System Stimulates Paraffinic-Crude Producers in Gulf of Mexico ,SPE Prod. Eng. , Vol. 4 ,pp 157-160 , 1989, https://doi.org/https://doi.org/10.2118/15660-PA - ,
Mitigation of Wax in Oil Pipelines ,International Journal of Engineering Research and Reviews , Vol. 4 (4),pp 39-47 , 2016 - ,
Occurrence and Characterization of Paraffin Wax Formed in Developing Wells and Pipelines ,Energies , Vol. 12 (6),pp 967 , 2019, https://doi.org/https://doi.org/10.3390/en12060967