


The sustainability objective in the management of water resources is reflected in the planning and management of the infrastructure necessary to achieve the current and future objectives of society, safeguarding the ecological, environmental and hydrological integrity. Among the dimensions associated with this concept (social, economic, environmental), the environmental one deals with the impacts of urban water systems on natural systems and it aims to optimize the use of water, energy and materials, minimizing the negative impacts.
These needs show how important is a perfect synergy between qualitative models and quantitative models to guarantee sustainable management of water systems, also in regard to their vulnerability [1]. While quantitative models are mainly based on optimization and simulation criteria, also in the perspective of scenarios induced by climate change [2], the qualitative approach uses the estimation of the drinking water risk [3], as the inability to reach standards regarding source pollution, obstructions or dysfunctions and reduction of water availability, reuse of purified water [4],[5]. Among these, models of chlorine decay analysis, identification of contamination sources models and forecasting models for sensor localization play a key role. In recent years, however, models for estimating sustainability through Life Cycle Assessment (LCA) have become particularly important. The LCA is an objective method for calculating the environmental costs, as mass and energy in and out, of the system/product to be analyzed, using specific methodologies for the Life Cycle Impact Assessment (LCIA) phase. The LCIA methodologies aim to link each inventory result to the corresponding environmental impacts to classify the results into specific categories. Among these, a method frequently used is IMPACT 2002+ (as for the application presented in this study). It allows to quantify environmental impacts according to two approaches:
Midpoint-oriented (based on impact categories);
Damage-oriented (based on damage categories).
In the context of sustainability estimates, the LCA is often used in an approach that focuses attention on the impacts associated with the life cycle of the materials that make up the individual product, processes or systems studied [6],[7].
The LCA studies, in the context of estimating the sustainability of water systems are often associated with metabolic analyses. Urban metabolism can be defined as ‘the total sum of the technical and socio-economic processes that occur in cities, with consequent growth, energy production and elimination of waste’ [8].
Within a water system it is possible to use this method: the incoming flows are ‘metabolized’ by the system during the execution of its functions, giving rise to outflows. For this reason, the metabolic model traces the entire water life cycle, from capture, to transport, consumption and finally to the disposal of wastewater, simulating all the flows of resources, raw materials, energy, money and emissions. The input data for the simulation include general system data (population served, water demand, energy mix emission factor) and more specific data relating to each subsystem (geometrical and material characteristics of the distribution networks and waste collection, energy consumption, types and quantities of chemicals used in the treatment phases).
In the literature there are several applications of this methodology to water systems. Stokes and Horvath [9] presented an updated version of the Water-Energy Sustainability Tool (WEST) that is a decision support tool for US water services, obtained through a specific LCA for each state. In Del Borghi et al. [10] is carried out an LCA analysis on the methodological model of Environmental Product Declaration (EPD) of a drinking water system in Sicily. In D’Ercole et al. [11] the metabolism of a water network in Italy through the application of the LCA is studied. Hasegawa et al. [12] have proposed an LCA applied to a water distribution system with a continuous depopulation scenario. In water distribution networks, using the LCA method, Hajibabaei et al. [13] and Maiolo et al. [14] have estimated the environmental impact of the pipe materials types. Bârjoveanu et al. [15] carried out the assessment of a drinking water treatment plant in Iasi City (Romania) with LCA and identification/characterization of its environmental impacts.
The total volume of energy or materials is a synthetic indicator of environmental performance, therefore, if this value is high, the negative impact on the environment is important. For this reason it is useful to study the flows and transformation processes of materials and energy types that are used for the operation of a generic system in the urban environment, and also the mechanisms that regulate them, to be able to optimize the urban processes [16], that is, using the negative impact as a starting point to define, through comparisons between scenarios, the possible positive impacts. In this direction the LCA represents a valid analysis tool for the metabolism estimation of a water network or, more generally, of a water system. Its application makes it possible to estimate and consequently intervene on the sensitive phases of the life cycle in order to increase the sustainability level.
Often the metabolism of a water network is studied using approaches based on Material Flow Analysis (MFA) [17], but in the literature there are other methodologies, some of which are reported in Table 1.
The main methodologies used for the metabolic analysis
References |
Case study |
Aims |
Objectives |
Methodological approach |
|---|---|---|---|---|
Warren-Rhodes and Koenig [18] |
Hong Kong |
Analysis of citizen metabolism |
Evaluate the trend of resource consumption and waste generation |
MFA |
Haberl [19] |
Austria |
Calculation of the Net Primary Production (NPP) |
Evaluate the NPP in the case of hypothetical undisturbed vegetation and the amount of biomass available in ecological cycles |
Energy metabolism |
Liu and Zhang [20] |
Beijing, Tianjin, Shanghai and Chongqing |
Analysis of Greenhouse Gas (GHG) emissions related to energy |
Contextualize GHG emissions generated by energy consumption in the industrial sector and coal-fired power stations |
Ecological dynamics |
Hannon [21] |
Florida |
Calculation of energy flows |
Establish an ecological network flowchart to indicate the quantities of materials and energy flows between system components |
Ecological Network Analysis (ENA) |
Liang and Zhang [22] |
Suzhou |
Suzhou urban metabolism forecasts |
Explain the impacts of four categories of solid waste recycling |
Input-output analysis |
Bullard et al. [23] |
357 sectors of the US economy |
Identification of process inputs |
Determine the inputs for primary energy of all sectors, taking into account that the energy is sold at different prices to various customers |
Process analysis |
MFA allows researchers to monitor the materials flow throughout the entire life cycle within the system, assuming that a sufficient amount of reliable statistical data is available. Warren-Rhodes and Koenig [18] analyzed Hong Kong metabolism from the point of view of resource consumption trends and waste generation. The authors have assessed per capita consumption of food, water and materials, total air emissions, carbon dioxide (CO2) emissions, solid urban waste production and wastewater discharge, discovering at the end, that Hong Kong economic growth has been achieved with a high environmental cost. Haberl [19] was the pioneer of the concept of ‘energy metabolism’, focusing on the flows of material and energy that have to the same weight in the urban metabolism research. Some researchers have proposed modifications of the method based on energy, which represents a kind of ‘incorporated energy’, or on exergy, that is the amount of useful work that can be done by the energy in a system [24]. Liu and Zhang [20] presented a work which uses the physical input-output analysis, combined with other metabolic approaches. In particular, the method proposed is based on the material flow method, combined with a monetary input-output analysis, useful to define a physical input-output analysis and build an ecological network model of the urban metabolic system. Hannon [21] is one of the most important references in the use of ENA. The basis of this method is to establish an ecological network flow chart that indicates the relative quantities of materials and energy flows between the components of the system through direct and indirect relationships. In the simulation models for an urban metabolism, however, it is necessary to divide the metabolic actors into more precise compartments, to clarify the flows between them. The input-output analysis method makes this possible. In the 1970s, the method has been applied to describe the resources flow such as water, energy and natural resources, then reflected in the process of calculating the transmission of economic value flows. The research includes a description of the distribution of ecological elements between the industrial sectors within a system and the use of ecological elements relevant for a single product. This approach is also known as environmental input-output analysis [22]. It is a method similar to the Process Analysis model [23], which is able to define a process related to the generation of a product in the most detailed way possible. Process Analysis is suited to specific processes, products or production chains because it is easy to track flows. A particular product is identified as a study object and inputs such as fuels (direct energy) and non-energy aspects are examined. The energy use is calculated while each non-energy input is further examined to determine the energy and non-energy inputs required for its production. This process continues, going back from the target product through each stage to the production processes. In each process, the input of the initial element is then used to approximate the element quantity consumed to generate the product [23].
The work aims to estimate the metabolism of the water network of the municipality of Rende (Italy) through LCA analysis, based on an approach that summarizes the MFA and the Process Analysis. The water network, destructured into categories and sub-categories, has allowed the analysis of the mass and energy flows entering and leaving the system (water network), in order to estimate its magnitude, studying its metabolism. The metabolism concept, in the specific case, is based on the balance between input and output of the system, allocating the same importance to both flows, as opposed to MFA method [17]. The incoming flows refer to matter and energy that characterize the life cycle of the network component, while the output is represented by the emissions in air, water and soil. The metabolism cost of the Rende network is the estimation of the potential damage determined on the environment, which can be defined by analyzing the life cycle.
Associating the metabolism cost with the analysis of material flows has already been practiced in other studies [25]. In this context, the concept of the cost is linked to economic activities that are necessarily based on environmental resources, which do not have a defined economic value and if it is, it would be very high for the risk of depletion.
For this reason, an estimate of the cost can be associated with the impact of these on the environment based on the principle ‘if it consumes and pollutes, then the metabolism cost, as a balance between incoming and outgoing flows, will be high’. The focus on metabolism, in fact, is useful to identify the phase which is responsible for a worse metabolic balance, that is the phase on which to intervene with sustainable environmental policies.
It follows that a careful analysis of the metabolism cost can define a better impact allocation criterion, aimed at defining the phase or phases with a higher cost.
From this view, it is deduced that the metabolism cost can be interpreted as a threshold value to define the scale of future improvements. The idea of thresholds is a crucial element for making decisions and acting on the urban territory [26]. Assuming the cost as a threshold value, future developments of this study are envisaged which allow, once the network cognitive phase is defined, to compare different scenarios in order to define the best performing one and to elaborate the decision-making policies.
The methodological approach presented, synthesizes the models based on MFA and Process Analysis, through LCA method.
From the MFA method takes over the detail related to the materials analysis, which are the interpretative key for the processes that define the inputs and outputs of the system. While the methodological contribution of Process Analysis is expressed by the destructuring of the network into hydraulic components which constitute the products to identify the processes associated with physical flows that can be interpreted from the available data. This approach is the basis of the data allocating process for the reconstruction of the network metabolism.
The method structure aims to define input flows [clarified in the Life Cycle Inventory (LCI) phase], output flows (emissions, detailed below) and cost, in terms of global impact, of the metabolism of the Rende network.
In the literature there are not many similar case studies, for making a direct comparison, excluding partially the analysis of the metabolism of the Reggio Emilia water system [11]. The basic principle of metabolism is the same, but in the case presented, to metabolism the estimate of the cost is associated, defined as a threshold value for the comparison between alternative scenarios.
The application, unlike D’Ercole et al. [11], neglects input data relating to water supply and the population served, which are not a determinant for modeling. The presented application shows the results in a nondynamic context, therefore variable over time, but links them to the analysis of material and energy flows whose cost is a starting point for a correct allocation of the impacts.
The analysis of the flows and the sub-flows of matter and energy associated with the materials of the hydraulic components, requires immediately that the channels on which to activate the study are clear. A breakdown of the network is carried out, that is a subdivision into groups of the elements based on the hydraulic functionality in the network and the constituent materials, taking into account the percentages on the total. For the single material considered, gray energy is derived from literature data [27]. The analysis is carried out on the single representative element and the results obtained are reworked on the totals. Since this detail level partly coincides with the LCI, the application choices of the LCA methodology are detailed and discussed below.
A ‘from cradle to grave’ analysis has been carried out: the portion of the life cycle that goes from the raw material to the finished product, including the production process, processing, transport and disposal has been examined, referring to the water network elements. The purpose is the estimate of the environmental loads and the related damage on the environment. The choice of the functional unit is very important and depends on the analysis objective. In this study, to estimate the impact derived from the interaction between water infrastructure and the environment, the functional unit chosen is a unit mass of material (expressed in kg). This aspect is an important detail: the sensitivity of the functional unit is known in the literature, because it provides an important contribution to the correct interpretation of the results [28],[29].
In this phase the incoming and outgoing flows are identified and quantified. The flows are expressed in physical units (units of mass and energy) and related to the collection and preparation of raw materials, transformation, use and disposal. The data for the LCI can be classified into three types:
Primary or direct data;
Secondary data, taken from literature;
Tertiary data, statistical average values.
In the case study, the primary data are provided by the water system manager:
Geometrical characteristics of the pipes and constituent materials;
Number of tanks, geometric characteristics and constituent materials;
Number of manholes, valves, sliders and pumping stations.
Secondary data:
Gray energy;
Technical characteristics of manholes, valves, sliders and pumping stations.
Tertiary data are obtained from Ecoinvent, as it provides useful data relating to production processes similar to those of the materials used. These data can include:
Means of transport and distances;
Packaging for material.
In the proposed analysis the maintenance phase will be neglected and for this reason, the study is not oriented towards a predefined ‘useful life’ of the network, as a scale parameter of the quantities to be modeled. The following table (Table 2) summarizes the essential elements necessary for the LCA analysis for each element of the network.
Data for the inventory phases (LCI)
Type |
Material |
Gray energy [MJ/kg] |
Material [%] |
|---|---|---|---|
Tank |
Concrete |
8 |
100 |
Pipeline |
Polyethylene (PE) |
46 |
19.4 |
Steel |
38 |
74.3 |
|
Cast iron |
42 |
6.3 |
|
Pump |
Elastomer |
42 |
0.3 |
Steel |
38 |
99.7 |
|
Manhole |
Concrete |
8 |
99.25 |
Elastomer |
42 |
0.38 |
|
Steel |
38 |
0.36 |
|
Polypropylene (PP) |
46 |
0.01 |
|
Slider |
Cast iron |
42 |
92.8 |
Elastomer |
42 |
0.1 |
|
Steel |
38 |
0.51 |
|
Brass |
50 |
6.59 |
|
Valve |
Cast iron |
42 |
91.56 |
Brass |
50 |
4.24 |
|
Elastomer |
42 |
0.63 |
|
Steel |
38 |
0.6 |
|
Nylon |
38 |
2.97 |
After the LCI, a classification can be made into impact category, with category indicators. The category indicators are included between the results of the LCI and the category endpoints, where the environmental damage is detected. Subsequently, it is possible to allocate the midpoint categories in one or more damage categories in order to more clearly represent the changes (damage) on the environment. The IMPACT 2002+ methodology proposes this combination of midpoint/damage oriented approach [30].
IMPACT 2002+ classified the impact estimates in fourteen impact categories, in turn, associated with four damage categories:
Human health, measured in Disability-Adjusted Life Year (DALY);
Ecosystem quality, measured in PDF m2 yr (Potentially Disappeared Fraction of species over a certain area in m2 during a certain number of years);
Climate change, measured in kg of CO2eq in the air;
Resources, measured in MJ.
As part of the LCIA, normalization will be used, although this is an optional step in the ISO 14040 standard. In fact, in this application, the normalization improves the level of comparison between the results. The normalization is the ratio between the specific impact per emission unit divided by the overall European impact of the substances with reference to a single person in a year (Table 3).
Normalization factors for the damage categories of IMPACT 2002+ method related to Western Europe [31]
Damage categories |
Normalization factor referring to q2.27 version |
Unit |
|---|---|---|
Human health |
0.0071 |
DALY/point |
Ecosystem quality |
13,800 |
PDF m2 yr/point |
Climate change |
11,600 |
kg CO2 into air/point |
Resources |
152,000 |
MJ/point |
The Rende network covers an area of about 55 km2. The supply is guaranteed by the Abatemarco, Capo D’Acqua and Crocetta aqueducts, with the management of the So.Ri.Cal. company (Società Risorse Idriche Calabresi- Calabrian Water Resources Society). The water network has a non-regular extension for the morphological characteristics of the land, distribution of the population and it supplies 7,829 utilities.
The distribution of the pipeline materials is uneven. The internal aqueduct of Rende has a singularity linked not only to the considerable elevation difference (from 130 m to over 660 masl), also because it develops in a non-continuous manner. Since the water service has to satisfy the constraints on the permissible operating pressures, it is necessary to insert a high number of tanks, located at different heights, so that it is used for the reception and accumulation phase. For this reason, each tank serves a portion of the city that is not necessarily continuous from a planimetric point of view, guaranteeing a suitable water load in each section of the network.
The Rende network has 1,089 manholes, 13 tanks, 271 km of pipes, 2 pumping systems, 1,150 sliders and 800 valves. All data used in this study is provided by the network manager.
It is necessary to note that one of the problems linked to a metabolic analysis is the difficulty in finding all the data useful for the simulation. As specified in the LCI section, to solve this problem, primary, secondary and tertiary data are used.
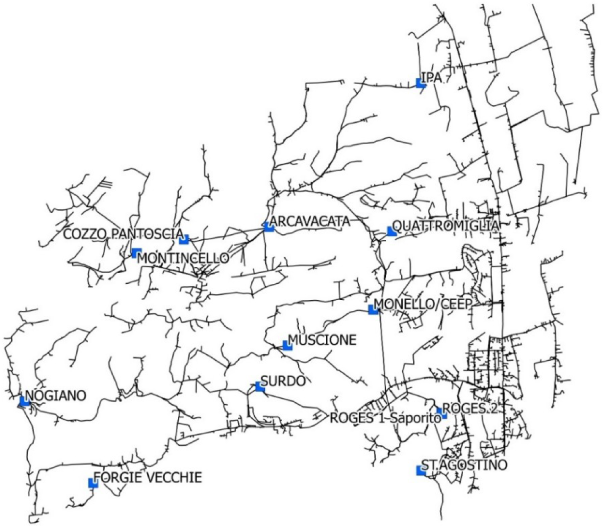
In the case studied, this problem concerns wells, valves and sliders. Analyzing the topology of the network and knowing that in technical practice these are positioned at each change of slope, direction, diameter and at each confluence, 1,089 wells have been identified. The number of valves and sliders is indicated directly by the network manager, and is equal to 1,150 and 800, respectively. For these hydraulic elements, only the technical characteristics in terms of number, materials and processes have been provided, but no information has been found regarding localization. There is a similar problem for the estimation of pumping stations: in this case also the number (2 stations) and the detail on the pump (centrifugal electric pump with cast iron structure) is provided. It is useful to clarify that the detail on the location of the hydraulic components is outside the scope of the paper and for this reason, the lack of such information does not compromise the results. The remaining data relating to pipelines and tanks (shown in Figure 1) have been directly supplied by the network manager.
Water network of Rende ‒ the blue squares indicate the tanks
The method structure aims to define the input flows (clarified in the LCI), output flows (emissions, detailed below) and cost, in terms of global impact, of the metabolism of the Rende network. For this reason the following results are classified into three sections: the first about the impact of the network elements (input), the second which highlights the impacts associated with the outputs (emissions) and the third for the network metabolism cost estimate.
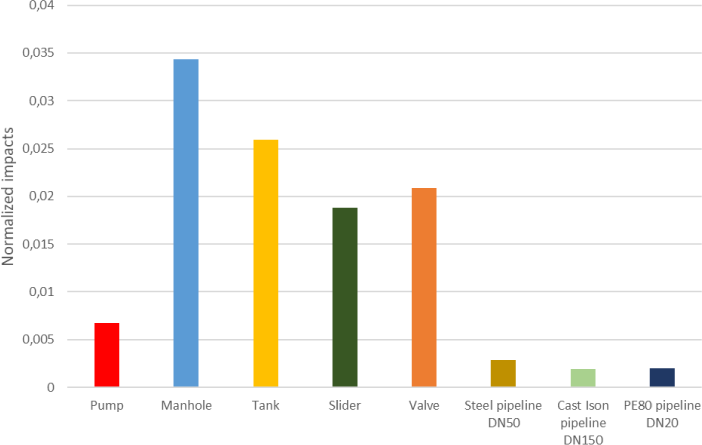
The IMPACT 2002+ methodology made it possible to identify the input and output flows relating to the single element constituting the network analyzed. As can be seen from Figure 2, an important role on the impacts is assumed by the manholes, tanks and valves. A low total impact is explained by the pipes and pumping stations, which are present in small numbers.
IMPACT 2002+ methodology ‒ impact values per element
The following table (Table 4) shows the potential emissions into the air, water and soil related to the water network life cycle. These are normalized values that express the presence in the environment of some substances (in minimal quantities), closely related to the phases of the life cycle, characterized by the processes selected in the database and linked to the functional unit chosen. In general, the greatest effects are associated to the air emissions, and this is linked to the Respiratory inorganics, like the impact category associated with the human health damage category. This category has a high value (approximately 93% of the total of the damage category). Recurring substances in most cases are nitrogen oxides, particulate matter and sulfur dioxide. For water and air emissions there are reduced values compared to the previous type. Arsenic, barium and zinc are present in small quantities and for this reason, do not cause damage to the surrounding environment and to those who live it.
IMPACT 2002+ methodology – normalized values for water, air and soil emissions expressed by points (Pt)
Type |
Water emissions |
Air emissions |
Emissions in soil |
|||
|---|---|---|---|---|---|---|
Tank |
Arsenic |
2.39E−05 |
Hydrocarbons, aromatic |
0.000189 |
Aldrin |
1.4E−06 |
Barium |
1.29E−05 |
Nitrogen oxides |
0.002989 |
Arsenic |
1.91E−05 |
|
Hydrocarbons, aromatic |
1.15E−05 |
Particulates, < 2.5 um |
0.004064 |
Barium |
2.05E−06 |
|
Zinc |
2.02E−06 |
Sulfur dioxide |
0.00123 |
Zinc |
2.28E−05 |
|
|
|
Chromium |
1.57E−05 |
|
|
|
Steel pipeline |
Arsenic |
4.59E−06 |
Hydrocarbons, aromatic |
5.61E−05 |
Aldrin |
1.47E−07 |
Barium |
2.22E−06 |
Nitrogen oxides |
0.000184 |
Aluminium |
1.28E−07 |
|
Hydrocarbons, aromatic |
4.68E−07 |
Particulates, < 2.5 um |
0.000747 |
Arsenic |
2.74E−06 |
|
|
|
Sulfur dioxide |
0.000205 |
Zinc |
2.19E−06 |
|
|
|
Hydrocarbons, aromatic |
4.01E−05 |
|
|
|
Cast iron pipeline |
Arsenic |
1.08E−06 |
Nitrogen oxides |
0.000127 |
Arsenic |
1.11E−06 |
Barium |
1.87E−06 |
Particulates, < 2.5 um |
0.000184 |
Barium |
2.6E−07 |
|
Hydrocarbons, aromatic |
3.72E−07 |
Sulfur dioxide |
0.000153 |
Zinc |
1.08E−06 |
|
|
|
Hydrocarbons, aromatic |
3.89E−05 |
|
|
|
|
|
Nitrogen oxides |
0.000138 |
|
|
|
PE80 pipeline |
Arsenic |
1.13E−06 |
Particulates, < 2.5 um |
0.000256 |
Arsenic |
1.48E−06 |
Barium |
1.94E−06 |
Sulfur dioxide |
0.00017 |
Barium |
2.67E−07 |
|
Hydrocarbons, aromatic |
4.1E−07 |
Hydrocarbons, aromatic |
0.000134 |
Zinc |
1.21E−06 |
|
|
|
Nitrogen oxides |
0.000492 |
|
|
|
|
|
Particulates, < 2.5 um |
0.001025 |
|
|
|
Pump |
Arsenic |
1.35E-05 |
Sulfur dioxide |
0.000442 |
Aldrin |
1.86E−07 |
Barium |
5.93E-06 |
Hydrocarbons, aromatic |
0.000357 |
Arsenic |
5.02E−06 |
|
Hydrocarbons, aromatic |
3.30E-06 |
Nitrogen oxides |
0.003498 |
Molybdenum |
1.5E−07 |
|
|
|
Particulates, < 2.5 um |
0.005185 |
Zinc |
1.04E−05 |
|
Manhole |
Arsenic |
4.10E−05 |
Sulfur dioxide |
0.001825 |
Aldrin |
1.62E−06 |
Barium |
2.02E−05 |
Ammonia |
0.000139 |
Arsenic |
2.45E−05 |
|
Hydrocarbons, aromatic |
1.41E−05 |
Arsenic |
0.001436 |
Barium |
3.05E−06 |
|
Zinc |
2.99E−06 |
Hydrocarbons, aromatic |
0.000223 |
Zinc |
2.65E−05 |
|
Slider |
Arsenic |
2.17E−05 |
Nitrogen oxides |
0.001095 |
Aluminium |
3.68E−07 |
Barium |
9.93E−06 |
Particulates, < 2.5 um |
0.002822 |
Arsenic |
8.39E−06 |
|
Hydrocarbons, aromatic |
3.36E−06 |
Sulfur dioxide |
0.002444 |
Barium |
1.33E−06 |
|
Zinc |
1.96E−06 |
Arsenic |
0.001362 |
Zinc |
6.66E−06 |
|
|
|
Hydrocarbons, aromatic |
0.000267 |
|
|
|
Valve |
Antimony |
4.79E−06 |
Nitrogen oxides |
0.001267 |
Aluminium |
3.67E−07 |
Arsenic |
2.96E−05 |
Particulates, < 2.5 um |
0.002927 |
Arsenic |
8.83E−06 |
|
Barium |
1.01E−05 |
Sulfur dioxide |
0.00251 |
Barium |
1.34E−06 |
|
Hydrocarbons, aromatic |
3.41E−06 |
|
|
Cadmium |
2.26E−07 |
|
Zinc |
1.99E−06 |
|
|
Zinc |
6.77E−06 |
|
In conclusion, gathering the information of the previous phases it is possible to discuss about the cost of the network metabolism, referring to the following figures. The results presented refer to the total values of the structural elements of the network.
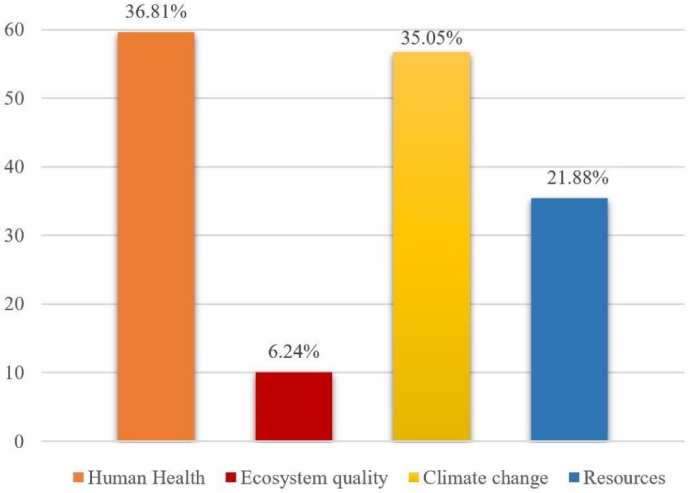
The graph presented below (Figure 3) show the partial contribution of the metabolism cost regarding the Rende water network. As previously specified, the metabolism cost is equal to the sum of the contributions associate with the single damage categories. In this case, the cost represents a normalized value for the Impact 2002+ choices, for this reason it is an useful threshold value. This approach is at the basis of the process of allocating the available data for the reconstruction of the network metabolism. For this reason it is more useful to focus attention on the partial and not on the total cost. The partial values provide the contributions, classified by damage categories, useful for identifying the most severe impact classes.
It can be seen in Figure 3 that the network has a greater impact on the categories concerning human health (36.81%) and climate change (35.05%). This is justifiable because the production of the materials causes emissions into the environment, which are certainly a source of danger for humans. The same evaluation is useful for the global warming category interpretation. Moreover, it is necessary to remember how the climatic variations occurred in the last decades are linked to human activities.
The problem of climate change impacts is significant because it is connected to the use of non-renewable resources, such as coal, oil, natural gas. These are fossil fuels and hydrocarbons that have the disadvantage of being exhaustible and unavailable in over the planet. When these sources are used to produce energy, a very high quantity of gases is released, responsible for the greenhouse effect, global warming, acid rain and other highly impacting environmental phenomena. It is therefore necessary to prefer renewable sources, whose main advantage is the low environmental impact.
Additional impacts occur on resources (21.88%), since the elements production leads to the impoverishment of the raw materials found in the nature.
IMPACT 2002+ methodology ‒ totals for damage category related to the
Examining in detail the modeling results (Table 5), climate change has a greater weight in the case of tanks and manholes. This consideration is reflected by the relation to the global warming impact category. Steel pipes, pumps, sliders and valves produce more damage on human health, specifically influencing impact categories related to respiratory effects. Sliders and valves are the most impacting elements in ecosystem quality, in particular on the terrestrial ecotoxicity. For the resources category, the greatest consumption is associated with cast iron and polyethylene pipes, but also pumps, manholes and valves, with minor values. The related impact category with the highest score is linked to the use of non-renewable energies, that is an incident element in the evaluation of the infrastructure impacts on the territory. In order to have a reduction in environmental loads, use of renewable energies, trying to reuse waste from processing rather than exploiting the subsoil for production and the fuel needed for different industrial processes are useful.
IMPACT 2002+ methodology ‒ totals for the impact category
Damage categories |
Impact categories |
|
|---|---|---|
Human health |
Carcinogens |
2.500 |
Non-carcinogens |
5.132 |
|
Respiratory inorganics |
51.601 |
|
Ionizing radiation |
0.103 |
|
Ozone layer depletion |
0.005 |
|
Respiratory organics |
0.264 |
|
Ecosystem quality |
Aquatic ecotoxicity |
0.142 |
Terrestrial ecotoxicity |
8.726 |
|
Terrestrial acid/nutri |
0.647 |
|
Land occupation |
0.585 |
|
Aquatic acidification |
0 |
|
Aquatic eutrophication |
0 |
|
Ozone layer depletion |
0.005 |
|
Climate change |
Global warming |
56.749 |
Resources |
Non-renewable energy |
34.808 |
Mineral extraction |
0.621 |
|
For better results interpretation, it is necessary to make a clarification: in the network there are elements of different kinds, so the quantities of material are not the same for everyone. For this reason some results, such as those relating to manholes, are more pronounced than others (for example tanks). These data do not take into account the same quantities at mass level, which sometimes differ by more than an order of magnitude. This would make the comparison complex, which in reality is not the objective of the analysis, which instead aims to obtain an estimate of the metabolic cost associated with the Rende water network.
Finally, it is also important to study the level of sustainability of the life cycle phases. The following graph (Figure 4) shows the contributions classified by ‘Production’, ‘Use’ ‘End life’ in order to estimate the sensitive phases of the life cycle. This further result is useful to increase the level of metabolic screening. The metabolism cost, in fact, provides an impact data associated with the entire life cycle, but the detail on the impact related to the single phase of the life cycle helps to facilitate the location of the critical phases, that are those with a high cost.
Comparison of the impact contribution in the life cycle phases
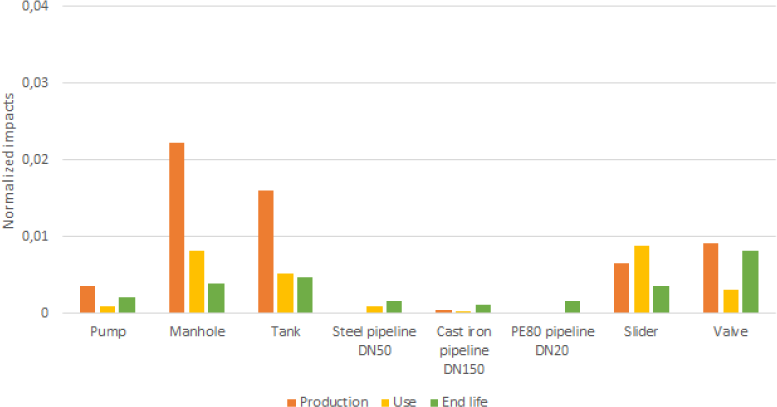
From the analysis of Figure 4. Comparison of the impact contribution in the life cycle phases, it can be deduced that manhole, tank, slider and valve represent the worst situations in the overall life cycle of the network. Specifically, the major contribution of the production phase is linked to manhole and tank, while the other cases balance the three steps of classification of the life cycle. The reasons for these results refer to what is described for Figure 2 and Figure 3. From this graph, it is possible to define the most impacting phase in the estimation of the metabolism cost of the Rende network. The results obtained are certainly linked to the age of the water infrastructure. This value can be considerably reduced through an LCA with ‘cradle to cradle’ analysis when the end life outputs are the input of the production phase, but at present, there are no data and information for this assumption.
The metabolism of a water network requires different assessments and for this reason it is part of a still evolving field of investigation.
In this work an original methodology and an application of the metabolic approach to the water network of the municipality of Rende (Italy) is presented. The methodological structure chosen provides for the estimation of the network metabolism through the LCA based on the analysis of input and output flows, in line with the metabolic analysis techniques MFA and Process Analysis. The metabolism concept, in this case, is based on the balance between input and output of the network. In detail the incoming flows refer to matter and energy that characterize the life cycle of each component of the water network, while the output is represented from emissions into the air, water and soil. The metabolism cost of the Rende water network is associated with the estimate of the potential damage determined on the environment, which can be defined by the LCA analysis.
The application represents an attempt at a real confirmation of the proposed methodology structure. The case study allowed an easy application and interpretation of the results because the available data are useful to define a threshold value of ‘metabolism cost’ comparable, in the future, with the analysis of different scenarios in order to define the best performing one.
The application highlights that is important to quantify the total and partial impacts of the water network and the individual elements that make it up, in order to define, based on the comparison with the emissions produced, the phase or phases with the greatest impact on the environment. This is the advantage of metabolic analysis: analyzing the balance between entry and exit to obtain an estimate of the environmental cost for the system, with the aim of overcoming the sustainability idea linked not only to recycling, reuse and biodegradability, but aimed at a remodeling of the materials life cycle.
- ,
Infrastructure Vulnerability Index of drinking water systems to terrorist attacks ,Aziz HA, editor. Cogent Eng. 2018 Jan 1 , Vol. 5 (1),pp 1456710 , , https://doi.org/https://doi.org/10.1080/23311916.2018.1456710 - ,
Optimization of Drinking Water Distribution Systems in Relation to the Effects of Climate Change ,Water. 2017 Oct 19 , Vol. 9 (10),pp 803 , , https://doi.org/https://doi.org/10.3390/w9100803 - ,
A methodological proposal for the evaluation of potable water use risk ,Water Pract Technol. 2015 Mar 1 , Vol. 10 (1),pp 152–63 , , https://doi.org/https://doi.org/10.2166/wpt.2015.017 - ,
Combined Reuse of Wastewater and Desalination for the Management of Water Systems in Conditions of Scarcity ,Water Ecol , Vol. 4 (72),pp 116–26 , 2017 - ,
A proposal for multiple reuse of urban wastewater ,J Water Reuse Desalin. 2018 Dec 1 , Vol. 8 (4),pp 468–78 , , https://doi.org/https://doi.org/10.2166/wrd.2017.144 - ,
Introducing a new method for calculating the environmental credits of end-of-life material recovery in attributional LCA ,Int J Life Cycle Assess. 2015 May 1 , Vol. 20 (5),pp 645–54 , - ,
Synthetic sustainability index (SSI) based on life cycle assessment approach of low impact development in the Mediterranean area ,Abdul Aziz H, editor. Cogent Eng. 2017 Jan 1 , Vol. 4 (1),pp 1410272 , , https://doi.org/https://doi.org/10.1080/23311916.2017.1410272 - ,
The Changing Metabolism of Cities , 2007 - ,
Energy and Air Emission Effects of Water Supply ,Environ Sci Technol. 2009 Apr 15 , Vol. 43 (8),pp 2680–7 , , https://doi.org/https://doi.org/10.1021/es801802h - ,
Water supply and sustainability: Life cycle assessment of water collection, treatment and distribution service ,Int J Life Cycle Assess. 2013 , Vol. 18 (5),pp 1158–68 , - ,
Modello Metabolico Urbano come strumento per l’analisi di sostenibilità dei sistemi idrici urbani: il caso studio di Reggio Emilia , - ,
Life cycle assessment of a water distribution system in a context of depopulation The Rainbows Project (Japan Water Research Center) View project PipeΣ Project View project , 2016 - ,
Life cycle assessment of pipes and piping process in drinking water distribution networks to reduce environmental impact ,Sustain Cities Soc. 2018 Nov 1 , Vol. 43 ,pp 538–49 , , https://doi.org/https://doi.org/10.1016/j.scs.2018.09.014 - ,
Sustainability criteria for the selection of water supply pipeline ,Cameselle C, editor. Cogent Eng. 2018 Jan 1 , Vol. 5 (1),pp 1491777 , , https://doi.org/https://doi.org/10.1080/23311916.2018.1491777 - ,
Environmental Engineering and Management , Vol. 18 , 2019 - ,
Eco-Efficiency Indicators for Urban Transport. J Sustain Dev Energy, Water Environ Syst , Vol. 3 (2),pp 183–95 , 2015, https://doi.org/https://doi.org/10.13044/j.sdewes.2015.03.0015, Jun 1 - ,
Environmental systems analysis tools - An overview ,J Clean Prod. 2005 Oct , Vol. 13 (12),pp 1165–73 , - ,
Escalating Trends in the Urban Metabolism of Hong Kong: 1971–1997 ,AMBIO A J Hum Environ. 2001 Nov , Vol. 30 (7),pp 429–38 , , https://doi.org/https://doi.org/10.1579/0044-7447-30.7.429 - ,
Human Appropriation of Net Primary Production as an Environmental Indicator: Implications for Sustainable Development ,A J Hum Environ. 1997 , Vol. 26 (3),pp 143–6 , - ,
Ecological network analysis of urban metabolism based on input-output table ,Procedia Environ Sci. 2012 , Vol. 13 ,pp 1616–23 , , https://doi.org/https://doi.org/10.1016/j.proenv.2012.01.154 - ,
The Structure of Ecosystemsle ,J Theor Biol. 1973 , Vol. 41 (3),pp 535–46 , - ,
Comparing urban solid waste recycling from the viewpoint of urban metabolism based on physical input–output model: A case of Suzhou in China ,Waste Manag. 2012 Jan , Vol. 32 (1),pp 220–5 , , https://doi.org/https://doi.org/10.1016/j.wasman.2011.08.018 - ,
Net energy analysis. Resour Energy. 1978 Nov , Vol. 1 (3),pp 267–313 , , https://doi.org/https://doi.org/10.1016/0165-0572(78)90008-7 - ,
Scarcity of exergy and ecological evaluation based on embodied exergy ,Commun Nonlinear Sci Numer Simul. 2006 Jul , Vol. 11 (4),pp 531–52 , - ,
Urban metabolism: A review of research methodologies ,Environ Pollut. 2013 Jul , Vol. 178 ,pp 463–73 , , https://doi.org/https://doi.org/10.1016/j.envpol.2013.03.052 - ,
Metabolic Impact Assessment for urban planning ,J Environ Plan Manag. 2013 Mar , Vol. 56 (2),pp 178–93 , , https://doi.org/https://doi.org/10.1080/09640568.2012.657953 - , Development of Innovative Platforms for Calculating the Energy Incorporated in Building and Models for Quantifying the Ventilative Cooling Potential in the Building Industry, Palermo, 2015
- ,
Influence of functional unit on the life cycle assessment of traction batteries ,Int J Life Cycle Assess. 2007 May 24 , Vol. 12 (3),pp 191–6 , , https://doi.org/https://doi.org/10.1065/lca2007.04.322 - ,
Development of a methodological framework for social life-cycle assessment of novel technologies ,Int J Life Cycle Assess. 2017 Mar 13 , Vol. 22 (3),pp 423–40 , , https://doi.org/https://doi.org/10.1007/s11367-016-1162-1 - ,
IMPACT 2002+: A new life cycle impact assessment methodology ,Int J Life Cycle Assess [Internet]. 2003 Nov , Vol. 8 (6),pp 324 , , https://doi.org/https://doi.org/10.1007/BF02978505 - ,
IMPACT 2002+: User Guide Draft for version Q 2.21 (version adapted by Quantis) [Internet] , 2012