


Global energy demand is increasing rapidly, which has a negative environmental impact as it is followed by growth in greenhouse gases emissions. Approximately 40% of energy consumption and 36% of carbon dioxide (CO2) emissions in the EU come from the building sector, making it the largest energy consumer in Europe [1]. Due to upcoming legislation, all newly constructed buildings will have to meet minimal energy consumption criteria to achieve the nearly Zero-Energy Building (nZEB) performance standard. A step further are autonomous buildings, which use energy from the grid only as a backup or do not even require grid connection at all. Utilization of renewable sources and energy storage enables independent energy supply [2]. The most abundant and easily available renewable source is solar energy, which can be used in a variety of options in households. Different types of solar collectors and panels are installed worldwide in order to meet heating and electricity demand. Most of the cooling demand is currently provided by air-conditioning systems using electricity. Renewable energy sources, such as solar panels, can be used to generate required electricity and at the same time make these systems sustainable. One suitable option is the utilization of Photovoltaic Thermal Collectors (PVT), which can ensure both thermal energy for heating and electricity to drive components of a cooling system [3].
Numerous studies were conducted for potential evaluation of implementing those PVT systems in different regions, which have distinct location conditions and economic environment. Some studies have been carried out with different system configurations focusing on PVT collectors.
In that context, Ramos et al. [4] assessed technical potential and basic economic implications of solar trigeneration system integration in domestic sector. Detailed calculations had proven that such PVT systems are capable to cover approximately 60% of heating and in most cases 100% of cooling demand in observed households located at different European latitude regions. Through the economic analysis, results have shown that PVT systems have 30-40% lower Levelized Cost of Energy (LCOE) over 20 years of operation than that of equivalent PV-only systems. It was also stated that high initial costs of PVT combined with poor knowledge of the technology which emerges from its limited application, results in limited growth of the market for hybrid PVT system for combined cooling and/or heating applications. Authors have also added a capital costs and stated that price of PVT collector per kW is 85% higher than the price of PV module for the exact nominal power.
Chen et al. [5] have conducted a study on four solar trigeneration system layouts by altering the type of PVT collector (glazed/unglazed) and type of absorption chiller (single/half-effect) used for cooling. In the economic evaluation, they stated that PVT collector costs amount to 77% of the total capital investment costs. The authors stressed an importance of subsidies for the PVT system viability. Peak-valley electricity market was used by considering low, medium and high electricity prices, which were distributed by different hours of the day. However, energy storage was not used, and electricity price profile was not considered.
Techno-economic performance of solar combined heat and power system based on PVT collectors have been investigated by Herrando et al. [6] In addition to PVT collector, the system consisted of water storage, an auxiliary heater and a battery storage subsystem. An objective of the paper was to find an optimal size of the system by means of minimised payback period and levelized production cost per kWh of covered household energy. In addition to that, the aim was also to minimise the interaction with the grid and limit the amount of excess heat. They have taken into account different prices environment for each location, but the prices were considered constant.
Herrando et al. [7] have examined the techno-economic performance of solar combined cooling, heating and power system. The research was conducted for a campus building with three alternative solar systems (PV, PVT and evacuated tube collector). Results have shown that system with PVT is the most convenient in the terms of reducing CO2 emissions and primary energy usage. In this context, they stated that this kind of system has the potential to decarbonise urban areas, but the additional research of selected technologies is required with the goal to improve efficiency and reduce investment cost.
Coupling PVT with Heat Pump (HP) has also been assessed and it has been shown that such systems have many benefits. During the daytime, in addition to thermal energy production, PVT is generating electricity to power HP compressor and meet household electricity load. In periods when there is no solar irradiation, a HP can be used to meet heating and DHW demand. Thus, there are no periods when at least one renewable source is not utilized. Depending on the heat source, different HP types can be used. A one suitable configuration is the system that consists of PVT collectors and a Ground Source Heat Pump (GSHP). That type of trigeneration can reduce the capacities of the PVT and GSHP in comparison to the individual systems. Some operation methods of such a system had been studied by Bae et al. [8].
In addition to analysing the system like mentioned in the literature above, presumed future electricity market prices for the household sector have been also considered. Since the share of intermittent renewable energy sources is increasing, some changes and adaptations must be made to attain a well-functioning electricity market. Thereby, consumers have an essential role in achieving necessary flexibility for a successful adaptation of the electricity system to variable and distributed renewable electricity generation [9]. It is expected that an active participation in a market will unlock many opportunities for consumers. Nevertheless, without real-time energy consumption data, their active participation in the energy market is limited. By providing consumers with information about current energy prices and energy consumption, an effective electricity market with many benefits for participants can be achieved [10]. In that context, a new market framework that rewards flexibility and innovation has been created by the EU. According to the recent EU Directive regarding the internal electricity market, all consumer groups (industrial, commercial and households) will have access to the market with dynamic electricity prices by 2023 [11]. Consumers will have the possibility to participate in all forms of demand response and adjust their consumption according to real-time price signals. In that way, they will be able to benefit from direct participation in the market in terms of reduced bills. In addition, the electricity system will also benefit from having greater flexibility.
Since the most of referenced authors have not observed the possibility of including electricity price with different values over hours, we decided to add this consideration into the research. An interaction between the prosumer equipped with a solar trigeneration system in low-energy house and electrical grid have been modelled for the purpose of this study. Considering a profile of electricity prices and scheduling heating of storage tank can possibly reduce operation costs of such system. The aim of the study was to prove that by using different types of heating sources in dependence of not only demand but also electricity prices, costs would be lower than those in approach when only demand is considered.
The structure of this paper is the following. First, the methodology is presented, selected house is described and an energy demand profiles are shown. Second, the layout of installed trigeneration system is presented, with associated model equations of its main components and applied assumptions. Thirdly, results of conducted simulation of the system are shown. Furthermore, comparison of different control methods is evaluated. Finally, results are discussed, and conclusions are presented.
A PVT-based system with a HP and a storage tank was simulated. The calculation was conducted for a family house situated in northwest Croatia. Its heating and cooling demand were obtained by entering thermo-physical properties and dimensions of selected building into a software, which is used for the energy certification of buildings. Simulation of the system consisting of PVT collectors, GSHP, auxiliary heater and thermal storage tank was performed through a 24-hour period for three representative days from different seasons (summer, winter and transition). A representative day in January was chosen for the winter period, a representative day in July for summer period and a representative October day for transition period. Since there is a connection to the grid, battery storage was not integrated into the system, so excess electricity could be fed back to the grid.
As the selected trigeneration system has more heat sources, various operation methods could be applied. Two approaches were evaluated: first based on an electricity price evolution and second based on maintaining minimum tank water temperature. By consideration of electricity prices changes during the night hours, when the price was lower than the average daily price, HP and auxiliary heater were fully operating regardless of the temperature in the storage tank. Water was in this case a few degrees above 60 °C in the morning period and the heater did not have to be turned on often during hours when the electricity prices are high. In the second approach, the system (HP and auxiliary heater) was operated in such a way to ensure that the temperature in the storage tank was 60 °C. The water temperature was kept above 60 °C to avoid spreading of Legionella bacteria. Following recommendations, the temperature of about 50 °C is still acceptable, but it should not fall below 45 °C as the temperatures for optimal Legionella growth are between 20 °C and 45 °C [12]. Solar irradiance is high during the summer days and large enough to cover most of the DHW needs. Additionally, electricity is generated and fed to the grid. In a summer period, a HP was used only for covering cooling demand directly through the fan coil units. In a winter period storage tank was heated by HP and auxiliary heater, while PVT output temperatures were below the temperature of water in tank, so the heat transfer fluid was redirected through the bypass. Transition period used the same thermal sources as in the winter period, but the heating demand was lower.
In further subchapters, more information and system model are given.
Selected two-storey house has a 180 m2 heated and cooled floor area. It is located in a northwest Croatia region, which has a continental climate. The considered house was compact with a favourable surface-to-volume ratio (equal to 0.7 m-1), so there was minimum surface area through which heat can escape. Moreover, an envelope of a house was well insulated to minimize heat losses, thus reducing the heating demand. The latter put a building in a low-energy house category with less than 30 kWh/m2 of space heating demand per year. Roof, with a 75 m2 of useful area, had a slope of 35 degrees and was fully oriented towards the south, which favoured the greater efficiency of installed solar collectors. As the amount of energy consumed in buildings greatly depends on meteorological and climate data, they must be considered when modelling heating and cooling systems. Profiles of energy demand for heating, cooling and DHW are shown in Figure 1.
Monthly energy demand

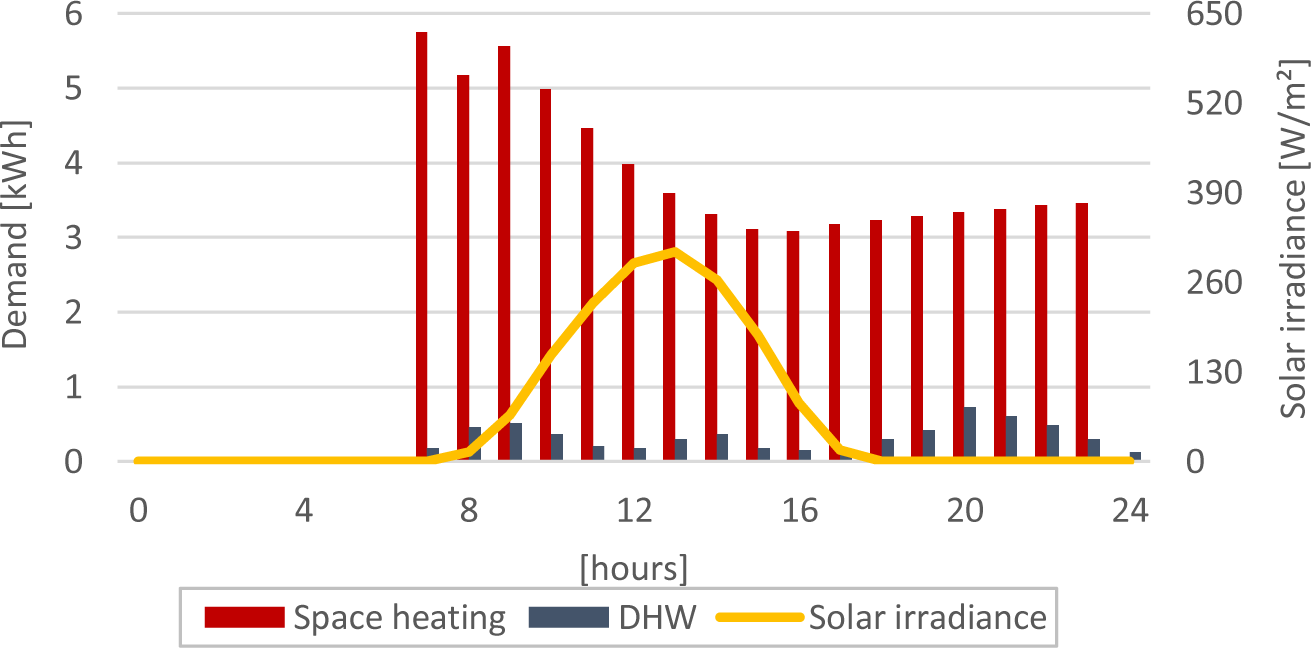
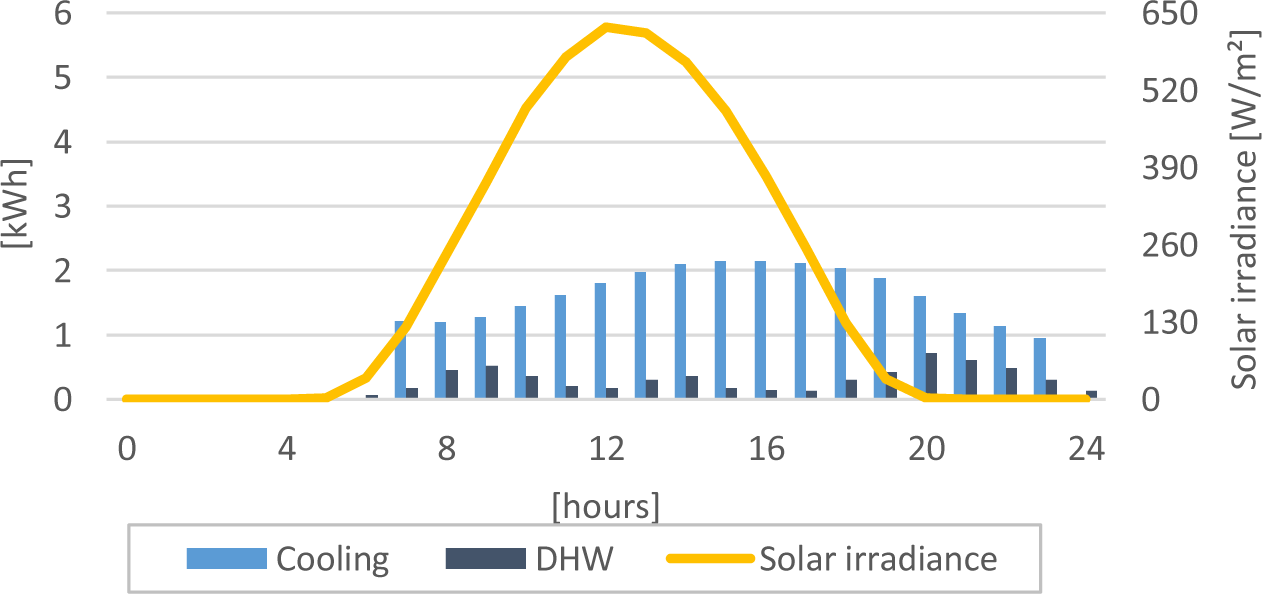
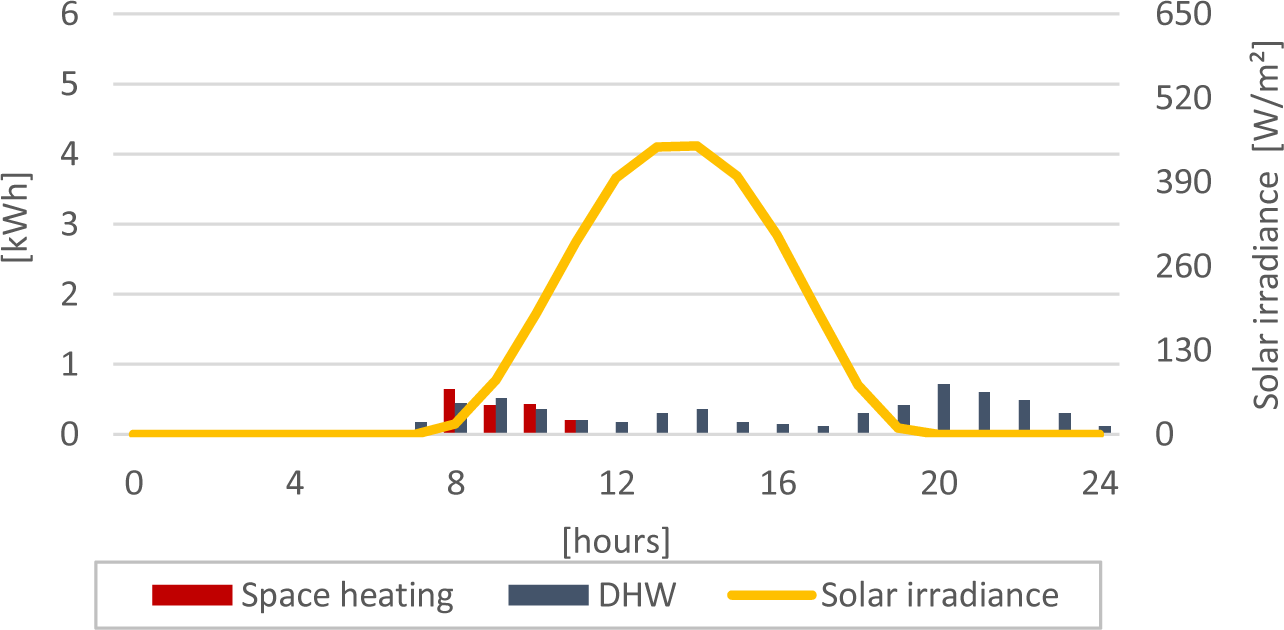
DHW needs are assumed constant through the year, while heating and cooling demands are variable. It must be noted that there is no heating demand in the months where cooling is needed and in vice versa. For more precise simulation, which must be performed for interaction with hourly electricity market, an hourly timestep must be used. A typical winter and summer weather days were simulated. Hourly profiles of heating, cooling and DHW demand can be seen in Figures 2-4. Data for space heating and cooling demand, and Global Horizontal Solar Irradiance (GHI) were considered for a representative day of each period. DHW demand was assumed to have the same daily profile in every season and the profile was obtained according to Weiss [13].
Hourly profile of DHW and space heating demand (winter period)
Hourly profile of DHW and space heating demand (summer period)
Hourly profile of DHW and space heating demand (transition period)
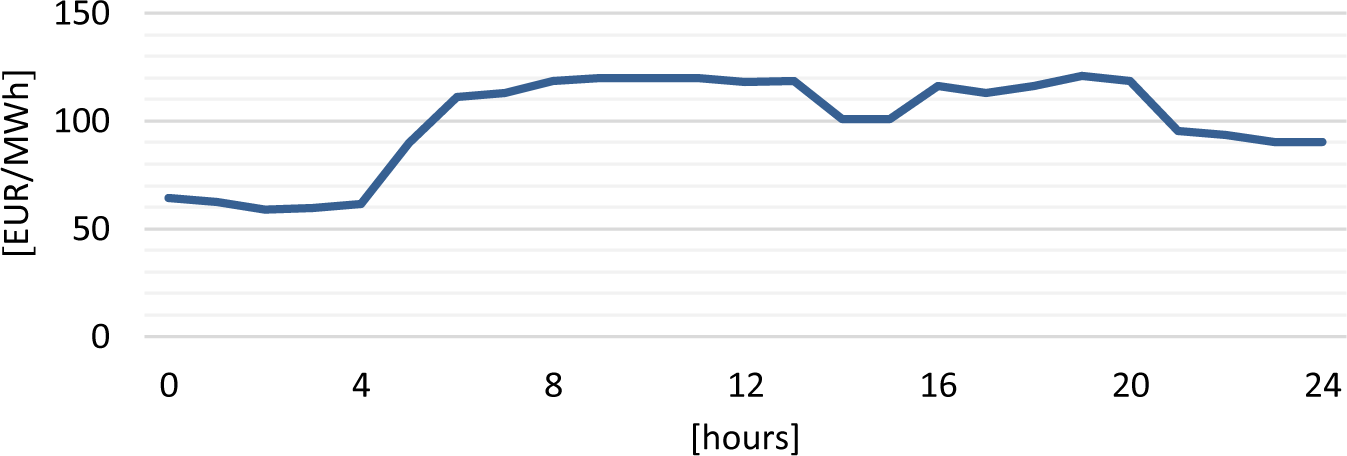
As the hourly intraday market is currently not opened for households, the prices were assumed according to Eid et al. [14] and are shown in Figure 5. It can be noticed that prices were the highest in the daily period in which was the overall electricity demand higher. In those hours, it was favourable to generate own electricity using PVT collector and sell a surplus to the grid.
Hourly electricity prices
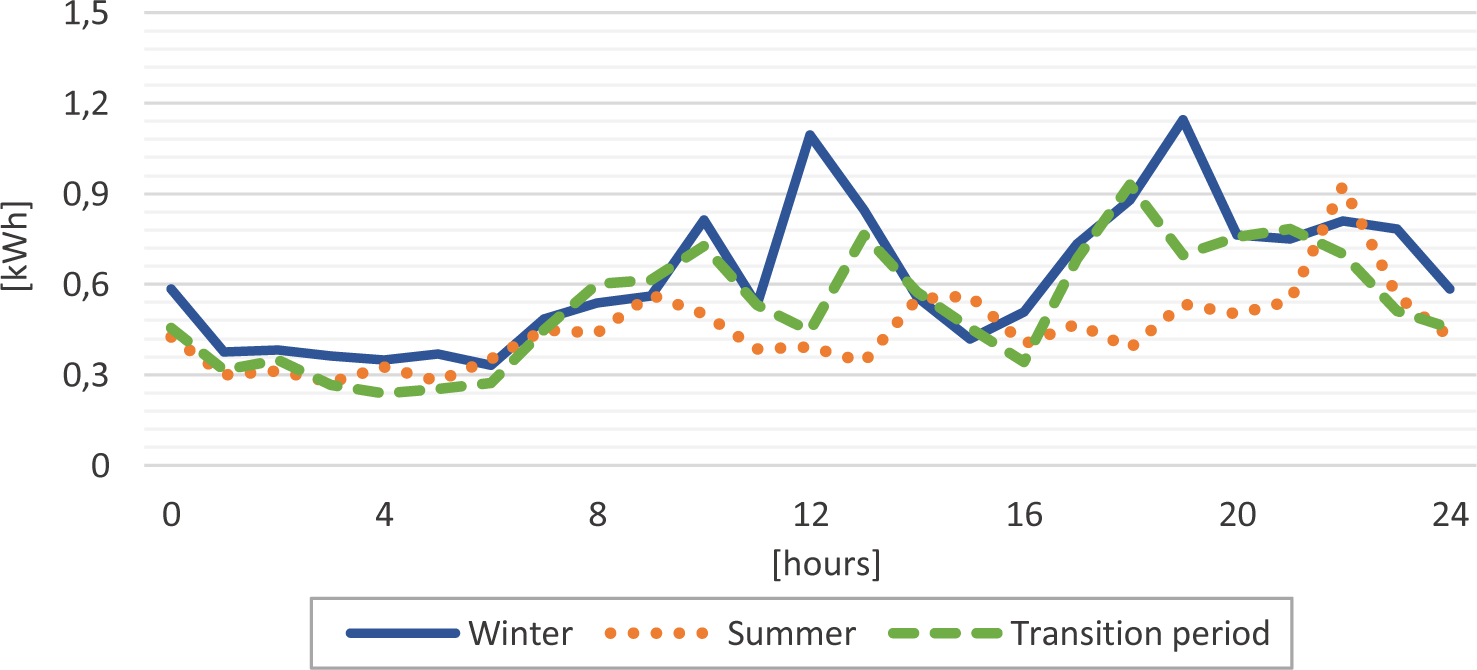
Household electricity demand excluding auxiliary power required for the operation of compressor and heater is shown in Figure 6. Compressor and auxiliary heater demands were calculated from the simulation of the system and were dependent on the operation strategy. Daily consumption trend was distinct for winter, summer and transition period. The chart was made according to [15]. In the absence of accurate measurements, a similar expected prices profile was adopted.
Electricity demand
The simulation model developed for the purpose of this study allows the estimation of the generated electricity and the energy balance of the system. This served to compare the response to the different operation modes. The input data are based on the actual values used in such system components and were obtained from the available literature. The layout of the system was selected after studying the solutions from the available relevant papers. Modelling assumptions and system model with main equations are described in the following sections.
List of the model assumptions, input and output values are given below. Modelling assumptions are the following:
Properties of PVT parts were independent of temperature;
The storage tank was observed without stratification, as a fully mixed volume;
Specific heat capacities and heat transfer coefficients were considered constant;
HP power output was assumed constant as well as its Coefficient of Performance (COP);
Circulating pumps were not considered.
Main system inputs are solar irradiation, electricity prices, heating demand and outdoor temperature. The main output is produced electricity.
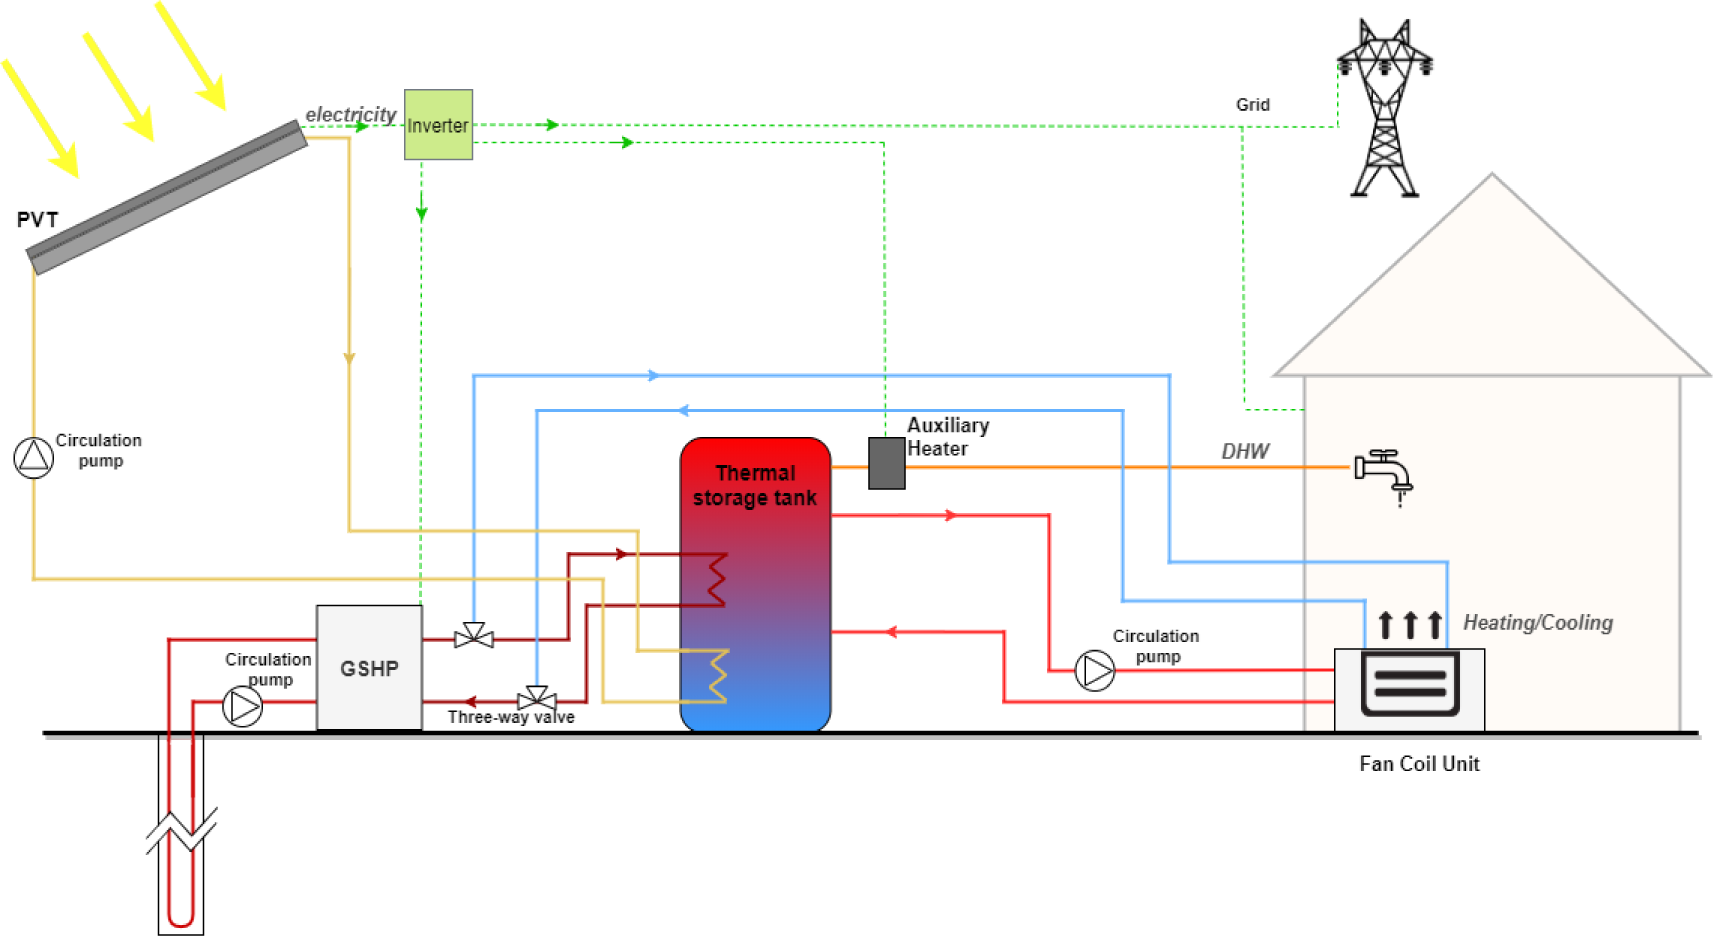
Since the observed climate region requires both space heating and cooling, installation of a trigeneration system is an appropriate option as it can fulfil the electricity, heating, DHW and cooling demand. The system selected for this study had a similar design as mentioned above, and its scheme is shown in Figure 7. In addition to PVT and GSHP, key components were also the thermal storage and auxiliary electric heater.
System scheme
The main components of a standard flat-plate PVT collector are a PV module and a thermal absorber. The heat transfer fluid circulates in the solar loop and transfers the collected heat to the thermal storage [16]. Simultaneously, electricity generated on the PV part of the panel is used to cover household demand, and if there is a surplus, it is sold to the grid. The PVT consists of many layers which must be taken into account when conducting a detailed dynamic simulation. For the purposes of this study, a simplified model was used to approximately mimic thermal inertia.
Energy balance of heat transfer fluid:
(1)
PV’s cell electric efficiency:
(2)
Electricity production:
(3)
Thermal storage was assumed to be a fully mixed volume. In the summer period, it was used to accumulate thermal energy needed for DHW, while in the winter was used for fulfilling both space heating and DHW demand. Energy balance equation of the storage is given:
(4)
where Tst accounts for the water temperature in the storage tank. Heat losses from the storage to the environment were calculated using the thermal coefficient (Ust). Heat transferred from the solar fluid was calculated using the thermal coefficient (Ue,PVT) and area (Ae,PVT) of the immersed heat exchanger. Heating demands (Qh) and (Qhp), which refer to the heat from the HP, were equal to zero in the summer period. Heat flow needed for DHW is denoted by Qdhw, while Qaux denotes the heat provided by the auxiliary heater.
System variables
Variable |
Value |
|---|---|
Specific heat capacity of the heat transfer fluid (chtf) [Jkg−1K−1] |
2,840 |
Mass flowrate of the heat transfer fluid (mhtf) [kg/s] |
0.024 |
Specific heat capacity of water (cw) [Jkg−1K−1] |
4,187 |
Heat transfer coefficient of storage tank (Ust) [Wm−2K−1] |
5 |
Heat transfer coefficient of the PVT heat exchanger located in the storage tank (Ue,PVT) [Wm−2K−1] |
200 |
Area of PVT heat exchanger in the storage tank (Ae,PVT) [m2] |
0.5 |
Ambient temperature (Tamb) [°C] |
20 |
GSHP was selected. Its COP was considered constant with a value of 3.5 in heating mode and 4 in cooling mode. In the winter, HP was connected to the thermal storage and it heated water, which was further distributed to the heating system and for DHW needs. It was switched on or off depending on the temperature in the thermal storage. Through bypass were inlet and outlet flow redirected contingent on whether it is winter or summer period. In cooling mode, the HP outlet, cooled water from the condenser, was directly connected to fan coil units used for space cooling. There was no interaction with the thermal storage during this period. Electricity needed for HP compressor was obtained primarily from the PVT output or additionally from the grid.
Hourly simulations were conducted during typical winter, summer and transition days. In all periods, the first mode, in which was storage tank overheated during the night, proved to be more profitable. Daily balances of electricity (used electricity subtracted from generated electricity) are shown in Figures 8-10. Negative values indicate that electricity is purchased from the grid, while positive values signify that there is an excess of electricity that can be exported and sold in the market.
Electricity balance (summer period)
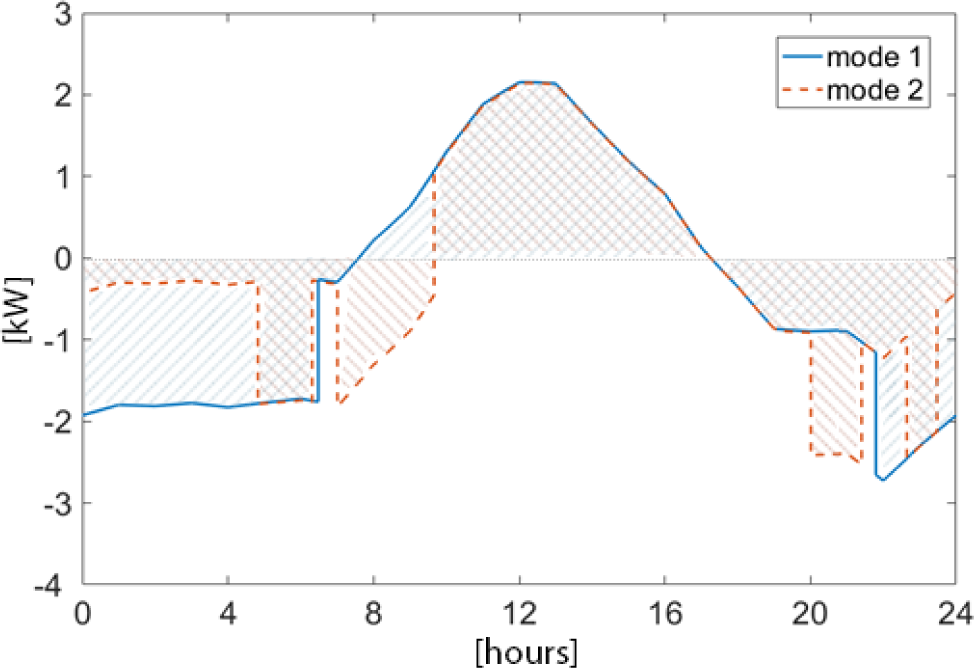
Electricity balance (winter period)
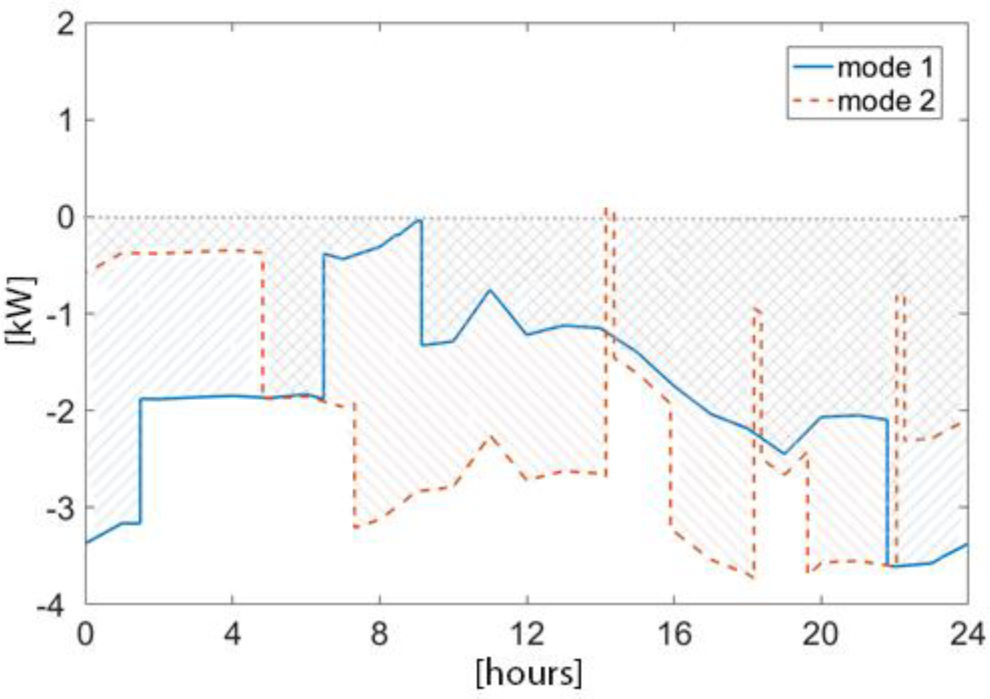
Electricity balance (transition period)
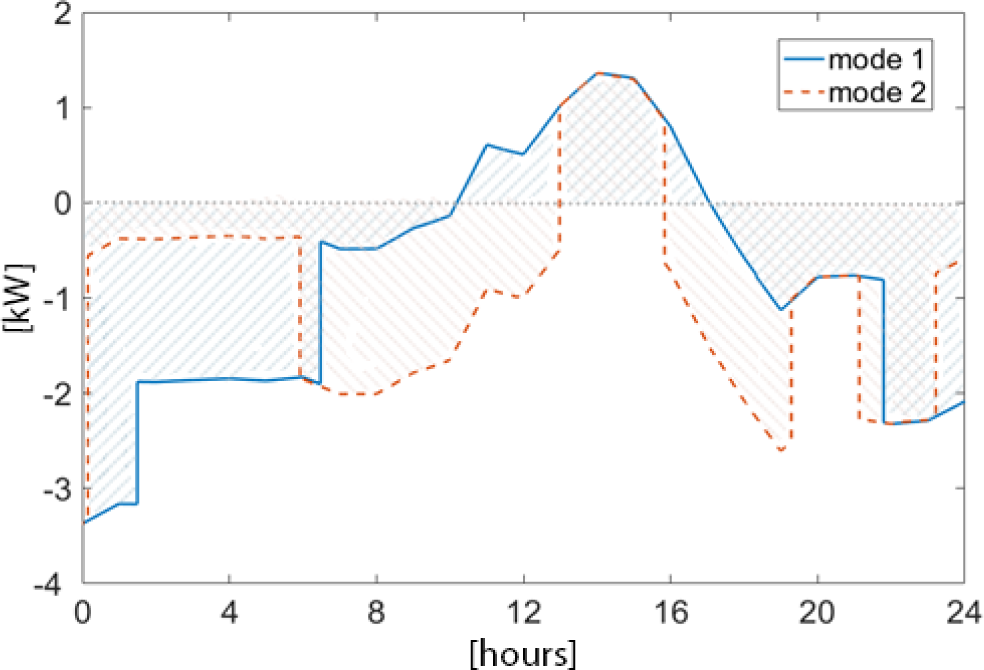
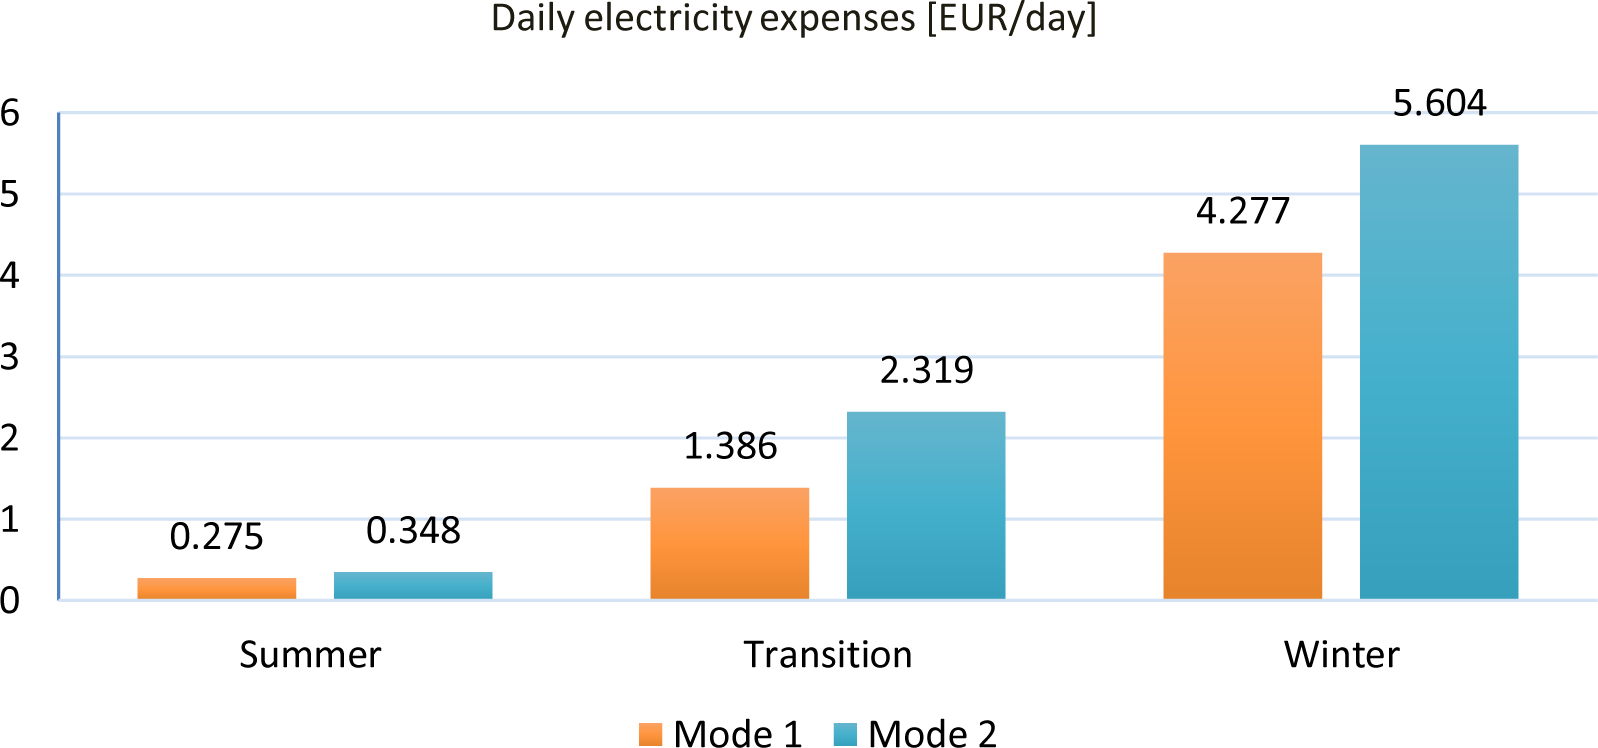
It can be observed that in the operating mode 1 (overheating tank at night) less electricity was purchased from the grid during the middle of the day, when prices were high. Thus, electric bills were reduced. Figure 11 shows daily expenses by selected days. From the daily balance, in the summer period the household would have to pay electricity 0.348 EUR/day when the system operates so that the water temperature is maintained around 60 °C (mode 2), while in the mode 1 this is reduced to 0.275 EUR/day. For the transition period, these expenditures are 1.386 EUR/day in operation mode 1 and 2.319 EUR/day when in mode 2. In winter, electricity, heating and DHW demand are the highest, while the solar irradiance is the lowest, so it does not heat the storage tank. For these reasons, HP and auxiliary heater must be turned on more often, which reduces the electricity demand. This puts winter at the most economically unfavourable period of the year. In the winter period will household have to pay electricity 4.277 EUR/day when operating in mode 1 and 5.604 EUR/day when operating in mode 2.
Daily electricity expenses
Since hourly prices of the electricity market will be variable, the overall economic viability of the system cannot be accurately predicted. During days when the difference between the highest and lowest price will be the largest, households will have lower electricity bills. Another option that could potentially increase profitability is the size of the PVT area. More electricity is generated over a greater PVT surface area. However, excess heat can become too high if the surface area is too large. Also, with a bigger PVT surface area, the thermal storage must have a larger capacity. For these reasons, further research must be conducted taking into account the cost of system components in order to find the optimal PVT surface area and size of other system components.
This paper was focused on the interaction between electric grid and prosumer (household with solar trigeneration system). Two operation strategies were evaluated in order to determine which one is the most cost-effective. A suitable system consisting of PVT collector was defined for conducting simulations and a mathematical model of its components was developed. Since the solar irradiation at the household location is not sufficient to cover 100% needs, PVT collectors must be coupled with some other sources to meet energy demand. As an appropriate option, a solar trigeneration system consisting of PVT collectors, GSHP and an auxiliary heater was chosen. Furthermore, two operation strategies were presented. The goal of one strategy was to heat the storage tank as much as possible during the night when the price of electricity was low. In the second strategy, system was operated so that the water temperature in storage amounted to 60 °C at each time of day. Simulations of these strategies were conducted for different seasons. Maximum heating of the thermal storage during the night and consumption of more electricity at lower prices was proven to be a more cost-effective strategy in all seasons. Also, this system was most profitable in the summer period when the largest amount of electricity was generated due to the high solar irradiation. Nevertheless, it must be noted that the investments costs of the observed system are very high. This fact, together with relatively low electricity prices, does not favour the prospects of installation such a system, but subsidies could improve this profitability. This paper showed that in addition to the economic and size of components assessment, altering the operation strategy and including a daily profile of electricity price, costs can also be reduced. For improved analysis and for more detailed economic assessment, future additional calculations are required. These should include placing the system in an economic geological environment and considering operation period. Locations with higher GHI values are generally more profitable for the installation of solar systems, so the usage of such systems is more attractive in southern areas. Also, further research involving variation of system components could also improve profitability.
Ac |
Photovoltaic Thermal Collector aperture area |
[m2] |
Ae,PVT |
area of Photovoltaic Thermal Collector heat exchanger in storage tank |
[m2] |
Ast |
area of storage tank |
[m2] |
chtf |
specific heat capacity of heat transfer fluid |
[Jkg−1K−1] |
cw |
specific heat capacity of water |
[Jkg−1K−1] |
EPVT |
electricity produced by Photovoltaic Thermal Collector |
[W] |
I |
solar irradiance |
[W/m2] |
mhtf |
mass flowrate of heat transfer fluid |
[kg/s] |
Mhtf,c |
mass of heat transfer fluid in Photovoltaic Thermal Collector |
[kg] |
Mw |
mass of water in storage tank |
[kg] |
Tamb |
ambient temperature |
[°C] |
Tcs |
temperature of a Photovoltaic Thermal Collector surface |
[°C] |
Tc,in |
inlet temperature of the heat transfer fluid |
[°C] |
Tc,out |
outlet temperature of the heat transfer fluid |
[°C] |
Tst |
temperature in thermal storage |
[°C] |
Ue,PVT |
heat transfer coefficient of Photovoltaic Thermal Collector heat exchanger located in the storage tank |
[Wm−2K−1] |
Ust |
heat transfer coefficient of storage tank |
[Wm−2K−1] |
Qaux |
heat flow from the auxiliary source |
[W] |
Qc |
useful thermal energy output from the Photovoltaic Thermal Collector |
[W] |
Qdhw |
heat flow needed for Domestic Hot Water |
[W] |
Qh |
heat flow needed for space heating |
[W] |
Qhp |
heat flow from the Heat Pump |
[W] |
Greek letters |
||
β |
photovoltaic temperature coefficient |
[-] |
ηc |
Photovoltaic Thermal Collector electric efficiency |
[%] |
η0 |
reference photovoltaic cell efficiency |
[%] |
Abbreviations |
||
COP |
Coefficient of Performance |
|
DHW |
Domestic Hot Water |
|
GHI |
Global Horizontal Irradiance |
|
GSHP |
Ground Source Heat Pump |
|
HP |
Heat Pump |
|
nZEB |
Nearly Zero-Energy Building |
|
PV |
Photovoltaic |
|
PVT |
Photovoltaic Thermal Collectors |
|
- EUR-Lex, Directive (EU) 2018/844 of the European Parliament and of the Council, 2018, https://eur-lex.europa.eu/legal-content/EN/TXT/PDF/?uri=CELEX:32018L0844&from=IT, [Accessed: 29-May-2020]
- , Definition and Design of Zero Energy Buildings, in: Green Energy Advances, IntechOpen, London, UK, 2019
- , International Renewable Energy Agency (IRENA), Renewable Energy in Cities, Report, Abu Dhabi, UEA, 2016
- ,
Hybrid Photovoltaic-Thermal Solar Systems for Combined Heating, Cooling and Power Provision in the Urban Environment ,Energy Conversion and Management , Vol. 150 ,pp 838-850 , 2017, https://doi.org/https://doi.org/10.1016/j.enconman.2017.03.024 - ,
Evaluation and Comparison of Solar Trigeneration Systems Based on Photovoltaic Thermal Collectors for Subtropical Climates ,Energy Conversion and Management , Vol. 199 ,pp 111959 , 2019, https://doi.org/https://doi.org/10.1016/j.enconman.2019.111959 - ,
Technoeconomic Modelling and Optimisation of Solar Combined Heat and Power Systems Based on Flat-Box PVT Collectors for Domestic Applications ,Energy Conversion and Management , Vol. 175 ,pp 67-85 , 2018, https://doi.org/https://doi.org/10.1016/j.enconman.2018.07.045 - ,
Solar Combined Cooling, Heating and Power Systems Based on Hybrid PVT, PV or Solar-Thermal Collectors for Building Applications ,Renewable Energy , Vol. 143 ,pp 637-647 , 2019, https://doi.org/https://doi.org/10.1016/j.renene.2019.05.004 - ,
Economic Solution of the Tri-Generation System Using Photovoltaic-Thermal and Ground Source Heat Pump for Zero Energy Building (ZEB) Realization ,Energies , Vol. 12 ,pp 3304 , 2019, https://doi.org/https://doi.org/10.3390/en12173304 - International Renewable Energy Agency (IRENA), 2019, https://www.irena.org/-/media/Files/IRENA/Agency/Publication/2019/Jun/IRENA_G20_grid_integration_2019.pdf, [Accessed: 29-May-2020]
- European Commission, Proposal for a Directive of the European Parliament and of the Council on Common Rules for the Internal Market in Electricity (Recast), 2019, https://eur-lex.europa.eu/legal-content/EN/TXT/?uri=CELEX%3A52016PC0864R%2801%29, [Accessed: 29-May-2020]
- European Parliament and Council of the EU, 2019, https://eur-lex.europa.eu/legal-content/EN/TXT/PDF/?uri=CELEX:32019L0944, [Accessed: 29-May-2020]
- European Centre for Disease Prevention and Control, 2017, https://www.escmid.org/fileadmin/src/media/PDFs/3Research_Projects/ESGLI/ESGLI_European_Technical_Guidelines_for_the_Prevention_Control_and_Investigation_of_Infections_Caused_by_Legionella_species_June_2017.pdf, [Accessed: 29-May-2020]
- Dimensioning of Domestic Hot Water Systems, 2010, http://academic.sun.ac.za/crses/SOLTRAIN/08_Dimensioning.pdf, [Accessed: 29-May-2020]
- ,
Time-Based Pricing and Electricity Demand Response: Existing Barriers and Next Steps ,Utilities Policy , Vol. 40 ,pp 15-25 , 2016, https://doi.org/https://doi.org/10.14746/strp.2015.40.2.2 - , V. D. I. e.V, Reference Load Profiles of Single-Family and Multi-Family Houses for the use of CHP Systems, VDI, Berlin, Germany, 2008
- ,
Performance Evaluation of Hybrid PV/Thermal Water/Air Heating System: A Parametric Study ,Renewable Energy , Vol. 31 (15),pp 2460-2474 , 2006, https://doi.org/https://doi.org/10.1016/j.renene.2005.12.002