


Ammonia gas is considered an important hydrogen energy carrier and can deliver COx-free hydrogen for different applications, such as fuel cells [1]. In recent decades, different studies have evaluated hydrogen storage [2]. Fossil fuels and renewable energy sources are the most used methods to produce hydrogen and include coal, natural gas, biomass, hydropower, geothermal, solar, and wind energy [3]. Methods of hydrogen production from fossil fuel and biomass resources have been extensively investigated, such as steam, partial oxidation, auto thermal, plasma, aqueous phase, and pyrolysis methods [4].
A number of renewable energy projects have applied a methodology to evaluate the effectiveness of instruments to increase energy efficiency to 45% by 2030 [5]. Most of the available hydrogen in the market is produced by steam reforming and water electrolysis. The energy balance of experimental and theoretical catalytic steam reforming reactions has been investigated [6]. Steam methane reforming has been performed over a mixed Ni/ MgAl and iron or chromium promoted M/Ni/MgAl catalysts [7]. Hydrogen production vapor has been investigated using Dielectric Barrier Discharge (DBD) plasma from different materials such as ammonia, hydrocarbons, water vapor, and biomass fuels.
A nonlinear autoregressive model was used to predict the syngas temperature and composition of biomass gasification during plant operation with different operating conditions [8]. Non-thermal plasma was used to assist the decomposition of benzene as a tar analogue [9]. Gliding arc non-thermal plasma has also been used to generate hydrogen (H2) and hydrogen peroxide (H2O2) [10]. Preliminary results have been investigated for hydrogen production from water vapor [11]. A kinetic model has been provided for hydrogen production from water vapor plasmolysis at atmospheric pressure in a DBD micro-channel reactor [12].
Recently, the development of DBD plasma at atmospheric pressure has increased [13]. DBD plasma involves a specific type of alternating current (AC) discharge at atmospheric pressure.
It provides non-equilibrium plasma with good thermodynamics. DBD plasma is mostly effective in chemical and physical processes of gases [14]. The main advantages of DBD plasma are its ability to produce highly reactive plasma at room temperature with low electric power consumption and a short time response [15]. However, recent DBD plasma applications have had unfavorable temperature increases due to the use of modern reactors and operation at higher frequency.
DBD plasma has been applied in several applications, such as pollutant removal [16], biomedical applications [17], surface treatment [18], and flow control [19]. The heat generated by atmospheric-pressure or non-equilibrium DBD plasma often causes energy waste. Therefore, most of the plasma applications use an external cooling circuit. The resulting temperature rise from plasma is significantly affected by various chemical and electronic processes. To have better operating conditions, the plasma temperature must be controlled appropriately. Several attempts have been made to understand the heat transfer mechanism. Plasma diagnostics, computer modeling, and detailed experimental analyses have been developed to recognize local temperatures [20].
Atmospheric-pressure DBD plasma can be characterized as weakly ionized plasma with properties resembling transient high-pressure glow discharge properties. Due to the presence of a dielectric barrier material, the energy input into the plasma system is limited. However, the gas temperature of the DBD plasma in practical applications has increased, and the plasma reaction field strongly depends on the plasma properties and external cooling conditions.
Several studies on the heat transfer across plasma reactors have been developed [21]. The reactor heating temperature effect on the steam decomposition using DBD plasma has been investigated [22]. The heat transfer mechanism characteristics in methane-DBD plasma have been investigated [23]. A numerical simulation has been used to analyze the momentum and heat transfer of argon (Ar) gas in a needle-to-plane DBD reactor [24]. DBD plasma ignition obviously generates non-uniform Joule heating. Therefore, more information is needed about the heat transfer characteristics in atmospheric-pressure or DBD plasma to optimize them for plasmas applications.
The current study reports on the hydrogen production and heat transfer distribution across a plasma Plate Type Reactor (PPR) using 0.5% ammonia-argon as a base gas. The effects of the electrode gap distance and residence time on the ammonia decomposition were investigated. The heat transfer distributions across the PPR were analyzed at different voltages, and the total heat transfer rate and overall heat transfer coefficient were determined at different operating conditions. The energy efficiency results of reactor experiments were also compared.
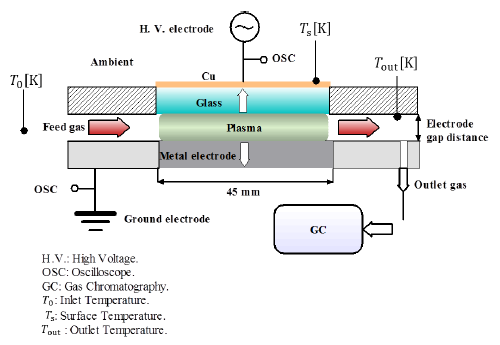
Ammonia-argon base gas with a concentration of 0.5% was decomposed into hydrogen and nitrogen gas by DBD in PPR at atmospheric pressure. [Figure 1] shows a diagram of the experimental setup. Ammonia gas was fed into the electrode gap distance of the PPR between both electrodes. Quartz glass was used as a dielectric with a thickness of 2 mm. A high-voltage electrode was connected to a copper mesh, which had a thickness of 0.25 mm. A metal plate (SUS 316) was used as the ground electrode and connected to an oscilloscope.
The plasma was generated using a power source with a 10-kHz sinusoidal voltage of 12-18 kV. The DBD plasma was produced with a discharge area of 45 mm × 45 mm. Measurements were taken for two different electrode gap distances of 4.5 mm and 1 mm. The decomposed gases were collected from the outlet reactor port using a syringe. The collected samples were analyzed using gas phase chromatography (GC, GC-2014S, SHIMADZU). The GC device was calibrated, and the error was estimated to be within ±5%. The input power was determined by a power meter, and the temperature was measured using K-type thermocouples connected at different PPR points. The feed gas was controlled by a Mass Flow Controller (MFC).
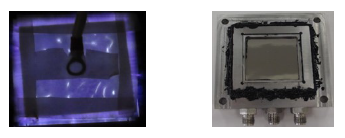
[Figure 2] shows a photo of the PPR assembly photo without plasma and at plasma ignition. The gas inlet, outlet, and PPR surface temperatures were measured by K-type thermocouples. Ammonia gas was fed into the PPR discharge gap at 0.1-1 L/min at atmospheric pressure (100 kPa) and ambient temperature. The plasma discharge power was determined at different voltages using the power meter. The DBD plasma was generated in the discharge gap between the high-voltage electrode and the ground electrode. The energy distributions across the ground electrode, high-voltage electrode, and heat loss are discussed.
Experimental setup
Plasma plate reactor photos
The energy equation for heat transfer by conduction of macroscopic expression is [21]:
(1)
where x [m] is the gas flow direction, y [m] is the perpendicular direction to flow, G [Wm−3] is the heat generation rate per unit volume, T [K] is the gas temperature, u [ms−1] is the gas velocity, ρCp,g [Jm−3K−1] is the heat capacity of the feeding ammonia gas, and λ [Wm−1K−1] is the thermal conductivity. The heat conduction equation has been used by many studies for modeling in DBD plasma analysis [19]. Uniform heat generation has been produced by micro discharges.
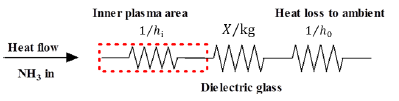
[Figure 3] shows the heat transfer resistances across the reactor. This figure shows the heat flow from the plasma discharge gap to the high-voltage electrode. The total heat transfer rate can be determined with the following equation [25]:
(2)
where U [W/m2K] is the overall heat transfer coefficient, A [m2] is the total heat transfer area, Tg and Ta [K] is the gas temperature and the PPR’s surrounding temperature. The convection heat transfer from the inner plasma to the dielectric glass is obtained based on the gas input conditions. The conduction heat transfer resistances through the metal and dielectric electrodes are calculated according to eq. (1).
Heat transfer resistances from inner plasma to high-voltage electrode direction
The heat loss resistance from the high-voltage electrode surface to atmosphere was determined using Churchill and Chu’s [26] Nusselt number relation:
(3)
where Pr is the Prandtl number, and Ra is the Rayleigh number (Ra = Gr × Pr). The Grashof number was estimated from the following relation:
(4)
where β [K−1] is the thermal expansion coefficient, ν [m2/s] is the kinematic viscosity, L [m] is the gap length, g = 9,80665 m2/s as standard gravitational acceleration, and Ts and Ta [K] is the reactor-surface and ambient temperatures, respectively. The external heat transfer coefficient can be obtained from the Nusselt number relation (Nu = hol/kairj).
Ammonia as an energy carrier contains more hydrogen than other liquids. Atmospheric-pressure plasma is characterized as weak plasma due to the limited energy fed into the plasma system. The effects of the electrode gap distance at different ammonia (NH3) flow rates were examined, and the heat transfer distribution was determined for both electrode gap distances.
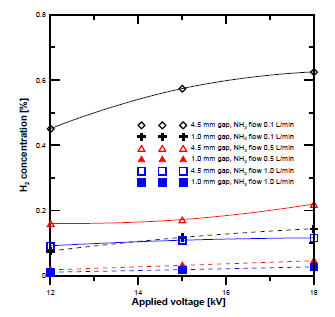
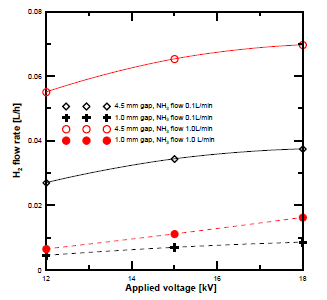
[Figure 4] demonstrates the H2 concentration obtained at different flow rates and electrode gap distances. The H2 concentration at a gap distance of 4.5 mm was higher than that at 1 mm at all flow rates. The concentration of the H2 also increased with the voltage. To clarify the effect of the gap distance, the produced H2 flow rate was compared between ammonia gas flow rates of 0.1 and 1 L/min. The H2 gas flow rate was determined based on GC concentration analysis. [Figure 5] shows the results. The hydrogen flow rate at a gap distance of 4.5 mm was higher than that at 1 mm.
Comparison of hydrogen concentration at different discharge gap distances
H2 flow rate vs. voltage at different discharge gap distances
It was clear that the ammonia decomposition was improved with increasing gap distance. The residence time of ammonia decomposition can be determined based on the feed gas flow rate and the electrode gap distance. The ammonia conversion rate was calculated according to the following relation:
(5)
where H2 conc is the produced hydrogen gas concentration at the PPR exit, and [NH3]0 is the initial ammonia concentration.
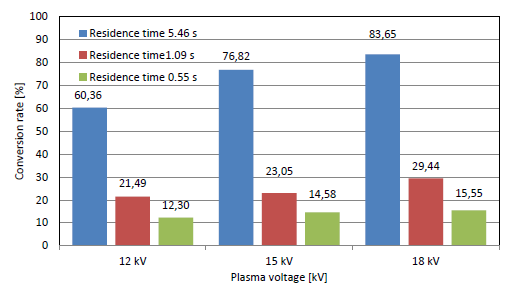
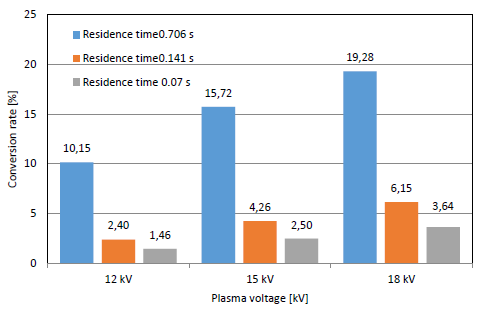
[Figure 6] shows the conversion rate of ammonia at different plasma voltages and residence times with a gap distance of 4.5 mm. The conversion rate increased with the residence time and reached a maximum value of 83.65% at a voltage of 18 kV and NH3 input flow rate of 0.1 L/min. Similarly, the conversion rate of ammonia decomposition with a gap distance of 1 mm is shown in [Figure 7], where the conversion rate shows the same trend. The maximum rate was 19.28% at 18 kV and 0.1 L/min. It is obvious that the conversion rate values are lower than those at 4.5 mm due to the lower residence time and ammonia reaction time at a gap distance of 1 mm.
NH3 conversion rate vs. residence time in PPR with electrode gap of 4.5 mm
NH3 conversion rate vs. residence time in PPR with electrode gap of 1 mm
[Figure 8] compares the heat transfer distribution across the dielectric, metal electrodes, and heat loss to the atmosphere at 12 kV. These results were determined based on the energy distribution equations discussed in the previous section. 80% of the DBD plasma input power was transferred as heat to both electrodes [26], around 65% was transferred to the dielectric electrode, and 15% was transferred to the metal or ground electrode. This is due to the micro discharge concentration spreading on the dielectric glass electrode’s surface in a much larger area than the filament diameter.
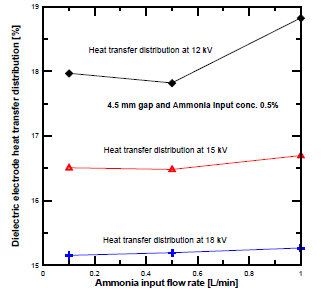
[Figure 9] shows the heat transfer distribution to the dielectric electrode at different voltages and NH3 input flow rates. The heat transfer distribution at 12 kV was higher than at 15 kV and 18 kV. The variation of the heat transfer distribution of the dielectric electrodes was slightly decreased at low ammonia flow rate, and the amount is related to the enthalpy gained by the ammonia feed gas. Secondary electron emissions deliver more ionization, which leads to higher metal electrode heating than that of the dielectric electrode.
Heat transfer distribution in PPR with electrode gap distance of 4.5 mm: plasma voltage 12 kV (a); plasma voltage 15 kV (b) and plasma voltage 18 kV (c)
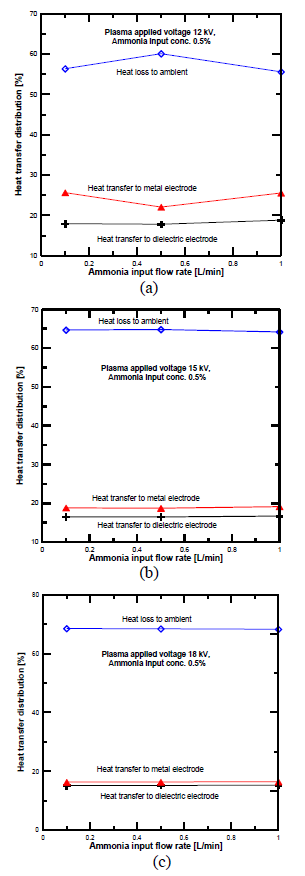
Dielectric electrode heat transfer distribution
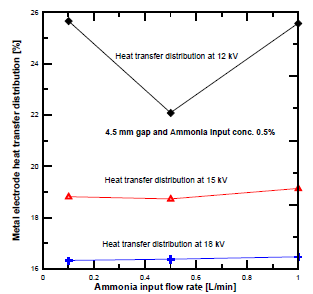
[Figure 10] compares the heat transfer distribution of the metal electrode at different voltages. The heat transfer distribution increased with ammonia input flow rate at 15 and 18 kV. The heat transfer distribution was clearly decreased at an NH3 flow rate of 0.5 L/min and 12 kV. It has been reported that the heat transfer mechanism is not affected by the feed gas’ physical properties but is influenced by changes in the plasma structure [21].
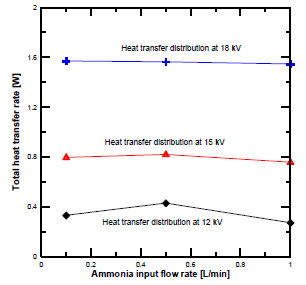
Additionally, the heat transfer distribution of the metal electrode was higher than that obtained from the dielectric electrode. The total heat transfer rate at different input flow rates and voltages is shown in [Figure 11]. It is clear from this figure that the total heat transfer rate at 18 kV was much higher than at 15 kV and 18 kV. Most of the plasma heat was transferred to the high-voltage electrode direction due to the concentration of micro discharges at the electrode surface. Furthermore, the DBD plasma heat transfer mechanism was not affected by the changes of the feed gas’ physical properties, while the ammonia’s decomposition behavior using DBD plasma was obviously changed.
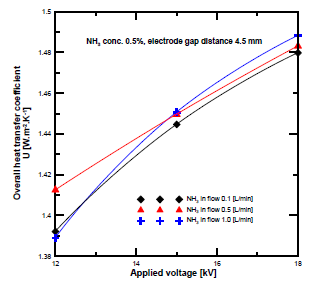
[Figure 12] presents the overall heat transfer coefficient at different input flow rates and plasma voltages. It is clear that the overall heat transfer coefficient increased with the voltage. Furthermore, the overall heat transfer coefficient at the ammonia flow rate of 1 L/min was higher than at 0.5 and 0.1 L/min. Conversely, the overall heat transfer coefficient at the high ammonia flow rate exceeded those of the lower ones, while the conversion rate results at the same ammonia flow rate were lower.
Metal electrode heat transfer distribution
Total heat transfer rate distribution at different plasma voltages
Overall heat transfer coefficient at different NH3 flow rates
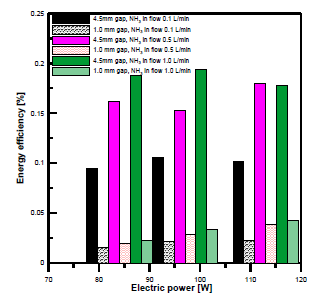
[Figure 13] compares the energy efficiency of both reactors with different electrode gap distances and electric power. It is clear that the energy efficiency was higher at a gap distance of 4.5 mm than at 1 mm. The maximum energy efficiencies at 4.5 mm with input flow rates of 1, 0.5, and 0.1 L/min were 0.1936%, 0.178%, and 0.1057%, respectively. The maximum energy efficiencies at 1 mm with ammonia input flow rates of 1, 0.5, and 0.1 L/min were 0.0428%, 0.038% and 0.022%, respectively.
Comparison of energy efficiency versus input electric power
In this study, ammonia-argon base gas was decomposed into hydrogen and nitrogen gas by atmospheric-pressure DBD plasma. Ammonia gas was fed into PPRs with electrode gap distances of 1 mm and 4.5 mm. The hydrogen production was affected by the electrode gap distance. The hydrogen concentration and flow rate at a gap distance of 4.5 mm results were much higher than at 1 mm.
The effect of the residence time on the hydrogen conversion was also investigated. The maximum conversion rates at 4.5 mm and 1 mm were 83% and 19.29%, respectively. The heat transfer distribution of metal, dielectric electrodes, and heat loss to the atmosphere were determined at different voltages, and most of the heat generation was transferred to the dielectric electrode surface due to the concentration of micro discharges near the high-voltage electrode. The heat transfer mechanism was not affected by the ammonia physical properties, while the ammonia decomposition by the DBD plasma was obviously changed.
The energy efficiency of NH3 decomposition was determined at different input power. The maximum obtained energy efficiencies with an NH3 concentration of 5% and gap distance of 4.5 mm were 0.1936%, 0.178%, and 0.1057% at ammonia input flow rates of 1, 0.5, and 0.1 L/min, respectively. Those at a gap distance of 1 mm were 0.0428%, 0.038%, and 0.022%, respectively.
The authors would like to thank Prof. Shinji Kambara (Environmental and energy systems department-Gifu University-Japan) for his continuous support.
- ,
Ammonia as a Possible Element in an Energy Infrastructure: Catalysts for Ammonia Decomposition ,Energy Environ. Sci , Vol. 5 (4),pp 6278-6289 , 2012, https://doi.org/https://doi.org/10.1039/C2EE02865D - ,
The U.S. Department of Energy’s National Hydrogen Storage Project: Progress Towards Meeting Hydrogen-Powered Vehicle Requirements ,Catal. Today , Vol. 120 (3-4),pp 246-256 , 2007, https://doi.org/https://doi.org/10.1016/j.cattod.2006.09.022 - ,
Hydrogen Production Technologies Overview ,J. Power and En. Eng , Vol. 7 (1),pp 107-154 , 2019, https://doi.org/https://doi.org/10.4236/jpee.2019.71007 - ,
Mitigating Carbon Dioxide Impact of Industrial Steam Methane Reformers by Acid Gas to Syngas Technology: Technical and Environmental Feasibility ,J. Sustain. Dev. Energy Water Environ. Syst , Vol. 8 (1),pp 71-87 , 2020, https://doi.org/https://doi.org/10.13044/j.sdewes.d7.0258 - ,
Low Carbon Transition Through Renewables Sources – An Overview of the Renewable Energy Program in the State of Minas Gerais ,J. Sustain. Dev. Energy Water Environ. Syst , Vol. 8 (2),pp 252-267 , 2020, https://doi.org/https://doi.org/10.13044/j.sdewes.d7.0295 - ,
Experimental and Modeling Study of Hydrogen Production from Catalytic Steam Reforming of Methane Mixture with Hydrogen Sulfide ,Int. J. Hydrogen Energy , Vol. 40 (33),pp 10418-10426 , 2015, https://doi.org/https://doi.org/10.1016/j.ijhydene.2015.06.143 - ,
Hydrogen Production by Steam Reforming of Methane Over Mixed Ni/MgAl+CrFe3O4 Catalysts ,Int. J. Hydrogen Energy , Vol. 40 (35),pp 11848-11854 , 2015, https://doi.org/https://doi.org/10.1016/j.ijhydene.2015.06.104 - ,
Modelling of Temperature and Syngas Composition in a Fixed Bed Biomass Gasifier using Nonlinear Autoregressive Networks ,J. Sustain. Dev. Energy Water Environ. Syst , Vol. 8 (1),pp 145-161 , 2020, https://doi.org/https://doi.org/10.13044/j.sdewes/d7.0263 - ,
Decomposition of Benzene as a Tar Analogue in CO2 and H2 Carrier Gases, Using a Non-Thermal Plasma ,Chem. Eng. J , Vol. 360 ,pp 714-720 , 2019, https://doi.org/https://doi.org/10.1016/j.cej.2018.11.195 - ,
Formation of H2 and H2O2 in a Water-Spray Gliding Arc Nonthermal Plasma Reactor ,Ind. Eng. Chem. Res , Vol. 49 (14),pp 6342-6349 , 2010, https://doi.org/https://doi.org/10.1021/ie100038g - ,
Preliminary Results of Hydrogen Production from Water Vapor Decomposition Using DBD Plasma in a PMCR Reactor ,Int. J. Hydrogen Energy , Vol. 44 (36),pp 20239-20248 , 2019, https://doi.org/https://doi.org/10.1016/j.ijhydene.2019.05.199 - ,
A Kinetic Model for H2 Production by Plasmolysis of Water Vapors at Atmospheric Pressure in a Dielectric Barrier Discharge Micro-Channel Reactor ,Int. J. Hydrogen Energy , Vol. 37 (23),pp 17678-17690 , 2012, https://doi.org/https://doi.org/10.1016/j.ijhydene.2012.08.113 - ,
Filamentary, patterned and diffuse barrier discharges ,IEEE Transactions on Plasma Science , Vol. 30 (4),pp 1400–1408 , , https://doi.org/https://doi.org/10.1109/TPS.2002.804201 - ,
Dielectric Barrier Discharge for Surface Treatment: Application to Selected Polymers in Film and Fibre Form ,Plasma Sources Sci. Technol , Vol. 12 (3),pp 335-344 , 2003, https://doi.org/https://doi.org/10.1088/0963-0252/12/3/306 - ,
Ultrashort Pulsed Barrier Discharges and Applications ,Pure Appl. Chem , Vol. 74 (3),pp 447-452 , 2002, https://doi.org/https://doi.org/10.1351/pac200274030447 - ,
Combining non-thermal plasma with heterogeneous catalysis in waste gas treatment: A review ,Appl. Catal. B-Environ , Vol. 78 ,pp 324-333 , 2008, https://doi.org/https://doi.org/10.1016/j.apcatb.2007.09.035 - ,
Microplasmas: Sources, Particle Kinetics, and Biomedical Applications ,Plasma Proc. and Polym , Vol. 5 (322), 2008, https://doi.org/https://doi.org/10.1002/ppap.200700162 - ,
Dielectric barrier discharge for surface treatment: application to selected polymers in film and fibre form ,Plasma Sources Sci. Technol , Vol. 12 (335), 2003, https://doi.org/https://doi.org/10.1088/0963-0252/12/3/306 - ,
Dielectric Barrier Discharge Plasma Actuators for Flow Control ,Annu. Rev. Fluid Mech , (42505), 2010, https://doi.org/https://doi.org/10.1146/annurev-fluid-121108-145550 - ,
Ozone synthesis from oxygen in dielectric barrier discharges ,, J. Phys. D: Appl. Phys , Vol. 20 ,pp 1421-1427 , 1987, https://doi.org/https://doi.org/10.1088/0022-3727/20/11/010 - ,
Energy Distribution and Heat Transfer Mechanisms in Atmospheric Pressure Non-Equilibrium Plasmas ,J. Phys. D: Appl. Phys , Vol. 34 (23),pp 3383-3390 , 2001 - ,
Study of the Reactor Temperature Effect on H2 Production from Steam Decomposition Using DBD Plasma ,Energy Reports , Vol. 6 (2),pp 45-51 , 2020, https://doi.org/https://doi.org/10.1016/j.egyr.2019.11.040 - ,
Experimental and theoretical study of a glow discharge at atmospheric pressure controlled by dielectric barrier ,J. Appl. Phys , Vol. 83 (6),pp 2950-2957 , 1998, https://doi.org/https://doi.org/10.1063/1.367051 - ,
Numerical Analysis of the Momentum and Heat Transfer in an Atmospheric Pressure Dielectric Barrier Discharge ,AIP Advances , Vol. 9 (3),pp 035219 , 2019, https://doi.org/https://doi.org/10.1063/1.5086791 - , , Introduction to Heat Transfer (5th ed.), 2007
- ,
Correlating Equations for Laminar and Turbulent Free Convection from a Vertical Plate ,Int. J. Heat and Mass Trans , Vol. 18 (11),pp 1323-1329 , 1975, https://doi.org/https://doi.org/10.1016/0017-9310(75)90243-4