


Solar thermal energy is lagging behind as one of the slowest renewable energy sources to be utilized for advancements in renewable energy consumption due to policies that are more drawn to fossil fuels. This has drawn considerations for different technologies for cost reduction to allow for the advancement of solar conversion efficiencies [1].
2D graphene is a novel nanomaterial possessing attractive thermal, chemical and physical properties as its qualities prove promising in the application in fields such as those of energy conversion [2]. In solar thermal applications, graphene is widely used in nanofluids to enhance thermal performance of a device, where good thermal conductivities are parameters that graphene can contribute to. Enhanced efficiencies of as high as 29.3% can be achieved with the integration of graphene as a nano-fluid [3]. Functionalized graphene, on the other hand, with increased hydrophilicity can provide opportunities for enhanced thermal evaporation efficiency to enhance overall system performance [4]. Nano-structured carbon films have also been used successfully for surface modification as seen in the works of Katumba et al. [5] and Gampp et al. [6].
Graphene discovery and synthesis was first introduced by Novoselov et al. [7] where a single atomic layer of carbon was mechanically exfoliated from graphite using scotch tape. Applications rendering graphene as significant increased the demand of large scale graphene synthesis and deposition, nowadays mainly implemented by chemical means such as Chemical Vapor Deposition (CVD) [8]. These techniques often require specific conditions that may be energy-intensive parameters (elevated temperatures, high pressure or vacuum) or could involve toxic or corrosive materials. And although these techniques would result in pristine graphene deposits, they are uncapable of responding to large scale production requirements [9].
Mechanical exfoliation of graphene, being the original process used to synthesize and deposit graphene can easily be modified to provide large scale synthesis and coverage. For example, and starting from either graphite or graphite oxide dry and wet mechanical exfoliation, photoexfoliation can be implemented to produce graphene material [10]. In literature, one of the most effective procedures for producing graphene at high rates is the mechanical ball-milling process [11], where high purity graphite is used as starting material to mechanically synthesize and deposit Multi-Layer Graphene (MLG) in the process of ball-free ball milling. The process relies on centrifugal forces acting on the graphite powder to mechanically exfoliate fine particles of the material across the surface of a copper liner [12].
One of the major issues that are always faced with depositing graphene on any substrate is the scale. The classical methods of graphene deposition usually involve laboratory scale sizes (maximum on centimetre scale [13]). This reduces the applicability of graphene for large-scale applications that would benefit from its exceptional thermal, electrochemical and optical characteristics [14]. One of the main motivations of this work is to introduce a technology that would allow the simultaneous synthesis and deposition of graphene in an enclosed compartment that allows large scale homogenous deposition [3]. Blasting provides versatility in its ability to meet many different tasks such as the removal of contaminants, the smoothing or roughening of a surface, or to provide proper adhesion for subsequent coating with the proper pairing of blast media and type of streaming fluid [12].
Although blast machines are conventionally found in finishing shops for metallic substrate treatment, the form of abrasive blasting, or sandblasting, that involves the forceful expulsion of a stream of abrasive material at high pressures along a surface of a substrate has been utilized for deposition purposes. In the medical field, Ishikawa et al. [15] was able to deposit hydroxyapatite powder on titanium substrates at room temperature using an ordinary sandblaster with excellent homogeneity. Other research has also gone into the deposition of titanium dioxide by blasting on titanium implants to provide better anchorage and higher torque removal values [16]. Co-blasting, a process in which the required powder was simultaneously blasted with aluminum oxide abrasives for a roughened surface morphology, was also introduced to deposit hydroxyapatite powder and was found to exhibit remarkable adhesion due to a mechano-chemical bonding with an increase in mechanical locking of the powder to the titanium substrate [17].
This work investigates a novel method for turbostratic graphene synthesis and deposition which can easily be scalable and would drive production costs down all the while meeting the objective of enhancing efficiencies of solar thermal collectors [18]. The simultaneous synthesis and deposition of graphene is the novelty of this process, and its applications cover a wide spectrum of disciplines, from energy harvesting and storage devices to medical and dental implants for better biocompatibility. As far as the authors know, the proposed physical deposition system is only found in a 2018 patent by Zhang et al. [19], and has not been implemented for graphene production yet. The authors present their independent synthesis and deposition of graphene using air blasting, and the subsequent characterization of the produced graphene material. They also present various thermal, optical and electrochemical (corrosion resistance) applications that proves the functional benefit of their proposed approach. Finally, the design of a deposition chamber that would allow the graphene to be deposited from high-purity graphite powder is presented. There are various health and safety concerns with airborne graphite [20].
The following sections detail the methods used for the synthesis and deposition of the graphene material using the graphite air blasting technique. The characterization and testing of the resulting material is also explained.
The source graphite was processed in the form of powder with a particle size of 63 < x < 125 µm obtained from high quality industrial graphite (99.9% purity). The graphite used is 4N pure (99.99%) obtained as a rod, with small pieces cut off and ground in a ball milling machine to arrive at a fine powder no more than 125 μm in size (sieved).
High quality aluminum sheets (10 cm × 10 cm) of 1 mm thickness to be used as substrates were pre-treated with 120-grit sandpaper to prepare specimen surfaces equally. The samples were cleaned with distilled water and propped parallel to the blasting gun for deposition.
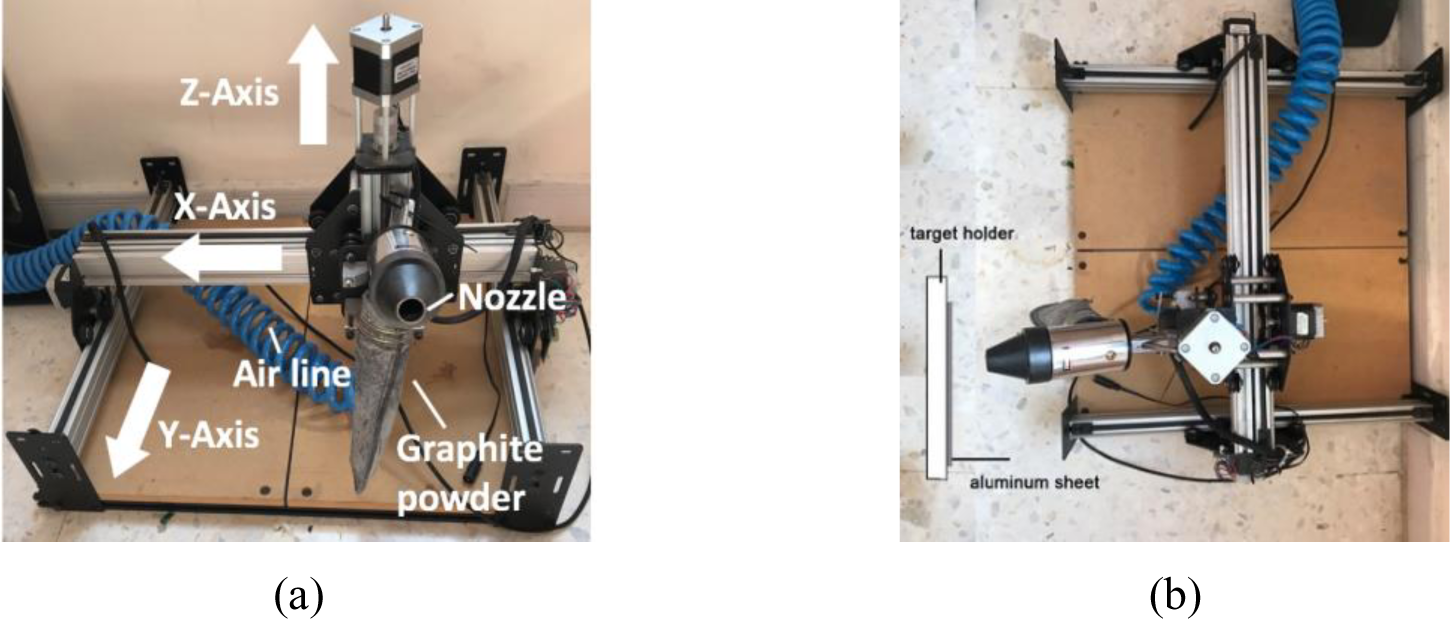
A sand blasting gun was used with a 500 mL reservoir where powder graphite can be stored in line with an air compressor. The specimens are placed at a constant distance of 20 centimetres from the nozzle and perpendicular nozzle. A Shapeoko2 Computer Numerical Control (CNC) machine shown in Figure 1 was used to move the nozzle in the y-direction while moving simultaneously controlling the motion in the x-z directions.
Side (a) and top (b) view of the mechanical exfoliation setup utilizing a CNC machine and sandblasting gun
The pre-programmed nozzle motion involves moving at a fixed rate (0.1 m/s) in the x-direction to allow one, two or three passes against the specimens. The applied pressure from the compressor is fixed at 8 bar for all trials.
The metallic substrates were then collected, sonicated in ethanol for 10 minutes to ensure the cleanliness of the surfaces.
Raman spectroscopy is a powerful tool to examine the surface and ensure the turbostratic nature of graphene deposition. Typical graphene peaks are typically found at ~1,350, ~1,580 and ~2,700 cm-1 and correspond to D, G and 2D peaks, respectively. Specimens were scanned randomly at 10-50% laser intensity (laser point diameter is ~1 μm). A normalization of spectral dataset was carried out by baseline subtracting the baseline of the readings scanned along a 200 μm2 area for G-band areas larger than 1,581.6 cm-1 to obtain mapped images.
The baseline reference for reflectance measurements (100%) is taken as the cleaned aluminium surface spectra to enable a detailed analysis of the spectral response of graphene deposition on successive specimens.
Thermal testing was of 1 cm2 sample surface area was established by using a standard lab 750 W heating plate from Semco and 0.1 mm diameter k-type thermocouples arranged in a circle. This thermocouple type provides accurate point measurements, thus making them responsive to temperature variation. The samples were heated until long enough to reached steady state then cooled back to room temperature.
Electrochemical testing was performed using a VSP-300 potentiostat with a 30 μm resolution from Bio-Logic. The tests were carried out using a linear sweep from a cathodic potential of -1 V to an anodic potential of +1 V with respect to open-circuit voltage at a scan rate of 0.5 mV/s. The calculated corrosion rates were determined by Tafel extrapolation on the EC-lab software.
The Raman spectra performed at 514 nm laser power shown in Figure 2 verifying the existence of turbostratic graphene nanoplatelets.
Raman spectra of the samples undergoing one, two and three pass samples
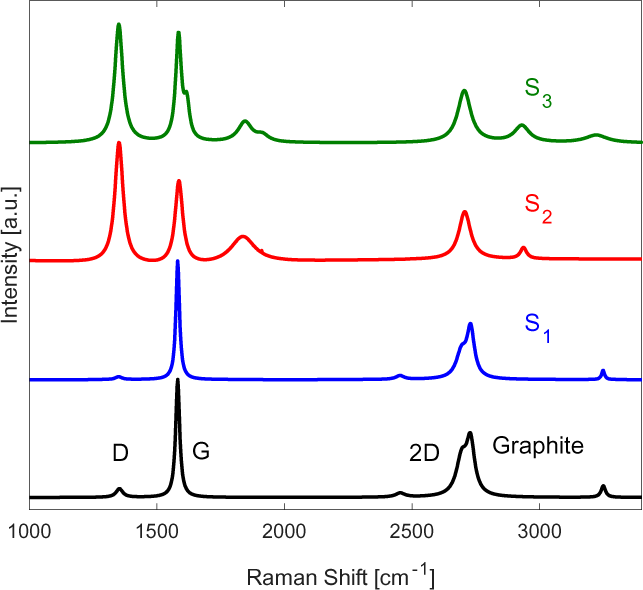
It is interesting to note that the single pass (S1) sample displayed no visible defect peak at Raman shifts of ~1,350 cm-1 (D-peak). This is due to the high energy impact of graphite particles at the substrate surface, causing the mechanical exfoliation into graphene platelets. The turbostratic nature of this MLG deposits are characterized by the symmetrical shape of the 2D at Raman shifts of ~2,700 curve with a line width of the order of ~70 cm-1, Full-Width at Half-Maximum (FWHM) [21]. The Raman spectra for S1 also shows a distinct wide peak left of the 2D band, indicating the presence of MLG [21].
As for S2, a shift in the 2D band location relative to monolayer graphene is detected in the Raman spectra, signifying successful exfoliation of the graphite powder into turbostratic graphene platelets.
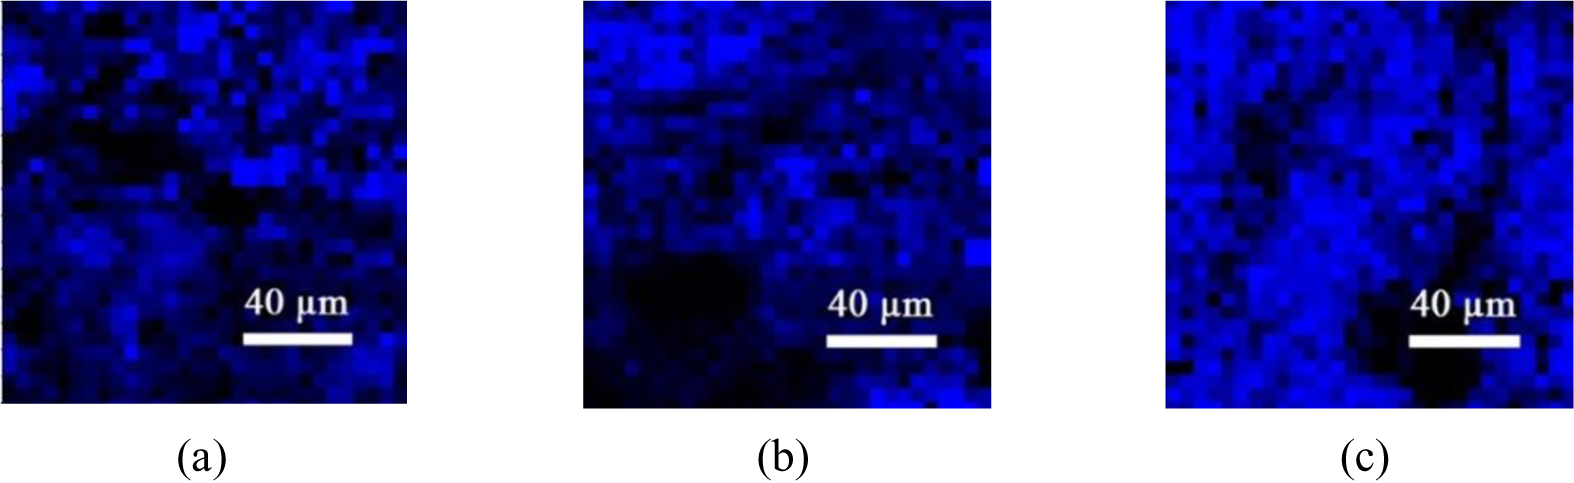
To assess the homogeneity and distribution of the graphene deposition, a mapping image was created for all produced samples.
The results were normalized by subtracting the baseline while scanning along a 200 μm2 area for G-band areas larger than the characteristic graphite peak of 1,581.6 cm-1 at 514 nm laser power. As a simple detection rule, a clear blue shift of wavelengths higher than 1,581.6 cm-1 will indicate a successful deposition of turbostratic graphene as shown in Figure 3.
Raman mapping images of observed single (S1), two (S2), and three pass (S3) samples referred to the G-band at a Raman shift of 1,581.6 cm-1
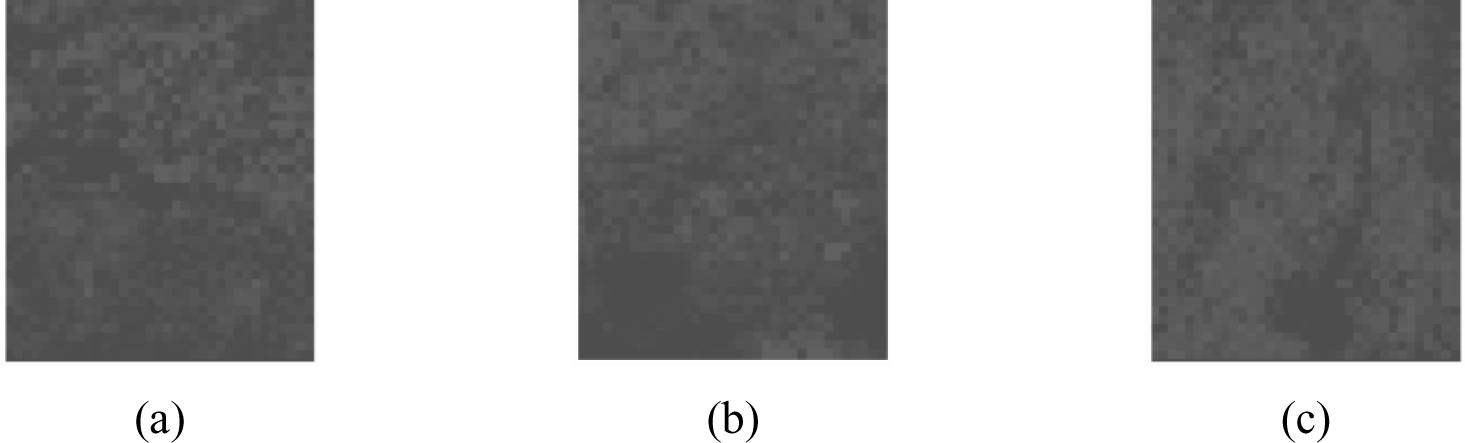
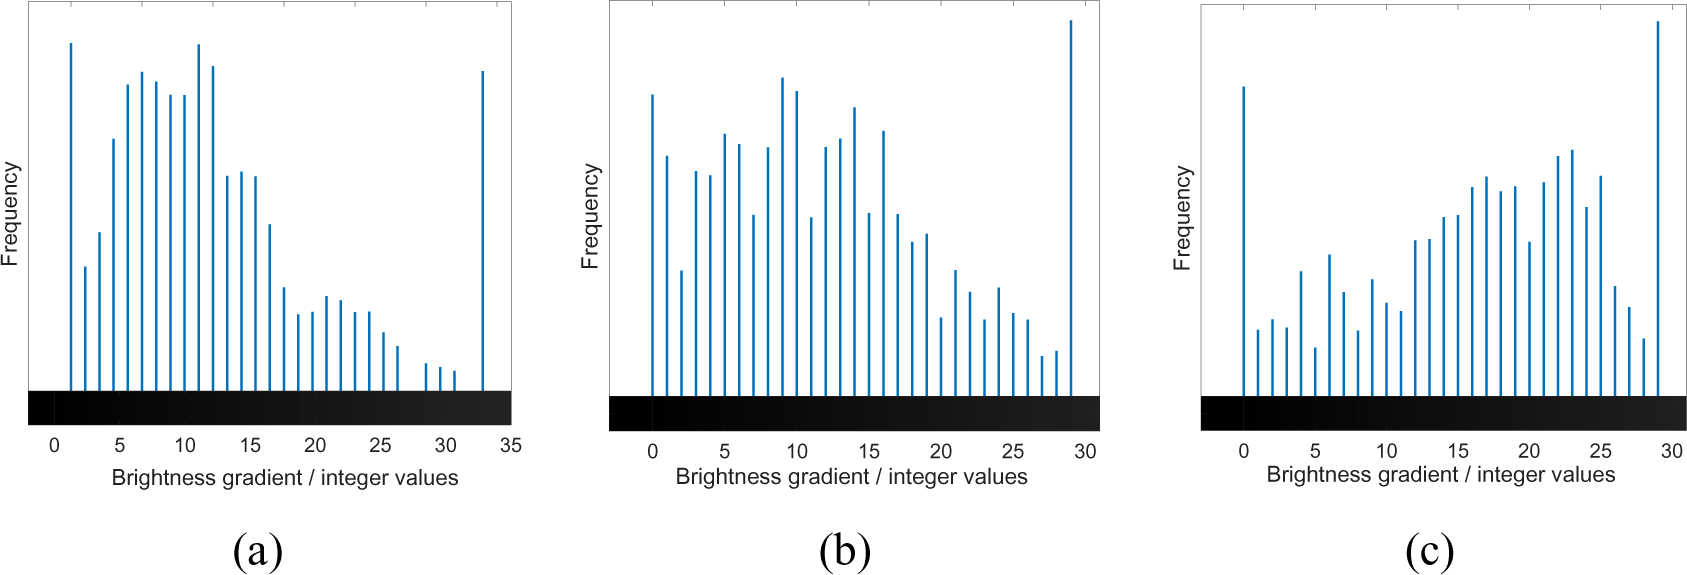
The mapped dataset shown was then turned into its grayscale counterpart (shown in Figure 4) and a histogram was constructed based on the colour integer. A histogram is used as it represents the frequency of the distribution of the sample where the x-axis relates to the sampling interval influencing the overall quality of the samples, and the y-axis corresponds to frequency of the variables being monitored [22]. Figure 5 depicts the distribution of the data and the trend shows that with the three pass sample, a more skewed coverage at lighter coloration is shown. The skewed nature of the curve is due to the existence of areas with no deposition which appear black on the grayscale image. Average values are determined to be 10.76, 12.67 and 15.90 for samples undergoing one, two and three passes, respectively, with standard deviations corresponding to 0.097, 0.091 and 0.090.
The grayscale image in Figure 4 has been adjusted in terms of brightness and transparency to aid in the visualization of the gradient of color degradation.
Grayscale images with increased transparency of observed single (S1), two pass (S2), and three pass (S3) samples
Spectral histograms of observed single (S1), two pass (S2), and three pass (S3) samples
For its spectral response, Figure 6 shows the results of absorptivity, as a percentage, relative to the wavelength. For the single pass, the absorptivity is seen to increase towards the visible range and then decreases at around 600 nm.
Absorptivity spectra for observed single, two pass and three pass samples along visible to near infra-red wavelengths
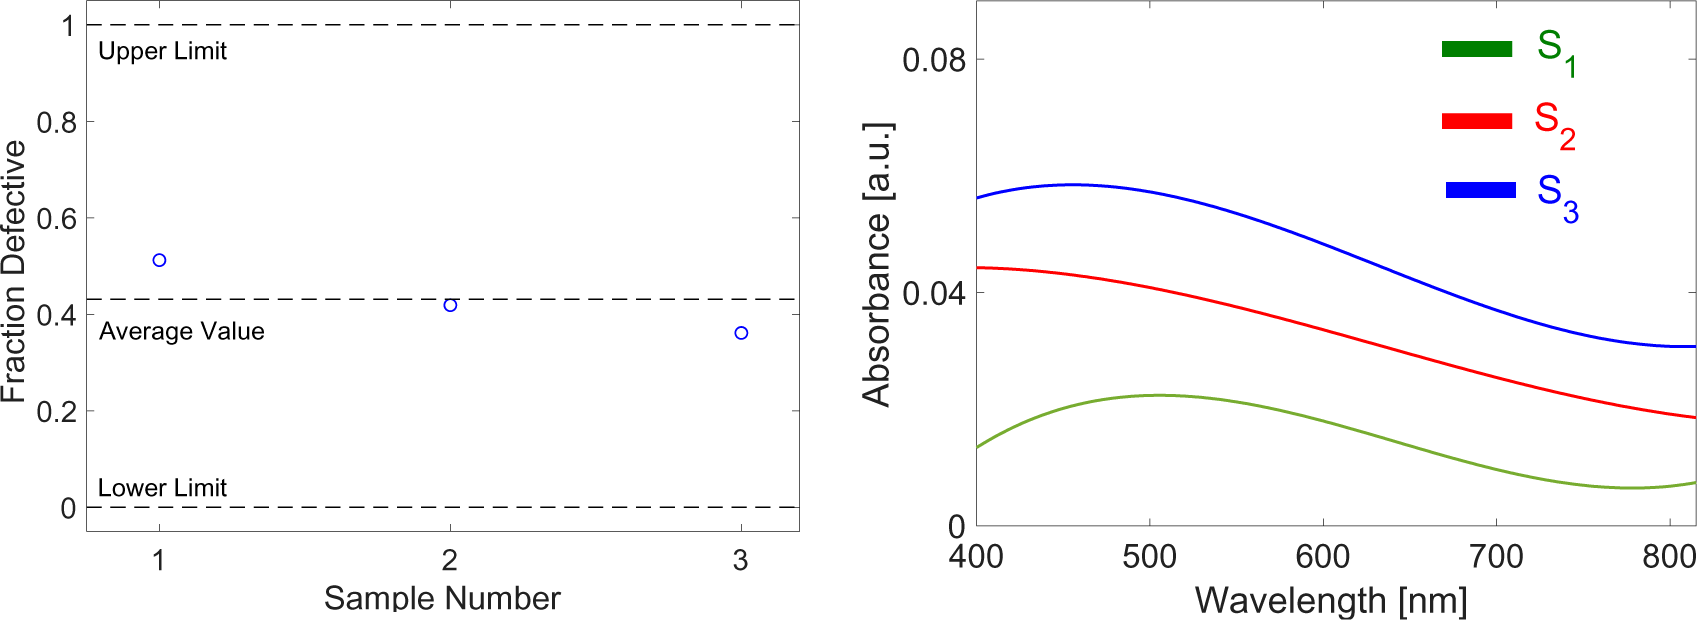
The graphs for the S3 specimen exhibited a consistent 7% increase in absorptivity when compared to S1. The correlation between absorptivity and interspacing between layers is in general an inverse one. Since graphene is transparent, fewer layers will transmit more radiation than with multi-layers, which tend to be more absorptive. The turbostratic graphene platelets act as metal gratings on the aluminum substrate and were seen to significantly enhance spectral absorptivity (Zhao et al. [23]).
The graphene deposition as well as the roughness on the aluminium substrates should allow for a decrease in overall outward reflectance and an increase in absorptivity which is needed for an enhanced absorber performance in the flat plate collector.
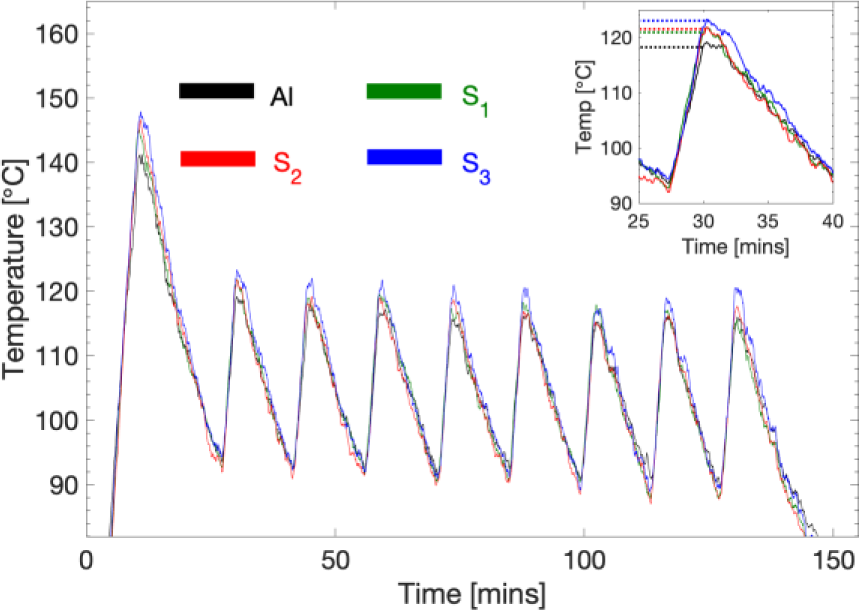
The result of thermal analysis is shown in Figure 7, where the three samples along with a reference aluminium specimen with no surface deposition are heated on a heating plate. Since the heating plate has a thermostat that keeps the temperature between 80 and 100 °C, the temperature profile plotted with time showed distinct periodic fluctuation.
In general, the thermal behaviour of the specimens is inversely proportional to the number of passes as can be seen in Figure 7. The thermal properties of specimens with larger interspacing between the graphene layers (most passes, S3 in this case) is seen to have its thermal properties enhanced by around 22% compared to the bare aluminium reference. There is a pronounced enhancement by as much as 10% when comparing the two graphene-disordered specimens (S3) with ones having more than five structured layers (S1).
Temperature profile for observed single (S1), two pass (S2), and three pass (S3) samples
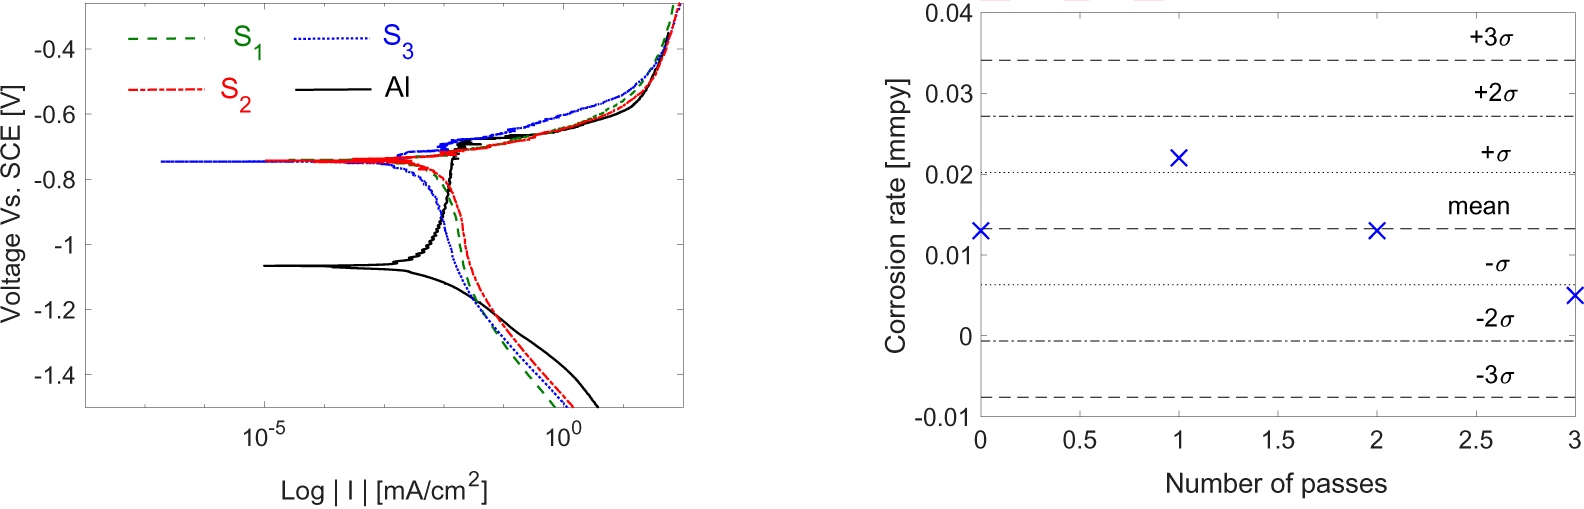
The graphene covered substrates were also tested for a possible role in altering the corrosion resistance of the substrates. The results are compared to the bare aluminum reference, where a 3-sigma chart is constructed, and all specimens are tested to obtain the Tafel plot data.
The plot in Figure 8 shows corrosion information for the three graphene-covered specimens plus bare aluminum.
Tafel plot for the three specimens with the bare aluminum one (a) and corrosion rate test control limits for graphene-covered specimens against bare aluminium (b)
An application for mean comparison within a 95% confidence interval is also tested for the substrates throughout the statistical analysis. To select the appropriate test to compare the means, prior testing for normality, independence as well as homogeneity of the variables should be carried out. The preferred statistical analyses to utilize for a comparison of independent variables for an input variable that is categorical (one, two and three passes of graphite-blasting) and an output variable that is quantitative are the parametric analysis of variance for normally distributed samples and the Kruskal Wallis H test for samples discarding normality.
Initially, to determine which of the two tests to use, normality analysis is carried out using the Shapiro-Wilk test for samples with less than 2,000 data points [24]. The null hypothesis for the test suggests that the dataset came from a normally distributed population with a test statistic of Shapiro and Wilk [25]: data sample not significantly different than normal population (H0), data sample are significantly different than normal population (H1), data: univariate and continuous, confidence interval: 95%, α = 0.05:
(1)
where x_((i)) is the ith order statistic, x ̅_ is the sample mean, and a_i is the coefficient calculated by:
(2)
where m and V are expected values of the order statistics from standard normal distribution and their covariance matrix, respectively.
Therefore, if a sample population is normally distributed, the p-value should be larger than the chosen significance level of 0.05. Additionally, an illustration of the systematic departure from normality is typically associated with the normality analysis by a Q-Q plot, or a quantile-quantile plot, which compares the shapes of distributions, providing a graphical view of how different a theoretical distribution (based on selected quantiles depending on the size of the population) is from the observed distribution. Principally, the Q-Q is a plot of data sorted in ascending order, with marked data points appearing below a certain portion of data.
For samples with elements that exceed 2,000 units, the Kolmogorov-Smirnov test is used on samples where the sample data are standardized and compared to a standard normal distribution. Another indication on normality distribution is the skewness and kurtosis values that need to lie in the following ranges:
If skewness value 0.8 > x > -0.8, data most probably normally distributed;
If Kurtosis value 3 > x > -3, data most probably normally distributed.
The data is estimated to not be normally distributed and therefore, for statistical comparison, the Kruskal-Wallis H test was implemented according to the following criteria and test statistic, H, with a critical value 5.99: there is no difference between number of passes (H0), there is difference between number of passes (H1), confidence interval: 95%, α = 0.05, degrees of freedom (k – 1 = 3 – 1 = 2):
(3)
where N is total sample size, Ti is the sum of the ranks of each group and n is the sample size for each sample size.
The Kruskal-Wallis H test is an ‘omnibus’ test statistic that will show the statistical significance between two groups but will not show which means are different from the other. Thus, the test will be followed by a post hoc test using the Dunn-Bonferroni- error-corrected pairwise comparisons where the adjustment is made by multiplying the Dunn’s p-value by the number of ‘hypotheses’ to be compared (single pass vs. two passes and single pass vs. three passes, etc.) and will henceforth be referred to as the ‘Adjusted Sig.’
After the preliminary tests on the small scale system, the following section presents the determination of the feasibility of designing a deposition system to automate the process and reduce airborne particles that could endanger users or the environment.
The type of system used was the siphon blasting mechanism with a 1.6 cm nozzle size and 0.476 cm air jet orifice. The pressure was initially set at 8 bar. After the expulsion of air, the recorded drainage time was found to be 5.12 minutes. Given that the atmospheric pressure is 1 bar, and the tank size is 0.4 m3, the calculated volumetric flow rate requirement for the blasting gun is found to be: 0.078 m3/min using the following equations:
(4)
(5)
with the density of graphite equating to 2,260 kg/m3, the mass flow rate is equated to be 176.28 kg/min. The experimental evaluation for the percentage of graphite emission in fluid flow rate is attempted where the mass flow rate equates to 0.0656 kg/min, therefore, graphite is assumed to approximately compose 0.04% of the total fluid flow which reduces the flow rate amount to 0.0705 kg/min and for a total number of 62.5 minutes to provide good homogeneity, the amount of graphite needed per substrate is found to be 4.5 kg.
The most critical factor when choosing a compressor should be the volume of air that the air compressor generates which will be a large factor in determining the yield of the blasting process as it relates to the corresponding blast nozzle. The tank will need to empty out a consistent volumetric flow rate of around 5 m3/h to cover the deposition on one substrate. A tank measuring 40 m3 is selected to provide a constant supply of air for the continuous 8-hour duration per day.
The volumetric flow rate specifications for this system will not be of high values for the upscaled system, and the chosen compressor will need to utilize the volumetric flow rate calculated from experimental data in order to appropriately select the output pressure, the nozzle diameter (minimum diameter of 1.6 cm) and the tank size of the upscaled model. In other words, the compressor would need to be customized to this specific application.
Surface pre-treatment of the substrates is important for the consecutive deposition to be homogeneous and to provide a suitable surface for better graphite exfoliation. Grit sandblasting utilizing aluminum oxide abrasives in a gravity-fed system will be used to roughen the surface to allow for better adhesion and bonding of coatings.
The sandblasting process will involve the utilization of a software to generate the motion required for surface pre-treatment.
Even with the suggested graphene-plated process, the absorptivity of the substrate would need to be significantly high to accommodate commercial standards. For pre-treatment and selection of the coatings, the practice of black coating involves processes that include electroplating with hazardous materials. This prompted the upscaling mechanism to involve the purchasing of ready-coated and roughened aluminum with the subsequent step of graphene deposition/blasting.
Experimental procedures have not ensured the support of a ventilating system but is a priority for industrial use that blasting cabinets be properly ventilated. The system would therefore be housed in a positive-pressure enclosure with an air sink located at the bottom of the apparatus where an air mover will ensure that any suspended abrasives/graphite residues be directed into a collection pool for later disposal or wringing for subsequent use. This standalone system along with its contents would be favorably powered using renewable energy resources.
The substrate materials required for the processes include aluminum substrates that are 1 by 2 m2 in size as commercially sold in the UAE and will therefore provide as the baseline for the required dimensions for the functional development of the system in the area.
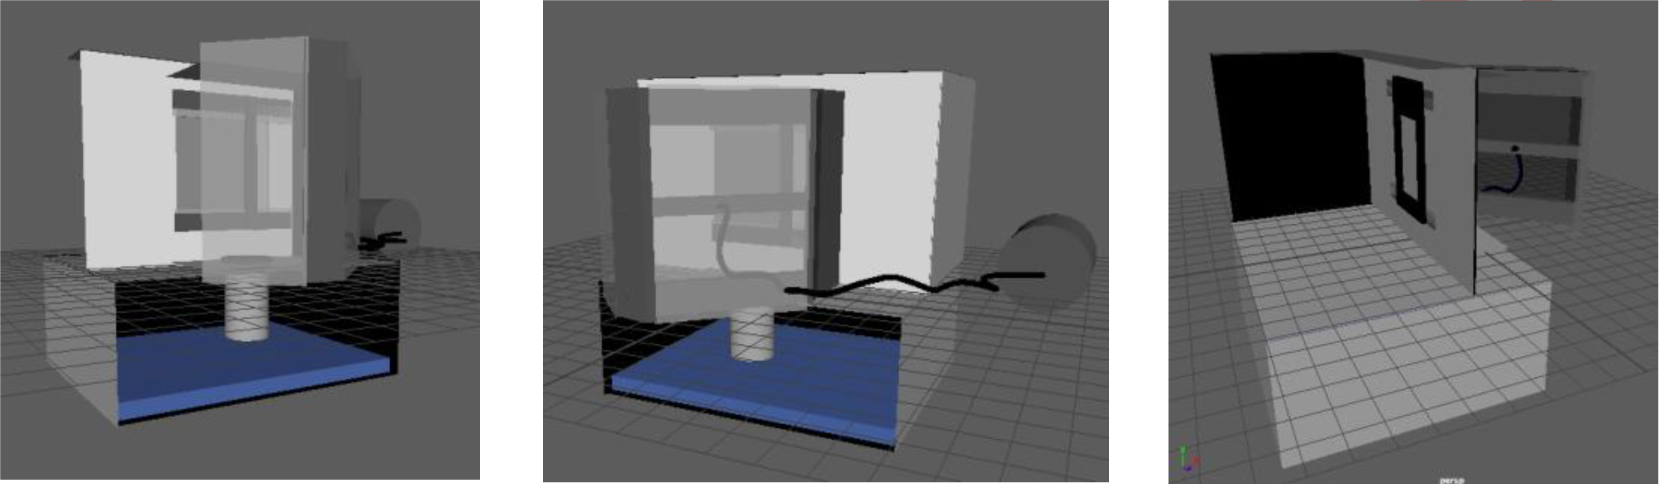
The proposed upscaled system, shown in Figure 9, consists of three main processes: substrate pre-treatment, selective coating deposition and subsequent deposition blasting. The latter of which will be described in the following paragraphs.
The graphene deposition process will be handled sequentially and the process will utilize three main pieces of equipment (mechanisms): a vertical framing system upon which a substrate is mounted, a blasting gun held ~20 cm away from the substrate and an automation tool (3).
After blasting, both processes will undergo air cleaning in which the blast media line will be cut off and only air is blasted onto the surface of the substrate.
Suggested macroscale graphene deposition system design
The graphene deposition process will be the only part of the process that will be discussed and verified in terms of upscaling for surface treatment purposes.
The system will be caged inside a blast room with proper ventilation measuring 5 m × 3.5 m × 2.6 m. The blast room will contain the graphite reservoir contained in a container as well as a compressed air system unit.
A stainless-steel casing will be used as a compartment to hold the sample and conduct the automated experiments. The sample holder is made up of iron frames of the same thickness of the aluminum sample held in place by a magnet on the other side of the compartment. It measures 1 m × 2 m while the compartment measures 2 m × 3 m.
The door to the compartment will hold an 80/20 framing system for the automated movement of the blasting gun on a belt drive system via a CNC machine. A CNC machine was chosen over the option of installing a robotic arm because it was less costly. The deposition blasting process will involve the utilization of a software to generate the motion required for the mechanical gun to deposit graphene. An air compressor supply with a minimum of 5 m3/h of volumetric air flow rate via a plastic hose travelling with the nozzle will be used to apply the graphene.
The process will have a horizontal movement at a constant speed and will be programmed to pass across the substrate at an optimum of 3 passes per sample. The blasting gun will need a minimum nozzle diameter of 1.6 cm and a speed of 0.1 m/s. Suction blasting guns are chosen to be used in this application.
In-between sample blasting, Programmable Logic Controller (PLC) control and electronic sensor technologies will be implemented to enable blast guns to be turned off automatically when there are no components present, thus reducing the energy needed and avoiding unnecessary wear-and-tear on the machinery.
Room for improvement in the technical aspects of this study are crucial to upscaling purposes for industrial use and commercialization. As the technology mentioned here is not mature, potential improvement with trial and error in both materials and equipment will be sought. The low-cost deposition process must therefore be monitored over long periods of time to be able to evaluate essential requirements such as improved automation, maintenance or machine replaceability.
Applications involving graphene have proven to efficiently increase in performance due to its astounding properties which resulted in a significant increase in its demand on a large scale, frequently realized by chemical means. This study introduces a novel graphene synthesis and deposition technique as a scientific contribution that is easily scalable and low in cost with the aim of an increase in performance efficiency of solar thermal collectors. Graphene optical, electrochemical and thermal properties have been assessed and prove to have an impact on solar absorber efficiencies that has the potential of being integrated onto multiple types of pre-treated substrates. For example, the absorptivity of the absorber exhibited a 7% increase when three passes were applied on its surface, while thermal performance increased by 22%. Using graphene has also enhanced the corrosion resistance of the absorber plate. The proposed deposition process is facile with no specialized components or fixtures, and has a potential for commercialization given the importance of the applications it serves.
- ,
Facile Preparation of Graphene Coated Copper Electrodes via Centrifugal Milling for Capacitive Deionization Applications ,Desalination , Vol. 446 ,pp 51-58 , 2018, https://doi.org/https://doi.org/10.1016/j.desal.2018.09.003 - , Handbook of Carbon, Graphite, Diamond and Fullerenes, Noyes Publications Totnes, Devon, UK, 1993
- ,
Enhancement of Spectral Absorption of Solar Thermal Collectors by Bulk Graphene Addition via High-Pressure Graphite Blasting ,Energy Conversion and Management , Vol. 156 ,pp 757-764 , 2018, https://doi.org/https://doi.org/10.1016/j.enconman.2017.11.040 - ,
Functionalized Graphene Enables Highly Efficient Solar Thermal Steam Generation ,ACS Nano , Vol. 11 (6),pp 5510-5518 , 2017, https://doi.org/https://doi.org/10.1021/acsnano.7b00367 - ,
Optical, Thermal and Structural Characteristics of Carbon Nanoparticles Embedded in ZnO and NiO as Selective Solar Absorbers ,Solar Energy Materials and Solar Cells , Vol. 92 (10),pp 1285-1292 , 2008, https://doi.org/https://doi.org/10.1016/J.SOLMAT.2008.04.023 - ,
Accelerated Aging Tests of Chromium Containing Amorphous Hydrogenated Carbon Coatings for Solar Collectors ,Solar Energy Materials and Solar Cells , Vol. 54 (1-4),pp 369-377 , 1998, https://doi.org/https://doi.org/10.1016/S0927-0248(98)00088-9 - ,
Electric Field Effect in Atomically Thin Carbon Films ,Science , Vol. 306 (5696),pp 666-669 , 2004, https://doi.org/https://doi.org/10.1126/science.1102896 - ,
Review of the Synthesis, Transfer, Characterization and Growth Mechanisms of Single and Multilayer Graphene ,RSC Advances , Vol. 7 (26),pp 15644-15693 , 2017, https://doi.org/https://doi.org/10.1039/C7RA00392G - ,
Bulk Turbostratic Graphene Deposition on Aluminum Substrates via High-Pressure Graphite Blasting ,Applied Nanoscience , Vol. 8 ,pp 1943-1950 , 2018, https://doi.org/https://doi.org/10.1007/s13204-018-0862-1 - ,
Methods of Graphite Exfoliation ,Journal of Materials Chemistry , Vol. 22 (48),pp 24992-25002 , 2012, https://doi.org/https://doi.org/10.1039/c2jm34517j - ,
One-Step Synthesis and Deposition of Few-Layer Graphene via Facile, Dry Ball-Free Milling ,MRS Advances , Vol. 2 (15),pp 847-856 , 2017, https://doi.org/https://doi.org/10.1557/adv.2017.245 - ,
Low-Cost Dye-Sensitized Solar Cells With Ball-Milled Tellurium-Doped Graphene As Counter Electrodes And A Natural Sensitizer Dye ,International Journal of Energy Research , Vol. 43 (11),pp 5824-5833 , 2019, https://doi.org/https://doi.org/10.1002/er.4684 - ,
The Worldwide Graphene Flake Production ,Advanced Materials , Vol. 30 (44),pp 1803784 , 2018, https://doi.org/https://doi.org/10.1002/adma.201803784 - ,
Experiments on Polymer Welding via Concentrated Solar Energy ,International Journal of Advanced Manufacturing Technology , Vol. 92 ,pp 3715-3724 , 2017, https://doi.org/https://doi.org/10.1007/s00170-017-0431-x - ,
Blast Coating Method: New Method of Coating Titanium Surface with Hydroxyapatite at Room Temperature ,Journal of Biomedical Materials Research , Vol. 38 (2),pp 129-134 , 1997, https://doi.org/https://doi.org/10.1002/(SICI)1097-4636(199722)38:2<129::AID-JBM7>3.0.CO;2-S - ,
Anchorage of TiO2‐blasted, HA‐coated, and Machined Implants: An Experimental Study with Rabbits ,Journal of Biomedical Materials Research , Vol. 29 (10),pp 1223-1231 , 1995, https://doi.org/https://doi.org/10.1002/jbm.820291009 - ,
Comparison Between Shot Peening and Abrasive Blasting Processes as Deposition Methods for Hydroxyapatite Coatings Onto a Titanium Alloy ,Surface and Coatings Technology , Vol. 216 ,pp 224-231 , 2013, https://doi.org/https://doi.org/10.1016/J.SURFCOAT.2012.11.048 - ,
Experiments on Solar Absorption Using a Greenhouse-Effect Gas in a Thermal Solar Collector ,Journal of Renewable and Sustainable Energy , Vol. 2 (5), 2010, https://doi.org/https://doi.org/10.1063/1.3488789 - , Preparation Method of Sheet-Like Graphene Capable of Producing a Sheet-Like Graphene with a Uniform Thickness Distribution, TW20160143471 20161228, 2018
- ,
Effect of Airborne Contaminants on the Wettability of Supported Graphene and Graphite ,Nature Materials , Vol. 12 ,pp 925-931 , 2013, https://doi.org/https://doi.org/10.1038/nmat3709 - ,
Raman Spectrum of Graphene and Graphene Layers ,Physical Review Letters , Vol. 97 ,pp 187401 , 2006, https://doi.org/https://doi.org/10.1103/PhysRevLett.97.187401 - , Statistical Methods for Quality Improvement (in Czech), Montanex, Ostrava, Czech Republic, 2000
- ,
Enhancement of Near-Infrared Absorption in Graphene with Metal Gratings ,Applied Physics Letters , Vol. 105 ,pp 031905 , 2014, https://doi.org/https://doi.org/10.1063/1.4890624 - ,
Approximating the Shapiro-Wilk W-test for Non-Normality ,Statistics and Computing , Vol. 2 ,pp 117-119 , 1992, https://doi.org/https://doi.org/10.1007/BF01891203 - ,
An Analysis of Variance Test for Normality (Complete Samples) ,Biometrika , Vol. 52 (3-4),pp 591-611 , 1965, https://doi.org/https://doi.org/10.1093/biomet/52.3-4.591