


In major cities of the world, wastewater from homes and industries are delivered to Wastewater Treatment Plants (WWTP) whose major goal is to remove pollutants, and kill pathogens before discharging them into waterways, or before reusing them for various purposes such as industrial, agricultural and recreational [1]. The wastewater treatment process ultimately leaves behind a mass of biosolids commonly called sludge, made up of both organic and inorganic constituents. Because of its rich content of important nutrients such as nitrogen (N) and phosphorus (P), use of biosolid as a soil amendment in agriculture has become common [2]. The use of biosolids in agricultural lands is in line with the 2030 United Nations Agenda for Sustainable Development [3] (UN, 2015), which is linked directly or indirectly to 15 of the 17 Sustainable Developmental Goals (SDG). But the disparity in biosolid quality and nutrient value presents some confusion to farmers. Concerns from newer contaminant (emerging contaminants) classes such as pharmaceuticals, antibiotics and nanoparticles on ecological and human health effects are rising [4]. In their review paper, Snow et al. [4] reported that the fate of emerging contaminants is influenced to a large extent by the type of soil amendment, soil properties, and chemical properties. Geng et al. [5] also reported that the fate of sulfamethoxazole residues in sludge amended agricultural lands depended on the sludge treatment process. As a result of the absence of conclusive findings regarding the fate of emerging contaminants from sludge applied to agricultural lands, existing guidelines have not yet set threshold values. Hence, this study.
The organic fraction of biosolid is influenced by both the origin of wastewater and the treatment process [6]. The biochemical composition of biosolid influences the rate of carbon decomposition and N mineralization [7]. Previous studies have reported that biosolid treatment processes could also influence carbon and N mineralization characteristics of biosolid [8]. For example, in a 16 week soil-biosolid mix laboratory N mineralization study [9], found that as a percentage of the total organic N applied, activated sludge had the highest mineralizable N (40%), followed by raw and primary sludges (25%), anaerobically digested biosolid (15%), and composted biosolid (8%). This indicates that activated sludge has the highest and composted biosolid the lowest N fertilizer value because 40% of the organic N from the activated sludge was decomposed to a crop available inorganic N form of N (NH4) compared with 8% for composted biosolid. Other studies conducted by Hernandez et al. [10] also showed that aerobically digested biosolid gave higher N mineralization than those anaerobically digested. Activated sludge has been reported to give much higher mineralization than digested biosolid due to the high active organic carbon and less stable compounds [11].
Biosolid dewatering and/or drying techniques could further alter their organic matter content and N fertilizer value [12]. Studies conducted by Rigby et al. [13] showed that thermally dried mesophilic anaerobically digested biosolids had a larger mineralizable pool of N than dewatered mesophilic anaerobically digested biosolid, despite the former’s lower total and mineral N content. Similar findings were reported by Matsuoka et al. [14] and Fernández et al. [15]. According to the latter authors, thermal drying increased the easily mineralizable fraction of N and carbon (C) in the sludge. The most commonly used biosolid dewatering techniques around the world include: thermal drying, drying beds, lagoons, belt pressing, cake filtration and centrifugation [16]. Drying bed technique which traditionally uses the solar radiation and infiltration to remove water from biosolids [17] is commonly employed both in developed and developing countries. This is mainly due to the low operational skill requirements and low running costs [17] compared to mechanical drying techniques that require external mechanical power supply. Despite this, there is insufficient literature related to the effect of boisolid drying depth on drying beds in the N content and therefore the N fertilizer value. To our knowledge, there is only one study conducted in Saudi Arabia by Al-Malack [18]. The study conducted in Saudi Arabia took place in a hot dry climate with mean daily temperatures of 36.75 °C and 22.8 °C during summer and winter, respectively. The temperature in this area rises to 45 °C, which is rare in most of the habitable regions of the world, where WWTP are located. Besides, the authors tested a single sludge, activated sludge.
Generally, there is little information about the combined effect of biosolid treatment methods and biosolid drying techniques on the N fertilizer value of biosolids. In addition, the effect of biosolid depth in drying beds and duration of drying during the drying process on C and N mineralization needs investigation.
The aim of this study was to investigate: the interactive effect of selected wastewater treatment and post treatment biosolid drying techniques on the total N content and the N fertilizer value of biosolids (a) and the effect of biosolid drying depth on beds in the N content and fertilizer value of biosolid (b). To achieve the stated objectives the following hypothesis were tested: regardless of the biosolid treatment process, biosolids dried in similar drying depths will have similar N contents (a) and the N fertilizer value of biosolids expressed through N mineralization is influenced by drying depth and biosolid treatment process (b).
This study consists of two separate consecutive experiments (laboratory N mineralization experiment and field experiment). The laboratory N mineralization experiment was designed to investigate the interactive effect of biosolid treatment and post treatment dewatering techniques on the N fertilizer value of biosolids. While the field experiment was designed to determine the effect of biosolid drying thickness/depth on beds on the N content of biosolids. Hence, other drying techniques such as thermal drying are not investigated in this study.
To investigate the interactive effect of biosolid treatment and post treatment dewatering techniques on biosolid total N, inorganic N, total C, and C:N ratio, five biosolid/sludge types that have undergone various treatment and post treatment drying techniques were selected (Table 1). Similarly to evaluate the effect of biosolid/sludge treatment method alone on the N content of biosolid/sludge, municipal wastewater sludge of the same origin was exposed to different treatment processes (activated sludge without digestion [Activated] and anaerobically digested [ADS3]). Then after both Activated and ADS3 were dried on concrete beds in thin layers of about 100 mm. These two products were selected because they are the most commonly produced byproducts in South African WWTP. Of the five biosolids, three of them (ADS2, Activated, and Thermally Hydrolysed Sludge [THS]), were selected for laboratory N mineralization study to determine the interactive effect of biosolid treatment and post treatment dewatering techniques on the N fertilizer value of biosolids. The effect of drying thickness/depth on the N content of biosolid was investigated using liquid sludge collected after mesophilic anaerobic digestion (ADS2L).
Representative samples for each sludge/biosolid treatment and drying technique were collected randomly from the drying beds for analyses. The samples were analysed in triplicates. The actual sewage treatment processes and dewatering/drying methods evaluated in this experimental work are shown in Table 1 while selected chemical properties of the sludge materials are presented in Table 2.
A laboratory N mineralization study was conducted using three sludge/biosolid types (ADS2, Activated, and THS) in a constant room temperature of 25 ±1 °C. Two of the sludge/biosolids (ADS2 and Activated) represent the most commonly produced sludges/biosolids in South Africa. The third, THS, is one of the technologies, which South African WWTP are considering to adopt. The laboratory N mineralization study was conducted in 1,163 cm3 volume airtight containers where 100 g soil was mixed with the candidate sludge/biosolid to meet a 300 kg N ha−1 application rate.
The amount of biosolid/sludge added for each biosolid/sludge type under investigation to satisfy the 300 kg N ha−1 is presented on Table 3. The soil used for the laboratory N mineralization study was a Hutton sandy clay loam (loamy, kaolinitic, mesic, Typic Eutrustox). Selected properties of the soil used for the laboratory N mineralization study are presented on Table 4. Inorganic N in the form of potassium nitrate (KNO3) was added to increase the soil NO3--N level to 60 mg kg−1 to minimize N immobilization [19] (Table 3). The soil moisture was maintained at field capacity by adding water based on mass difference.
Description of biosolids used
Sludge acronym |
Sludgetreatment processes |
Biosolid solid fraction [%] |
Volatile suspended solids destruction [%] |
Digestion |
Age (retention time) (days) |
Post treatment drying techniques and duration |
|||
|---|---|---|---|---|---|---|---|---|---|
Primary |
Secondary |
Drying method |
Sludge layer depth during drying [mm] |
Duration of drying technique (days) |
|||||
Activated |
Activated sludge, not digested |
95 |
- |
- |
- |
- |
Conventional concrete drying beds |
< 100 |
7 |
ADS1 |
Anaerobically digested |
70 |
33 |
Mesophilic |
15 |
2 |
Conventional concrete drying beds |
250 |
21 days in summer |
ADS2 |
Anaerobically digested |
95 |
44 |
Mesophilic |
25 |
3 |
Sand paddy |
250 |
180 days (winter and summer) |
ADS3 |
Anaerobically digested |
95 |
35 |
Mesophilic |
- |
- |
Conventional concrete drying beds |
< 100 |
7 |
THS |
Thermally hydrolyzed |
50 |
47 |
140-170 °C |
- |
- |
Belt pressed |
N/A |
N/A |
Selected chemical properties of biosolids investigated
Biosolid |
pH (1:2.5)H2O |
EC [mS m−1] |
Solids |
Total P |
Potassium (K) |
Sodium (Na) |
Calcium (Ca) |
Aluminium (Al) |
Iron (Fe) |
Magnesium (Mg) |
Zinc (Zn) [mg kg−1] |
Manganese (Mn) [mg kg−1] |
|---|---|---|---|---|---|---|---|---|---|---|---|---|
Activated* |
6.24 |
264 |
95 |
2.44 |
0.59 |
0.11 |
1.96 |
0.74 |
1.21 |
0.53 |
1,166 |
175 |
ADS1† |
5.86 |
236 |
70 |
3.02 |
0.27 |
0.15 |
2.86 |
2.17 |
nd |
0.39 |
2,886 |
880 |
ADS2† |
6.34 |
77 |
95 |
2.34 |
0.26 |
0.07 |
2.76 |
2.03 |
2.15 |
0.37 |
3,065 |
625 |
ADS3† |
6.58 |
211 |
95 |
2.00 |
0.46 |
0.1 |
1.83 |
0.77 |
1.12 |
0.42 |
1,121 |
600 |
THS‡ |
6.78 |
317 |
50 |
2.70 |
0.08 |
0.06 |
3.38 |
0.81 |
nd |
0.15 |
523 |
291 |
Activated sludge
Anaerobically digested sludge
Thermally hydrolysed sludge
(not determined)
All values presented are oven dry mass based
Mass of soil and sludge used, amount of KNO3 added, and temperature of controlled temperature room during the laboratory N mineralization study
Sludge type |
Mass of soil used for N mineralization study (oven dry) [g] |
Mass of biosolid/sludge added to soil (oven dry basis) [g per 100 g soil] |
Mass of KNO3 added [g per 100 g soil] |
Temperature [°C] |
|---|---|---|---|---|
ADS2 |
100 |
1.03 |
0.57 |
25 ±1 |
THS |
100 |
0.86 |
0.56 |
25 ±1 |
Activated sludge |
100 |
0.59 |
0.57 |
25 ±1 |
Sludge mass addition to soil was determined based on crop N requirement of 300 kg ha−1 and was computed as the sum of the inorganic N and 50% of the organic N
Selected properties of the soil used for the laboratory N mineralization study
Variable |
Units |
Amount |
|---|---|---|
Total N |
[%] |
0.09 |
Organic C |
[%] |
1.7 |
Organic N* |
[%] |
0.084 |
C:N |
[-] |
20 |
NH4+ |
[mg/kg] |
33.964 |
NO3- |
[mg/kg] |
20.384 |
pH |
[-] |
6.1 |
EC |
[mS m−1] |
52 |
Silt |
[%] |
24 |
Clay |
[%] |
26 |
Sand |
[%] |
46 |
Calculated as the difference between total N and total inorganic N (NH4+, and NO3- and NO2-)
Samples from the laboratory N mineralization study were collected for analyses at the following day intervals: 0, 1, 3, 7, 15, 30, 65, and 100. For statistical analysis purposes, each treatment had three replications for each sampling period. All treatments were aerated during sampling for the first seven days of laboratory N mineralization. After day seven, treatments were opened and weighed once a week and at sampling time to replenish water to field capacity.
To investigate the effect of drying thickness/depth on beds on the N content of biosolids, Anaerobically Digested Sludge (ADS2L) was used. This sludge was selected because it is the most commonly produced biosolid in South Africa used in agricultural lands. Selected chemical properties of the ADS2L biosolid are presented in Table 5.
Selected properties of the anaerobically digested liquid sludge used in this study during the autumn and winter season
Season |
pH (H2O) |
EC [dS m−1] |
Water content |
Total N [%] |
Total C |
NO3 [mg kg−1] |
NH4 [mg kg−1] |
|---|---|---|---|---|---|---|---|
Autumn |
6.76 |
3.31 |
96.84 |
0.13 |
57.63 |
1,065.00 |
605.00 |
Winter |
6.83 |
3.33 |
96.40 |
0.14 |
57.90 |
524.00 |
342.00 |
Field experiment was conducted at one of East Rand Water Care Works (ERWAT) plants, Vlakplaats at Vosloorus, Sedibeng district, Gauteng. To mimic the drying bed system used at WWTP, plastic containers (0.62 m long × 0.62 m wide × 0.38 m deep) with drainage holes at the bottom were used. The basement of the drying container was then lined with a geo-fabric material that only allows liquid to drain whilst retaining all the solids. The plastic containers were dug into the ground allowing the brim of the drying container to be at level with the ground surface. Five drying depths (5, 10, 15, 20 and 25 cm), replicated three times, were then laid randomly in the drying containers. The study was conducted for two seasons (autumn [rainy and warm temperature] and winter [cooler and no rainfall]). The drying period for each phase was determined by the maximum number of days (drying time) required to reach 90-95% solid or 5-10% moisture content in drying beds.
During sludge drying, samples were collected in triplicates from the ‘drying beds’ for analysis of targeted physical and chemical properties. Sampling was done on weekly basis for the first three weeks and thereafter, in two weeks interval. Sampling continued from day 1 until biosolid solid concentration reaches 90-95% solid or 10-5% moisture content at which the experiment was terminated. During each sampling period, biosolid samples were collected from each treatment using a scoop and were placed into a plastic container and sealed. The plastic containers were transferred immediately into a mobile cooler maintained at 4 °C and were transported to the University of Pretoria soil laboratory for analyses.
Biosolid samples were ground to pass through a 150 m screen and analyzed for total C and N using Dumas combustion on a Carlo Erba NA1500 N, C, S elemental analyzer (Carlo ErbaStrumentazione, Milan, Italy). Organic C was determined using the standard Walkley-Black method [20]. Electrical Conductivity (EC) and acidity (pH) of the biosolid materials were determined in 1:2.5 biosolid to water ratio. Total P and all heavy metals were determined using Inductively Coupled Plasma Optical Emission Spectrometer (ICP-OES) (Spectroflame Modula, Spectro, Kleve Germany) after wet acid digestion [21].
Inorganic N (NO3-N and NH4-N) release from sludge amended soils and control were determined by the steam distillation method described by Mulvaney [22].
The cumulative amount of net N mineralized from biosolids was calculated using eq. (1):
(1)
The Net N mineralized was converted to Net N mineralized per organic C applied [g kg−1] and Net N mineralized per organic N applied [g kg−1] using eq. (2) and eq. (3), respectively:
(2)
(3)
Data were analysed using ANOVA and the General Linear Model Procedures of Windows SAS Version 9.3 [23]. Error bars on figures representing the effect of biosolid treatment and post treatment drying techniques on the N content and N mineralization indicate standard deviation at P≤ 0.05.
Findings from this study are discussed under three sections as presented below.
Total N content differed across biosolid treatment and post treatment dewatering (drying) techniques (Table 6). Generally, biosolid total N content varied between 2.81% for ADS1 dried in thick layers of 250 mm to 5.47% for ADS3 dried in thin layers of about 100 mm (Table 6). The total N content of the anaerobically digested biosolids, which were dried in thick layers of 250 mm in two different drying bed types (concrete beds) ADS1 (2.81%) and (sand paddy) ADS2 (2.83%) were similar. Similarly, the total N content of anaerobically digested biosolid dried in thin layers of 100 mm (ADS3 [5.47]) was relatively closer to the N content of an activated sludge (Activated [4.95%]) dried in thin layers of 100 mm, despite the differences in treatment processes.
C:N ratio, lignin:N ratio, organic C, organic N, and inorganic N of anaerobically digested biosolids dried on concrete beds (ADS1 and ADS3) and paddy dried (ADS2), activated sludge dried in concrete drying beds (Activated), as well as THS
Variables |
ADS1* |
ADS2† |
ADS3‡ |
Activated§ |
THSǁ |
|---|---|---|---|---|---|
C:N ratio |
6.05 |
8.78 |
6.44 |
5.72 |
5.77 |
Lignin:N ratio |
0.61 |
1.40 |
0.12 |
0.18 |
0.50 |
Organic C [%] |
17 |
24.8 |
31.9 |
29.7 |
18.1 |
Total N [%] |
2.81 |
2.83 |
5.23 |
4.95 |
3.13 |
Organic N [%] |
2.50 |
2.78 |
5.08 |
4.83 |
2.83 |
NH4+ [mg kg−1] |
2,640 |
250 |
1,449 |
1,008 |
2,697 |
NO3- + NO2- [mg kg−1] |
508 |
254 |
75.4 |
166 |
325 |
Anaerobically digested sludge dried on conventional concrete drying beds in thick layers of about 250 mm
Anaerobically digested sludge dried on sand drying beds in thick layers of about 250 mm
Anaerobically digested sludge dried on conventional concrete drying beds in thin layers of about 100 mm
Activated sludge dried on concrete drying beds in thin layers of about 100 mm
Thermally hydrolyzed sludge belt pressed
The similarity in the total N content between ADS1 and ADS2 as well as between ADS3 and Activated seems to indicate that drying depths and time play a crucial role in affecting the N content of sludges. Nonetheless, further study on the effect of drying depth on the N content of sludge was warranted. Hence a separate field trial was conducted to ascertain this findings (presented in the following section).
The total N content of THS (3.13%) was within the ranges of the total N contents of ADS1 and ADS2. The N content of both ADS1 and ADS2 were within the ranges reported by Barbarick and Ippolito [24] (1.6-3.6%) for biosolids that have undergone similar treatment and drying technique. The drying depth used to dry the biosolids reported by Barbarick and Ippolito [24], however, is not stated.
In contrast to the total N, the proportion of inorganic N (NH4+ + NO3- + NO2-) was higher for biosolids dried in thick layers of 250 mm (ADS1 [11.2%] and ADS2 [9.7%]) than those dried in thin layers of 100 mm (Activated [2.4%] and ADS3 [2.7%]). The inorganic N proportion results from this study for ADS1 and ADS2 were within the ranges reported for biosolids from similar treatment processes (mesophilic anaerobic digestion) Cogger et al. [12] (9.3%) as well as Barbarick and Ippolito [24] (16.5%). The biosolid drying depths on beds for the latter were not reported. The inorganic N contents of ADS3 and Activated were, however, far lower than those reported by Rigby et al. [25] for biosolids from similar treatment processes.
The initial N content and C:N ratio are the basic properties that highlight the potential decomposition rate of a biological organic material [26]. Previous studies with plant litter have shown that materials with a low C:N ratio are characterized by rapid decomposition and less immobilization than materials with higher C:N ratios [27]. It is also well documented that organic materials which are rich in lignin, cellulose and hemicellulose are characterized by low decomposition rates [28].
Cumulative net N mineralization varied significantly among biosolid types (Figure 1). This is in agreement with previous studies which reported that N mineralization from biosolids is a function of biosolid treatment processes [9]. Generally net N mineralization from the anaerobically digested sludges (ADS2) (23 g N kg−1 organic C applied) was higher than mineralization from similar biosolid types reported by Parnaudeau et al. [19] (< 10 g N kg−1 organic C applied). This is most probably because of the relatively higher initial N content (2.83%) (Table 3) and lower C:N ratio (8.76) (Table 3) of the biosolids from this study compared with that of Parnaudeau et al. [19] (2.48% N, 9.19 C:N ratio).
N mineralization per kg organic C (a) and N mineralization per kg organic N (b) applied from anaerobically digested sludge dried in paddy in thick layers of 250 mm (ADS2), Activated sludge dried in thin layers of less than 100 mm (Activated) and THS
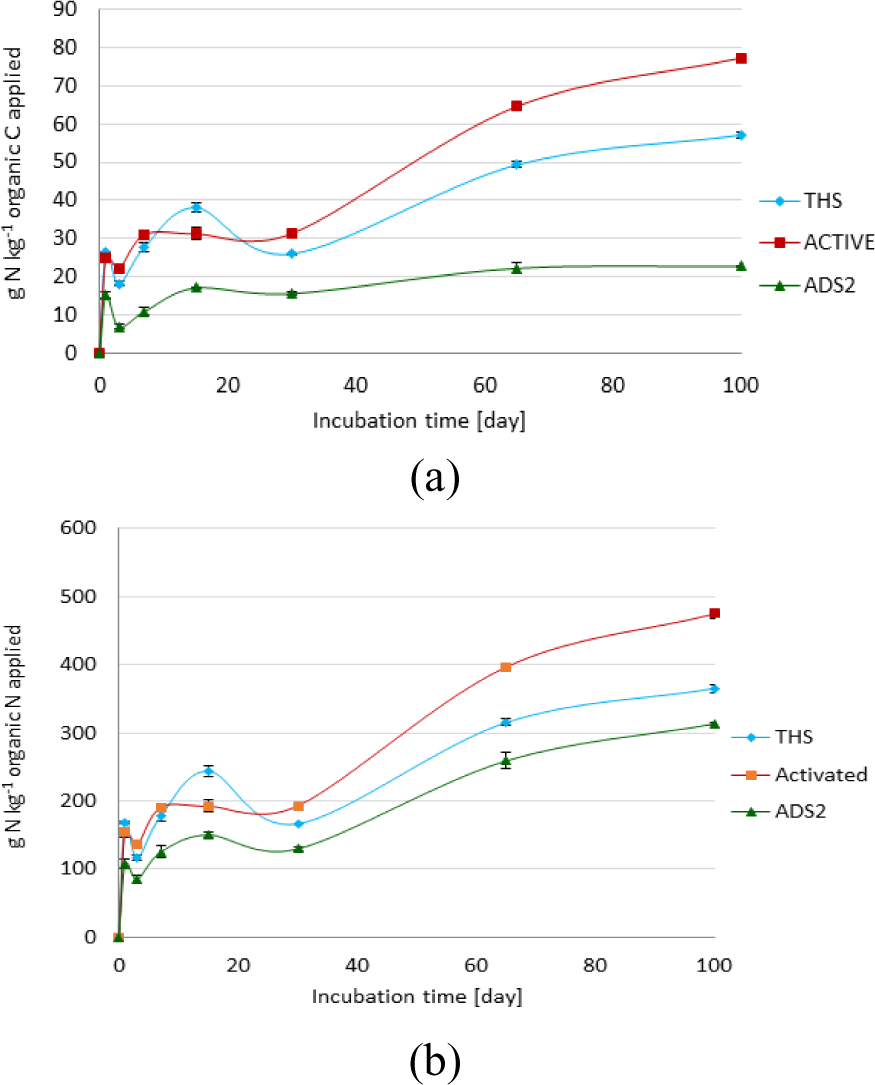
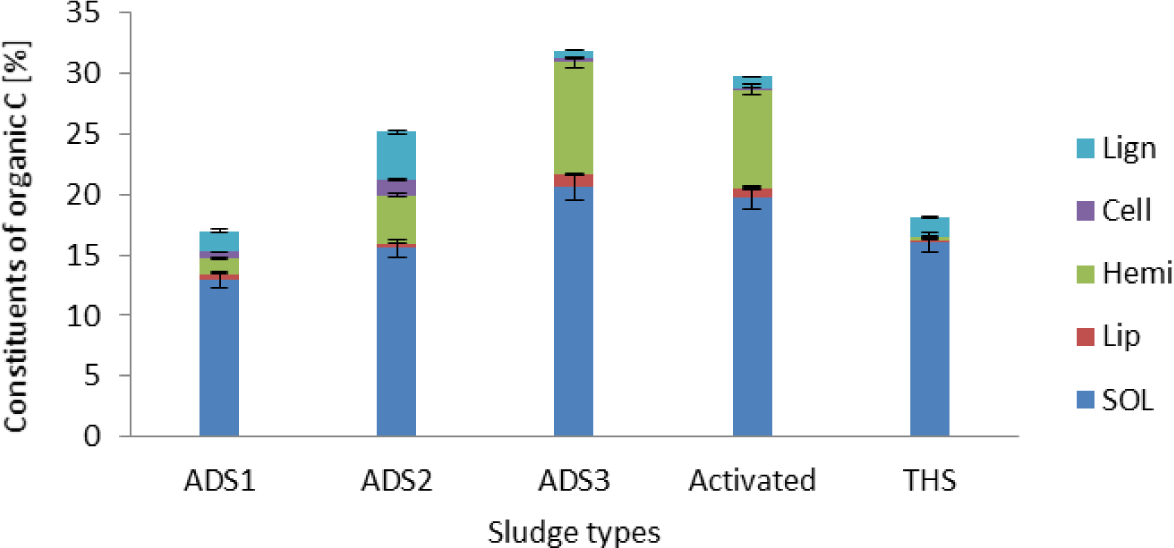
Net N mineralization per kg organic C (Figure 1a) and per kg organic N applied (Figure 1b) after 100 days of N mineralization study was higher from activated sludge than from the other two biosolids (ADS2, and THS). This was most probably attributed to the higher initial N content of activated sludge (4.95%) compared with that of ADS2 (2.83%) and THS (3.13%) (Table 2). Previous studies [29] have shown that the initial N concentration influences the amount of N that can potentially be mineralized. In addition, Activated sludge had lowest lignin fraction (3.21%) by mass compared with the ADS2 (15.96%) and THS (8.7%) (Figure 2). This is attributed to a combination of factors including the reduction of the mass of solid waste [30] and the accumulation of non-degradable lignin [29] with anaerobic digestion of the activated sludge. Lignin affects N mineralization negatively [28]. This has a significant implication on the N fertilizer value of the wastewater sludges.
Total percentage distribution of organic constituents for five sludge types (anaerobically digested dried in concrete beds in layers of 250 mm depth [ADS1], anaerobically digested dried in paddy in layers of 250 mm depth [ADS2], anaerobically digested dried on concrete slab in layers of less than 100 mm depth [ADS3], activated sludge dried in concrete slab in layers of less than 100 mm depth [Activated], THS) (Lip = Lipids, SOL = Soluble Organic Compounds, Hemi = Hemicellulose, Cell = Cellulose, Lign = Lignified fraction)
The N fertilizer value of activated sludge investigated in this study was 22 kg N per tonne of biosolid. This is in contrast to the N fertilizer value of THS (10 kg N per tonne biosolid) and ADS2 (6 kg N per tonne biosolid). Despite only a 10% difference in the initial total N content between THS (3.13%) and ADS2 (2.83%), cumulative N mineralization from THS (57.11 g N kg−1 C applied) on day 100 was 2.5 times higher than that of ADS2 (22.27% g N kg−1 C applied). Such a difference is most probably attributed to the higher lignin fraction (15.96%), lignin:N ratio (1.40), and C:N ratio (8.78) of ADS2 compared with THS (lignin = 8.7%, lignin:N ratio = 0.50, C:N ratio = 5.77). It is well documented that higher lignin:N ratio results in low net N mineralization as a result of N immobilization [19].
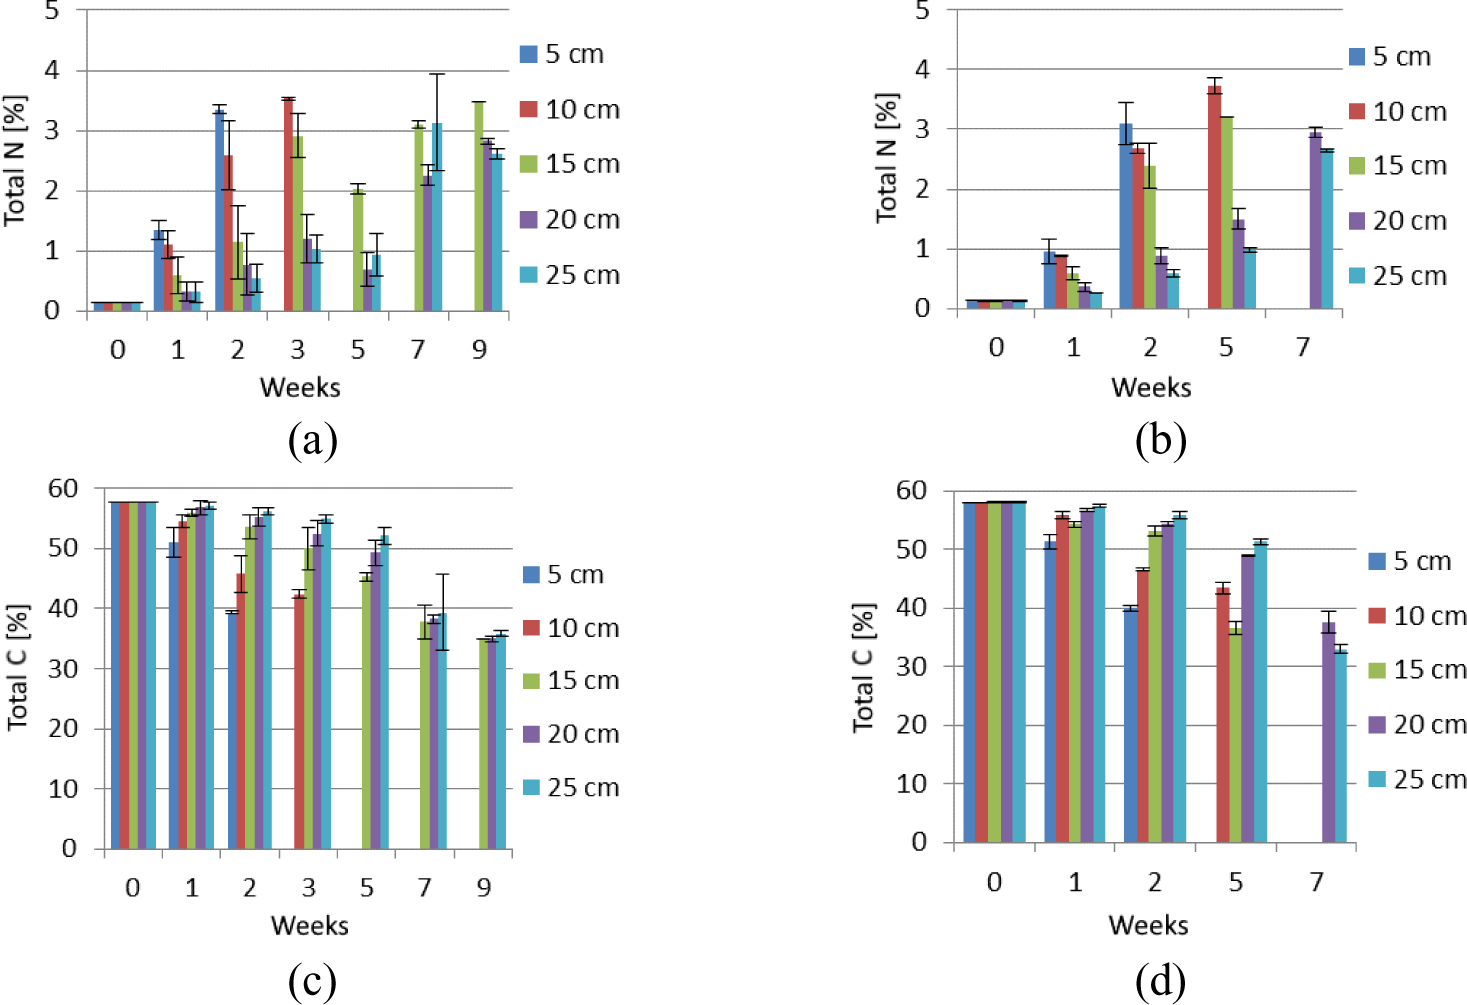
Generally, the total N content of the wastewater sludge showed an increasing trend during the drying period (Figure 3a and Figure 3b). The only exception is in autumn between week 3 and 5 (drying depths of 15, 20 and 25 cm) and between week 7 and 9 (drying depth of 25 cm). This is in contrast to the pattern of total C, which decreased as the time for drying progressed (Figure 3c and Figure 3d). The total N content of the sludge for the shallow drying depths of 5 cm and 10 cm (in autumn) and 5-15 cm (in winter) increased rapidly during the first two weeks of drying. At the end of the drying period, highest total N was recorded for the 10 cm drying depth both during the autumn (3.53%) and winter (3.72%) seasons (Figure 4). On the other hand, the lowest total N was recorded for the drying depth of 25 cm both during autumn (2.62%) and winter (2.65%) (Figure 4). Total N content of each drying depth remained similar between seasons. The only exception was for the 15 cm depth, where the N content for winter being significantly lower than autumn.
Total N in autumn (a); total N in winter (b); total C in autumn (c) and total C in winter (d) changes at 5, 10, 15, 20 and 25 cm drying depths during drying on drying beds (error bars indicate standard deviation)
Total N increased as biosolid drying time progressed thus leading to higher final total N of the dried biosolid than the initial liquid sludge, on dry mass basis. This finding agrees with that of Nayak et al. [31], who reported an increase in total N as time progressed during sludge compositing.
Total N content (oven dry mass basis) of anaerobically digested sludge dried at five drying depths (error bars indicate standard deviation)
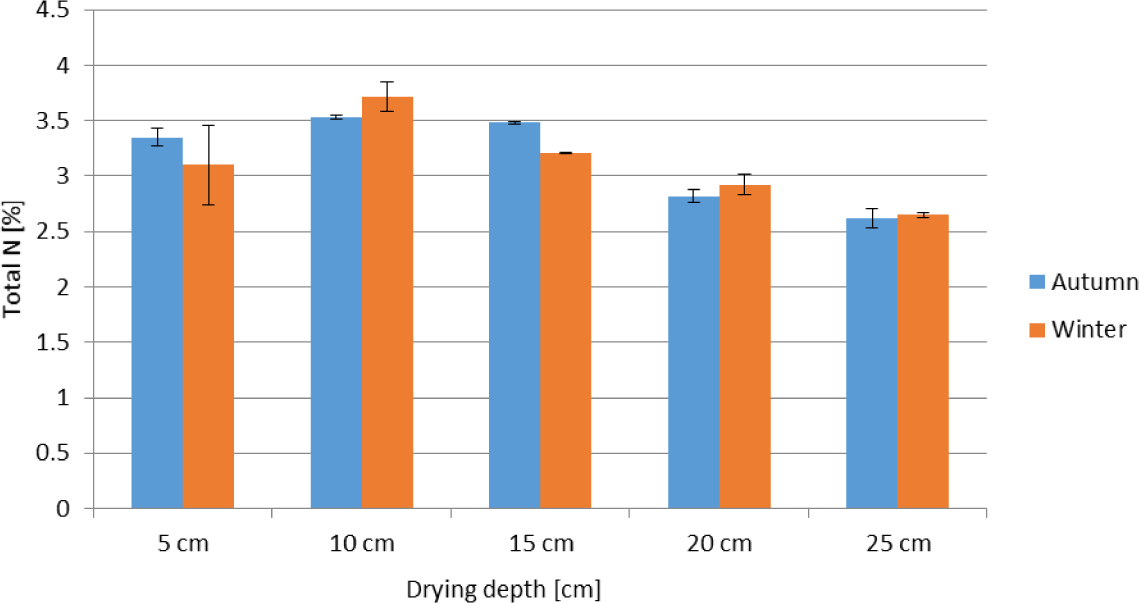
The highest increment was observed for the 10 cm drying depth, followed by 15 cm and 5 cm drying depths. While thicker drying depths of 20 and 25 cm resulted in lower N by the end of drying period. The lower total N content recorded at 20 and 25 cm depths are most likely due to two reasons: enhanced NH3 volatilization and denitrification losses from the middle to lower sections of the drying beds, which remained quite wet for longer time. The relatively wet and warm environment in the middle to the lower sections of the drying beds (data not presented) speeded up organic matter decomposition during which NH4+ is released. An increase in the concentration of NH4+, which was observed between weeks 3 and 7 in autumn and weeks 2 and 5 in winter for the 20 and 25 cm drying depths (data not presented), leads to an increase in the concentration gradient between the atmospheric NH3 and the NH3 in the biosolid resulting in the diffusion of ammonia from the biosolid strata to the atmosphere thus negatively affecting the total N content of the biosolid [17].
Biosolid treatment methods, post treatment drying depth in beds, and duration had significant impacts on the total N and the N fertilizer value. Highest N content were reported for the 10 cm drying depth. Further increase in drying depth beyond 15 cm led to a significant reduction in biosolid N content. Generally the N content and the total N amount per tonne biosolid applied was higher for biosolids dried at shallow depths (5, 10 and 15 cm) than those dried at 20 and 25 cm. Net N mineralization per kg C and N applied was highest for activated sludge (77 g kg−1 C, 474 g kg−1 N) and lowest for anaerobically digested biosolid ADS2 (23 g kg−1 C, 205 g kg−1 N). This was mainly attributed to the lower lignin:N ratio of activated sludge (0.19) compared with ADS2 (1.40) and THS (0.50). Therefore, the following hypothesis is accepted: the N fertilizer value of biosolids expressed through N mineralization is influenced by drying depth and biosolid treatment process.
The authors wish to sincerely acknowledge Water Research Commission (WRC), East Rand Water Care Company (ERWAT) and National Research Foundation South Africa (NRF) for funding this study.
The authors would like also to sincerely acknowledge funding from EnviSafeBioC project-contract No PPI/APM/2018/1/00029/U/001 for funding to present this study in SDEWES conference. The project is financed by the Polish National Agency for Academic Exchange.
- ,
Multiple-Objective Evaluation of Wastewater Treatment Plant Control Alternatives ,J. Environ. Manage. , Vol. 91 (5),pp 1193-1201 , 2010, https://doi.org/https://doi.org/10.1016/j.jenvman.2010.01.009 - ,
Biosolids Management with Net-Zero CO2 Emissions: A Technological Synergy Design ,Clean Techn. Environ. Policy , Vol. 19 (3),pp 2099-2111 , 2017, https://doi.org/https://doi.org/10.1007/s10098-017-1398-x - United Nations, 2015, https://sustainabledevelopment.un.org/?menu=1300, [Accessed: 06-April-2020]
- ,
Detection, Occurrence, and Fate of Emerging Contaminants in Agricultural Environments ,Water Environ. Res. , Vol. 90 (10),pp 1348-1370 , 2018, https://doi.org/https://doi.org/10.2175/106143018X15289915807254 - ,
Impact of Sludge Treatments on the Extractability and Fate of Acetyl Sulfamethoxazole Residues in Amended Soils ,Chemosphere , Vol. 194 ,pp 828-836 , 2018, https://doi.org/https://doi.org/10.1016/j.chemosphere.2017.12.003 - ,
Composting Anaerobic and Aerobic Sewage Sludges Using Two Proportions of Sawdust ,Waste Manage , Vol. 27 (10),pp 1317-1327 , 2007, https://doi.org/https://doi.org/10.1016/j.wasman.2006.09.008 - ,
Nitrogen Dynamics Under Lolium Perenne After a Single Application of Three Different Sewage Sludge Types from the Same Treatment Stream ,Bioresour. Technol , Vol. 91 (3),pp 233-241 , 2004, https://doi.org/https://doi.org/10.1016/S0960-8524(03)00205-0 - ,
Sewage Sludge Application in Mediterranean Agricultural Soils: Effects of Dose on the Soil Carbon Cycle ,Int. J. Environ. Res. , Vol. 7 (4),pp 945-956 , 2013, https://doi.org/https://doi.org/10.22059/ijer.2013.677 - ,
Mineralization of Nitrogen in Sewage Sludges ,J. Environ. Qual. , Vol. 12 (1),pp 150-156 , 1983, https://doi.org/https://doi.org/10.2134/jeq1983.00472425001200010028x - ,
Nitrogen Mineralisation Potential in Calcareous Soils Amended with Sewage Sludge ,Bioresour. Technol. , Vol. 83 (3),pp 213-219 , 2002, https://doi.org/https://doi.org/10.1016/S0960-8524(01)00224-3 - ,
Modeling Sewage Sludge Decomposition in Soil: I. Organic Carbon Transformation ,J. Environ. Qual. , Vol. 10 (1),pp 54-59 , 1981, https://doi.org/https://doi.org/10.2134/jeq1981.00472425001000010012x - ,
Biosolids Processing Effects on First-And Second-Year Available Nitrogen ,Soil Sci. Soc. Am. J. , Vol. 68 (1),pp 162-167 , 2004, https://doi.org/https://doi.org/10.2136/sssaj2004.1620 - ,
The Influence of Soil and Biosolids Type, and Microbial Immobilisation on Nitrogen Availability in Biosolids‐Amended Agricultural Soils – Implications for Fertiliser Recommendations ,Soil Use Manage , Vol. 25 (4),pp 395-408 , 2009, https://doi.org/https://doi.org/10.1111/j.1475-2743.2009.00240.x - ,
Effect of Heating Treatments on Nitrogen Mineralization from Sewage Sludge ,Soil Sci. Plant Nutr. , Vol. 52 (4),pp 519-527 , 2006, https://doi.org/https://doi.org/10.1111/j.1747-0765.2006.00061.x - ,
Carbon Mineralization in an Arid Soil Amended with Thermally-Dried and Composted Sewage Sludges ,Geoderma , Vol. 137 (3-4),pp 497-503 , 2007, https://doi.org/https://doi.org/10.1016/j.geoderma.2006.10.013 - ,
Water Environment Federation (WEF), Dewatering ,in: Digestion of Municipal Wastewater Treatment Plants (5th ed.) , Vol. 3 , 2009, Solids Processing and Management, WEF Press, Alexandria, Virginia, USA - ,
Dewaterability of Sludge Digested in Extended Aeration Plants Using Conventional Sand Drying Beds ,Afr. J. Biotechnol. , Vol. 9 (29),pp 4578-4583 , 2010, https://doi.org/https://doi.org/10.5897/AJB10.726 - ,
Effect of Sludge Initial Depth on the Physical and Chemical Characteristic of Dried Municipal Sludge ,Cur. Enviro. Eng. , Vol. 1 (1),pp 30-44 , 2014, https://doi.org/https://doi.org/10.2174/2212717801666140307001614 - ,
Relevance of Organic Matter Fractions as Predictors of Wastewater Sludge Mineralization in Soil ,J. Environ. Qual. , Vol. 33 (5),pp 1885-1894 , 2004, https://doi.org/https://doi.org/10.2134/jeq2004.1885 - , Non-Affiliated Soil Analysis Work Committee, Handbook of Standard Soil Testing Methods for Advisory Purposes, 1990
- ,
Nitric Acid Digestion and Multi-Element Analysis of Plant Material by Inductively Coupled Plasma Spectrometry ,Commun. Soil Sci. Plant Anal. , Vol. 18 (1),pp 131-146 , 1983, https://doi.org/https://doi.org/10.1080/00103628709367806 - , Nitrogen ‒ Inorganic Forms, in: Methods of Soil Analysis: Part 3-Chemical Methods, 1996
- , SAS Institute, Statistical Analysis Software, Version 9.4., SAS Inst., Cary, North Carolina, USA, 2010
- ,
Nitrogen Fertilizer Equivalency of Sewage Biosolids Applied to Dryland Winter Wheat ,J. Environ. Qual. , Vol. 29 (4),pp 1345-1351 , 2000, https://doi.org/https://doi.org/10.2134/jeq2000.00472425002900040043x - ,
A Critical Review of Nitrogen Mineralization in Biosolids-Amended Soil, the Associated Fertilizer Value for Crop Production and Potential for Emissions to the Environment ,Sci. Total Environ. , Vol. 541 ,pp 1310-1338 , 2016, https://doi.org/https://doi.org/10.1016/j.scitotenv.2015.08.089 - ,
Typology of Exogenous Organic Matters Based on Chemical and Biochemical Composition to Predict Potential Nitrogen Mineralization ,Bioresour. Technol. , Vol. 101 (1),pp 157-164 , 2010, https://doi.org/https://doi.org/10.1016/j.biortech.2009.08.025 - ,
Crop Residues and Fertilizer Nitrogen Influence Residue Decomposition and Nitrous Oxide Emission from a Vertisol ,Biol. Fertility Soil , Vol. 47 (1),pp 15-23 , 2011, https://doi.org/https://doi.org/10.1007/s00374-010-0497-1 - ,
Chemical and Spectroscopic Analyses of Organic Matter Transformations During Composting of Olive Mill Wastes ,Int. Biodeterior. Biodegrad. , Vol. 54 (1),pp 39-44 , 2004, https://doi.org/https://doi.org/10.1016/j.ibiod.2003.12.004 - ,
Effects of Palm Oil Mill Effluent (POME) Anaerobic Sludge from 500 m3 of Closed Anaerobic Methane Digested Tank on Pressed-Shredded Empty Fruit Bunch (EFB) Composting Process ,Afr. J. Biotechnol. , Vol. 9 (16),pp 2427-2436 , 2010, https://doi.org/https://doi.org/10.5897/AJB2010.000-3053 - ,
Biological Pre-Treatment Enhances Biogas Production in the Anaerobic Digestion of Pulp and Paper Sludge ,Waste Manag. Res. , Vol. 28 (9),pp 800-810 , 2010, https://doi.org/https://doi.org/10.1177/0734242X09358734 - ,
Effects of Various C/N Ratios During Vermicomposting of Sewage Sludge Using Eiseniafetida ,Environ. Sci. Technol. , Vol. 6 (2),pp 63-78 , 2013, https://doi.org/https://doi.org/10.3923/jest.2013.63.78