


Water scarcity is a major constraint to many countries such as Thailand, Lao, Vietnam, and Cambodia, which about more than half of the essential reservoirs representing stand below 40 percent of capacity and frequently occurs for wide fluctuations in rainfed production [1]. Thailand is experiencing a severe drought event impacting large areas of many provinces are warning to prepare for serve drought in the country, especially Northeast (Isan), in particular, agriculture and industry sectors [2]. Eastern of Thailand, the river level is quite low that saltwater from the ocean is creeping upstream and affecting water and drinking water supplies unpredictable [3]. It can be seen that in a country where foremost environmental, crop production, social, economic, and industrial estates problems in the region are expected to suffer [4], [5]. Therefore, treated wastewater for sustainable water reuse is recognized and challenged as a strategic option in industrial processes that must be integrated approach into comprehensive water resource management plans, including water supply, wastewater collection, reclamation, and reuse [6] locally is required.
Thailand is one country of Southeast Asia that has many factories, such a process of pickling, curing, and preserving fruits and vegetables for all regions as rising export demands and domestic consumption [7]. High water consumption is used in these processes, which have an effect on the high production of wastewater volume along with treatment costs account for 60–70% of the production cost [8] that have been widely explored. In the present, wastewater from these processes has been investigated to study and improve for sustainable reuse. Hence, a purification method is essential to remove impurities such as protein, carbon source, and acetic acid [8] from the production processes. However, acetic acid is one of the major organic acids (known as a non-degradable organic compounds) in a broad range of applications as a solvent [9] in various industries such as textiles, pharmaceutical industry, synthetic fibers, synthetic polymers, plastics manufacturing [7], petroleum, fine chemicals and food industry [10]. Acetic acid is used to food production [11], [12] as a food ingredient such as a flavor enhancer, flavoring agent, an acidifier, color diluent, curing, and pickling agent, pH control agent, solvent, and preservative. High concentrations of acetic acid can cause irritation [13] or severe injury depending on the concentration. Other problems are also possible such as renal failure and interference with blood clotting [13]. The acetic acid may react with strong reagents such as perchlorate and Puerto permanganate, which can cause explosions [14], [15] in food processing industries. Therefore, the residual acetic acid like chemical effluents [16], [17] after the production process needs to find a way to manage waste occurring [18], [19]. If there is the contamination of acetic acid in the wastewater, resulting from the production process, then the high volume of wastewater may affect the function of microorganisms and the performance in wastewater treatment and biological treatment. Therefore, wastewater containing contaminants should be treated to inhibit the growth of microorganisms and metabolic depression, and the decomposition of organic matter in wastewater treatment [20] containing acetic acid so as not to affect the biological wastewater treatment and discharge of wastewater containing contaminants into receiving water.
Numerous traditional processes are applied for acetic acid removal from preserving fruits and vegetables industry or fermentation broths and industrial fields such as liquid-liquid extraction, vinyl acetate, reactive extraction, analytical chemistry, adsorption, electrodialysis, precipitation, solvents in many commercial products (inks and paints), distillation, membrane processes [21], bioelectrochemical [22], extraction and stripping processes [23], bulk liquid membrane and bulk ionic liquid membranes [24]. Besides, adsorption technology also can be applied in removing for non-degradable organic compounds like acetic acid such as magnetic bio-adsorbent and Fe3O4 nanoparticles nanocomposite [25], [26], nanocomposite [27], [28], thorium-ethanolamine nanocomposite [28], [29], fruit peel and seed activated carbon [30], [31]. Currently, the technology of treating acetic acid and organic contaminants in the wastewater industry uses chemical treatments [32] such as Advanced Oxidation Process (AOPs) [33], [34], a process that involves the production of a hydroxyl radical (OH•) [35], [36]. Deng and Zhao [37] reported that AOPs could be applied in various pollutants in wastewater with a combination of hydroxyl radical, Ozone, Photocatalytic oxidation, Ultraviolet ray, Fenton process, and sulfate-based AOPs represents Advanced Oxidation Processes. Fenton oxidation processes are unstable and active oxidant agents that can react quickly with non-degradable organic compounds on the biological wastewater treatment (denoted as R) at a constant rate. The OH• is formed from the reaction of oxidizing agent (H2O2) and metal salt or oxide catalyst (Fe2+) to generate strong reactive species, as shown in the reaction chain of eq. (1) – eq. (7). The main reactions of Fenton oxidation process in an acidic medium are shown in eq. (1) of the conditional treatment, other reactions are shown in eq. (2) – eq. (7) [38], [39]:
(1)
(2)
(3)
(4)
(5)
(6)
(7)
while organic compounds reaction in an acidic medium is shown as eq. (8) – eq. (11) [38], which OH• can attract the organic radicals to form double-bound or by the abstraction of a hydrogen atom from aliphatic organic molecules such as additive radical, hydrogen abstract action, electron transfer, and radical combination:
(8)
(9)
(10)
(11)
However, several studies have been reported that biological and ultrafiltration membrane treatment processes are of the promising options in the treatment of non-organic and organic loads such as dyeing wastewater, pulp and canned food factory. However, both treatments have a major limitation of inorganic and expensive and membrane fouling, respectively [40], [41]. While the advanced Fenton oxidation process is an alternative method in reducing industrial wastewater organic loads due to advanced oxidation processes are capable of transforming non-biodegradable into non-toxic biodegradable substances [42]. In case of acetic acid contaminated wastewater from food processing (Wastewater was brought from the process of pickling in Thailand) decomposition, the role of H2O2, Fe2+ ions, initial pH and reaction time are important in the Fenton process; however are has not been investigated yet. Therefore, the primary aim of this research was to investigate the degradation of acetic acid contaminated wastewater from the food industry using the Fenton oxidation process via response surface methodology (RSM) with applying the method from the literature [43]. Besides, the effect of pH, temperature and ratios of H2O2: Fe2+ ions on the degradation efficiency of pre-treatment through advanced Fenton oxidation process in a batch system was evaluated by using RSM module in the design of experiment (DOE) for sustainable water reuse as reclaimed water.
Raw wastewater, RSM relevant statistical analysis and RSM batch experiment were detailed in this section. The removal efficiency of COD and color was used as a surrogate parameter in the Fenton oxidation process as the following details.
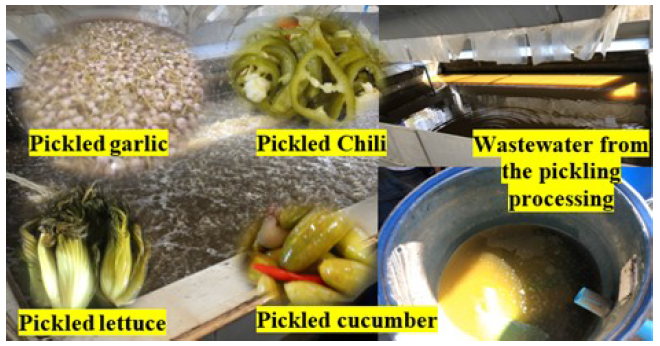
Raw wastewater was obtained from the food processing of pickling, curing, and preserving fruits and vegetables in the north of Phayao province, Thailand. In general, raw wastewater was contaminated with acetic acid and eliminated by pouring into the sludge drying area with other waste and let it evaporate naturally, which can affect humans and the environment inevitably. The preliminary characteristics of raw wastewater are presented in [Table 1].
Raw wastewater quality parameters from food processing wastewater
| Parameter | Raw wastewater range values |
|---|---|
| pH | 2.9-3.2 |
| COD (mg/L) | 2,550-3030 |
| Color ( Pt-Co) | 2154-2545 |
[Figure 1] shows the physical characteristics of the raw wastewater used. It can be seen that the color is yellow-brown and unpleasant smell, which wastewater comes from the process of pickling, acetic acid is added to the salt solution (NaCl) to make the pickling brine. Acetic acid acts as a preservative and diffuses into the vegetables, while salt solution keeps the vegetables from swelling [44]. However, to control the lab-scale experiment, this project only focused on the removal of acetic acid at a low pH via Fenton oxidation process.
Brine wastewater from food processing industry
The finding of optimum conditions for pre-treatment of acetic acid in terms of four independent variables were selected for the initial pH, H2O2 concentration, Fe2+ ions concentration and reaction time along with a fixed temperature of 25 oC, was further investigated using with the advanced Fenton oxidation process. In this step of the experimental design, experimental range and levels of center composite design were analyzed by response surface methodology (RSM) via the design of experiment (DOE) software tools called central composite design (CCD). The optimal response of the operation factors was analyzed to obtain the statistical techniques (empirical regression model) and graphical data (ANOVA, analysis of variance) for pre-treatment of acetic acid through RSM. Then, the second-degree polynomial was computed through a four-factor of CCD in order to estimate the advanced design for 30 experimental runs. The experimental runs (N) were accomplished by using 16 (2n) factorial points, 8 (2n) axial points at the center run and 6 (N0) central points, which were attained according to eq. (12):
(12)
where N is the experimental runs, n is the numbers of operational factors of the initial pH, H2O2 concentration, Fe2+ ions concentration and reaction time involved, 2n is the number of factorial points, 2n is the number of axial points and N0 is the centre points.
The eq. (13), a second-degree polynomial regression model was obtained from the experimental data of 30 runs that were analyzed through the CCD matrix:
(13)
where y is the predicted response, xi and xj are the real or code values of the variable parameter obtained from pre-treatment acetic acid runs, ε is the random error and β0, βi, βii and βij are the constant regression coefficient, linear regression coefficient, quadratic regression coefficient and interaction regression coefficient respectively.
For the pre-treatment of acetic acid study via Fenton oxidation process from food processing, CCD allowed four numeric factors were set to range in five levels: low level (-, minus factorial point), high (+, plus factorial point ), center point level (0), and two axial points (plus and minus alpha) corresponding to -1 and +1. In terms of plus and minus alpha are not shown here due to it is the same range and levels of factorial point. The overall range and levels of CCD are illustrated in [Table 2].
Overall of experimental range and levels for the center composite design of food processing wastewater
| Variables | Unit | Range and levels | ||
|---|---|---|---|---|
| -1 | 0 | 1 | ||
| x1, H2O2 concentration | mol/L | 0.01 | 0.03 | 0.05 |
| x2, Fe2+ ions concentration | mol/L | 0.02 | 0.05 | 0.08 |
| x3, Initial pH | - | 2 | 3.5 | 5 |
| x4, Reactions time | min | 30 | 90 | 150 |
Laboratory-scale, the degradation of acetic acid, the Fenton oxidation process were carried out in 1.5 L batch reactor. 1 L of raw wastewater was adjusted to the desired level (pH 2.0 ± 0.1 – pH 5.0 ± 0.1) using 1.0 N H2SO4 and/or NaOH (both was purchased from Ajax Finechem) before adding the ratios of hydrogen peroxide oxide (H2O2, 0.01 – 0.05 mol/L, Sigma-Aldrich) and Ferrous (FeSO4.7H2O, 0.02 – 0.08 mol/L, analytical grade, Ajax Finechem) reagent with the heating of 40 °C temperature and then followed by changing the reaction time of 30 – 150 min. After that, aliquots were withdrawn with adding 10.0 mL NaSO3 (sodium sulfite, 25% w/v, Sigma-Aldrich)) to stop the reaction immediately for each contact time and filtered through 0.45 μm syringe filters (Glass fiber filter, GA-55). COD (Chemical Oxygen Demand, mg/L, HANNA, HI 96727) and color (Pt-Co, HANNA, HI 96727) were measured as a surrogate parameter to obtain the optimization via Fenton oxidation process for sustainable water reuse. However, all batch experiments were run by following the CCD matrix (code and actual variables), as shown in [Table 6].
The results of Response Surface Methodology and model fit and Optimum conditions of treated acetic acid using Fenton oxidation process were evaluated as follows.
The computing of the empirical quadratic models was obtained by using 30 observed responses from the experimental runs that were formulated via the RSM. The percent of pre-treatment efficiency, the highest order polynomial of both empirical quadratic models for color and COD were remarked as suggested, and the model is not aliased by the software as shown in [Table 3].
Model summary statistics for color and COD used as surround gate parameters for food processing wastewater treatment
| Source | Standard derivative | R-Squared | Adj. R-Squared | Pred. R-Squared | PRESS | Remarks |
|---|---|---|---|---|---|---|
| Color | ||||||
| Linear | 9.63 | 0.1644 | 0.0307 | -0.0934 | 3036.83 | |
| 2FI | 10.76 | 0.2086 | -0.2080 | -0.8220 | 5060.40 | |
| Quadratic | 9.54 | 0.5082 | 0.0492 | -1.0336 | 5647.99 | Suggested |
| Cubic | 9.68 | 0.7638 | 0.0216 | -6.8523 | 21808.95 | Aliased |
| COD | ||||||
| Linear | 7.73 | 0.2438 | 0.1228 | -0.1718 | 2312.99 | |
| 2FI | 7.60 | 0.4434 | 0.1504 | -1.1873 | 4317.42 | |
| Quadratic | 6.93 | 0.6350 | 0.2944 | -1.2389 | 4419.35 | Suggested |
| Cubic | 2.50 | 0.9779 | 0.9084 | 0.1398 | 1697.86 | Aliased |
The optimum condition of pre-treatment for acetic acid, the best percent of removal efficiency for both color and COD was correlated with four factors of H2O2 concentration (x1), Fe2+ ions concentration (x2), initial pH (x3), and reaction time (x4). The final empirical models of the suggested quadratic model in terms of the four actual variable factors are shown by eq. (14) and eq. (15). Both suggested quadratic models of color and COD, the negative signs in front of the terms show antagonistic effects, and the positive sign indicates synergistic effects [43].
(14)
(15)
The ANOVA results analysis parameters for the quadratic regression models of Eqs. (14) and (15) are obtainable in [Table 4]. The t-test follows a Student’s t-distribution was used as a tool to verify the Fisher's F statistic (test statistic for F-test) value with a low p-value Prob>F less than 0.0500, indicating the model terms are significant for the regression models. It can be suggested that the regression models indicated the p-value Prob > F more than 0.0500, illustrating the model terms for the response surface quadratic model of eq. (14) and eq. (15) is insignificant. Therefore, the regression models needed to be reduced as shown in eq. (16) and eq. (17).
The analysis of variance table for the response surface quadratic model of eq. (14) and eq. (15) for food processing wastewater treatment
| Source | Sum of Squares | df | Mean Square | F Value | p-value Prob > F |
|---|---|---|---|---|---|
| color | |||||
| Model | 1411.45 | 14 | 100.82 | 1.11 | 0.4221 |
| x1 H2O2 | 259.84 | 1 | 259.84 | 2.85 | 0.1119 |
| x2 Fe2+ | 0.37 | 1 | 0.37 | 4.06E-03 | 0.95 |
| x3 pH | 99.69 | 1 | 99.69 | 1.09 | 0.312 |
| x4 Reaction time | 96.56 | 1 | 96.56 | 1.06 | 0.3195 |
| x1 x2 | 6.25E-06 | 1 | 6.25E-06 | 6.86E-08 | 0.9998 |
| x1 x3 | 11.34 | 1 | 11.34 | 0.12 | 0.7291 |
| x1 x4 | 6.64 | 1 | 6.64 | 0.073 | 0.7908 |
| x2 x3 | 3.36 | 1 | 3.36 | 0.037 | 0.8503 |
| x2 x4 | 13.78 | 1 | 13.78 | 0.15 | 0.7027 |
| x3 x4 | 87.47 | 1 | 87.47 | 0.96 | 0.3426 |
| x12 | 39.18 | 1 | 39.18 | 0.43 | 0.5218 |
| x22 | 644.03 | 1 | 644.03 | 7.07 | 0.0179 |
| x32 | 389.04 | 1 | 389.04 | 4.27 | 0.0565 |
| x42 | 2.92 | 1 | 2.92 | 0.032 | 0.8603 |
| COD | |||||
| Model | 1253.47 | 14 | 89.53 | 1.86 | 0.1218 |
| x1 H2O2 | 9.02 | 1 | 9.02 | 0.19 | 0.671 |
| x2 Fe2+ | 9.53 | 1 | 9.53 | 0.2 | 0.6623 |
| x3 pH | 35.7 | 1 | 35.7 | 0.74 | 0.4022 |
| x4 Reaction time | 426.9 | 1 | 426.9 | 8.89 | 0.0093 |
| x1 x2 | 0.011 | 1 | 0.011 | 2.19E-04 | 0.9884 |
| x1 x3 | 21.6 | 1 | 21.6 | 0.45 | 0.5127 |
| x1 x4 | 97.96 | 1 | 97.96 | 2.04 | 0.1737 |
| x2 x3 | 234.17 | 1 | 234.17 | 4.88 | 0.0432 |
| x2 x4 | 0.41 | 1 | 0.41 | 8.46E-03 | 0.9279 |
| x3 x4 | 39.91 | 1 | 39.91 | 0.83 | 0.3764 |
| x12 | 33.13 | 1 | 33.13 | 0.69 | 0.4193 |
| x22 | 122.84 | 1 | 122.84 | 2.56 | 0.1306 |
| x32 | 28.72 | 1 | 28.72 | 0.6 | 0.4514 |
| x42 | 0.42 | 1 | 0.42 | 8.82E-03 | 0.9264 |
[Table 5] demonstrates the analysis of variance table for response surface reduced quadratic model, the statistical significance for the regression coefficient of the model terms were confirmed by the results of the p-value Prob>F less than 0.0500. The results found that the model terms of color and COD were of high significance. It can be suggested that these model terms can be successfully applied to predict the optimum conditions for the response of the maximum percent removal efficiency via Fenton oxidation process. Hence, the reduced regression model of eq. (16) and eq. (17) was obtained as follows:
(16)
(17)
The analysis of variance table for response surface reduced quadratic model of eq. (16) and eq. (17) for food processing wastewater treatment
| Source | Sum of Squares | df | Mean Square | F Value | p-value Prob > F |
|---|---|---|---|---|---|
| Color | |||||
| Model | 1285.93 | 7 | 183.70 | 2.71 | 0.0347 |
| x1 H2O2 | 259.84 | 1 | 259.84 | 3.83 | 0.0631 |
| x2 Fe2+ | 0.37 | 1 | 0.37 | 5.455E-003 | 0.9418 |
| x3 pH | 99.69 | 1 | 99.69 | 1.47 | 0.2381 |
| x4 Reaction time | 96.56 | 1 | 96.56 | 1.42 | 0.2454 |
| x12 | 36.29 | 1 | 36.29 | 0.54 | 0.4721 |
| x22 | 733.96 | 1 | 733.96 | 10.83 | 0.0033 |
| x32 | 404.72 | 1 | 404.72 | 5.97 | 0.0230 |
| Residual | 1491.51 | 22 | 67.80 | ||
| Lack of Fit | 925.46 | 17 | 54.44 | 0.48 | 0.8818 |
| Pure Error | 566.05 | 5 | 113.21 | ||
| Cor Total | 2777.44 | 29 | |||
| COD | |||||
| Model | 1253.06 | 12 | 104.42 | 2.46 | 0.0439 |
| x1 H2O2 | 9.02 | 1 | 9.02 | 0.21 | 0.6505 |
| x2 Fe2+ | 9.53 | 1 | 9.53 | 0.22 | 0.6414 |
| x3 pH | 35.70 | 1 | 35.70 | 0.84 | 0.3717 |
| x4 Reaction time | 426.90 | 1 | 426.90 | 10.07 | 0.0056 |
| x1 x3 | 21.60 | 1 | 21.60 | 0.51 | 0.4851 |
| x1 x4 | 97.96 | 1 | 97.96 | 2.31 | 0.1469 |
| x2 x3 | 234.17 | 1 | 234.17 | 5.52 | 0.0311 |
| x3 x4 | 39.91 | 1 | 39.91 | 0.94 | 0.3456 |
| x12 | 33.13 | 1 | 33.13 | 0.78 | 0.3891 |
| x22 | 122.84 | 1 | 122.84 | 2.90 | 0.1070 |
| x32 | 28.72 | 1 | 28.72 | 0.68 | 0.4219 |
| x42 | 0.42 | 1 | 0.42 | 0.00998E-003 | 0.9216 |
| Residual | 720.83 | 17 | 42.40 | ||
| Lack of Fit | 684.32 | 12 | 57.03 | 7.81 | 0.0169 |
| Pure Error | 36.51 | 5 | 7.30 | ||
| Cor Total | 1973.89 | 29 | |||
Note: Values of “p-value Prob > F” less than 0.0500 indicate model terms are significant.
Values of Df are the design factor, and the mean square indicates a variance in the linear fitting process.
Values of F-values are generated when the model significance is examined.
As shown in [Table 6], both experimental and predicted percent removal of colure and COD on the Fenton oxidation process. Each of the experimental of percent removal was compared with the predicted value in terms of the errors. The comparison of percent errors with the mean square residual (MSR, [Table 5], 67.80 for color and 42.40 for COD) illustrated that for most of the percent errors of each runs not exceeded twofold as compared to the root mean square residual (RMSR). These results confirmed great appropriateness of the reduced quadratic model for pre-treatment of acetic acid in terms of color and COD as presented in eq. (16) and eq. (17).
Thirty runs of code and actual variables with experimental response values for food processing wastewater treatment
| Run | Code variable | Actual variable | Responses | |||||||||||
|---|---|---|---|---|---|---|---|---|---|---|---|---|---|---|
| x1 | x2 | x3 | x4 | x1 | x2 | x3 | x4 | Color (%) | COD (%) | |||||
| Observed | Predicted | Error (%) | Observed | Predicted | Error (%) | |||||||||
| 1 | 1 | 1 | 1 | -1 | 0.05 | 0.08 | 5 | 30 | 74.15 | 80.20 | 8.20 | 58.74 | 65.42 | 11.37 |
| 2 | 0 | 1 | 0 | 0 | 0.03 | 0.08 | 3.5 | 90 | 89.30 | 91.91 | 2.92 | 78.05 | 72.99 | 6.48 |
| 3 | 1 | -1 | -1 | 1 | 0.05 | 0.02 | 2 | 150 | 82.57 | 80.45 | 2.57 | 78.45 | 73.52 | 6.28 |
| 4 | -1 | 0 | 0 | 0 | 0.01 | 0.05 | 3.5 | 90 | 80.98 | 68.60 | 15.29 | 67.15 | 76.28 | 13.60 |
| 5 | 0 | 0 | 0 | 0 | 0.03 | 0.05 | 3.5 | 90 | 75.73 | 75.98 | 0.33 | 81.06 | 79.15 | 2.36 |
| 6 | -1 | 1 | -1 | -1 | 0.01 | 0.08 | 2 | 30 | 63.46 | 67.93 | 7.04 | 76.29 | 73.46 | 3.71 |
| 7 | 0 | 0 | 0 | 0 | 0.03 | 0.05 | 3.5 | 90 | 95.14 | 75.98 | 20.14 | 82.87 | 79.15 | 4.49 |
| 8 | 0 | 0 | -1 | 0 | 0.03 | 0.05 | 2 | 90 | 61.58 | 61.68 | 0.16 | 84.10 | 81.07 | 3.60 |
| 9 | 0 | 0 | 0 | 0 | 0.03 | 0.05 | 3.5 | 90 | 64.05 | 75.98 | 18.63 | 76.17 | 79.15 | 3.91 |
| 10 | 0 | -1 | 0 | 0 | 0.03 | 0.02 | 3.5 | 90 | 92.47 | 92.20 | 0.29 | 66.98 | 71.54 | 6.81 |
| 11 | -1 | -1 | 1 | -1 | 0.01 | 0.02 | 5 | 30 | 67.52 | 72.92 | 8.00 | 78.67 | 75.66 | 3.83 |
| 12 | 0 | 0 | 0 | 0 | 0.03 | 0.05 | 3.5 | 90 | 69.70 | 75.98 | 9.01 | 78.67 | 79.15 | 0.61 |
| 13 | 1 | -1 | 1 | 1 | 0.05 | 0.02 | 5 | 150 | 90.29 | 85.15 | 5.69 | 78.64 | 83.15 | 5.73 |
| 14 | -1 | -1 | 1 | 1 | 0.01 | 0.02 | 5 | 150 | 71.08 | 77.55 | 9.10 | 76.41 | 77.29 | 1.15 |
| 15 | 1 | 1 | -1 | 1 | 0.05 | 0.08 | 2 | 150 | 77.22 | 80.16 | 3.81 | 78.67 | 82.62 | 5.02 |
| 16 | -1 | 1 | 1 | -1 | 0.01 | 0.08 | 5 | 30 | 69.30 | 72.64 | 4.82 | 65.35 | 69.46 | 6.29 |
| 17 | 1 | 1 | -1 | -1 | 0.05 | 0.08 | 2 | 30 | 85.73 | 75.53 | 11.90 | 66.58 | 64.78 | 2.70 |
| 18 | -1 | 1 | -1 | 1 | 0.01 | 0.08 | 2 | 150 | 68.71 | 72.56 | 5.60 | 76.82 | 81.41 | 5.98 |
| 19 | 0 | 0 | 0 | -1 | 0.03 | 0.05 | 3.5 | 30 | 76.43 | 73.66 | 3.62 | 80.94 | 74.69 | 7.72 |
| 20 | 0 | 0 | 1 | 0 | 0.03 | 0.05 | 5 | 90 | 64.15 | 66.39 | 3.49 | 81.36 | 83.89 | 3.11 |
| 21 | -1 | 1 | 1 | 1 | 0.01 | 0.08 | 5 | 150 | 83.46 | 77.27 | 7.42 | 79.04 | 71.1 | 10.05 |
| 22 | 1 | -1 | 1 | -1 | 0.05 | 0.02 | 5 | 30 | 85.83 | 80.52 | 6.19 | 77.67 | 71.62 | 7.79 |
| 23 | 1 | 0 | 0 | 0 | 0.05 | 0.05 | 3.5 | 90 | 61.48 | 76.20 | 23.94 | 84.50 | 74.87 | 11.40 |
| 24 | 0 | 0 | 0 | 0 | 0.03 | 0.05 | 3.5 | 90 | 80.39 | 75.98 | 5.49 | 75.98 | 79.15 | 4.17 |
| 25 | 0 | 0 | 0 | 0 | 0.03 | 0.05 | 3.5 | 90 | 75.14 | 75.98 | 1.12 | 78.67 | 79.15 | 0.61 |
| 26 | -1 | -1 | -1 | -1 | 0.01 | 0.02 | 2 | 30 | 76.53 | 68.22 | 10.86 | 64.20 | 64.36 | 0.25 |
| 27 | -1 | -1 | -1 | 1 | 0.01 | 0.02 | 2 | 150 | 69.50 | 72.85 | 4.82 | 77.41 | 72.31 | 6.59 |
| 28 | 1 | -1 | -1 | -1 | 0.05 | 0.02 | 2 | 30 | 69.89 | 75.81 | 8.47 | 46.68 | 55.67 | 19.26 |
| 29 | 0 | 0 | 0 | 1 | 0.03 | 0.05 | 3.5 | 150 | 75.93 | 78.29 | 3.11 | 78.67 | 84.43 | 7.32 |
| 30 | 1 | 1 | 1 | 1 | 0.05 | 0.08 | 5 | 150 | 91.77 | 84.87 | 7.52 | 78.67 | 76.95 | 2.19 |
Actual values; x1 = H2O2 concentration (mol/L), x2 = Fe2+ concentration (mol/L), x3 = pH and x4 = Reaction time
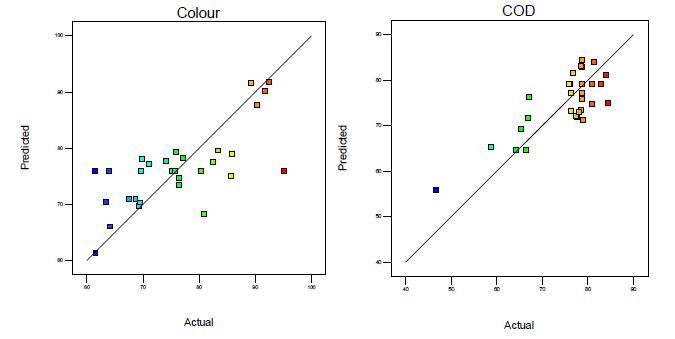
[Figure 2] demonstrates the plots of actual values against predicted values of color and COD removal efficiency attained from the reduced quadratic model via the Fenton oxidation process. It can be signified that the responses from the reduced regression quadratic models for all values indicated well sufficiently complying with visually confirming the conclusion as shown in [Figure 2].
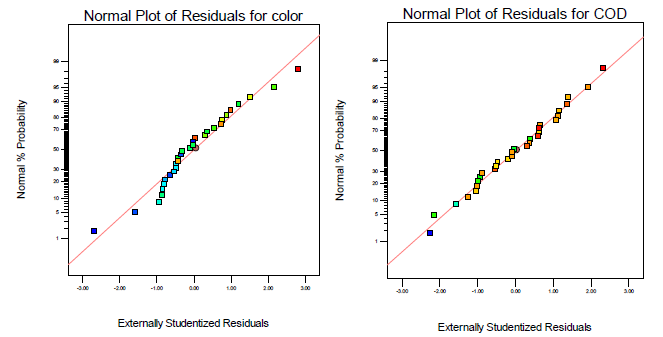
[Figure 3] represents the normal percent probability versus externally studentized plot of the residuals, and it confirmed that there did not show any apparent problems with the normal probability plot. A good relationship between input and output variables could be derived from the reduced quadratic model that was established by forming a normal probability plot of the residuals. The normality assumptions were assured as the residual plot approximated along a straight line [44] for both color and COD respectively, which indicates that the reduced quadratic model is accurate for decision.
Actual versus predicted values for color and COD removal efficiency obtained from the reduced quadratic model for food processing wastewater treatment
Normal percent probability of residuals versus externally studentized residuals plots for color and COD removal efficiency derived from the reduced quadratic model for food processing wastewater treatment
Adequate precision was computed the signal to noise ratio and found that a ratio of color (7.71) and COD (6.71) is greater than 4, indicating an appropriated signal to noise ratio [35]. Hence, this reduced quadratic model could be applied to investigate the design space and to obtain the optimal operating conditions via the Fenton oxidation process. Moreover, model F-value of 2.71 indicates the reduced quadratic model is significant with only a 3.47% chance that an F-value this large could occur due to noise as shown in [Table 5] for the color. While COD, the model F-value of 2.46 suggests, the reduced quadratic model is significant with 4.39% chance that an F-value this large could occur due to noise. These results confirmed that the reduced quadratic models had enough precision for the removal of acetic acid via the Fenton oxidation process using RSM. Also, p-value Probe>F of the models showed less than 0.0500 for both color (0.0347) and COD (0.0439), indicating the models present the statistical significance. As the results. It can be seen that the classified reduced quadratic models were applied to display the response surface in three-dimensional (3D) plots and to assess the optimal operating conditions for color and COD removal efficiency via the Fenton oxidation process.
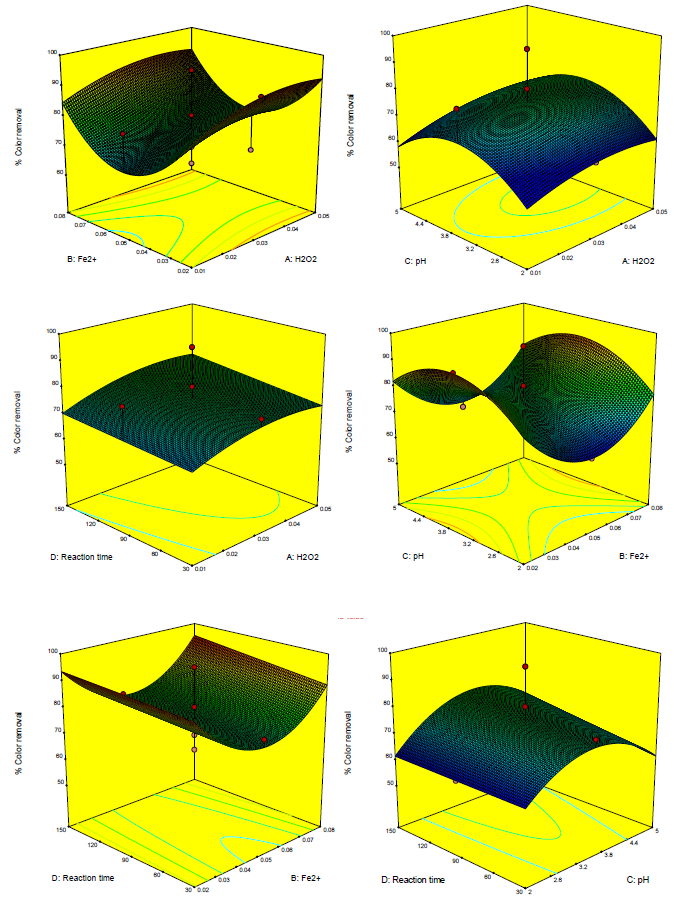
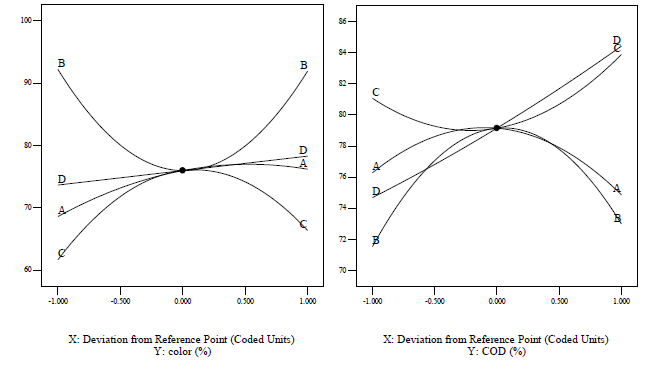
[Figures 4] and [5] illustrate that the reduced quadratic model predicted color and COD efficiency through the Fenton oxidation process. A comparison of the effects of all variable factors at the optimal operating conditions in terms of percent range for color and COD removal efficiency via Fenton oxidation process was achieved by using the perturbation plots as shown in [Figure 6]. However, the steep curvature of Fe2+ (B) concentration dose demonstrated the color removal efficiency. On the other hand, pH (C) and reaction time (D) illustrated the COD removal efficiency was extremely affected by those variables, which are clearly shown in [Figures 4] and [5] with the results previously discussed.
3D, color removal efficiency plot of Fe2+ vs. H2O2, pH vs. H2O2, Reaction time vs. H2O2, pH vs. Fe2+, Reaction time vs. Fe2+ and Reaction time vs. pH for food processing wastewater treatment
3D, COD removal efficiency plot of Fe2+ vs. H2O2, pH vs. H2O2, Reaction time vs. H2O2, pH vs. Fe2+, Reaction time vs. Fe2+ and Reaction time vs. pH for food processing wastewater treatment
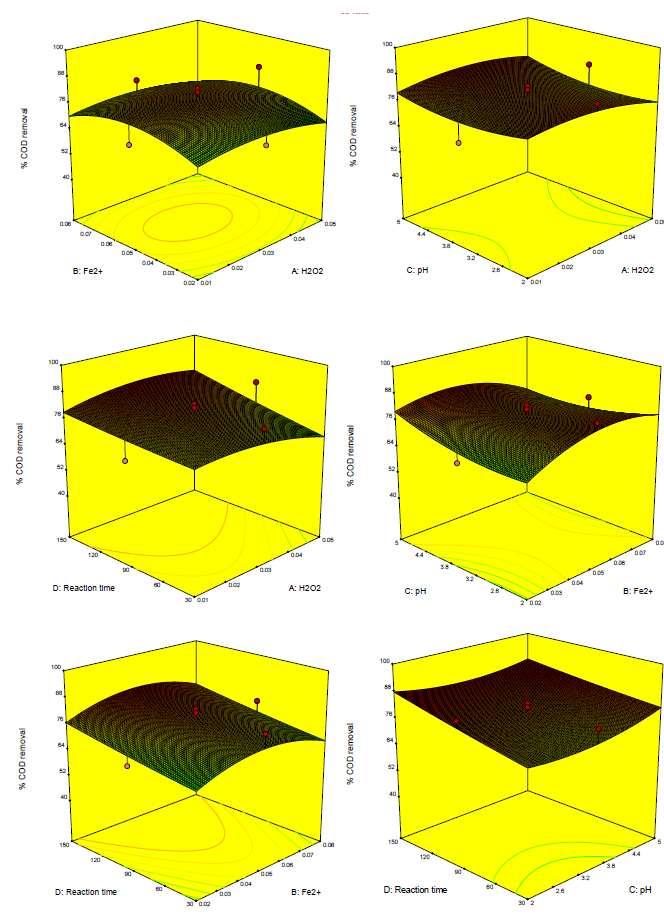
Perturbation plot of color and COD removal efficiency via Fenton process at the optimal conditions: H2O2 = 0.03 mol/L (A), Fe2+ = 0.05 mol/L (B), pH = 3.5 (C) and reaction time 90 min (D) for food processing wastewater treatment
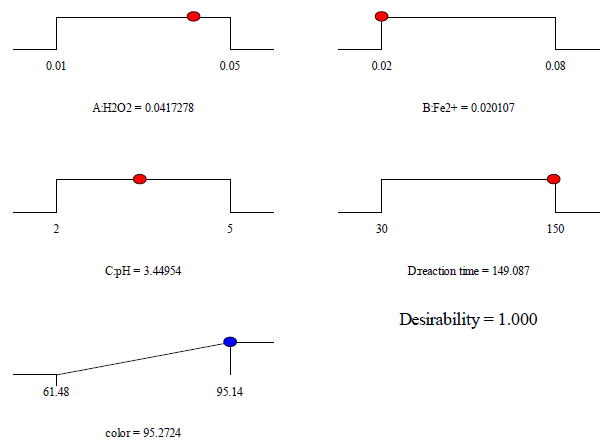
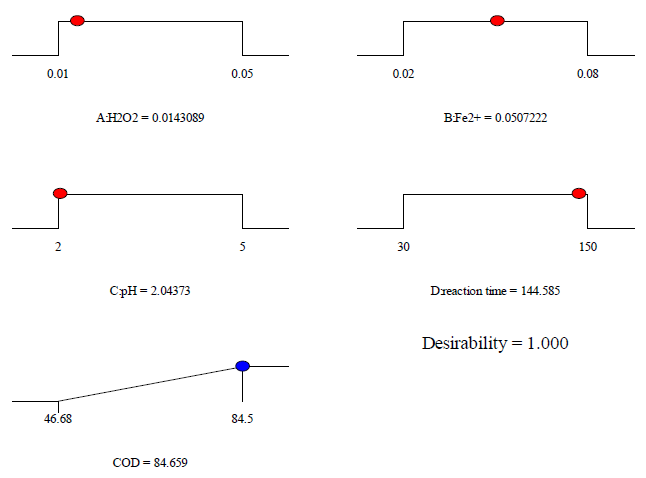
The optimization of the variable operating parameters for treated acetic acid during Fenton oxidation process was achieved with the target of desirability the highest removal efficiency for color and COD. Hence, various operational conditions were computed by using the design of the experiment software tool in covering the range of study. Obtaining the maximum percent removal efficiency was established following the desirable goals and the variable parameters of H2O2 concentration, Fe2+ concentration, initial pH, and reaction time as within the range. The desirability functions/ramps (d) were chosen to consider the various optimum conditions for the Fenton oxidation process, where the d value was set equal to 1.0. The numerical functional analysis and optimization examined that the maximum target percent removal 95.2 % for color could be obtained at H2O2 concentration of 0.004 mol/L, Fe2+ ions concentration of 0.02 mol/L, initial pH of 3.45, and reaction time of 149.08 min as shown in [Figure 7]. While, COD had a maximum target percent removal of around 84.7 % that could be obtained at H2O2 concentration of 0.014 mol/L, Fe2+ concentration of 0.051 mol/L, initial pH of 2.04, and reaction time of 144.58 min as shown in [Figure 8].
It can be concluded that Hydroxyl radicals (HO•) are an important role of reactive species, which might be the reactive species produced by the reaction of mixed Fe2+ or Fe3+ and H2O2 in water. Which it depends on the mentioned conditions as above from the viewpoint of the removal efficiency. Eq. (18) shows the mechanism of Fenton-like reaction (Fe2+:H2O2) at very slow of diffusion-controlled reaction rates (k = 0.001-0.01 M−1 s−1) [47] exists that a few short-chain carboxylic acids (-COOH) are the major by-products (originating from acetic acid) decomposition during the treatment process at a certain level of pH and reaction time:
(18)
The significance of this study remarked that the COD 84.7% and color 95.2% removal efficiency were almost higher than of these literatures [45], [46] and similar to this research [37] as compared to triplicated runs via the Fenton process at the laboratory level.
To confirm the agreement of the reduced quadratic model and experimental results achieved, the optimum condition agreement was examined with the experimental data and found the highest percent removal of color and COD obtained. These results were achieved close to those estimated by using the reduced quadratic models as shown in eq. (16) and eq. (17). It can be concluded that using RSM module in the design of expert was appropriate for optimizing the operational conditions for color and COD removal through Fenton oxidation process.
Desirability ramps of the Fenton oxidation process at the maximum of color removal efficiency for food processing wastewater treatment
Desirability ramps of the Fenton oxidation process at the maximum of COD removal efficiency for food processing wastewater treatment
Response Surface Methodology is a mathematical method and statistics that are useful in creating trials and analyze problems, which shows the response to results from various variables to find the point or appropriateness to that result. Response surface modeling is used to create a significant problem for optimizing the levels and is also a time-taking process of varying a large number of operating variables.
RSM was successfully achieved to optimize the removal of acetic acid via Fenton oxidation process by using color and COD as a surrogate parameter. The optimum of variable operating conditions to have the maximum target of color removal 95.2 % could be obtained at H2O2 concentration of 0.004 mol/L, Fe2+ concentration of 0.02 mol/L, initial pH of 3.45, and reaction time of 149.08 min. COD had a maximum of around 84.7 % removal efficiency that could be obtained at H2O2 concentration of 0.014 mol/L, Fe2+ concentration of 0.051 mol/L, initial pH of 2.04, and reaction time of 144.58 min. Also, RSM was achieved in predicting the absolute concentration of ferrous sulfate added in the process to avoid/reduce corrosion in the system for the long run.
These findings showed that the Fenton oxidation process, at a certain level, may be used as a useful and alternative technology for pre and post-treatment of wastewater from food processing, especially preserving fruits and vegetables industry before final discharge into a nearby water body. This process is also readily available, low cost, and hence reducing acetic acid as loaded organics.
The authors would like to thanks, acknowledge and express gratitude to the Faculty of Public Health, Burapha University, Faculty of Engineering, Mahasarakham University, and School of Energy and Environment, University of Phayao for their research funds in carrying us out with an opportunity to pursue this research work. This research is also financially supported by Mahasarakham University (Fast Track 2021).
- ,
Drought: Economic costs and research implications ,Drought Frontiers in Rice ,pp 3-17 , , https://doi.org/https://doi.org/10.1142/9789814280013_0001 - ,
Extreme drought threatens Thailand’s political stability , 2016https://actionforclimate.deqp.go.th/?p=6243&lang=en - ,
Improving drought tolerance in rainfed lowland rice: An example from Thailand ,Agricultural Water Management , Vol. 80 (1),pp 225-240 , 2006, https://doi.org/https://doi.org/10.1016/j.agwat.2005.07.015 - ,
Impact assessment of climate change on groundwater and vulnerability to drought of areas in Eastern Thailand ,Environmental Earth Sciences , Vol. 75 (1),pp 42 , 2015, https://doi.org/https://doi.org/10.1007/s12665-015-4896-3 - ,
Wastewater reuse in Europe ,Desalination , Vol. 187 (1),pp 89-101 , 2006, https://doi.org/https://doi.org/10.1016/j.desal.2005.04.070 - ,
Agricultural reuse of wastewater and global water management ,Water Science and Technology , Vol. 40 (4),pp 339-346 , 1999, https://doi.org/https://doi.org/10.1016/S0273-1223(99)00516-8 - ,
Spirulina sp. production in brine wastewater from pickle factory ,Proceedings of the International Conference on Bioscience, Biochemistry and Bioinformatics ,pp 415-418 , 2011 - ,
Removal of acetic acid from aqueous solutions containing succinic acid and acetic acid by tri-n-octylamine ,Separation and Purification Technology , Vol. 42 (2),pp 151-157 , 2005, https://doi.org/https://doi.org/10.1016/j.seppur.2004.03.015 - ,
Acetic acid production and purification: critical review towards process intensification ,Separation & Purification Reviews , Vol. 46 (1),pp 44-61 , 2017, https://doi.org/https://doi.org/10.1080/15422119.2016.1185017 - ,
Importance of acetic acid bacteria in food industry ,Food control , Vol. 22 (5),pp 647-656 , 2011, https://doi.org/https://doi.org/10.1016/j.foodcont.2010.11.008 - ,
Structural analysis of fructans produced by acetic acid bacteria reveals a relation to hydrocolloid function, Carbohydrate polymers , Vol. 92 (2),pp 1234-1242 , 2013, https://doi.org/https://doi.org/10.1016/j.carbpol.2012.10.054 - , , Acetic Acid Bacteria, 2017
- ,
Role of acetic acid irrigation in medical management of chronic suppurative otitis media: a comparative study ,Indian Journal of Otolaryngology and Head & Neck Surgery , Vol. 67 (3),pp 314-318 , 2015, https://doi.org/https://doi.org/10.1007/s12070-014-0815-2 - ,
Acute effects of exposure to vapours of acetic acid in humans ,Toxicology Letters , Vol. 165 (1),pp 22-30 , 2006, https://doi.org/https://doi.org/10.1016/j.toxlet.2006.01.010 - , , An Introduction to Environmental Chemistry, 2013
- ,
Production of succinic acid by bacterial fermentation ,Enzyme and Microbial Technology , Vol. 39 (3),pp 352-361 , 2006, https://doi.org/https://doi.org/10.1016/j.enzmictec.2005.11.043 - ,
Cronobacter spp. – opportunistic food-borne pathogens. A review of their virulence and environmental-adaptive traits ,Journal of Medical Microbiology , Vol. 63 (8),pp 1023-1037 , 2014, https://doi.org/https://doi.org/10.1099/jmm.0.073742-0 - ,
Recovery of acetic acid from simulated acetaldehyde wastewaters: Bipolar membrane electrodialysis processes and membrane selection ,Journal of membrane science , Vol. 379 (1-2),pp 184-190 , 2011, https://doi.org/https://doi.org/10.1016/j.memsci.2011.05.059 - ,
Effects of osmotic pressure, acid, or cold stresses on antibiotic susceptibility of Listeria monocytogenes ,Food microbiology , Vol. 46 ,pp 154-160 , 2015, https://doi.org/https://doi.org/10.1016/j.fm.2014.07.015 - ,
Alkaline treatment for detoxification of acetic acid-rich pyrolytic bio-oil for microalgae fermentation: effects of alkaline species and the detoxification mechanisms ,Biomass and Bioenergy , Vol. 80 ,pp 203-212 , 2015, https://doi.org/https://doi.org/10.1016/j.biombioe.2015.05.007 - ,
A novel approach for itaconic acid extraction: Mixture of trioctylamine and tridodecylamine in different diluents ,Journal of Industrial and Engineering Chemistry , Vol. 18 (5),pp 1705-1709 , 2012, https://doi.org/https://doi.org/10.1016/j.jiec.2012.03.010 - ,
Nemestóthy, Nándor, Microbial electrohydrogenesis linked to dark fermentation as integrated application for enhanced biohydrogen production: A review on process characteristics, experiences and lessons ,Bioresource Technology , Vol. 251 ,pp 381-389 , 2018, https://doi.org/https://doi.org/10.1016/j.biortech.2017.12.064 - ,
Kinetic study of the effect of carrier and stripping agent concentrations on the facilitated transport of cobalt through bulk liquid membranes ,Desalination , Vol. 184 (1),pp 79-87 , 2005, https://doi.org/https://doi.org/10.1016/j.desal.2005.03.067 - ,
Removal of acetic acid from aqueous solutions using bulk ionic liquid membranes: A transport and experimental design study ,Separation and Purification Technology , Vol. 224 ,pp 51-61 , 2019, https://doi.org/https://doi.org/10.1016/j.seppur.2019.05.001 - ,
Synthesis and characterization of magnetic bio-adsorbent developed from Aegle marmelos leaves for removal of As(V) from aqueous solutions ,Environmental Science and Pollution Research , Vol. 26 ,pp 946-958 , 2019, https://doi.org/https://doi.org/10.1007/s11356-018-3643-1 - ,
Cigarette soot activated carbon modified with Fe3O4 nanoparticles as an effective adsorbent for As(III) and As(V): Material preparation, characterization and adsorption mechanism study ,Journal of Molecular Liquids , Vol. 243 ,pp 395-405 , 2017, https://doi.org/https://doi.org/10.1016/j.molliq.2017.08.055 - ,
Modified Thorium Oxide Polyaniline Core–Shell Nanocomposite and Its Application for the Efficient Removal of Cr(VI) ,Journal of Chemical & Engineering Data , Vol. 64 (3),pp 1294-1304 , 2019, https://doi.org/https://doi.org/10.1021/acs.jced.8b01225 - ,
Facile synthesis of poly o-toluidine modified lanthanum phosphate nanocomposite as a superior adsorbent for selective fluoride removal: A mechanistic and kinetic study ,Chemosphere , Vol. 252 (126551), 2020, https://doi.org/https://doi.org/10.1016/j.chemosphere.2020.126551 - ,
Synthesis of thorium-ethanolamine nanocomposite by the co-precipitation method and its application for Cr(vi) removal ,New Journal of Chemistry , Vol. 42 (7),pp 5556-5569 , 2018, https://doi.org/https://doi.org/10.1039/c7nj05074g - ,
Kendu (Diospyros melanoxylon Roxb) fruit peel activated carbon—an efficient bioadsorbent for methylene blue dye: equilibrium, kinetic, and thermodynamic study ,Environmental Science Pollution Research , Vol. 27 ,pp 22579–22592 , 2020, https://doi.org/https://doi.org/10.1007/s11356-020-08561-2 - ,
Adsorption of methylene blue on chemically modified lychee seed biochar: Dynamic, equilibrium, and thermodynamic study ,Journal of Molecular Liquids , Vol. 315 (113743), 2020, https://doi.org/https://doi.org/10.1016/j.molliq.2020.113743 - ,
Use of selected advanced oxidation processes (AOPs) for wastewater treatment–a mini review ,Global NEST journal , Vol. 10 (3),pp 376-385 , 2008 - ,
Advanced oxidation processes (AOPs) in wastewater treatment ,Current Pollution Reports , Vol. 1 (3),pp 167-176 , 2015, https://doi.org/https://doi.org/10.1007/s40726-015-0015-z - ,
Photocatalytic oxidation process using synthesized TiO2 in PLA/PBAT/PBS composite film for VOCs degradation ,The 51st Asia-Pacific Academic Consortium for Public Health Conference , Vol. 51 ,pp 20-22 , 2019 - , Application of photocatalytic oxidation process using modified TiO2/PBS biocomposite film for dye removal, IOP Conference Series: Earth and Environmental Science, 2020
- ,
The chemistry of water treatment processes involving ozone, hydrogen peroxide and ultraviolet radiation ,Ozone: Science & Engineering , Vol. 9 (4),pp 335-352 , 1987, https://doi.org/https://doi.org/10.1080/01919518708552148 - ,
Application of CCD in RSM to obtain optimize treatment of POME using Fenton oxidation process ,Journal of Water Process Engineering , Vol. 8 ,pp e7-e16 , 2015, https://doi.org/https://doi.org/10.1016/j.jwpe.2014.11.001 - ,
Application of CCD in RSM to obtain optimize treatment of recalcitrant acetic acid in wastewater from food industry using Fenton oxidation process ,1st Asia Pacific Conference on Sustainable Development of Energy Water and Environment Systems ,pp 57 ,pp 6-9 , 2020 - ,
The role of inorganic carbon limitation in biological nitrogen removal of extremely ammonia concentrated wastewater ,Water research , Vol. 37 (5),pp 1100-1110 , 2003, https://doi.org/https://doi.org/10.1016/S0043-1354(02)00440-2 - ,
A comparative study on the membrane based palm oil mill effluent (POME) treatment plant ,Journal of hazardous materials , Vol. 171 (1-3),pp 166-174 , 2009, https://doi.org/https://doi.org/10.1016/j.jhazmat.2009.05.114 - ,
Advanced oxidation processes–current status and prospects ,Proc. Estonian Acad. Sci. Chem , Vol. 50 (2),pp 59-80 , 2001 - ,
Application of mesoporous magnetic nanosorbent developed from macadamia nut shell residues for the removal of recalcitrant melanoidin and its fractions ,Separation Science and Technology , Vol. 55 (9),pp 1636-1649 , 2019, https://doi.org/https://doi.org/10.1080/01496395.2019.1606 - , , Fundamentals of Momentum, Heat, and Mass Transfer, 2014
- ,
Predictability by Box-Behnken model for carbaryl adsorption by soils of Indian origin ,Journal of Environmental Science and Health, Part B , Vol. 48 (8),pp 626-636 , 2013, https://doi.org/https://doi.org/10.1080/03601234.2013.77728 - ,
Tertiary treatment of palm oil mill effluent using Fenton oxidation ,Malaysian. Journal of Civil Engimeering , Vol. 20 (1),pp 12-25 , 2008, https://doi.org/https://doi.org/10.11113/mjce.v20n1.203 - ,
Effects of reaction conditions on the oxidation Efficiency in the Fenton process ,Water Research , Vol. 34 (10),pp pp 2786-2790 , 2000, https://doi.org/https://doi.org/10.1016/S0043-1354(99)00388-7 - ,
A Comparative study of Fenton and Fenton-like reaction kinetics in decolourisation of wastewater ,Dyes and Pigments , Vol. 76 (3),pp 714-720 , 2008, https://doi.org/https://doi.org/10.1016/j.dyepig.2007.01.012