


Both academic literature and case studies point out the benefits of decentralized solutions for electricity generation (DER), including decongestion of the macrogrid [1] and improvements in reliability [2], resilience and power quality [3]. DER solutions such as microgrids (MGs) can be delivered using any combination of energy sources, but they can play a key role in the integration of renewable energy sources (RES) [4], which is why they are becoming particularly interesting in the development of new energy policies towards climate change mitigation [5], and in the conversations on smart cities [6], in particular at the level of the European Union (EU) [7].
In the case of the EU, current policies recognize the key role of the retail energy market and of the individual consumers towards the energy transition, acknowledging how consumers can transition to ‘prosumers’ by using small-scale electricity generators such as photovoltaic (PV) panels, complemented or not by electricity storage systems (ESS) such as batteries [8]. Batteries play a supporting role for PV electricity generation [9], in that they enable peak shaving and help flatten the ‘duck curve’. One step further, sharing common batteries within MGs seems to have benefits in for resilience and power quality [9], but also for economic performance of the MG project [10].
Seeing how the trend is for the ESS and PV panels [11] to become cheaper, while at the same time delivering better technological performance, surrounded by an encouraging policy climate with increased social acceptance, it is relevant to take into account a scenario in which MGs based on shared PV panels and batteries are well represented in the European cities of the future.
Realizing such a scenario requires a positive assessment of the project’s investment cost – as the decision to transition to RES has been shown to be driven by economic considerations [8]. Previous research shows that residential MGs with PV panels and batteries bring substantial savings compared to the alternative in which only electricity from the grid is consumed [12], confirming forecasts in competitiveness [13].
However, a MG project with PV panels and batteries incurs higher costs (and, therefore, lower savings) than the same MG project without batteries. Including a battery in the MG project involves additional investment costs which are still relatively high. In addition, battery self-discharge, ageing and converter inefficiency incur losses of energy which could otherwise be consumed or exchanged with the main grid, leading to lost revenue for the MG equipped with a battery [14].
In this work, the position of an investor is considered (cooperative of prosumers, private company, etc.), who recognizes the potential for savings brought by PV panels and is interested in building a residential microgrid. However, unless coerced or supported, the investor will likely not include a battery in the project, since that would be only the second-best option.
This work looks at ways to reconcile the interest of the investor with the projections of policy makers, in order to retain the benefits of using batteries. Electricity pricing is looked at as the primary mechanism through which the economic viability of PV+battery systems can be influenced. In other words, this work looks at the economic viability of a PV-alone system and that of a PV+battery MG system, and asks ‘under which pricing scenario is the gap between the two minimal?’
Previous academic work has been found to have largely examined the impact of various policies on one case study, or the impact of one policy on various situations (as outlined in the Literature review). The novelty of this work lies in the comparison between several tariff designs in several case studies in Europe, which enables a judgement as to whether certain policies prove to be generally more beneficial towards the inclusion of batteries, or whether their benefits are limited to local conditions.
The economic viability of battery storage of photovoltaic electricity at the prosumer level seems to be a nuanced question, as suggested by the multitude of academic papers examining it from different angles. The relevant research can be broadly assigned into the following streams.
At the individual prosumer level. Findings are rather discouraging with respect to the economic viability of batteries added to PV units. Studies find that there is either no economic benefit of integrating ESS with PV at a household level in the UK [15] and Ireland [16], or it can only succeed for relatively small storage size [17], a low price of batteries [18] in Germany, but with optimistic prospect under assumptions of higher retail electricity prices [19]. These results are contradicted by an analysis for Cyprus, which finds that the addition of batteries is beneficial especially to large and medium prosumers [20]. In Portugal, demand response has been found to have better impact on the system’s economic performance, than batteries [21]. A comparative study in nine EU countries concludes that home battery profitability depends on subsidies and must rely on long term scenarios with significantly lower battery prices [22], whereas a case study conducted in the Netherlands comparing individual against shared storage solutions finds both options unattractive for end-consumers, but points to environmental and social benefits of the centralized storage [23].
At the microgrid level. Studies investigate the drivers of economic viability, which in turn fall into two categories:
-
Viability depends on technical specifications: the size of the MG (number of households, HHs), the sizing of the equipment (how many kWh storage per kW installed) and the technological performance of the ESS (e.g. the use of lead-acid or Li-Ion batteries). An appropriate technical set-up is essential, as found by techno-economic assessments in Germany [24] and Finland . However, this question is outside the scope of this study, and it is worth noting that it is difficult to propose a “recipe” for a technology configuration that guarantees economic viability of the project, given the uncertainty and variation of external factors (e.g. price of electricity, technology change). Notably, the sizing of the ESS can be optimized with regard to the size of the other components [25], as well as to the electricity tariff structure [26], and the energy management strategy [27], so as to yield optimum economic viability. This resonates with the findings of review articles which show mixed results on the profitability of smart grids overall [28].
-
Viability depends on economic conditions: e.g. tariff design and the price of electricity on the main grid.
This paper outlines the contribution to the latter category (2.b), and this is also what determines the scope of the work in this article.
In the EU there are a number of policy mechanisms supporting RES. Direct support schemes ([29]) can cover equipment costs [30], stimulate the production of renewable energy through green certificates (quantity-based) or reward the adoption of RES through advantageous pricing such as the net-metering or feed-in tariff (price-based). EU-level policies are summarized in the RES-legal online resource [31], and discussed in academic literature [32]. The price-based schemes are the most widespread mechanism across the EU [33], and they can have up to three components: purely volumetric (€/ kWh), capacity tariff (€/ kW), and a stand-by charge component [34]. Volumetric pricing is the conventional mechanism in which kWh of electricity are bought and sold between the grid and passive consumers; the other two components originate from the problem (as pointed out by network operators) that the prosumer model requires additional services [35], and the volumetric pricing alone would not reflect that mismatch [36], making the decentralized system a bearer of hidden costs to the distribution network [37].
Among the volumetric schemes, the net-metering scheme (NM) is found to be beneficial for the increased adoption of rooftop PV both in specific case studies in EU countries [38], and in a demonstrable general comparison with the Feed-in Tariff [39]. However, NM but offers the least favourable conditions for the use of batteries along with PV units [40]. Feed-in Tariffs (FiT), particularly often used in the EU countries [41], have been shown to have had a direct positive impact on the increased use of PV units across the EU [42], with two representative designs being successfully implemented in Germany [43] and in the UK [44]. The success of the FiT contributes to their higher geographic dispersion of rooftop PV units – but is was also found to be susceptible to regulatory errors [45]. FiT have also been found to be beneficial to small-scale players and stimulate technological diversity [46]. However, the interaction between the Feed-in Tariff policy and the viability of batteries does not emerge clearly from the literature.
The Time-of-Use pricing mechanism (ToU) is a dynamic pricing mechanism based on the conventional residential load profile that has its peak consumption daily in the evening, and a comparatively very low consumption at night. Under ToU, the kWh of electricity is more expensive during peak hours and cheaper during the off-peak hours, which is designed to encourage peak shaving. Variations of ToU are currently being applied across EU countries [31], but a literature review was not able to offer a coherent insight regarding the interaction between ToU and batteries.
As for capacity tariffs, academic research seems to concur that a combination of volumetric and capacity components should be considered for the benefit of end-customers and network operators alike, as suggested by evidence from the Netherlands [47], Germany [48], and Spain [49]. While the FiT is not designed to promote storage, but rather production, adding a capacity component to the FiT can support storage [50], and in general the capacity-based support schemes alleviate the impact of renewables on electricity prices [51]. Moreover, the right combination between volumetric and capacity components would help integrate DER [52] while also promoting a wider adoption of battery storage [53]. In fact, the adoption of batteries would in turn minimize the energy exchange instead of the energy cost in microgrids, which has been shown to have advantages [54]. A Norwegian case study points to the economic viability of batteries added to PV systems, assuming power supply limits [55].
Note that the notion of “capacity tariffs” refers to an additional component of the electricity bill, in which consumption is paid per kW delivered, in addition to the kWh consumed – as detailed in the Tariff design subsection below. However, for these simulations a particular capacity tariff was used (also detailed in the Tariff design subsection), and this particular case is what this article refers to when using the abbreviation “CT”.
The research question is addressed in two steps. First, the problem is documented by assessing the impact on costs incurred by the inclusion of a battery into a MG under different policy scenarios (electricity pricing schemes). Second, similar MG systems in seven settings across the EU are compared, and they are simulated them under the same pricing mechanisms. In order to do that, construct seven case studies of MGs are constructed with similar technical specifications, placed in Belgium (BE), Greece (GR), Italy (IT), Denmark (DK), Finland (FI), Germany (DE) and Spain (ES). Then, the Net Present Cost (NPC) of each investment is calculated under various tariff designs: volumetric (static: net-metering, feed-in-tariff; dynamic: time-of-use), and a combination of volumetric and two types of capacity tariff, as detailed below. In each scenario the two values are compared: the NPC of the MG with a battery ( ) to that of a PV-only system ( ) under the same tariff design. The difference between the two ( , eq. (2)) is then assessed under the various scenarios and the results are discussed.
Note that in this study the system without a battery unit is still a MG, since the households share one meter and one point of connection to the main grid (as opposed to individual connections and meters).
A series of seven simulations has been set up using the HOMER software [56]. The case studies, originally based on real-life experiments, simulate similar MGs in Belgium, Greece, Italy, Denmark, Finland, Germany and Spain. Each case study includes 8 households (HHs), a PV unit sized to ensure an autonomy of an average of 70% (PV production divided by total consumption), to which a battery was added, sized to ensure an average of 20% reliability (battery output divided by total consumption). The equipment pieces have identical features (i.e. Li-Ion batteries with 86% roundtrip efficiency at minimum state of charge of 20%), and the purchase price of the PV units is set to be identical across case studies, at 450 €/kW installed, as well as the battery price at 200 €/kWh installed [57], excl. VAT; for the battery, 2 further replacements during the 25-year project lifetime are foreseen. The MG is connected to the main grid.
While the technical specifications ensure comparability, these case studies reflect the local conditions from the geographic point of view (solar resource and temperature, as per HOMER software access to NASA database), country-specific electricity consumption data, as well as local levels of electricity prices, inflation rate and taxation. All simulations consider a 5% discount rate.
In particular it should be noted that in present simulations a taxation model was used, based on the Belgian example, in which a so-called “prosumer tariff” is paid for PV units per kW installed [58]. In other countries there are different expenses associated with the PV units: local taxes for improved real estate (Italy), for self-consumption (Denmark), or mixed calculations with a fixed and a variable element (Spain). Those expenses have been applied to the simulations and recalculated as a fixed sum per kW installed (see Table 1), which is also the standard way of including taxes in the calculations as required by the software [56]. The sources for understanding and calculating the taxation levels are provided in Table 1.
Table 1 also draws the attention to drivers that dictate the sizing of the microgrid. On the one hand, while Belgium and Greece do have a comparable total load, the difference in solar resource available geographically means that for the same requirements, the Belgian system needs 16 kW of PV panels installed, as compared to only 9.4 kW in Greece. On the other hand, the household consumption plays an equally important role: the difference in total load between Germany and Spain shows that, even with richer solar resource, the Spanish system requires 16 kW of PV installed, double the required capacity in Germany (solar resource often comes with a negative temperature effect). It is also relevant to note that the alignment between the timing of the peak load and the PV electricity production have also influenced the design of the systems. The sizing of the PV unit in turn determines the sizing of the battery, as well as the level of yearly taxes.
Summary of the case studies
|
BE |
GR |
IT |
DK |
FI |
DE |
ES |
|
|
Installed PV capacity (kW) |
16 |
9.4 |
6.1 |
19.3 |
47.5 |
8 |
16 |
|
Total load of the 8 HHs (kWh/y) [59] |
30,976 |
30,064 |
19,456 |
31,024 |
64,328 |
24,632 |
31,552 |
|
Installed battery capacity (kWh) |
50 |
30 |
36 |
42 |
96 |
24 |
48 |
|
Price of electricity (€/ kWh) [60] |
0.28 |
0.19 |
0.21 |
0.305 |
0.158 |
0.305 |
0.23 |
|
Tax (-equivalent) (€/ kWp/ year) [31] |
92.35 [58] |
64.57 [61] |
26.68 [64] |
11.42 [65] |
55.39 [66] |
20.79 [67] |
The installed battery capacity given in Table 1 refers to the capacity serving all HHs.
The are calculated in the seven case studies under the tariff designs summarized in Table 2 and detailed below: volumetric alone, volumetric + CT (capacity tariff as defined for present simulations), and volumetric + Demand Rate (DR), the capacity component that can be simulated with HOMER.
It is important to note here that FiT and CT are inherently opposed policies (one promoting savings, the other promoting PV injection into the grid). Additionally, the CT simulations (as described further below) do admit price arbitrage and are therefore in conflict with the FiT aims – therefore the two combinations, FiT+DR and FiT+CT, have been discarded from the simulation set.
Overview of pricing mechanisms simulated in each of the case studies
|
Volumetric alone |
Volumetric + Capacity Tariff |
Volumetric + Demand Rates |
|
|
Static |
Net-Metering |
Fixed price + CT |
Fixed price + DR |
|
Feed-in Tariff |
- |
- |
|
|
Dynamic |
Time-of-Use |
Time-of-Use + CT |
Time-of-Use + DR |
Volumetric, Net-metering (NM): Sellback price of electricity equals the buying price, , and the main grid acts as a virtual (ideal) battery. Simulations foresee a monthly NM bill.
Volumetric, Feed-in tariff (FiT): Sellback price of electricity is higher than the buying price. Numerical values are based on the values applied today in Germany [68], where
The ToU pricing mechanism has been designed using the hourly steps from the ToU scenario as proposed by previous academic literature [57]: peak hours between 16:00 and 21:59 daily; off-peak hours between 3:00 and 5:59 daily; and an intermediary “shoulder” tariff for the rest of the day. The underlying mechanism resembles net-metering and is denoted as “Fixed Price (FP)”: buying and sellback prices are equal at any time of the day, i.e. , , and . The rationale for using a FP is that during peak hours the electricity is more expensive, which promotes self-consumption and storage – but if there is excess PV electricity that can be sold, it should be remunerated at an equally attractive price, since it is valuable to the other users on the network, whereas a higher sellback price (such as in FiT) would disincentivize self-consumption or storage. Also, using a FP limits the number of variables in the study, while helping to highlight the effects of a dynamic pricing.
The price values for the three time steps have been designed under the constraint that the final electricity bill of non-prosumers be minimally impacted (compared to the flat tariff), as outlined in Eq. 1:
(1)
The coefficients in eq. (1) correspond to the fact that throughout the day there are 3 hours of off-peak, 6 hours of peak and 15 hours of shoulder demand. These values have been used as a weight (6, 3 and 15) in order to ensure equal electricity bills for both participants and non-participants in the MG, due to the assumption that the load profile remains constant over time, with no difference in consumption between participants and non-participants.
Overview of electricity prices in €/kWh and capacity tariffs in €/kW used in the simulations
|
BE |
GR |
IT |
DK |
FI |
DE |
ES |
||
|
NM |
|
0.28 |
0.19 |
0.21 |
0.30 |
0.16 |
0.30 |
0.23 |
|
FiT |
0.38 |
0.26 |
0.29 |
0.41 |
0.21 |
0.41 |
0.31 |
|
|
0.28 |
0.19 |
0.21 |
0.30 |
0.16 |
0.31 |
0.23 |
||
|
ToU |
0.29 |
0.20 |
0.22 |
0.32 |
0.17 |
0.32 |
0.24 |
|
|
0.28 |
0.19 |
0.21 |
0.30 |
0.16 |
0.30 |
0.23 |
||
|
0.25 |
0.17 |
0.19 |
0.27 |
0.14 |
0.27 |
0.21 |
||
|
DR |
0.1872 |
0.13 |
0.143 |
0.204 |
0.1056 |
0.204 |
0.1535 |
|
|
0.0652 |
0.045 |
0.05 |
0.071 |
0.0368 |
0.071 |
0.0534 |
||
|
0.058 |
0.0402 |
0.0442 |
0.0633 |
0.0328 |
0.0632 |
0.0476 |
||
|
CT |
0.0581 |
|||||||
|
0.1872 |
||||||||
The value of is set at the current level of electricity price (see Table 3 as per [60]). The values for have been calculated based on a range of values of [0.85 - 1.15] for , and for of [1 - 2] around the value of , with the additional constraint that . The combination yielding the minimum impact on non-prosumers (found around 1%) was selected as solution (Table 3).
The difference between CT and DR is laid out as follows. DR is the monthly fee charged by the utility on the monthly peak demand, in €/kW/month, as calculated by HOMER with an optimization horizon of one month [56] and set up to avoid price arbitrage (no exchange between battery and grid). The DR fee is added to the monthly electricity bill calculated per kWh.
CT is also a fee incurred atop the volumetric bill, but is incurred on an hourly basis, as opposed to a DR. Two capacity blocks are used, with a low capacity tariff applied to all consumed capacity below the threshold, and a high tariff for all consumed capacity above the threshold. The capacity block tariffs used for the CT simulations allow for price arbitrage (electricity can be exchanged between the battery and the grid), and are designed so as to encourage peak shaving at the prosumer level, therefore the threshold for the capacity block tariff scheme is set at 1.2 times the average hourly load [53]. Since HOMER does not support a tariff scheme like this, the simulations for the CT scenarios were carried out in MatLab, using the method discussed in previous work [53]. Numerical values of capacity prices are taken from previous academic research [48], where they had been set to be neutral towards non-prosumers, with a tariff for the capacity block below the threshold, and , for the block above the threshold.
Both the DR and the CT scenarios have been designed using the hourly steps from the ToU simulations.
The Net Present Cost (NPC) of each project is calculated for a lifetime of 25 years, where NPC (or life-cycle cost) is “the present value of all the costs of installing and operating that component over the project lifetime, minus the present value of all the revenues that it earns over the project lifetime” [56]. For each tariff design the two values calculated and compared: the NPC of using the PV unit alone (connected to the main grid), , and the NPC of using a MG as described in the previous subsections ( . The value of the difference is denoted as D in eq. 2:
D is the disadvantage of the investment option “microgrid including battery” compared to the alternative, which is a “PV-only system”. D is defined as a positive number for clarity, despite it being a value for unrealized savings or losses.
This work is carried out over seven MG set-ups, to which seven pricing mechanisms are applied. A visual representation of this work’s structure corresponds to a 7x7 matrix, as suggested in Table 4.
Looking at Table 4 row-wise, it identifies the impacts of several pricing designs on the behaviour of the MG system in one case study, which are summarized in section “Local findings” and reveal the change of battery behaviour, Battery Output and Energy Sold. Looking at Table 4 column-wise, it indicates impact of one pricing scheme across case studies, which is illuminating as to whether the effects of the pricing mechanism depend or not on the geographical location; these findings are summarized in section “Comparative findings”.
Structuring of results
|
NM |
ToU |
FiT |
FP+DR |
FP+CT |
ToU+DR |
ToU+CT |
|
|
BE |
DBE, NM |
DBE, ToU |
DBE, FiT |
DBE, FP+DR |
DBE, FP+CT |
DBE, ToU+DR |
DBE, ToU+CT |
|
GR |
DGR, NM |
.. |
.. |
.. |
.. |
.. |
.. |
|
IT |
DIT, NM |
.. |
.. |
||||
|
DK |
DDK, NM |
.. |
.. |
||||
|
FI |
DFI, NM |
.. |
.. |
||||
|
DE |
DDE, NM |
.. |
.. |
||||
|
ES |
DES, NM |
.. |
.. |
A unifying visualization on the twofold results is summarized in Figure 3 and discussed as such.
This paper provides insight on two levels. First, it examines the impact of tariff designs on the economic viability of the same investment project (Local findings; Table 4, rows). Second, by comparing those effects across the seven case studies (Comparative findings; Table 4, columns), it provides insights as to whether a given tariff design is generally more or less beneficial towards the inclusion of ESS in MGs, or just under local circumstances.
The scenarios were verified by checking whether different pricing mechanisms do result in a different battery behaviour in the microgrid system, correlated with the energy sold to the grid. As expected, switching from NM to ToU tariff incurs changes in the behaviour of the system, by promoting exchange with the main grid. Two indicators, Battery Output and Energy Sold, are relevant to the system behaviour and correlated with each other.
In the cases of Spain and Italy the changes are substantial: an increase of 112% and 75%, respectively, of the amount of energy sold to the grid, in the volumetric ToU scenario compared to the volumetric NM. Figure 1 exemplifies the difference in behaviour over a three-months period Spain, by zooming in on the daily grid sales and battery output. In Denmark and in Belgium the changes are moderate (6% and 10%, respectively), in Germany insignificant (<1%), and in Finland and Greece, non-existent. The full list with the amounts exchanged and stored in each scenario can be found in .
The link between the change in value of the observed indicators (energy sold to the grid and energy stored) and other indicators such as the size of individual components, the grid price of electricity, or the solar resource given by the latitude, is not trivial. It is, however, likely driven by a combination of technological factors, but the research thereof is outside the scope of this study.
Grid sales (kWh) and Energy content in the battery (kWh) for a microgrid system during the last quarter of a year in Spain, under the three volumetric pricing schemes
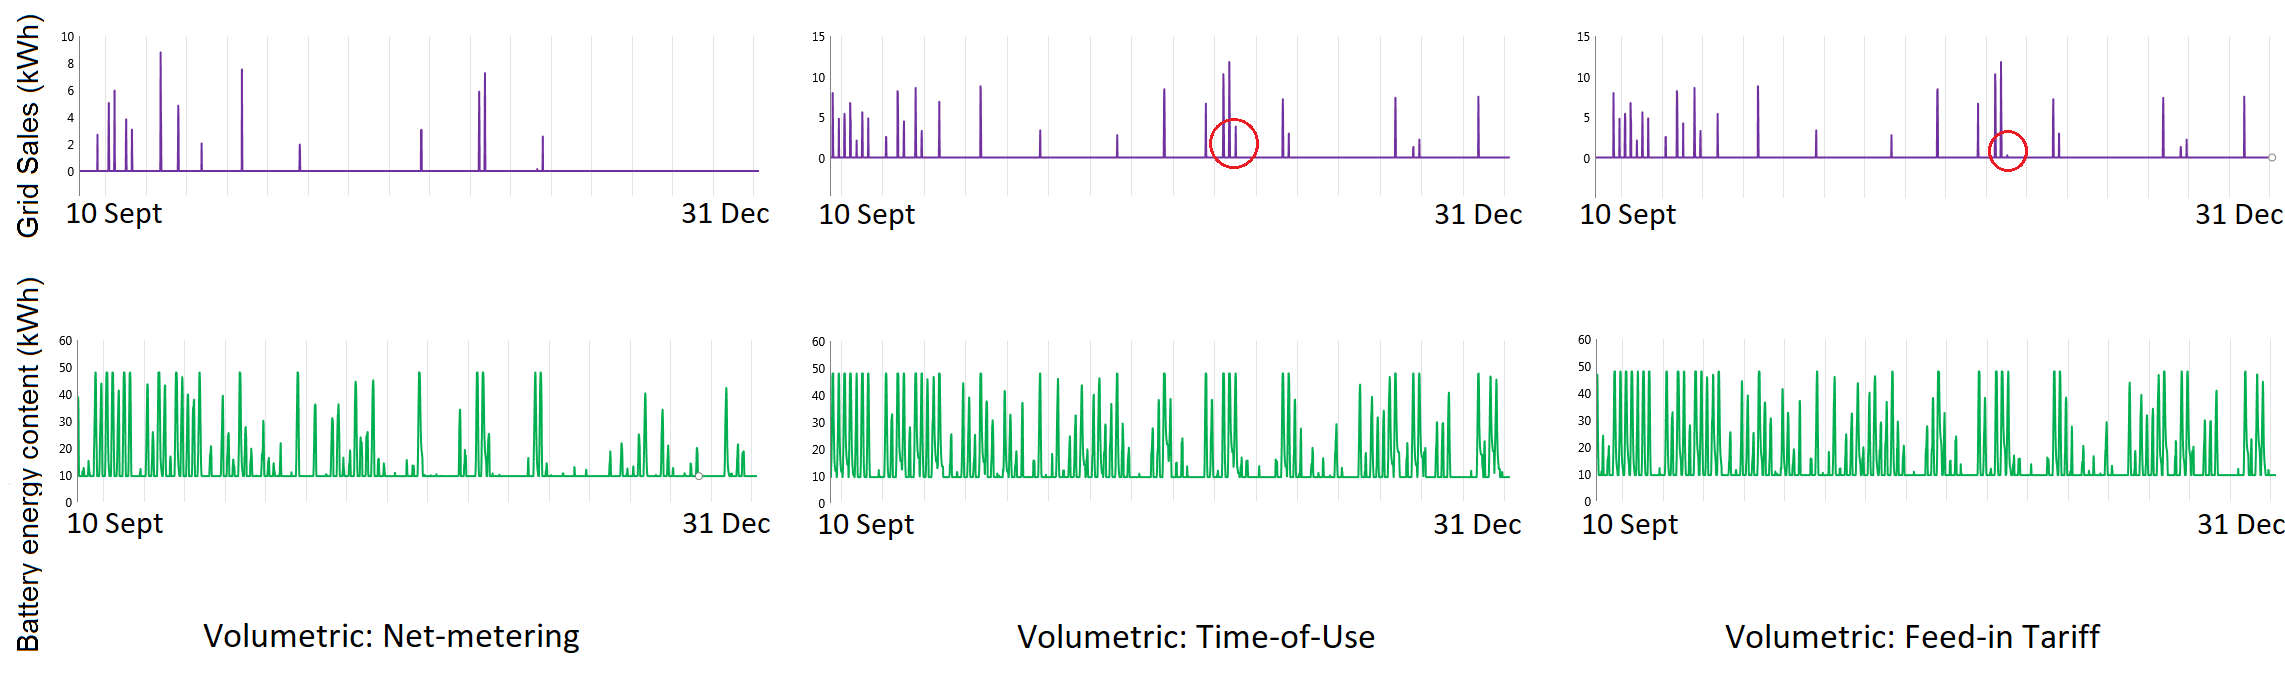
Note that in most cases, under a ToU price policy, the exchange with the grid is promoted and there is less use of battery storage. Figure 1 illustrates the Spanish case study under volumetric schemes. The differences between the FiT and the ToU scenarios are highlighted with a red circle on the respective graphs, and the decision to depict a quarter instead of an entire year is for clarity. Similarly, Figure 2 outlines the effect of DR designs based on the same Spanish example.
Energy sales to the main grid (kWh) and Battery energy content (kWh) for the microgrid system for the last quarter of a year in Spain, with Demand Rates added to the volumetric pricing schemes
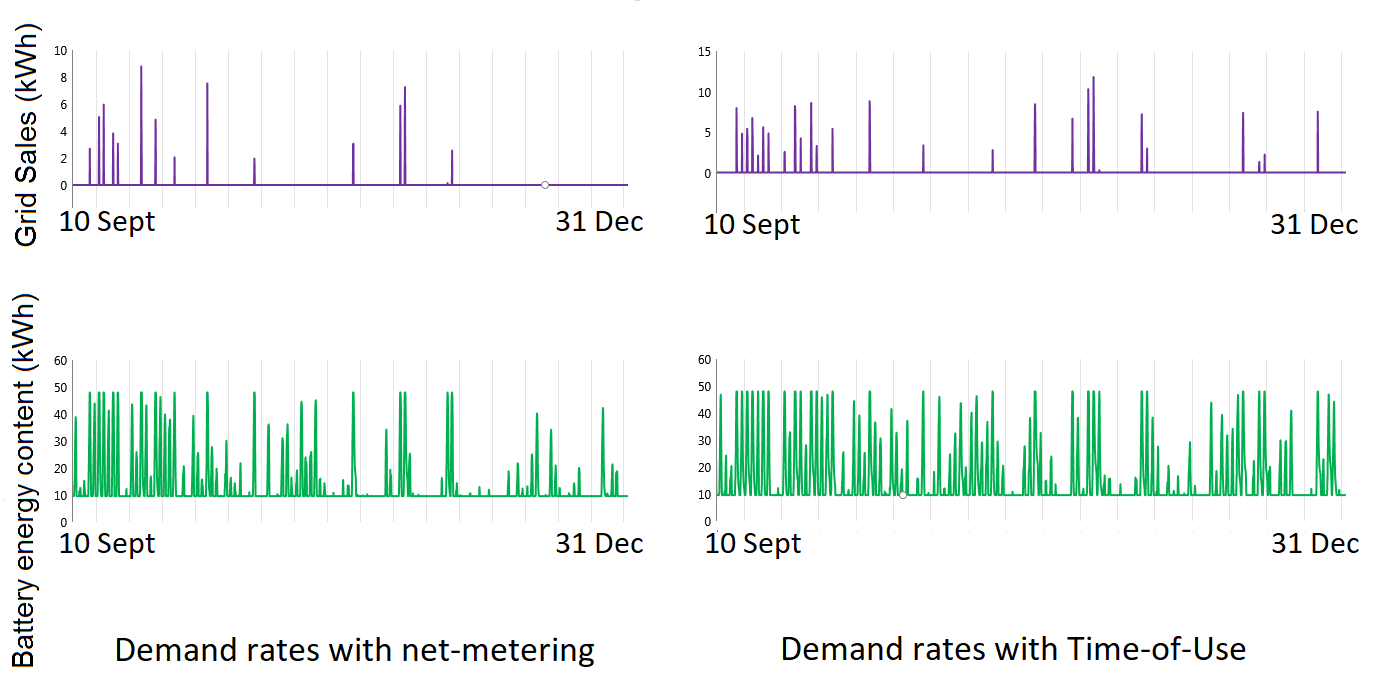
By comparing the graphs in Figure 1 and Figure 2, two basic forms of behaviour are found:
-
The net-metering behaviour: with the addition of a demand rate the system under the net-metering scheme does not find any incentive to change its behaviour. That can be attributed to the constant level of electricity price and to the system set-up which is already optimized for maximum self-consumption (storage before selling) and does not admit price arbitrage.
-
The Time-of-Use Tariff behaviour: in the volumetric scheme, the Time-of-Use mechanism determines a system behaviour different than that of the other two schemes. However, once DR is added, there is a change – namely, there is less exchange with the macrogrid and more self-consumption.
In the Spanish example, for all four scenarios – NM, FiT, NM+DR, NM+CT – the battery takes in 7,286 kWh/year and provides back 6,303 kWh/year (as per 86% roundtrip efficiency), while the energy sold to the grid amounts to 5,181 kWh/year, compared to 13,716 kWh/ year purchased. In other words, whether under NM or FiT, it is the same amount of energy that is being stored, consumed and traded by the system, the difference is only in its distribution over time throughout the year.
As for the Time-of-Use tariff, it is found that the purely volumetric scheme does incentivize more exchange with the grid and less use of the battery: 5,711 kWh/year sold vs. 14,128 kWh/year purchased, along with a battery intake of 6,782 kWh/year and an output of 5,870 kWh/year.
The expected behaviour would be that not only under ToU, but also under the FiT scheme the exchange with the main grid is promoted. The difference in the results comes from the fact that HOMER simulates with two battery dispatch strategies, Load Following (LF) and Cycle Charge (CC), and selects as solution the one yielding lowest NPC. In the FiT scenario CC was selected as a dispatch strategy, while for ToU, the better results were calculated with LF (see [56]). The dispatch strategy was not manually changed for uniformity because the minimization of NPC is, in fact, the objective of this examination.
A visualization of the energy exchange and storage under the CT scenarios does not allow straightforward comparison with the results in Figure 2 and Figure 1 due to the different dispatch strategy (hourly, admitting price arbitrage).
The appeal to an Investor to build a residential microgrid such as the project outlined in the introduction depends however on the comparison with other scenarios. In this case, on whether the investment in a microgrid with PV units and ESS brings gains or savings compared to a PV-only system.
In order to assess the economic viability of a MG with ESS, the NPC of each set-up was calculated, under each of the tariff designs proposed ( ). Then, this value was compared to , which characterizes the investment in a PV-unit alone to serve the same residential load of 8 households. The difference D as per eq. (2) gives the “disadvantage” of the MG scenario, and equals the impact on costs brought by the addition of a battery to a PV unit. Table 5 gives an overview on how the MG projects compare against the PV-only systems in the seven countries, under the various pricing mechanisms. The numbers (positive) represent in fact a financial loss (i.e. an unrealized gain) to the Investor – so the lower values are the results aimed for.
Values from Table 5 indicate first that the Volumetric + CT schemes offer the conditions for which the difference between and is the lowest. Moreover, in most cases it is the ToU+CT scheme that yields the lowest difference. This is to say that impact on the investment cost brought by a ESS is lowest when a ToU with CT is in place in Belgium, Italy, Denmark, Finland and Germany.
Summary of the D values under each pricing design (€), and the total price of ESS (€)
|
Battery price |
Volumetric alone |
Volumetric + CT |
Volumetric + DR |
|||||
|
NM |
ToU |
FiT |
NM |
ToU |
NM |
ToU |
||
|
BE |
30,000 |
38,253 |
28,271 |
31,104 |
25,435 |
24,830 |
29,887 |
29,174 |
|
GR |
18,000 |
22,910 |
22,103 |
22,910 |
14,016 |
14,089 |
22,904 |
22,097 |
|
IT |
21,600 |
24,880 |
26,656 |
27,130 |
19,382 |
18,966 |
24,860 |
26,788 |
|
DK |
25,200 |
32,912 |
31,643 |
32,912 |
20,489 |
19,647 |
32,865 |
31,874 |
|
FI |
57,600 |
65,324 |
64,502 |
65,324 |
39,113 |
38,479 |
65,273 |
64,451 |
|
DE |
14,400 |
21,353 |
20,171 |
21,353 |
12,255 |
11,794 |
21,258 |
20,086 |
|
ES |
28,800 |
35,653 |
35,990 |
37,230 |
21,533 |
21,775 |
35,604 |
36,196 |
Further, note that the difference in impact between the scenarios with Demand Rate is minimal (about 1%). As pointed out in the local findings (see Local findings), for both DR scenarios the system ends up exchanging and storing the same amount of electricity, just distributed differently over time. Therefore, the small difference is due to the demand rates (which are designed to be low) applied at different times.
The column with battery prices serves as a reference: in Denmark for instance, the option including a ESS for 25,200 € has a total disadvantage of 19,647 € compared to the PV-only option – in the best case scenario (ToU+CT), so the battery works partly towards recovering its investment cost.
The full list of and for all case studies under the respective price scenarios can be found in Appendix.
While the results of the simulations are more encouraging under the CT scenarios, it is important to remember that the CT scheme is calculated with an optimization over one hour, which in reality is disadvantageous for PV units without ESS (with no storage possibility, the MG is forced to exchange more with the grid, which is being charged under the CT scheme), while at the same allowing for price arbitrage, which adds an advantage in favour of the ESS. Therefore, the narrow difference comes not so much from an improved MG scenario, but rather from a worse PV-only scenario, as supported by Table 6 in Appendix.
There appears to be a trade-off between conditions favouring PV electricity production and conditions favouring the adoption of ESS. This discussion fits into the broader debate on post grid parity business models for PV electricity: when PV-only scenarios become less attractive due to phasing out of revenue-based business models, the savings-based business models automatically become more attractive (see [69]). In other words, as long as the exchange with the main grid is being stimulated, electricity storage is less competitive.
The values in Table 5 can be reinterpreted in a light more favourable towards the investment in a MG with ESS. In Italy for example, the ESS-option under ToU has a disadvantage of 26,656 € compared to the PV-only option. In perspective, this means 1,066 €/year, which in turn mean 133 €/household/ year, and really just 11.1 €/household/ month – following the assumption that all households have similar consumption patterns. It could be certainly argued that perhaps some prosumers would be willing to pay over 11 €/month in order to enjoy the benefits of a ESS, as they were outlined in the introduction. However, from an investment point of view this corresponds to a project 91% worse than the alternative, as illustrated in Figure 3. If the policy changed to a Time-of-Use tariff with CT, the NPC of the PV-only option would increase, and dramatically narrow the gap towards the option with a battery to just 35% disadvantage.
Figure 3 visualizes the gap between and in percentage, calculated as a disadvantage with respect to the best solution (PV-only), thus putting the findings in a clearer perspective. Hence the values summarized in Figure 3 correspond to the ratio D/NPCPV.
Visualization of results as D-values expressed as percentage of the NPC of the PV-only option (D/NPCPV)
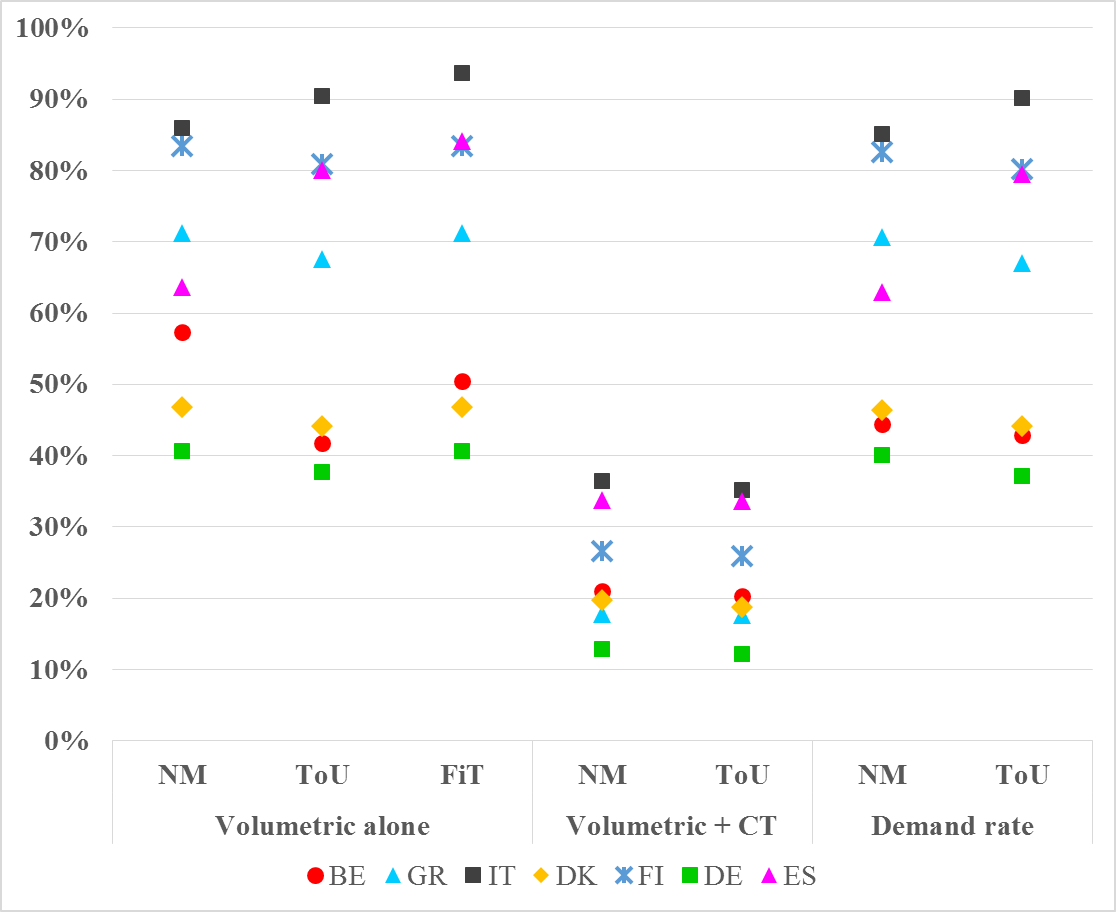
The visual representation is useful in that it provides a comparative overview of how the gap between and , for the same MG set-up, is smaller or larger in each country and under each tariff design.
For example, a MG project with ESS is 38% worse off than a PV-only project in Germany (green squares), under volumetric time-of-use tariff. Under ToU with demand rates the same project would be 37% worse off, whereas under ToU with capacity tariff, only 12% worse off. In the extreme cases of Italy and Finland, without CT the MG option is consistently over 80% worse than the PV-only option, but for different reasons: in Finland it is due to the very large system needed to replicate the same level of performance as everywhere else, which incurs large investment costs; in Italy on the other hand, the investment costs in a PV unit are so low that any additional purchase weighs significantly in the final value of the NPC.
It is worth noting that under volumetric and DR scenarios the Greek example offers results of over 60% disadvantage for the MG option, the addition of CT improves those results down to under 20%. The hierarchy between options remains similar for the other case studies: in Italy there is the largest gap between and , whereas in Germany it is the lowest.
While the volumetric ToU tariff already promotes self-consumption and peak shaving, the capacity components (CT and DR) have been found to not only promote the same behaviour, but also add a component of what the network operators would consider as “fairness”. However, from the consumer point of view, adding capacity components to an already volumetric ToU tariff design seems to be penalizing the same behaviour twice. It could be argued that instead of ToU with capacity components, a volumetric ToU tariff with higher peak prices would be a good alternative – but a ToU design with higher peak prices would then not be neutral towards the non-prosumers (as originally designed).
Finally, Figure 3 suggests that some set-ups are more sensitive to policy than others. When comparing the volumetric and the DR scenarios, it is noticeable that the results from the Spanish case study are more varied than those from the German case study.
Overall, this study confirms previous findings in academic literature (as addressed in the introduction), by showing that a combination of volumetric and capacity tariffs are beneficial for the integration of DER and especially for the take-up of batteries. However, by using case studies and a cross-EU approach under different scenarios, it becomes clear that those beneficial effects only emerge by making the PV-only option less viable.
Starting from the observation that the investment in a residential microgrid with a PV unit and an electricity storage system has a higher Net Present Cost than that of a PV system alone, this work has evaluated: (a) how much higher it is, (b) whether under different electricity pricing designs the difference is lower, and (c) whether those effects can be regarded as general, or are limited to single case studies.
In order to do that, seven case studies in EU countries were constructed (Belgium, Greece, Italy, Denmark, Finland, Germany and Spain), in which eight households are organized in a microgrid sharing a PV unit and an electricity storage system, sized so as to ensure comparability. Then, the NPC of the investment project with and without ESS was calculated ( ) under the following tariff designs: Volumetric (NM, ToU and FiT), Volumetric + Capacity Tariffs, and Volumetric + Demand Rates.
It was found that: (1) the volumetric-only pricing mechanisms lead to the biggest differences between and , which make the projects that include batteries very unattractive; (2) adding a demand rate to the volumetric pricing leads to a slightly smaller difference, and (3) adding a capacity tariff and allowing for price arbitrage reduces the difference significantly.
These findings suggest that a pricing mechanism with volumetric and capacity tariff (with daily optimization and price arbitrage) creates the best conditions for bringing the option of a MG with ESS on the same level of viability with the PV-only option. The gap is minimal under these conditions, and could be alleviated easier with solutions like public support (note that subsidies were not included in the calculations), or really just the willingness to invest a small amount of extra money in a project with arguable environmental benefits.
However, a closer inspection of the results has revealed that the narrower gap is achieved not so much by improving the viability of a MG with ESS, but rather by the deteriorating the otherwise favourable conditions for PV-only systems. This suggests that even though one pricing policy has been shown to have a consistently positive effect towards the adoption of batteries in MGs (namely the addition of CT), its applicability appears more realistic in the post-grid parity world.
It is important to acknowledge the limitations of this study (e.g. the questions of technological configuration) and the need for deeper investigations such as sensitivity analyses (e.g. on the price of electricity) to consolidate the findings. Therefore, this work provides a starting point for academics and policy makers for further research into tariff designs that promote storage without disincentivizing production on prosumers’ end. On a broader level, as DER, ESS and RES are individually found to be reliable solutions for the future of the electricity grid, more research is needed into how they can be integrated to work together at their maximum potential and to the best economic viability within smart communities.
|
capacity tariff for the capacity block above threshold |
[€] |
|
|
capacity tariff for the capacity block below threshold |
[€] |
|
|
D |
difference between NPCMG and NPCPV |
[€] |
|
NPC |
net present cost |
[€] |
|
electricity price at the main grid |
[€/kWh] |
|
|
sellback price |
[€/kWh] |
|
|
buying price during peak time |
[€/kWh] |
|
|
sellback price during peak time |
[€/kWh] |
|
|
buying price during shoulder time |
[€/kWh] |
|
|
sellback price during shoulder time |
[€/kWh] |
|
|
buying price during off-peak time |
[€/kWh] |
|
|
sellback price during off-peak time |
[€/kWh] |
|
|
demand rate applied during peak hours |
[€/kWh] |
|
|
demand rate applied during shoulder hours |
[€/kWh] |
|
|
demand rate applied during off-peak hours |
[€/kWh] |
|
|
Abbreviations |
||
|
CC |
Cycle Charge |
|
|
CT |
Capacity Tariff |
|
|
DER |
Decentralized Energy Resources |
|
|
DR |
Demand Rate |
|
|
ESS |
Electricity Storage System |
|
|
FiT |
Feed in Tariff |
|
|
FP |
Fixed Price |
|
|
HH |
Household |
|
|
LF |
Load following |
|
|
MG |
Microgrid |
|
|
NM |
Net-Metering |
|
|
PV |
Photovoltaic |
|
|
RES |
Renewable energy sources |
|
|
ToU |
Time of Use |
|
This research has been performed in part using the ERIGrid Research Infrastructure and is part of a project that has received funding from the European Union’s Horizon 2020 Research and Innovation Programme under the Grant Agreement No. 654113. The support of the European Research Infrastructure ERIGrid and its partners Centre for Renewable Energy and Saving, Ricerca sul Sistema Energetico, Danish Technical University and Technical Research Centre of Finland is very much appreciated.
APPENDIX
Full list of NPC PV and NPC MG for the case studies
NPCMG and NPCPV results of simulations (€)
|
PV + Battery |
PV-only |
||||||||||||||
|
NM |
ToU |
FiT |
NM+ CT |
ToU +CT |
NM +DR |
ToU +DR |
NM |
ToU |
FiT |
NM +CT |
ToU +CT |
NM +DR |
ToU +DR |
||
|
BE |
104,988 |
95,887 |
92,667 |
146,677 |
147,396 |
97,104 |
97,272 |
66,735 |
67,616 |
61,563 |
121,242 |
122,565 |
67,217 |
68,098 |
|
|
GR |
55,080 |
54,822 |
55,080 |
92,972 |
94,161 |
55,345 |
55,087 |
32,170 |
32,719 |
32,170 |
78,956 |
80,072 |
32,441 |
32,990 |
|
|
IT |
53,827 |
56,108 |
56,077 |
72,529 |
72,838 |
54,090 |
56,523 |
28,947 |
29,452 |
28,947 |
53,147 |
53,871 |
29,230 |
29,735 |
|
|
DK |
103,115 |
103,256 |
103,115 |
123,972 |
124,696 |
103,742 |
104,144 |
70,203 |
71,613 |
70,203 |
103,484 |
105,049 |
70,877 |
72,270 |
|
|
FI |
143,652 |
144,179 |
143,652 |
185,734 |
187,262 |
144,281 |
144,808 |
78,328 |
79,677 |
78,328 |
146,621 |
148,782 |
79,008 |
80,357 |
|
|
DE |
73,798 |
73,746 |
73,798 |
107,423 |
108,370 |
74,275 |
74,234 |
52,445 |
53,575 |
52,445 |
95,168 |
96,575 |
53,017 |
54,148 |
|
|
ES |
91,645 |
80,964 |
81,476 |
85,335 |
86,478 |
92,153 |
81,704 |
55,992 |
44,974 |
44,246 |
63,802 |
64,703 |
56,549 |
45,508 |
|