


Energy efficiency (EE) is the group of measures and activities used for minimizing of energy use with a same level of comfort or production. In some cases, the concept of energy efficiency is misunderstood and people tend to think of it to be the same as saving energy. Saving energy involves some sacrifices to the achievement of living comfort, while energy efficiency does not impair living comfort or working conditions. The increase of energy efficiency does not mean only the application of the technical solutions but also the use of these technologies, which include the education and sharing of information on energy efficiency by changes in habits and ways of using energy and energy resources [1]. Buildings consume a significant fraction of the national energy resources of each country and represent the largest energy sector in the economy and the largest energy sector of consumers worldwide, using about 40% of total energy production. In addition, demand in this sector risks growing with future population growth as well as expected economic growth. Therefore, it is necessary to strive to improve the energy performance of buildings [2]. For the existing buildings there are many developed and implemented programs with more or less success of energy savings after the implementation. Different standards and energy codes have been developed for new buildings [3]. The standards, codes and different calculation methodologies provide the possibilities for precise calculation of the energy needs for the buildings. These data are the baseline for prediction of the energy consumption of the new buildings and calculation of the potential of energy savings for the buildings which are planned for undergoing refurbishment by implementing the energy efficiency measures. Krarti [4] has described various existing methods and tools for analysing energy consumption in buildings, commonly used in the United States and Europe. These tools and methods fall into three broad categories: The Ratio-based methods; Forward methods; and Inverse methods. ASHRAE Fundamentals Handbook 2017, describes the energy estimating and modelling methods based on degree-days [5], while CIBSE TM41:2006 [6] has described the additional development of the degree-day method using the variable base temperature. Among the most commonly used methods are the Degree-Day Method and the Methodology for calculating the energy building performance generated from the standard EN ISO 13790. CEN has prepared this standard and the European Commission and European Free Trade Association have mandated it for harmonising methodologies in order to calculate the energy building performance [7]. Standard covers the monthly quasi-steady state calculation method, hourly simplified method and hourly dynamic simulation method. Montenegro has adopted the standard as well named MEST EN ISO 13790. The detailed descriptions of the calculation methodology, which are used in this work, are given in the Regulation of minimum energy efficiency requirements for buildings in Montenegro [8]. Different authors have published their works on standard EN ISO 13790. In their work, Soldo et al. have described the detailed calculation methodology based on Croatian conditions according to the HRN EN 13790 [9]; Horvat and Dović have presented the dynamic method for calculation of energy for heating, cooling and ventilation [10]; Kokogiannakis et al. have analysed the impact of using different methods within the ISO 13790 standard for space heating and cooling [11].
Different software packages are developed around the world for the energy analysis and calculation of energy building performance. Some of these software packages are: EnergyPlus, TRNSYS, ENSI, RETScreen, and many others. The RETScreen software [12] is the Microsoft Excelbased software which the Government of Canada developed and it can be used around the world for technical and financial analysis of the clean energy and energy efficiency projects [13]. Two versions are in use, the RETScreen 4 is part of the RETScreen Suite software package which could be used for free, and from 2016 a new version of the program called RETScreen Expert has been released to the public. It is a new generation of RETScreen that extends the purpose of using single-engineered decision-making tool for specialist engineers to one intelligent tool that supports involvement for a much wider range of actors throughout the project lifecycle including the energy management [14]. It should be noted that there is no difference between RETScreen 4 and RETScreen Expert on the calculation algorithms. There exist a number of papers published with the results gained by using the RETScreen. Vollaro et al. have used in combination the TRNSYS and RETScreen for calculation model to optimize the design of low impact energy systems for buildings [15]; in their work, Ramli et al. did the comparison of Renewable Energy Technologies Using Two Simulation Softwares: Homer and RETScreen [16]; Lalita P. et al. have analysed the Energy Comfort Management in Energy Efficient Building using the RETScreen software with a case study [17].
Besides a number of published papers, there is still a lot of space to work in analysing the different calculation methodologies for enhancing the calculation methodologies and adapting for the certain circumstances of the different countries and comparing the results of methodologies used by different softwares. In this research it is decided to use RETScreen 4 and to compare it with EN13790 Standard for reasons as follows:
To compare two existing calculation methods and models based on it;
To check it and send a message whether the RETScreen software which is free of charge can be used for analysis of different EE projects.
In order to check the above hypothesis in this work, we performed one real case study for the existing object (hospital building) by using the same input data.
To compare the results of the main calculation parameters made using the EN 13790 standard algorithm and the RETScreen software, the following steps were performed:
An appropriate mathematical model (software) of calculation was made on Excel software using the formula algorithm of standard EN 13790;
An energy audit of one real building was carried out: Infectious Hospital in Prizren, Kosovo. The analysis is done for the existing conditions and for the conditions after the proposed EE measures.
Using the same building inputs and the same meteorological data, an analysis of the same building was performed on the RETScreen software;
Comparison of the results for the "old" and "new" condition of the building for the model "EN 13790" and "RETScreen" is performed.
The mathematical calculation model is based on MEST EN 13790 using monthly quasi-steady state calculation method for the whole year. Calculations were performed in Microsoft Excel software by combining different spreadsheets. The model is created for calculation of the energy needs for space heating and for space cooling.
The monthly seasonal energy needs calculation for space heating of the building [18]:
(1)
Total amount of heat needed to cover the heat losses (transmission and air infiltration):
(2)
Heat transfer through the envelope of the building (outdoor walls, windows, etc.), transmission losses:
(3)
Heat necessary to cover the losses through the natural ventilation and air infiltration:
(4)
Heat for mechanical ventilation [18]:
(5)
Heat gain of the building [8]:
(6)
Total heat gains from the solar irradiation:
(7)
The sum of heat gains from internal sources: lighting, various usable appliances, and the heat of human metabolism [8]:
(8)
The use factor of the heat gains for heating [8]:
(9)
Ratio of the heat gains and heat losses:
(10)
The heat losses due to transmission – heat transfer, infiltration and mechanical ventilation:
(11)
The building dynamic non-dimensional parameter, a:
(12)
The time constant:
(13)
Internal heat capacity of building [8]:
(14)
Correction due to intermittent heating:
(15)
The energy needs for space cooling [9]:
(16)
Heat gains for cooling [9]:
(17)
(18)
The heat energy transfer for the observed period [9]:
(19)
(20)
Coefficient of heat transfer through transmission [9]:
(21)
(22)
The use factor of the heat losses for cooling [8]:
(23)
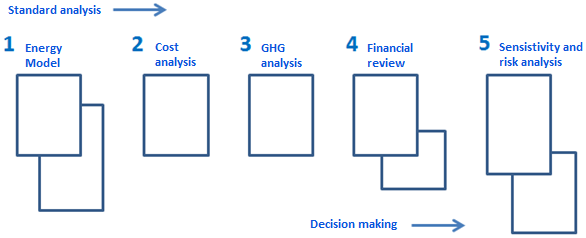
RETScreen uses different calculation models for various clean energy and energy efficiency technologies and for all these models there is the same analysis procedure which consists of five steps. This allows users who have learned to use RETScreen on one technology to easily adapt to the use of analysis for other technologies because it was developed using MS Excel and the analysis is given in couple of sheets, [13]. A graphical representation and flow analyses is shown in Figure 1.
Schematic view of the analysis flow model of the RETScreen software [13]
The monthly heating demand varies depending on the outside temperature. The calculation is based on the heat loss coefficient (UA value in W/ºC) and the internal specified temperature. The heating requirement for the existing condition of the building for the month "i" is, HLbase, i, in Wh, is [13]:
(24)
Monthly heat demand for heating for the proposed case, HLpropo,i is estimated with the equation [13]:
(25)
It is supposed that the heat gains are constant during the year and are inserted by the user. The internal heat gains IGi for month i" are, [13]:
(26)
where IGdaily = Kl + Ke + Kp,sens is daily internal heat gains, in Wh.
Monthly useful solar gains for heating season:
Solar gains for "i" month for the existing condition Sbase,i and for the proposed condition of building Sprop,i are calculated according to [13]:
(27)
(28)
where 0.93 is the correction factor of the incident angle.
The use factor of solar heat gains during the heating season:
(29)
Coefficients (a, b, c i d) are functions of the building mass and internal temperature oscillations of 5.5 ºC are used in the software. 0.93 is the correction factor of the incident angle.
The ratio of the heat gains load (GLR) is defined, [13]:
(30)
Factors fbase,i i fprop,i have to be calculated for the existing condition and the new condition after the EE measures.
Annual energy savings for heating:
(31)
Annual energy savings for cooling:
(32)
Annual energy savings:
The annual energy savings is achieved by summing the energy savings from heating and cooling, [13]:
(33)
(34)
Calculation of the maximum cooling load reduction ∆Pcool [13]:
(35)
For the purpose of the case study for this work, it is done the detailed calculation and analysis of energy performance and energy efficiency potential of an existing building for the Infectious Hospital. The reason for selection of this building to make the analyses and compare the above mentioned calculation models, (standard EN 13790 and RETScreen software), was based on wish to analyse a complex building from the energy demand side, as a hospital is. It is well known from practice that hospitals are among public buildings with high specific energy consumption (kWh/m2/y) and their working time is 24/7 during the whole year. Another reason is the diversity of the energy consumption that hospitals have (space heating/space cooling, sanitary hot water, ventilation, indoor temperature for heating and cooling, lighting, etc.).
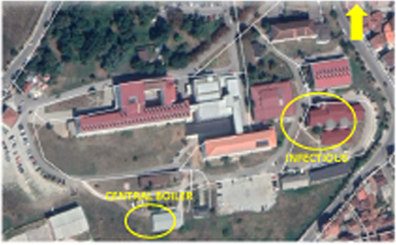
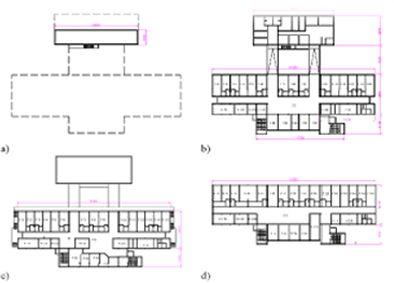
The Infectious Hospital building is part of the Regional Hospital "Dr. Daut Mustafa" in Prizren, Republic of Kosovo, see Figure 2. It was built in 1973 with 2 floors. Later in 2001 another floor was added as attic. Total gross building area is 2723 m2. Drawings of the building are shown in Figure 3.
Position of the Infectious Diseases Hospital within the complex of the Regional Hospital in Prizren (Source:
Drawings of the Infectious hospital analysed as study case for this work: a) the basement floor, b) the ground floor, c) the first floor and d) the third floor
In the current situation, the hospital building does not have insulated outside walls as well as ceiling. The windows have been recently replaced and they are in good condition. The existing outside doors are in bad condition. The heating system is based on heavy fuel oil. Cooling of building is based on air to air heat pumps (split systems). Building does not have installed mechanical ventilation system, but for the purpose of this study, it was developed the engineering design of the ventilation system and data derived from the engineering design are used for calculation.
Calculation is done considering the building as a single zone.
Tables 1 to 6 below show the climate data used for calculation in EN 13790 model and RETscreen including the data of the building. The most important climate data for calculation: the average monthly temperatures, the average monthly solar irradiation, the design temperatures for heating and cooling are the same for both calculation models. Table 7 presents data for the building envelope. The heated area is 2502.56 m2. The central boiler room, which is located in the south of the hospital complex, provides heat source for space heating. In 2013 a central system was installed for sanitary hot water using the solar collectors for the hospital which are installed in roofs of two buildings of Regional Hospital. The solar thermal system covers annually 60% of energy needs for sanitary hot water, the rest 40% is heated with electricity.
Jan |
Feb |
Mar |
Apr |
May |
Jun |
Jul |
Aug |
Sep |
Oct |
Nov |
Dec |
Average |
|
|---|---|---|---|---|---|---|---|---|---|---|---|---|---|
ºC |
2.56 |
3.95 |
7.43 |
12.72 |
17.13 |
21.23 |
23.87 |
23.48 |
18.58 |
12.8 |
7.84 |
2.9 |
12.87 |
Jan |
Feb |
Mar |
Apr |
May |
Jun |
Jul |
Aug |
Sep |
Oct |
Nov |
Dec |
|
|---|---|---|---|---|---|---|---|---|---|---|---|---|
Hor, monthly (kWh/m2) |
42.8 |
60.4 |
103.9 |
133.7 |
170.4 |
181.2 |
192.8 |
170.4 |
127.6 |
88.9 |
45.5 |
33.9 |
Hor, daily (kWh/m2) |
1.38 |
2.16 |
3.35 |
4.46 |
5.50 |
6.04 |
6.22 |
5.50 |
4.25 |
2.87 |
1.52 |
1.09 |
North (kWh/m2) |
17.4 |
22.4 |
36.0 |
44.7 |
55.7 |
56.9 |
58.3 |
52.8 |
38.8 |
29.2 |
17.9 |
14.3 |
East (kWh/m2) |
32.6 |
55.4 |
79.8 |
96.1 |
112.9 |
116.8 |
125.2 |
114.4 |
91.3 |
67.2 |
34.7 |
25.5 |
South (kWh/m2) |
64.3 |
76.98 |
96.4 |
86.7 |
86.3 |
81.4 |
90.3 |
99.4 |
107.4 |
109.2 |
66.5 |
52.8 |
West (kWh/m2) |
32.6 |
55.35 |
79.8 |
96.1 |
112.9 |
116.8 |
125.2 |
114.4 |
91.3 |
67.2 |
34.7 |
25.5 |
Heating |
Jan |
Feb |
Mar |
April |
Oct |
Nov |
Dec |
|---|---|---|---|---|---|---|---|
North (Wh/m2 day) |
561.94 |
799.29 |
1162.58 |
1488.00 |
940.65 |
597.67 |
461.61 |
East (Wh/m2 day) |
1050.65 |
1976.79 |
2574.19 |
3201.67 |
2168.06 |
1155.67 |
823.55 |
South (Wh/m2 day) |
2072.58 |
2749.29 |
3110.65 |
2891.00 |
3523.23 |
2217.33 |
1703.23 |
West (Wh/m2 day) |
1050.65 |
1976.79 |
2574.19 |
3201.67 |
2168.06 |
1155.67 |
823.55 |
Cooling |
April |
May |
June |
July |
Aug |
Sep |
Oct |
|---|---|---|---|---|---|---|---|
North (Wh/m2 day) |
1488.00 |
1796.45 |
1896.00 |
1879.68 |
1704.19 |
1292.67 |
940.65 |
East (Wh/m2 day) |
3201.67 |
3641.94 |
3892.67 |
4039.35 |
3689.35 |
3044.00 |
2168.06 |
South (Wh/m2 day) |
2891.00 |
2783.23 |
2714.33 |
2913.23 |
3207.42 |
3579.33 |
3523.23 |
West (Wh/m2 day) |
3201.67 |
3641.94 |
3892.67 |
4039.35 |
3689.35 |
3044.00 |
2168.06 |
Outdoor design temperature for heating, (ºC), [21] |
Outdoor design temperature for cooling (ºC), [22] |
Indoor design temperature for heating, (ºC), [8] |
Indoor design temperature for cooling, (ºC), [8] |
|---|---|---|---|
-15 |
34 |
21 |
26 |
Month |
Air temperature |
Relative humidity |
Daily solar irradiation – horizontal |
Atmospheric pressure |
Wind speed |
Earth temperature |
Heating Degree-days |
Cooling Degree-days |
|---|---|---|---|---|---|---|---|---|
ºC |
% |
kWh/m2/d |
kPa |
m/s |
ºC |
ºC-d |
ºC-d |
|
January |
2.56 |
79.1% |
1.38 |
93.2 |
1.2 |
-1.8 |
585 |
0 |
February |
3.95 |
71.0% |
2.16 |
93.0 |
1.4 |
-0.1 |
458 |
0 |
March |
7.43 |
63.1% |
3.35 |
92.9 |
1.8 |
4.7 |
370 |
0 |
April |
12.72 |
61.6% |
4.46 |
92.7 |
1.7 |
9.7 |
102 |
45 |
May |
17.13 |
60.6% |
5.50 |
92.9 |
1.6 |
15.5 |
0 |
214 |
June |
21.23 |
57.9% |
6.04 |
92.9 |
1.6 |
19.8 |
0 |
321 |
July |
23.87 |
54.8% |
6.22 |
93.0 |
1.6 |
22.7 |
0 |
403 |
August |
23.48 |
55.0% |
5.50 |
93.0 |
1.5 |
22.6 |
0 |
400 |
September |
18.58 |
62.6% |
4.25 |
93.1 |
1.4 |
17.4 |
0 |
249 |
October |
12.8 |
71.5% |
2.87 |
93.3 |
1.2 |
11.2 |
101 |
78 |
November |
7.84 |
77.2% |
1.52 |
93.1 |
1.1 |
4.4 |
373 |
0 |
December |
2.9 |
80.3% |
1.09 |
93.1 |
1.3 |
-0.8 |
531 |
0 |
Annual |
12.87 |
66.2% |
3.70 |
93.0 |
1.5 |
10.5 |
2,520 |
1,709 |
Surface/volume |
Uex |
Unew |
||||||
|---|---|---|---|---|---|---|---|---|
No |
Element |
Gross surf. |
Net surf. |
Surface of elements |
After EE measu. |
Unit |
[W/m2K] |
[W/m2K] |
1 |
Outdoor walls – type 1 |
1094.6 |
777.3 |
1609.83 |
777.325 |
m2 |
1.52 |
0.32 |
2 |
Outdoor walls – type 2 |
260.63 |
260.6 |
260.63 |
m2 |
3.36 |
0.30 |
|
3 |
Outdoor walls – type 3 |
296.80 |
220.0 |
220 |
m2 |
1.36 |
0.27 |
|
4 |
Outdoor walls – type 4 |
436.00 |
351.8 |
351.875 |
m2 |
0.99 |
0.29 |
|
5 |
Ground floor |
1099.4 |
1099. |
1099.48 |
1099.48 |
m2 |
0.53 |
0.53 |
6 |
Ceiling |
1099.4 |
1099. |
1099.48 |
1099.48 |
m2 |
2.12 |
0.33 |
7 |
Outside windows – t 1 |
288.00 |
288.0 |
441.60 |
288 |
m2 |
1.80 |
1.80 |
8 |
Outside windows – t 3 |
76.80 |
76.80 |
76.80 |
m2 |
1.80 |
1.80 |
|
9 |
Outside windows – t 4 |
76.80 |
76.80 |
76.80 |
m2 |
1.80 |
1.80 |
|
10 |
Outside doors – t 1 |
29.28 |
36.60 |
36.60 |
36.6 |
m2 |
3.50 |
1.80 |
11 |
Outside doors – t 4 |
7.32 |
||||||
12 |
Air infiltration - OW |
h-1 |
0.60 |
0.60 |
||||
13 |
Air infiltration - OD |
h-1 |
0.66 |
0.60 |
||||
14 |
Building surface |
2502. |
2502.56 |
m2 |
||||
15 |
Building volume |
1008 |
10080.5 |
m3 |
- |
- |
||
16 |
Working hours (h) |
18 |
18 |
|||||
17 |
Change of the heating generator (in current situation is used heavy fuel oil) |
|||||||
Proposed EE measures are: insulation of the outside walls with 10 cm and 12 cm of EPS, insulation of the ceiling with mineral wool of 10 cm, replacement of the existing outside doors, change of heating source by replacing the heavy fuel oil boiler with boiler on pellet. No EE measures are considered for the ground floor considering the cost of interventions. In Table 7 are shown the transmission coefficients for the existing condition Uex and condition after the EE measures Unew.
The comparison of results is done for the energy needs and the delivered energy for the current condition of building and for the condition after the implementation of proposed EE measures. The indicator parameters compared are:
The energy needs and delivered energy for heating the building before and after the EE measures and SWH, (MWh/y),
The energy needs and delivered energy for cooling before and after the EE measures, (MWh/y),
The electricity needs and delivered electricity before and after the EE measures, (MWh/y),
Total energy needs and total delivered energy before and after the EE measures, (MWh/y),
Specific energy needs for and delivered energy space heating before and after the EE measures and SWH, (kWh/m2/y),
Specific energy needs and delivered energy for space cooling before and after the EE measures and SWH, (kWh/m2/y),
Specific electricity needs and delivered electricity before and after the EE measures, (kWh/m2/y),
The total specific energy needs and delivered energy before and after the EE measures, (kWh/m2/y),
Reduction the GHG, the CO2 eq., (ton/y).
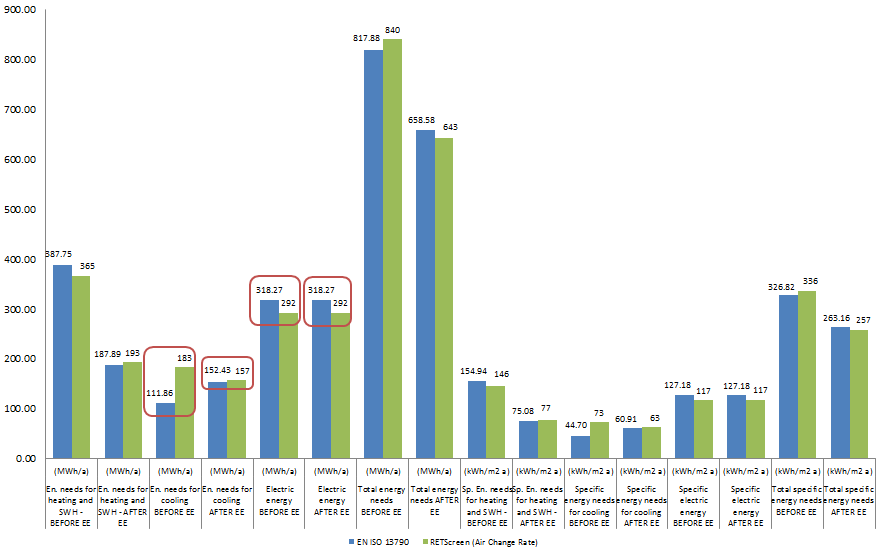
The results obtained from the calculations were performed using both models MEST EN 13790 and RETScreen, and are shown in Figure 4 and Figure 5. In Figure 4 is the comparison of the energy needs for the analysed building for two models, while Figure 5 shows comparison of the delivered energy. Analysing the results in both figures, results are seen to be very close to each other for both calculation models and for both models, follow almost the same trend line of the graph. The closest results appear to be for energy needs for heating and delivered energy for heating in the existing condition and condition after the EE measures. There is also a slight difference in electric energy consumption which results to be larger in EN 13790 and since there is no EE measure proposed for the lighting and electric appliances, the results are the same for the existing condition and condition after EE. The specific energy consumption in both cases follows the same trend line as the energy consumption. When comparing the total energy consumption in existing condition and condition after the EE, as it is seen in the diagrams, in existing condition the MEST EN 13790 results show a bit lower consumption comparing to the RETScreen, while in the condition after the EE, the RETScreen results show bigger consumption. There are two reasons for this difference: 1) the difference of the energy for cooling between the two models because of the calculation model (algorithm) that each of them uses, and 2) the cooling source is from the heat pumps (the average energy efficiency ratio is considered to be 2.76 for both models), which increases the difference for the delivered energy.
The comparison of results for the energy needs of the building in the current condition and in condition after the proposed EE measures
The comparison of results for the delivered energy of the building in the current condition and in condition after the proposed EE measures
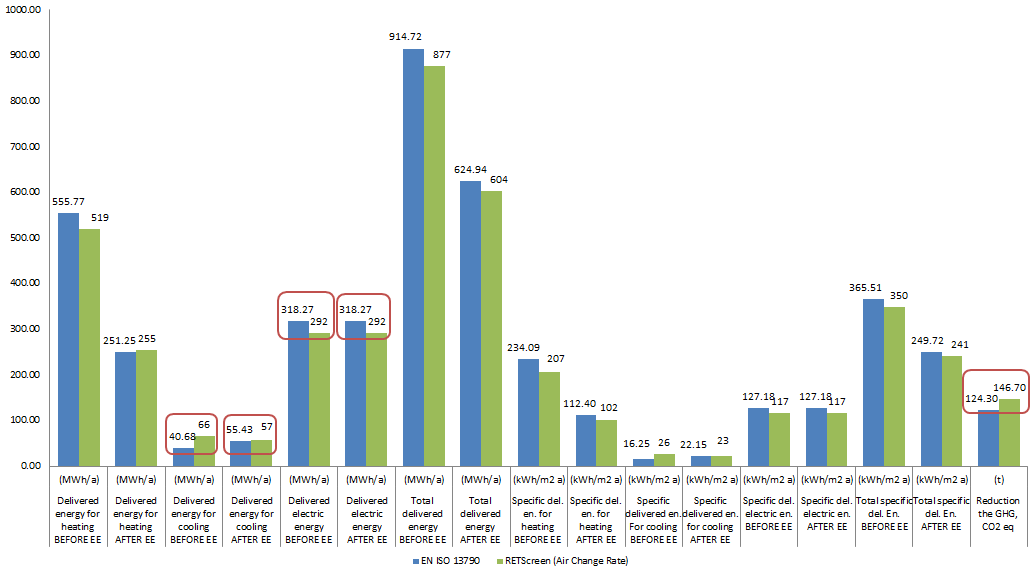
Since it is not foreseen to have any measure to prevent the solar radiation through the windows, when comparing the results before and after the EE measures, the energy needs and the delivered energy for cooling for the calculation method with MEST 13790 gives more energy needs and the delivered energy for cooling after the implemented EE measures (see the square marked values in Figure 4 and Figure 5).
When comparing the results for energy needs of buildings according to the percentage of differences, the maximum difference for energy needs for cooling in existing condition is 38.87% and the minimum difference for total energy needs after the EE is 2.42%. For other indicators the difference varies between (plus or minus) 2.65% to 9.0%. Similar differences also result for the delivered energy. The difference in CO2 eq. emission (EN13790/ RETScreen) is 15.27%. The difference in emission reduction, is because for the EN 13790 model, the need for electricity consumption for cooling is higher after the EE measures (14.75 MWh), which in terms of the CO2 eq. emission means 21.21 tons CO2 eq. more to be emitted after the EE measures. To this difference in CO2 eq. emission, also contributes the energy source which in this case is electricity with very high emission factor of the CO2 eq. which is generated in Kosovo. The coefficient of CO2 emission from the electricity generated in Kosovo is 1438 (kg/MWh) [23]. The electricity production in Kosovo is based on existing thermal power plants (TPP) run on lignite (94.4%) while the rest comes from renewable energy sources (5.6%) [24].
Before giving the conclusions it is worthwhile to mention that standard MEST EN 13790 and RETScreen software are the different calculation models; each of them has different built-in assumptions and the results are tailored for the intended use of the software. Specifically, while the MEST EN 13790 standard is made for a general building energy model, it "is applicable to buildings at the design stage and to existing buildings" [22]. The RETScreen is more a pre-feasibility and feasibility tool and does not give any design recommendations. Good comparison results in this study can't be take into account as a fundamentally correct statement, and additional analysis is necessary to arrive at such a conclusion.
The results of the analysis show that most indicators give very approximate results comparing to both models. There are differences in the result when calculating the energy required for cooling.
When calculating the condition after the proposed EE measures, using average monthly temperatures, MEST EN 13790 gives more energy consumption for cooling. This is due to the change in thermal inertia of the building after the insulation of the exterior walls, assuming that the energy gains do not change, i.e., they are the same as in the existing condition of the building. By installing thermal insulation:
The parameter 1/γ is decreased;
The dimensionless parameter ac increases as the time constant τc (which represents the internal thermal inertia of the conditioned zone of the building) increases, this increase in thermal inertia is caused by the decrease of the heat transfer with transmission Htr.
According to what is stated in points a and b above, for the insulated walls, for calculations with average monthly temperatures, due to the increased thermal inertia, the heat accumulated in the building during the day cannot be cooled by transmission because the night cooling is slower. This is why in this work the calculated energy needs for cooling after the insulation of the exterior walls is higher than the calculation for the existing condition of the building.
This is the argument that MEST EN 13790 (the monthly method) does not recognize the daily temperature fluctuations and their effect on the daily dynamics of the system.
The next thing what is worthwhile to mention to prove in this paper is to compare the operation of MEST EN 13790 with RETScreen when applied to a real object.
The results of the calculations showed to be very close and in small differences in percentage for the indicators listed at Results chapter in this paper. Diagrams in Figure 4 and Figure 5, show the results. According to the results obtained, it can be concluded that MEST EN 13790 and RETScreen are complementary models for calculation. Given that RETScreen is relatively easy to use and also specifically designed for pre-feasibility and feasibility analyses of energy efficiency investment projects and renewable energy projects, then with sufficient precision RETScreen can be used as an auxiliary tool for real project investment analysis and enables projects to be analysed with the different technologies used to implement the projects.
Aj |
the conditioned area of the building |
[m2] |
An |
total surface of windows for the n" orientation |
[m2] |
a |
the numeric parameter that depends on time constant τC |
[-] |
A0 |
the numeric constant that depends on the calculation method |
[-] |
aH,Red |
factor of interruption of the "system" |
[-] |
Cm |
internal heat capacity |
[Wh/K] |
Dn,i |
seasonal shading factor for windows for the n" orientation and i" month |
[-] |
fH,ONh |
system "working" coefficient |
[-] |
fH,OFFh |
coefficient of "short" interruptions in operation of heating systems |
[-] |
HD |
heat transmission coefficient due to the outdoor air |
[W/K] |
HU |
heat transmission coefficient through the non-cooled space to the outdoor air |
[W/K] |
HA |
the transmission heat coefficient to the neighbourhood building |
[W/K] |
Hg,m |
the transmission heat coefficient through the ground |
[W/K] |
Hg |
stationary coefficient of transmission heat exchange to the ground |
[W/K] |
HH,Ve,mech= Hm,Ve |
coefficient ventilation heat losses |
[W/K] |
HVe,win |
ventilation coefficient through opening the windows |
[W/K] |
Hve |
coefficient of total ventilation losses of the heating zone |
[W/K] |
Htr |
coefficient transmission losses |
[W/K] |
HVe,inf=Hi,Ve |
coefficient of ventilation heat losses due to natural ventilation and air infiltration |
[W/K] |
HLi |
monthly heating load |
[Wh] |
IGi |
monthly internal gains |
[Wh] |
Kl and Ke |
the respective internal heat gains from lighting and appliances |
[Wh] |
Kp,sens |
heat gains from peoples |
[Wh] |
Nh,i |
number of hours in month i" |
[h] |
QH,nd |
total energy needed for heating |
[Wh] |
Qht,l=QH,ht |
total heat amount needed to cover the heat losses (transmission and infiltration) |
[Wh] |
QH,gn |
total heat gain for heating |
[Wh] |
QVe= Qm,Ve |
the energy needs for mechanical ventilation (for heating) |
[Wh] |
Qtr |
transmission heat losses |
[Wh] |
Qi,ve |
heat losses due to the natural ventilation and air infiltration |
[Wh] |
Qsol |
gains from solar irradiation |
[Wh] |
Qint |
sum of heat gains from the internal sources: lighting, appliances and metabolism of peoples |
[Wh] |
QH,n(cont)= Qh,tl |
energy needed to cover the transmission losses |
[Wh] |
QC,nd |
ehe energy for cooling |
[Wh] |
QC,gn |
total heat gain for the cooling period |
[Wh] |
QC,ht |
total heat transmission during the cooling period |
[Wh] |
Qve,inf |
the energy need to cover the infiltration losses for cooling |
[Wh] |
Qve,win |
the energy need to cover losses from the opening of the windows for cooling season |
[Wh] |
QC,Ve,mech |
the energy need to cover the ventilation losses for cooling |
[Wh] |
Sinc,n,i |
total daily solar incident in a vertical surface for the n" orientation and month i" |
[-] |
SHGCn |
the global solar gains coefficient for all windows in n" orientation |
[Wh] |
Si |
monthly solar gains |
[Wh] |
Smax |
the maximum of the solar gains which software generates based on the geographical location of the building. |
[Wh] |
Tset |
the internal set temperature |
[ºC] |
Tavg,i |
average outdoor temperature for month i" |
[ºC] |
Tset,heat |
indoor set temperature for heating |
[ºC] |
Tdes,heat |
the design temperature for heating based on the geographical location where the building is located. |
[ºC] |
Tdes,cool |
the design outdoor temperature for cooling for the location |
[ºC] |
Tset,cool |
the indoor design temperature for cooling |
[ºC] |
t |
time of calculation period |
[h] |
ti,ve |
length of heating period with set internal temperature |
[h] |
tm,ve |
length of the working period of mechanical ventilation system |
[h] |
Uex |
heat transmission coefficient for the existed situation |
[W] |
Unew |
heat transmission coefficient for the new situation (after EE measures) |
[W] |
UAbase |
overall heat loss coefficient for the existing building condition |
[W/K] |
UAprop |
overall heat loss coefficient after the EE measures |
[W/K] |
γ |
ratio gains/losses |
γH = γ |
ratio between the heat gains and heat losses |
γH,gn = γ |
the heat gains use factor |
γH,ls = γ |
the use factor of the heat losses for cooling |
θm |
monthly average indoor temperature of building |
θem |
monthly average temperature of outdoor air |
θim,a |
design insert temperature of air |
θhru,set |
air temperature at the outlet of recuperation |
τC |
time constant of the building |
Φsol,k |
heat flux from the solar irradiation passing through k-th transparent surface |
ASHRAE |
American Society of Heating, Refrigerating and Air-Conditioning Engineers |
CEN |
Comité Européen de Normalisation / European Committee for Standardisation |
CIBSE |
Chartered Institution of Building Services Engineers |
EE |
Energy Efficiency |
EN |
European Norms |
ISO |
International Organization for standardization |
EPS |
Expanded Polystyrene |
OW |
Outside Windows |
OD |
Outside Doors |
SWH |
Sanitary Water Heating |
- , , Handbook for Energy Advisers (Priručnik za energetske savjetnike)., 2008
- , , Sustainable Energy Planning and Management, 2014
- , , Energy Audit of Building Systems, an engineering approach, 2000
- , , Energy Audit of Building Systems, An engineering approach (second edition)
- , , ASHRAE Fundamentals Handbook, 2017
- , , Degree-days: theory and application, 2006
- , , Energy performance of buildings – Calculation of energy use for space heating and cooling (ISO 13790:2008), 2017
- , , Rolebook on minimum energy efficiency requirements for buildings (Pravilnik o minimalnim zahtjevima energetske efikasnosti zgrada), 2013
- , , Algorithm for calculating the energy required for heating and cooling the building space according to HRN EN ISO 13790 (Algoritam za proračun potrebne energije za grijanje i hlađenje prostora zgrade prema HRN EN ISO 13790)., 2017
- , , Dynamic method for calculating energy need in HVAC systems., 2016
- ,
Comparison of the simplified methods of the ISO 13790 standard and etailed modelling programs in regulatory context ,Journal of Building Performance Simulation , Vol. 1 (4),pp 209-219 , 2008, https://doi.org/https://doi.org/10.1080/19401490802509388 - , http://www.retscreen.net/
- ,
, Clean Energy Project Analyses, RETScreen® Engineering & Cases Textbook , www.retscreen.net - , https://www.reeep.org/projects/retscreen-expert-decision-intelligence-software-platform
- , , Calculation model for optimization design of low impact energy systems for buildings, 2014.
- , A Comparison of Renewable Energy Technologies Using Two Simulation Softwares: Homer and RETScreen, International Conference on Applied Physics and Engineering (ICAPE2016)
- ,
Energy and Comfort management in Energy Efficient Buildings using RETScreen software – A case study analysis. ,International Journal of Engineering Research and Applications. , 2013https://www.researchgate.net/publication/271199732_Energy_and_Comfort_Management_in_Energy_Efficient_Buildings_Using_RETSCREEN_Software-A_Case_Study_Analysis - , , Energy Efficiency of buildings. Methodology of energy audit and calculation of EE indicators (Energetska efikasnost zgrada. Metodologija energetskog pregleda i proračuna indikatora EE)., 2011
- , https://re.jrc.ec.europa.eu/pvg_tools/en/tools.html#MR
- , , Rolebook on energy efficiency of buildings (Pravilnik o energetskoj efikasnosti zgrada)., 2011
- , , Heating and ventilation, Summary of tasks (Ngrohja dhe klimatizimi,Përmbledhje detyrash-1), 1998
- , , Regulation Nr. 02/18 on national calculation methodology for integrated energy performance of buildings (Rregullore Nr. 02/18 për metodologjinë kombëtare për kalkulimin e performancës së integruar energjetike të ndërtesave), 2018
- , , Serie 3: Social statistics (Balanca vjetore e energjisë në Republikën e Kosovës 2018. Seria 3: Statistika Sociale), 2019
- , , Air conditioning (Klimatizacija)., 1998