


Glaciers are large masses of fresh water in solid state, which have been formed from snow and recrystallized ice, which have accumulated and compacted due to low temperatures, over a long time in some geographical areas of the planet [1]. As a consequence of climate change, one of the significant impacts observed throughout the world is the melting of glaciers, establishing itself as an indicator of change.
In Latin America, tropical glaciers are mostly located in the Andes mountain range: 72% in Peru, 20% in Bolivia, 4% in Ecuador and 4% in Colombia. These tropical glaciers have shown an accelerated decline since the mid-1970s.
The influence of climate on glaciers is more important when they are located in temperate zones, such as in the Andes mountain range, where the ice sheet is at a melting temperature: a small increase in temperature is capable of causing the ablation process. Most Andean glaciers fall into this category, except for the parts that exceed 5,800–6000 m elevation, which are generally “cold” glaciers [2]. Glacier retreat is evidence of anthropogenic climate change; however, glacier response times are typically decades or more, implying that current glacier retreat is a mixed response to natural climate variability and current anthropogenic forcing [3]. Remote sensing, using satellite images, is a very viable tool to study glacial areas or surfaces [4]. During the last 40 years, the glaciers of the Peruvian Andes have been reduced by 42.6% [5]. Through multi-temporal analysis in satellite images, it is possible to observe the evolution of snow-capped mountains and glaciers and collect data of great importance to determine the influence of climate change processes on them [6]. The retreat of glaciers in the Peruvian Andes has accelerated during the years that the Niño phenomenon occurs; however, in the years of La Niña, they tend to be stable or increase their coverage [7]. The main factors that influence the amount of rain and its distribution and result in droughts or floods are natural cycles of the climate, especially the El Niño and La Niña phenomena. Both are caused by the displacement of a gigantic mass of warm water located in the middle of the Pacific Ocean, at the latitude of Ecuador. El Niño occurs when the warm water of the sea moves to the east, towards South America (Ecuador and Peru), while La Niña occurs when the water slides towards the western end of the Pacific (Australia and Indonesia). This reciprocating displacement of marine currents is called the El Niño Southern Oscillation. The heat and water vapor exiting the hot water body generate storms so large that they affect air currents that blow through mid-latitudes [7].
The greatest acceleration of the retreat of glaciers has been in the last decades of the 20th century. Tropical glaciers are the primary source of fresh water for some of the largest cities in South America [8]. The Andes are home to more than 99% of tropical glaciers, and Peru contains approximately 70% of them [9]. Since the late 1970s, the glacial retreat can be attributed to human influences on the global climate [10]. Likewise, [11] indicates that, at the end of the 70s, the glaciers seem to have crossed an invisible line towards a state of decline that can be considered unnatural. Ice volumes are known only to a few of the approximately 160,000 glaciers worldwide, but they are important components of many studies on climate and sea level that require estimates of water flow [12]. Tropical glaciers are sensitive to climate change on a spatio-temporal scale and are an important source of hydrological resources [13].
Tropical glaciers have experienced a setback in the recent decade. However, going back several centuries and rebuilding the entire process of deglaciation since the "Little Ice Age", the last maximum glaciers that occurred in this part of the Andes were between the 17th and 18th centuries; the retreat of the Andean glaciers began around 1730–1750. Therefore, it has been before humanity could have a significant influence on the climate [14]. However, the decrease in glaciers has accelerated in the second half of the 20th century, especially after 1976. It can be said that, in the last decades, deglaciation took an unprecedented rate since the previous three centuries, as the glaciers have lost between 35% and 50% of their surface and volume in thirty years. Tropical glaciers in Peru cover an area of 2,500 square kilometer (km2), but they are critical, first because of the water resources they grant to the populations. Glaciers constitute solid freshwater reserves, and because of their great sensitivity to climate change, tropical glaciers represent excellent indicators of climate evolution.
The environmental services of rocky glaciers are similar to those of white glaciers [15]. Among the services related to their use-value, it is mainly their use as a source of water, contribution to climate regulation, the content of information on the geological and climatic past [16], and appreciation in tourism [17]. However, the cycle components are subject to natural variability in inter-annual to ten-year time scales [18]. Some variations in the water cycle, on a global scale, have been related to climate change [19]. On the other hand, human activities like changes in land use and constructions, among others, can influence processes.
For Latin America and the Caribbean, agriculture is an economic activity that represents about 10% of gross domestic product (GDP) and contributes 12% of world agricultural exports [20]. The retreat of glaciers is balanced with the smallest temperature increase and accelerates with the increasing air temperature. The results coincide with studies conducted in the Andes of Peru [21].
Remote sensing, through the use of satellite images, is a very viable and useful tool to study areas or surfaces of glaciers [22]. Similarly, the use of images from active sensors makes it even easier to obtain information on displacement surfaces, such as Differential Radar Interferometry – DInSAR, a technique that has been used in different parts of the world to study glaciers [23].
On July 23, 1987, the Ampay National Sanctuary was established in Peru by Supreme Decree No. 042-87-AG to conserve the species Intimpa (Podocarpus glomeratus) within its ecosystem. The Intimpa is the only genus of South American conifer [12].
Tropical glaciers are sensitive to climate change on a spatio-temporal scale and are essential for hydrological resources [24]. These changes significantly alter water availability in the region and pose critical risks to local populations that are highly dependent on these resources for their livelihoods [25].
The investigation of the retreat of the glacier surface in the Ampay National Sanctuary is carried out using the historical series of Landsat images. It applies the normalized snow difference index between the years 1991 to 2017. The meteorological data from the Tamburco and Abancay stations have been considered for determining the situation of deglaciation and quantification of the glacier retreat in Nevado Ampay [26].
The use of these tools facilitates obtaining information on glacial surfaces. It has been hypothesized that the snowy Ampay presents an evident glacial retreat in the last 25 years due to the variability of climatic factors (precipitation and temperature), endangering the water resource.
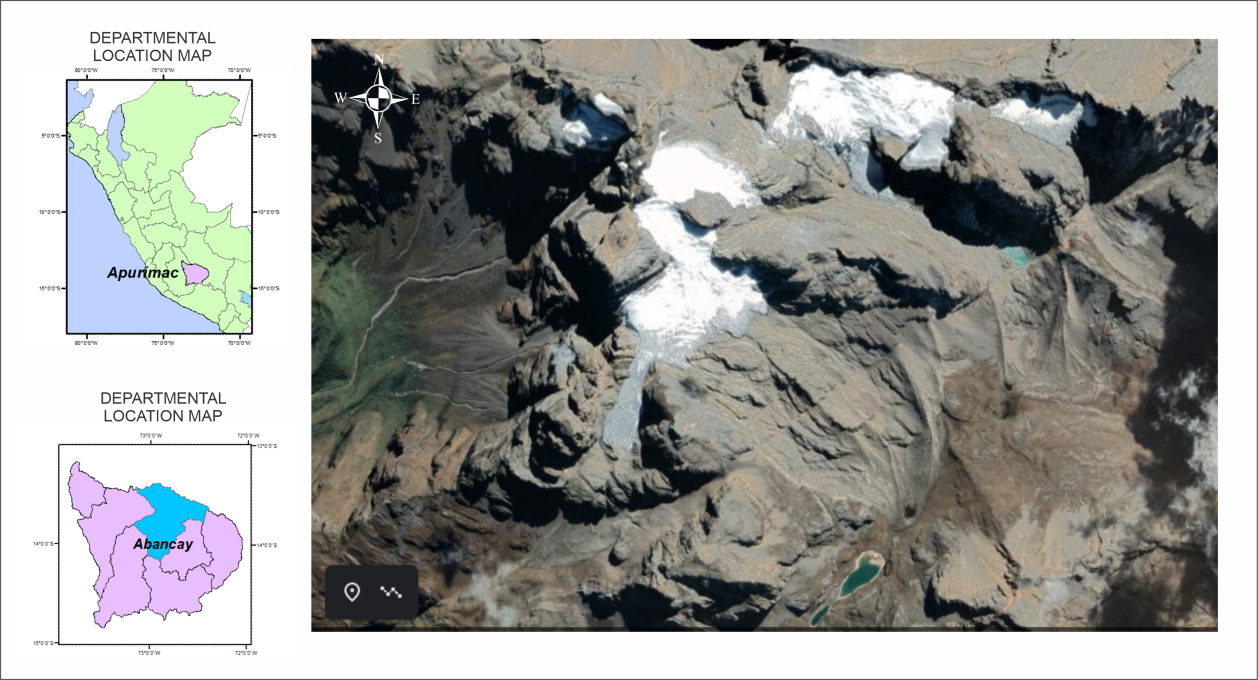
The Ampay glacier is part of the Cordillera de Vilcabamba in the region of Apurimac, province of Abancay; its maximum altitude is 5,235 meters above sea level, and it is located geographically at the coordinates 72°55' to 72°54' west longitude and 13°33' to 13°34' south latitude. Access to the Ampay glacier from the city of Abancay is by paved road and road travelling 51 kilometer (km) to Karcatera, where it is possible to find informative signs, and then follow a 6-hour road to reach the base camp. The climate in Abancay is 16.7 ºC annual average temperature and 685 millimeter (mm) annual average rainfall [27]. The investigation has been carried out with a duration of 12 months in the mountain of the Ampay glacier; the area of the ice caps has been visited.
Land use has substantial restrictions in this area due to its proximity to the Ampay National Sanctuary protected natural area, a buffer zone. The glacier is a water reserve that allows the productive activities of the peasants to be prolonged in the buffer zone of the Ampay National Sanctuary and the valley of the Pachachaca River. The rural populations near the Ampay National Sanctuary are grouped into Peasant Communities (C.C.) and in Associations of Small Agricultural Producers (A.P.A.) that make a total of nine groups [28]. Figure 1
Location of the glacier in the Ampay National Sanctuary
The present study has determined the changes in the glacial surface area between 1991 and 2017 by using and processing optical satellite images [29]. There are different techniques for extracting and mapping snow cover on a satellite image [30]. Spectral Indices (IE) techniques [31] have been used in satellite images of the Landsat 8 OLI/ TIRS (Operational Land Imager / Thermal Infrared Sensor) [32], which is a method that compares the spectral information of one band with another to distinguish the coverage of snow among other covers [33]. Trend design and evolutionary analysis have been used. Landsat images files union has been used, the atmospheric correction has been obtained, the supervised classification and the filter have been obtained, and the raster format has been converted to the vector one and the glacier area to get images of glacial retreat [34].
For the analysis of the multi-time evolution of the Ampay glacier the images are shown:
-
Band 2 green: 0.52–0.60 micrometer (µm); specially designed to evaluate the vigor of healthy vegetation, measuring its green reflectance peak (or radiance). It is also useful to differentiate types of rocks like band 1, to detect the presence or not of limonite.
-
Band 3 red: 0.63–0.69 µm. It is a chlorophyll absorption band, very useful for the classification of the vegetation cover. It also serves in the differentiation of the different rocks and to detect limonite.
-
Band 4 infrared (IR) near: 0.76–0.90 µm. It is useful to determine the content of biomass, for the delimitation of water bodies and for classification of rocks of different ages, but also to see the perception of glacial retreat. The statistical evaluation (Pearson’s test) has been performed to correlate glacier retreat with precipitation and temperature data for the correlated climatic variability of the study area.
The determination of the glacier retreat in the study area has been carried through the use of satellite images of Landsat 6 type 5, 7 and 8. The satellite images allow obtaining the information required to determine the retreat of the glacier and the volume of ice lost.
To estimate glacier coverage in the study area from Landsat 5 Thematic Mapper (TM) and Landsat 8 OLI/TIRS images, the Normalized Snow Difference Index (NDSI) [30] has been used [31].
Regarding the multi-temporal evolution of each one of the mentioned periods, the analysis shows the images of Landsat 8 (bands 7, 5, 4), Landsat 7 (bands 5, 4, 2), and Landsat 5 (bands 4, 3, 2); all these in natural colour combinations of light visible to the human eye, which has allowed differentiating the glacier cover to determine glacial retreat in the Ampay. For the assignment of the thresholds, the NDSI (Normalized Difference Snow Index) raster, raster to polygon conversion were used; these elements were main. To avoid confusion of shadows with glaciers and have a reliable result, satellite images were introduced available in ArcGIS 10.3 software.
Database to estimate glacier cover
The information used is based on satellite images Landsat 2 MSS (Multispectral Scanner), Landsat 5 TM (Thematic Mapper), and Landsat 8 OLI/TIRS (Operational Land Imager / Thermal Infrared Sensor), with a spatial resolution of 60 m (meters), 30 m and 30 m, respectively, included between the periods 1991–2017 with projection of UTM (Universal Transverse Mercator) map, WGS (World Geodetic System) 84 datum, zone 19 south, in GeoTIFF format and Geographic Coverage (path 002, 003 and row 070).
The Landsat 2 MSS information is made up of four spectral bands; two in visible and two in near infrared. Landsat 5 TM operates simultaneously in seven spectral bands, three being visible, one in the medium infrared, two in the near infrared and one thermal band [32]. Landsat 8 is made up of nine spectral bands on the OLI (Operational Land Imager) sensor and two bands on the TIRS (Thermal Infrared Sensor).
Geometric correction. At this stage, the ND (Normal Difference) pixels were moved to their geo referenced positions without modifying the values of the Landsat MSS image, so that they coincide precisely with the Landsat OLI image. The MSS image captured by Landsat 2 has been corrected using the empirical control point method, based on the Landsat 8 OLI/TIRS image. For this methodology, it has been necessary to establish control points coordinate transformation using a polynomial function and the cubic convolution method to transform gray levels [35].
Creation of the file in pcidsk. The Smart Ware Physical Index, PIX of each image is carried out, generating a single file with the information of 5 bands of each image.
Atmospheric correction. In this process, the radiance values are converted to reflectance values and indices of spectral bands, using the FLAASH tool (Fast Line-of-sight Atmospheric Analysis of Hypercubes) of ENVI 5.3 software [36]. The necessary input data include the average elevation of the area in kilometers, satellite imaging date, solar elevation angle, solar azimuth, sensor type, and sensor altitude.
Estimate of areas covered by glacier
To estimate glacier coverage in the study area from Landsat 5 TM (Thematic Mapper) and Landsat 8 OLI/TIRS images, the Normalized Snow Difference Index (NDSI) has been used [37]. It is calculated using Eq. (1) for Landsat images [31] as follows:
(1)
where: VIS– index of visible light band (380–780 nm),NIR– index of near infrared band (780 nm–2.5 µm).
The NDSI is an index used to detect the presence of snow in a specific area. To obtain its value using spectral bands defined for the different Landsat satellites, the indices of the image bands must be processed as follows:
|
LANDSAT 4/5: NDSI = Band2 – Band5 / Band2 – Band5 |
(2) |
|
LANDSAT 5–7: NDSI = (Band2 – Band5) / (Band2 + Band5) |
(3) |
|
LANDSAT 8: NDSI = (Band3 – Band6) / (Band3 + Band6) |
(4) |
For the identification of snow, the authors of [38] indicated that NDSI> 0.4. Shadow and cloud interference were removed manually, according to the procedure carried out by [39]. Field trips were made to the Ampay glacier for the in-situ execution of the experimental part and validation of the results obtained from satellite images.
Climate data analysis
The analyzed climatic factors included temperature and precipitation from 1991 to 2017, and for the study of the retreat of the Ampay glacier surface, the data including temperature and precipitation were obtained from the National Meteorology and Hydrology Service (SENAMHI) from the San Antonio station in the Tamburco-Abancay District.
Figure 2 shows the temperature variability over the years, from 1991 to 2017. It is relevant to note that in 2010 the maximum annual temperature of 16.84 °C is reached. From this record a clear decreasing trend is shown until 2017. The variability of the temperature has been more noticeable in the three years from 2015 to 2017, where the lowest temperatures have been recorded within the last ten-year period .
Annual average temperature in the period 1991–2017
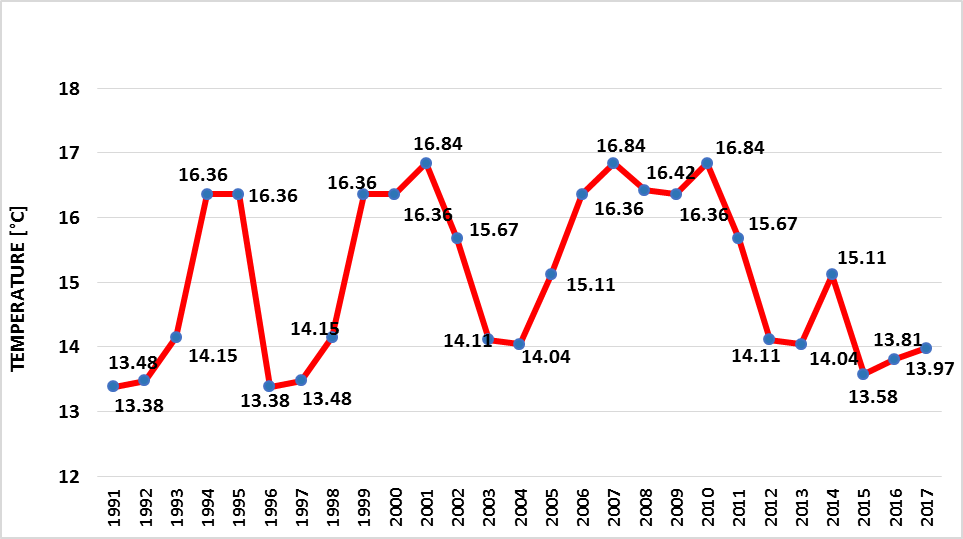
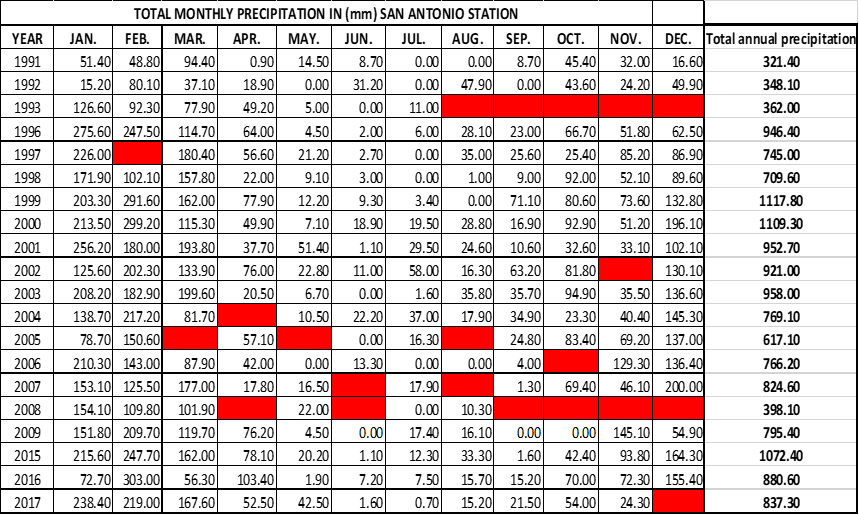
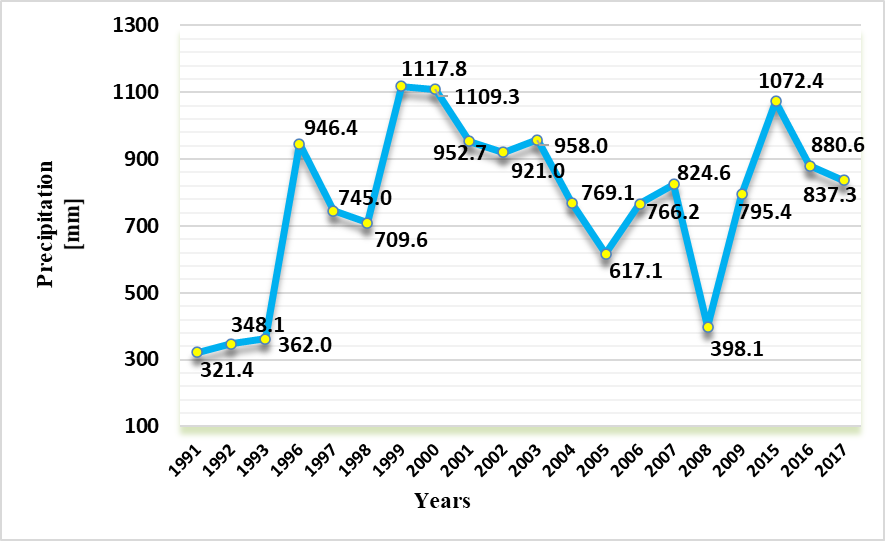
Figure 3 shows the total monthly precipitation produced between the years 1991 and 2017, and Figure 4 shows annual precipitation for the last 20 years. In the years 1991 to 1993, low rainfall is shown with an average of 344 mm. In the years 1998 to 2001, the increase in rainfall was to an average of 972 mm; in 2015, the precipitation increased to 1072.4 mm. The data show that in recent years, the annual rainfall has increased relative to 1991. Figure 4
Total monthly precipitation in millimeter (m), San Antonio station – Abancay
Total annual precipitation in the period 1991-2017
The application of glacier surface estimation methods from Landsat images demonstrates the existence of historical data from 1975 to the present day in the Ampay glacier. Considering the data obtained from SENAMHI that indicate the increase in temperature and average precipitation between 1991 and 2017, the rise in temperature and precipitation have broken the natural balance in the thawing of the glacier.
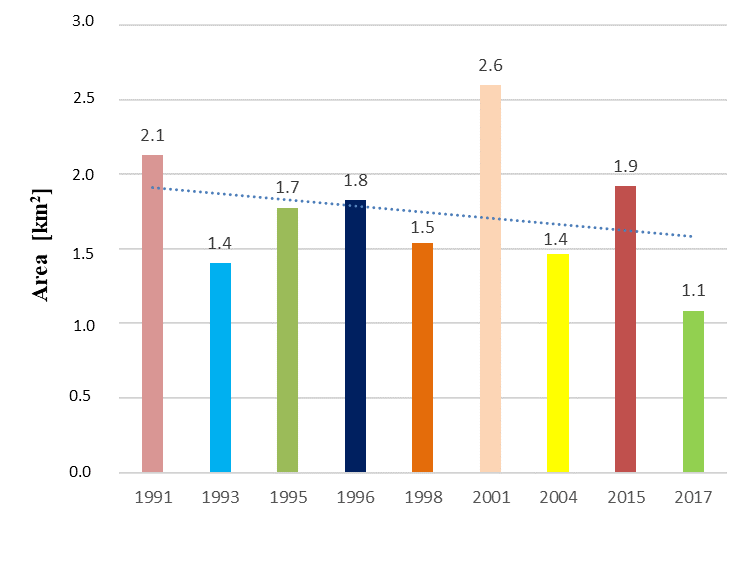
The area of the glacier is established in square kilometers (km2) per year. In 1991 there were 2.126 km2, in 2001 – 2.595 km2, in 2015 it decreased to 1.919 km2, and in 2017 there were 1.086 km2. A decrease of 1.040 km2 occurred from 1991 to 2017, representing a 48.92% loss of the surface of the Ampay glacier.
Figure 6 (6a–6i) presents the variations using optical images of glacial melting for the Ampay snowfall understudy between 1991 and 2017. According to the results, they show a significant decrease in the glacial surface from 1991 to 2017.
By analysing the main components with the bands of the images from 1991, 1993, 1996, 2001, 2015, 2016, and 2017, 10 components have been obtained as presented in Figure 5 and Figure 7.
Multi-temporal evolution of the retreat of the Ampay glacier
The investigation has been based on the results of the multi-temporal evolution of each of the periods mentioned. The analysis shows the images of Landsat 8 (bands 7, 5, 4), Landsat 7 (bands 5, 4, 2), Landsat 5 (bands 4, 3, 2); all these combinations of natural colour, for the light visible to the human eye, which has allowed to differentiate the glacier cover for the determination of the glacial retreat.
Table . Glacier retreat as a function of time
|
Year |
Glacier area [km2] |
Glacier retreat [km2] |
|
1991 |
2.126 |
1.04 |
|
2017 |
1.086 |
Table 1 shows the retreat of the glacier from 1991 to 2017 has been 1.04 km2. During this time, the evolutionary curve has significantly varied because there have been years of recovery and others retreating the glacial surface. This differences in the retreat rate of the Ampay glacier show that more factors are allowing the glacial surface to decrease as shown in Table 2.
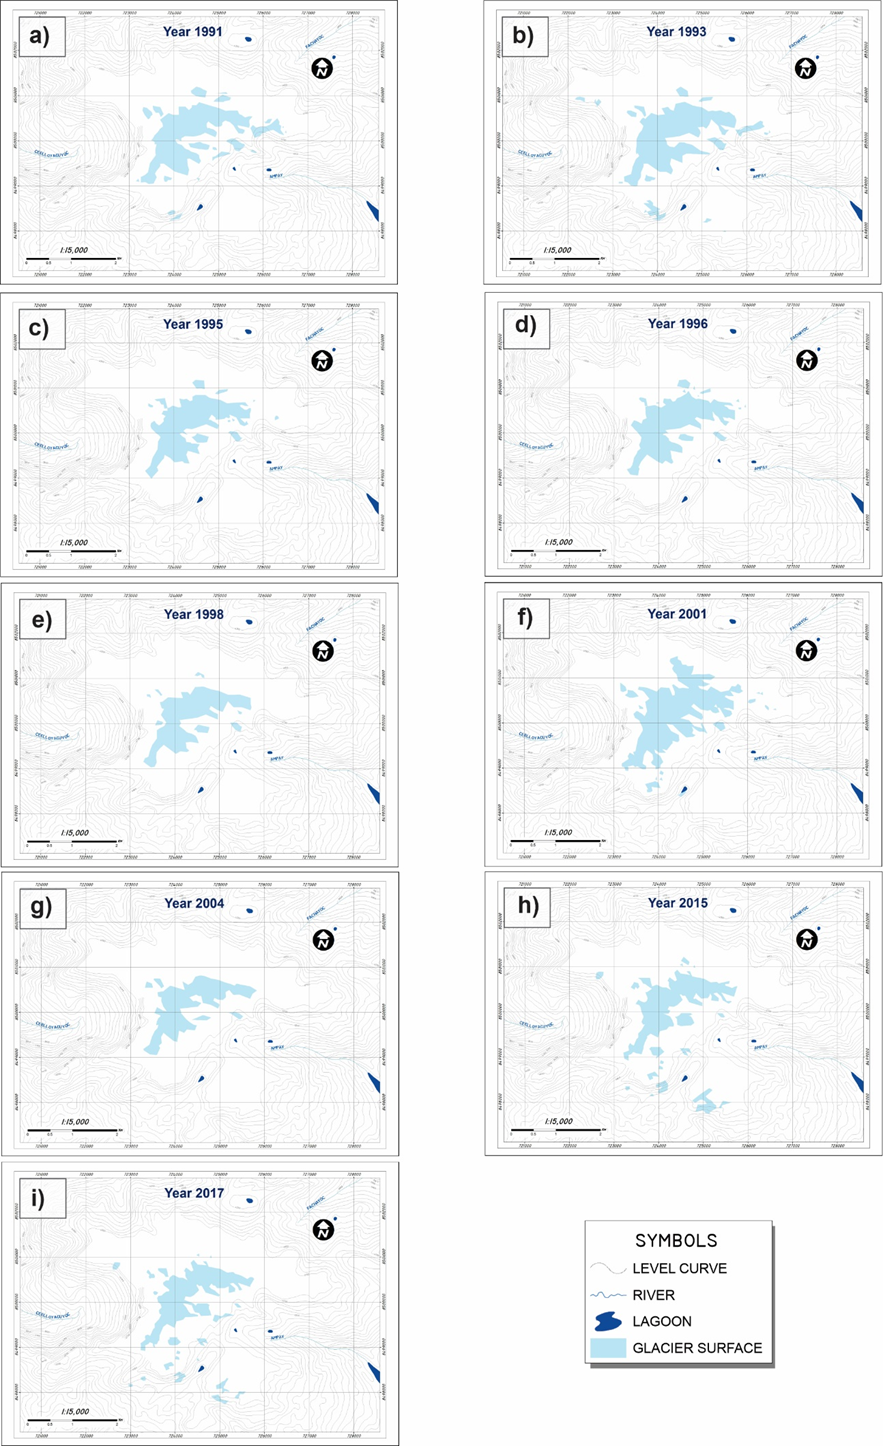
Multi-temporal evolution of the glacier by area images: 2.126 km2 in 1991 (a), 1.402 km2 in 1993 (b), 1.777 km2 in 1995 (c), 1.826 km2 in 1996 (d), 1.542 km2 in 1998 (e),
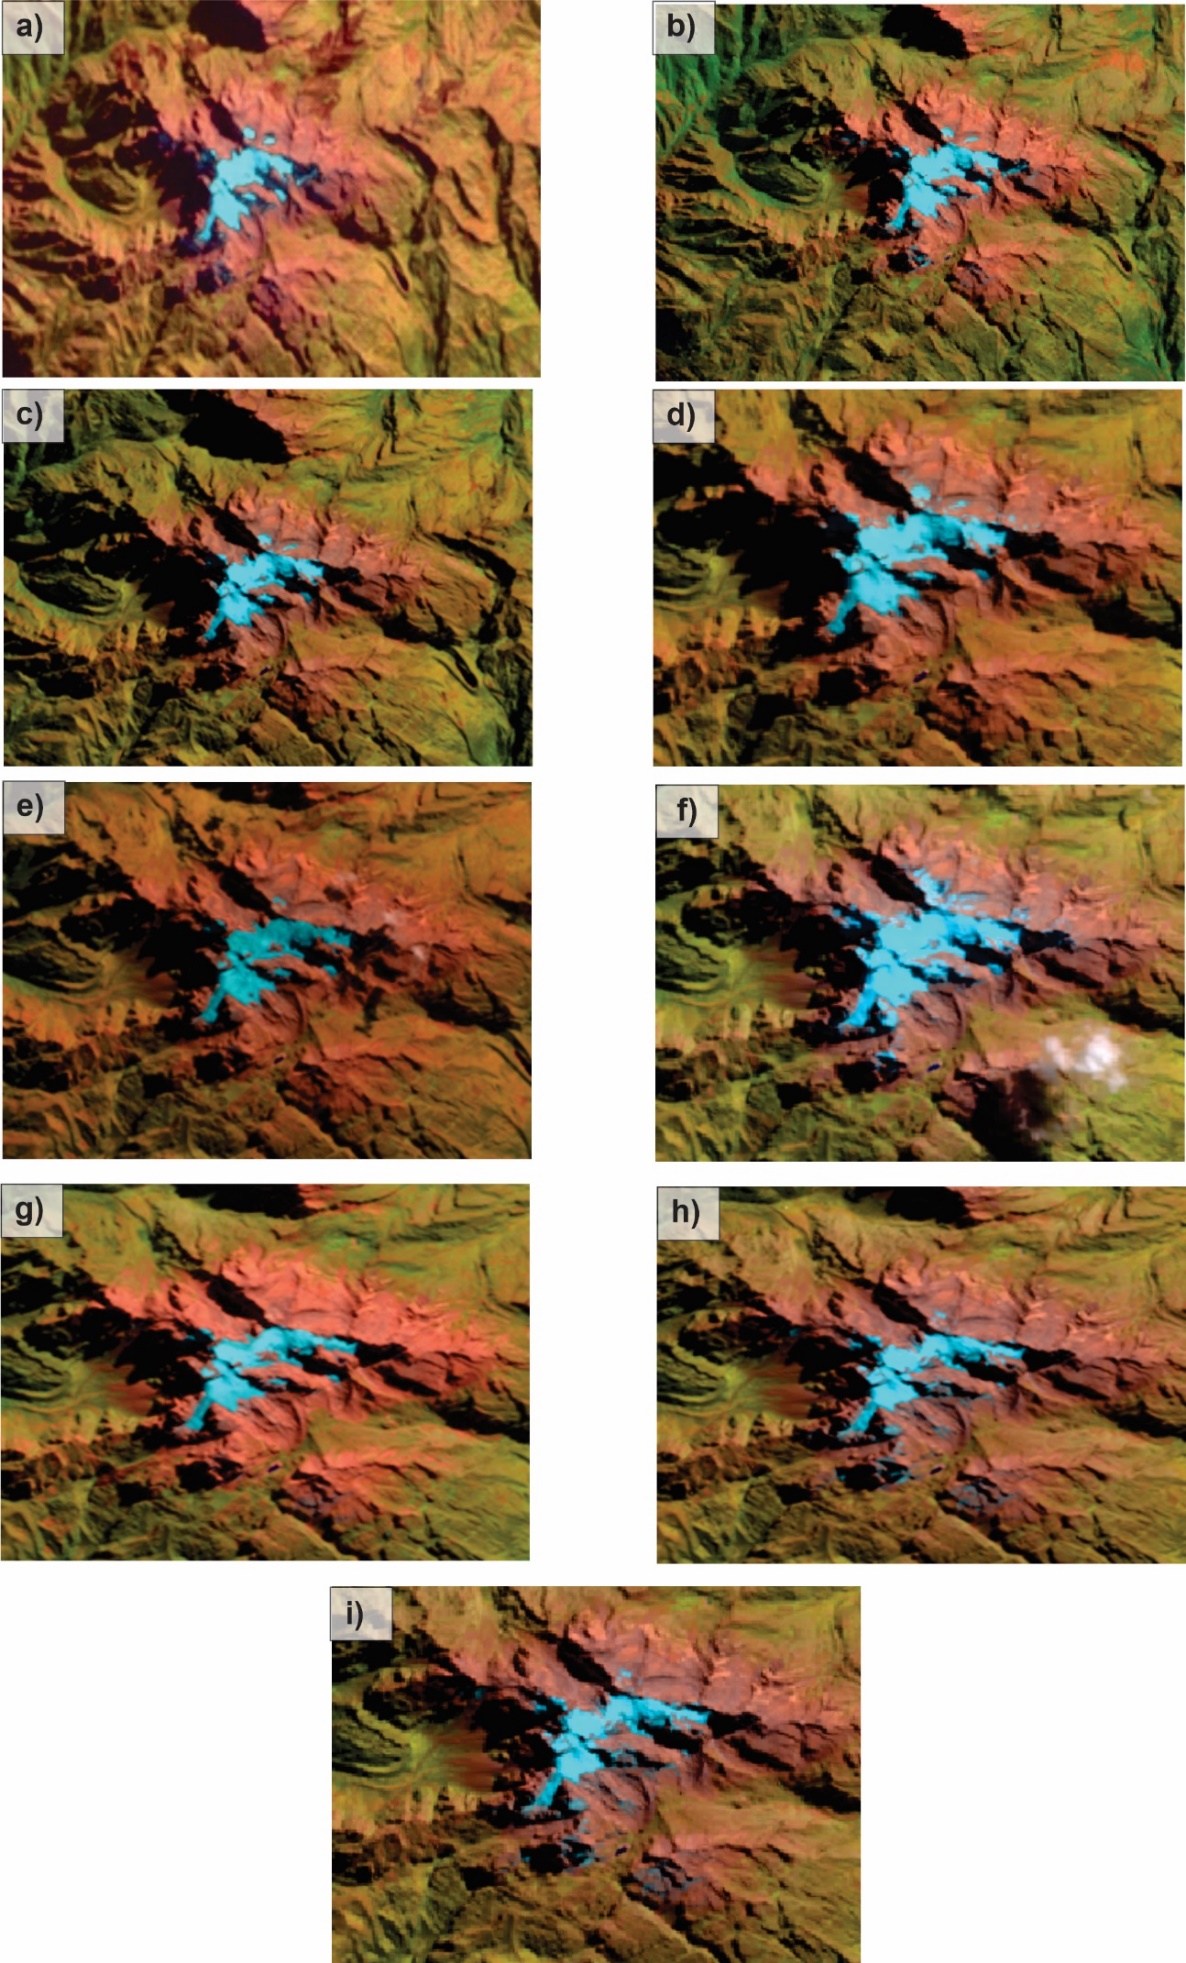
2.595 km2 in 2001 (f), 1.468 km2 in 2004 (g), 1.919 km2 in 2015 (h), 1.086 km2 in 2017 (i)
Table 2 shows that the glacier surface in 1991 was 2.126 km2 and progressively decreased with slight recoveries in 2001 (2.595 km2) and 2015 (1.919 km2). In 2017 there was a decrease in the surface to 1.086 km2.
Multi-temporal evolution of the glacier 1991 to 2017
|
Launching and product |
Glacier [km2] |
Year |
|
Landsat TM 5 |
2.126 |
1991 |
|
Landsat TM 5 |
1.402 |
1993 |
|
Landsat TM 5 |
1.777 |
1995 |
|
Landsat TM 5 |
1.826 |
1996 |
|
Landsat TM 5 |
1.542 |
1998 |
|
Landsat TM 5 |
2.595 |
2001 |
|
Landsat TM 7 |
1.468 |
2004 |
|
Landsat TM 7 |
1.919 |
2015 |
|
Landsat TM 8 |
1.053 |
2016 |
|
Landsat TM 8 |
1.086 |
2017 |
Figure 7 illustrates the evolution of the retreat of the surface from 1991 to 2017. There is a visible difference in the glacier surface of 1991 (Figure 7a) compared with the glacier surface of 2017 (Figure 7i).
The investigation of the retreat of the glacier surface in the Ampay National Sanctuary is carried out using the historical series of Landsat images. It applies the normalized snow difference index between the years 1991 to 2017. The meteorological data from the Tamburco and Abancay stations have been considered to determine the deglaciation and quantify the glacier retreat.
The Landsat 5 TM (Thematic Mapper) images operate simultaneously in seven spectral bands, three being visible, one in the middle infrared, two in the near infrared, and one in the thermal band [31]. The retreat of the glaciers is balanced with the lower increase in temperature and is accelerated with the increase in air temperature [32]. Temperature within climate change has been a determining factor in the retreat of the Ampay glacier during the last two decades (1991–2017).
The NDSI (Normalized Difference Snow Index), raster calculator and raster to polygon have been used to assign the thresholds; these three elements were used to avoid the confusion of shadows with glaciers and thus have a reliable result [29]. Satellite images have been introduced, available in ArcGIS 10.3 software [40]. To estimate glacier coverage in the study area from Landsat 5 TM and Landsat 8 OLI/TIRS images, the NDSI has been used [37].
At the beginning of 2000, tropical glaciers covered 1920 km2 in total. Almost all of them were in the Andes between Colombia and Bolivia, with predominance in Peru (70%) and Bolivia (20%) [38]. Despite their small size in terms of volume – equivalent to less than 0.3 millimeter rise in sea level, these glaciers are essential for two reasons: firstly, they are excellent indicators of the trend, evolution, and climatic fluctuations over several decades, being, without doubt, the best of the tropical zone; secondly, they play a prominent role in the hydrology of upper basins and contribute to water resources.
The acceleration of the deglaciation that has begun to affect the water resource is indisputable. However, the issue is complex [41]. On the one hand, the decrease in the ice reserve increases resource availability. Still, on the other hand, the resources diminish when the ice masses are reduced too much to maintain them, particularly during the dry season.
Evolution of the Ampay glacier surface, 1991–2017
However, the continuous deterioration of the glaciers will have inevitable consequences in the upper glacial basins and the water resource and ecosystems linked to ice masses [39].
The highest percentage of loss of glacial surface in the Ampay glacier occurs in times of ablation where the maximum and minimum temperatures are higher. There is an inverse relationship between the temperature and the decrease in the glacier surface, which indicates a smaller surface area at higher temperatures [42]. The loss of glacial surface is associated with temperature increase, resulting from greenhouse gases [43].
There is also an inverse relationship between precipitation and loss of glacial volume – the higher the rainfall, the lower the increase in the snow volume of glaciers. The greatest impact on the loss of glacial volume occurs in seasons of ablation where rainfall is low, and the glacier’s behavior shows a tendency to recede. This leads to the conclusion that the scarce precipitation in the ablation season does not contribute to the glacier’s stability since it does not generate accumulation on its surface [44].
The Ampay glacier is a source of water supply that accumulates in several lagoons that are part of the Pachachaca river basin. The potential of spatial visualization methods to monitor glacier covers is a fairly effective method, which can significantly help to understand and track glacier mass movements [45].
In recent years the glacial surface of the Ampay has receded, revealing its "fresh" moraines. Due to the current distance from the glacier, three lagoons that are part of the melt chain have dried up, and those that are still reservoirs have decreased their volume by up to 50% compared with the volume of 1997. The accelerated deglaciation of the Ampay constitutes a threat to the population; as a reserve water resource for the city [46], the parameters of temperature, precipitation and relative humidity have a significant influence on the behavior of the Ampay glacier [47].
Through the use of the historical series of Landsat images and the normalized snow difference index, the situation of deglaciation and quantification of the retreat of the Ampay glacier has been determined. The use of the Normalized Differential Snow Indices – NDSI tool has allowed the delimitation of the glacier surface. The multi-temporal analysis of the glacier surface estimated from satellite images shows a significant decrease in the coverage of the Ampay glacier area in the last two decades (2001–2017) with a loss of 1.04 km2 (48.92%), as a consequence of climate variability (meteorological components of precipitation and temperature). In 2015 a recovery occurred in the area of the Ampay glacier to 2.595 km2. Still, in the following years, it has been decreasing to reach 1.086 km2 in 2017, without forecasting that the glacial retreat will continue in the coming years, putting at risk the availability of water resources as a water reserve.
ACKNOWLEDGMENT
To the Swiss Cooperation, through the Andean Forests program, who have sponsored the culmination of the research.
|
NDSI |
normalized differential snow index |
[-] |
|
NIR |
index of near infrared band |
[-] |
|
VIS |
index of visible light band |
[-] |
|
|
||
|
IR |
Infrared |
|
|
MSS |
Multispectral Scanner |
|
|
OLI |
Operational Land Imager |
|
|
SENAMHI |
National Meteorology & Hydrology Service |
|
|
TIRS |
Thermal Infrared Sensor |
|
|
TM |
Thematic Mapper |
|
- ,
The Colombian Glaciers, Expression of Global Climate Change ,Institute of Hydrology, Meteorology and Environmental Studies, IDEAM ,pp 3-4 , 2000 - ,
Glaciers of Colombia, more than mountains with ice ,Glaciers of Colombia: More than mountains of snow , Vol. 1 , 2012 - ,
Detection of changes in the area of the Nevado glacier between 1985 and 2014 using Landsat images ,Department of Geography, Universidad del Valle, Cali, Colombia , 2014 - ,
National Glacier and Lagoon Inventory , 2014 - , Multi-temporal analysis between 1975 and 2015 on changes in glacier coverage in the snowy Allin Capac and Chichi Capac, Peru, Altoandinas Research magazine, 2017
- ,
Hydrological and depositional processes associated with recent glacier recession in Yanamarey Catchment, Cordillera Blanca (Perú) ,Science of The Total Enviroment , 2017, https://doi.org/https://doi.org/10.1016/j.scitotenv.2016.11.107. - ,
A Review of the Modern Fluctuations of Tropical Glaciers ,Global and Planetary Change , Vol. 22 (1-4),pp 93-103 , 1999 - ,
Climate change and tropical Andean glaciers: Past, present and future ,Earth-Science Reviews , 2008, https://doi.org/https://doi.org/10.1016/j.earscirev - ,
Feedbacks and mechanisms affecting the global sensitivity of glaciers to climate change ,Cryosphere , 2014, https://doi.org/https://doi.org/10.5194/tc-8-59-2014 - ,
Glacier retreat crosses a line ,Science , 2014, https://doi.org/https://doi.org/10.1126/science.1258584 - , The physical basis of glacier area-volume scaling, Journal of Geophysical research, 1997
- ,
Tracing tropical Andean glaciers over space and time: Some lessons and transdisciplinary implications ,Global and Planetary Change , Vol. 60 (12), 2008 - ,
Current state of glaciers in the tropical Andes: a multi-century perspective on glacier evolution and climate change ,The Cryosphere , Vol. 7 (1),pp 81-102 , 2013 - , Global warming, glaciers and gold mining, Transformation, Innovation and Adaptation for Sustainability, 8th International Conference of the European Society for Ecological Economics, 2009
- ,
Rockglaciers: Indicators for the Present and Former Geoecology in High Mountain Environments ,Springer-Verlag Berlin Heidelberg, Berlin, Germany ,pp 331 , 1996 - ,
Kluane National Park and Reserve of Canada Summary of Trails and Routes: Rock Glacier Trail , - ,
Intergovernmental Group of Experts on Climate Change ,Climate change , 2007 - ,
The Stern Review and the economics of climate change: an editorial essay ,Climatic Change , Vol. 89 ,pp 231-240 , 2008 - ,
Climate change and trade in agriculture ,Food Policy ,pp S9–S13 , 2011 - ,
Intergovernmental Panel of Experts on Climate Change. Climate Change and Water , 2008 - ,
Latin American responses to the challenge of climate change , 2009 - ,
Applications of SAR interferometry in earth and environmental science research ,Sensors , Vol. 3 (9),pp 1876-1912 , 2009 - , , Regional Strategy for Biological Diversity of the Apurímac Region PARDB-APURIMAC, 2014
- ,
Glacier recession and human vulnerability in the Yanamarey watershed of the Cordillera Blanca, Peru ,Climatic Change , Vol. 1 (105), 2011 - ,
Toward hydro-social modeling: Merging human variables and the social sciences with climate-glacier runoff models (Santa River, Peru) ,Journal of Hydrology , (518:60-70), 2014 - ,
Change in tropical landscapes: Implications for health and livelihoods ,Ecologies and Politics of Health. Routledge, New York ,pp 55-72 , 2013 - ,
Potential Phytoremediator of Native Species in Soils Contaminated by Heavy Metals in the Garbage Dump Quitasol-Imponeda Abancay ,J. Sustain. Dev. Energy Water Environ. Syst , Vol. 7 (4),pp 584-600 , 2019 - , Bases for the elaboration of the Project Master Plan: Ampay National Sanctuary, Abancay Province, Apurímac Department, 2001
- ,
Digital image information extraction techniques for snow cover mapping from remote sensing data ,Encyclopedia of Snow, Ice and Glacers ,pp 213-232 , 2011 - ,
Glacier mapping: a review with special reference to the Indian Himalayas ,Progress in Physical Geography ,pp 672–704 , 2009 - ,
Glacier change estimation using Landsat TM ,International archives of the photogrammetry, remote sensing and spatial information science , Vol. 36 , 2006 - ,
Semi-automatic glacier delineation from Landsat imagery over Hintereisferner in the Austrian Alps ,Zeitschriftur Gletscherkunde Undglazial geologie ,pp 55-75 , 2007 - ,
Development of methods for mapping global snow cover using moderate resolution imaging spectroradiometer data ,Remote Sensing of Environment , Vol. 52 (2),pp 127–140 , 1995 - ,
Spectral signature of alpine snow cover from the landsat thematic mapper ,Remote Sensing of Environment , Vol. 28 ,pp 9–22 , 1989 - ,
Exploring hydrologic connections between tropical mountain wetlands and glacier recession in Perus Cordillera Blanca ,Applied Geography , Vol. 78 (94103), 2017 - ,
Summary of current radiometric calibration coefficients for Landsat MSS, TM, ETM+, and EO-1 ALI sensors ,Remote Sensing of Environment , Vol. 113 , 2009 - ,
A new approach for estimating mangrove canopy cover using Landsat 8 imagery ,Computers and Electronics in Agriculture , Vol. 135 (183194), 2017 - ,
Evaluation of a useful method to identify snow covered areas under vegetation comparisons among a newly proposed snow index, normalized diference snow index, and visible reflectance ,International Journal of Remote Sensing , Vol. 27 (21), 2006 - ,
El rápido retroceso de los glaciares en los Andes tropicales: Un desafío para el estudio de la dinámica de los ecosistemas de alta montaña ,Ecología en Bolivia , Vol. 48 (2),pp 69-71 , 2013 - ,
Multitemporal and multifractal analysis of the deglaciation of the Cordillera Parón in the Andes of Peru ,Análisis multitemporal y multifractal de la deglaciación de la Cordillera Parón en los Andes de Perú. Ecología Aplicada , Vol. 13 (1),pp 35–42 , 2014 - ,
Ecology of Land Cover Change in Glaciated Tropical Mountains ,Revista peruana de biología , Vol. 21 (3),pp 259-270 , 2014 - , Application of Remote Sensing as a tool for Multitemporal analysis of glacier retreat in the Nevado Pastoruri due to Climate Change, 2012
- ,
Análisis del retroceso glaciar del volcán nevado del Ruíz, mediante un estudio multitemporal de imágenes satelitales del periodo 1999-2016 ,Revista de Topografía Azimut , Vol. 9 ,pp 9-16 , 2018 - , Environmental factors of temperature and precipitation that affect the dynamics of the Pastoruri glacier mountain, 2017
- , Glacier Water Availability in the Mariño Micro basin, taking into account the glacial retreat in the years 1970-2017 with a projection to 2050, 2017
- ,
Glacier retreat in the mountains of the Peruvian Andes Case: National Sanctuary of Ampay, Apurimac ,Sciencie and Developmeent , Vol. 16 (1),pp 5-16 , 2013 - , Impact of climate change on the glacial retreat of the Sahuanay river sub-basin, province of Abancay in 2017, 2018