


Water resource management has become a real challenge in many countries including Egypt especially during the current crises of Grand Ethiopian Renaissance Dam which is built on the main Egyptian water source, the Nile River. This motivated an increased interest in water desalination projects. In addition considering the worldwide awareness of the significance of environmental pollution problems, emphasis has been shifted to adopt renewable energy sources to power desalination plants in an effort to reduce CO2 and other pollutants' emissions.
The availability of water and energy is essential for human being life; hence they are crucial for the growth and development of human societies. Increased population rates, climate change, rising urban growth, and industrialization have increased demands for freshwater worldwide. Although more than 70% of the surface of the Earth is covered with water, most of it is not suitable for human use. The sum of all water sources on Earth is around 1.4 billion cubic kilometers, 97.5% is absorbed by the ocean [1], 2.5% can be stored in the atmosphere like icebergs, wetlands, lakes, rivers, and groundwater. Only 0.014% of these resources are appropriate for use. Shortage water supply is expected to become the most significant problem of the current century. Nowadays, the conventional desalination plants have significant costs and are high energy-consuming, which will make them more competitive and economical. Rising demands for water have resulted in increasingly growing potential for desalination installations worldwide. For this purpose, ongoing efforts are directed to increase desalination plant productivity in order to reduce the costs. The world's water desalination capability exceeded about 95.37 million cubic meters per day in 2019 which are produced from 15,906 desalination plants worldwide [1].
Water resource management in modern Egypt has become a dynamic process involving multiple stakeholders, using irrigation water, industrial water supply, hydropower development, and marine navigation. The main source of water in Egypt is the Nile River which people should pay more attention to make use of every drop and every loss to the minimum. The gap between significantly increasing water demand and insufficient supply is a major water resource management challenge in Egypt. Water demand, for each sector in Egypt, is illustrated in Figure 1 [2]. Ibrahim et al., discussed the gap between significantly increasing water demand and insufficient supply in Egypt [2] that will increase more than 50% by 2030 [3]. Water desalination plants generate 1,100,000 m3/day [4], with plans to add about 2,44 million m3/day by 2025 [5].
However, applied water desalination technologies often have harmful effects on the environment. In desalination plants, there are many consequences to be addressed, such as land usage, groundwater, the aquatic environment, noise, and the use of electricity, among others. So, desalination systems relying on renewable energy sources have a crucial role nowadays.
Emphasis has shifted to using renewable energy sources to power desalination in an effort to reduce carbon footprint resulting from high energy-consuming desalination processes. The use of renewable resources such as wind or solar to power desalination plants proved to lowers energy costs. The percentage of energy generated from renewable sources (RE) and used in the desalination systems today is about 1% [6]. The use of renewable energy is growing through; developing the technology, reducing the cost of equipment and emphasizing fossil fuel massive contribution in environmental problems. A lot of work has been done in this field for the past few years which led to the increased use of renewable energy. In Egypt, the cost of using fossil fuels has increased and investing in the renewable energy market became a competing alternative. The competition between renewable energies and fossil fuels, in the coming years, will be viable. Solar desalination is a good option for small communities where energy supplies are not available, and solar radiation is abundant. Solar desalination is a cost saving option since solar power is an unlimited source of electricity, and is readily available in vast areas.
Solar desalination systems' efficiency depends on their design, and climatic conditions. In some cases, concentrated solar power may be used for distillation or photovoltaic plants could be used for the membrane desalination systems [7]. Small desalination systems can be integrated with wind energy converters, to supply required energy to desalination units. In this case, it is economically viable to supply the small urban islands with wind energy for freshwater which is more appropriate than selling potable water to the inhabitants. Wind turbines can also be operated in an on-grid connection [8]. Wind turbines are recommended for large islands, though photovoltaic modules can be added to the coupling scheme too. The decision is much more difficult in case of small islands, and the solution is not simple because the cost per kilowatt of small wind turbines is considerably higher than for large wind turbines. PV modules are feasible in these islands and the decision is for PV cell design and location only. The payback period is 6 years for some wind energy projects, and 2.3 years for solar PV plants [9], [10]. Various studies on the installation of wind energy and photovoltaic panels for desalination and freshwater production were presented, some of these studies showed that required power supply is secured throughout the year using hybrid systems as discussed following. Table 1 exhibits a discussion of these different studies and their results relevant to desalination systems using RO unit especially renewable energy sources.
Different studies of water desalination systems
Ref. |
Authors |
Work Layout |
Results |
[2] |
Ibrahim et al. |
The best possible performance of (off-grid) renewable energy combinations in Egypt; solar photovoltaic and wind desalination systems using (HOMER) package software. |
The cost of electrical power is 0.2252 $/kWh and the cost of water is 1.10 $/m3 for the PV case while the cost of electrical power is 0.1216 $/kWh and the cost of water is 0.56 $/m3 for the second case of WT. |
[11] |
Rajaee et al. |
Novel description of earlier works on membrane methods and collector forms that shed light on the important role of solar energy in the production of human drinking water. |
A critical review of osmotic desalination by solar energy. |
[12] |
Hashaikeh et al. |
Solar-powered desalination–Technology, energy, and future outlook. |
Latest developments in photovoltaic driven reverse osmosis, solar thermal powered reverse osmosis about membrane materials, recovery systems, and energy storage. |
[13] |
Chen et al. |
A novel approach for reducing RO desalination energy consumption by integrating solar thermal energy into the hybrid reverse osmosis-pressure retarded osmosis system of 5000 m3/day. |
The hybrid system's net actual energy consumption (electricity) is 0.39 kWh/m3 which is much less than that of traditional RO desalination systems of 1.1 kWh/m3. |
[14] |
Lu and Li |
Stand-alone solar-powered sweeping gas membrane desalination system to remote island households |
The cost of water production was about 18.34 $/m3. |
[15] |
Thompson et al. |
Technological and economic feasibility of a stand-alone solar desalination system in Myanmar. |
The cost of water was about 0.0224 $/liter. |
[16] |
Sharqawy and Pimentel da Silva |
The techno-economic potential of using small scale solar RO systems in semi-arid Brazilian societies. |
The model predicts an effective capacity solution of 10 m3/day will generate water at a cost of 1.44 to 1.65 $/m3. |
[17] |
B. Rioux and Napoli |
Develops a cost calculator model to estimate Saudi Arabia's economic competitiveness in solar-powered desalination. |
New solar-powered desalination solutions are not cost-competitive as compared to Saudi Arabia's existing technologies. |
[18] |
Obaidi et al. |
Prospect of combining the desalination plant with a solar photovoltaic (PV) farm of generating electricity at a low cost. |
Design and economic evaluation of solar-powered hybrid multi-effect and reverse osmosis system for seawater desalination. |
[19] |
Hatzell and Zheng |
The techno-economic model that assesses the feasibility of solar collectors coupled with thermal desalination systems. |
The cost of supplying water for a 1000 m3/day plant is 0.97 $/m3 if the cost of the solar collector unit is 100 $/m2. |
[20] |
Alghamdi et al. |
A systematic approach for the design and scheduling of solar-assisted membrane distillation system. |
Optimal design and scheduling of solar-assisted domestic desalination systems. |
[21] |
Rasul and Sajjad |
A computational model for simulating the efficiency of a small-scale solar desalination plant using Aspen Plus Software in coastal Queensland, Australia. |
Simulation and optimization of a solar desalination plants that appropriates for brackish and marine desalination applications. |
Najafi et al. and Khiadani et al. |
Optical and thermal analyses of the solar desalination system were described by SolTrace and Maple software. |
Performance improvement of thermal-driven membrane-based solar desalination systems using nanofluid in the feed stream. |
|
[24] |
Nezhad and Khalilzadeh |
Desalination steam for multi-effect distillation (MED) using the waste heat from a high-capacity WT. |
The cost of desalinated water was 0.16676 $/m3 and the payback period was 6.33 years. |
[25] |
Louis et al. |
Techno-economic assessment of wind-powered desalination for strategic water storage. |
Wind-driven RO scheme will compete with existing thermal desalination in UAE. |
Carta et al. and Borge-Diez et al. |
Performance simulation and analysis of a wind-powered seawater reverse osmosis desalination plant in Spain. |
This system would be able to reduce its cost of water by about 0.022 EUR/m3. |
|
Khan et al. and Albuflasa |
Different research on the use of various combinations of renewable energy sources for systems of desalination. |
Review of the hybrid renewable energy system as a potential energy source for water desalination using reverse osmosis. |
|
[30] |
Gökçek |
Off-grid systems of small-scale reverse osmosis in Turkey using HOMER of 1 m3/h used. |
Electricity costs of 0.308 $/kWh and water costs of 2.20 $/m3. |
[31] |
Avila et al. |
Hybrid renewable energy systems with a daily average of up to 50 m3 using HOMER. |
Assessment of Hybrid Renewable Energy Systems to supplied energy to Autonomous Desalination Systems. |
[32] |
García-Rodríguez et al. |
Advanced desalination off-grid systems using (SAM) of the tidal and solar photovoltaic energies. |
An increase in desalination plants running at a nominal capacity between 1.8 and 2.8 times compared to solar-powered single-cases. |
[33] |
Abdeddaim et al. |
Reverse osmosis desalination unit fed by solar PV and wind turbine combined with battery bank using ANN & MATLAB. |
Artificial Neural Network power manager procedure for hybrid PV-wind desalination system. |
[34] |
Ghobadian et al. |
Performance of salty water desalination by hybrid RO-MSF desalination plants. |
The water price of 1.35–1.84$/m3 depends on different solar/wind RO-Multi Flash models. |
[35] |
Pourfayaz et al. |
Design of a cost-effective hybrid photovoltaic/wind/hydrogen/reverse osmosis desalination system through meta-heuristic technique in Iran. |
The most cost-effective energy system is photovoltaic/hydrogen/reverse osmosis desalination. |
[36] |
Zhang et al. |
Optimization method of solar and wind-powered hybrid reverses osmosis desalination plant. |
Hybrid renewable energy system reducing system costs and increasing system reliability to increase freshwater availability and meet the demands of electrical loads. |
There are few articles, based on previous survey that presented a comparison of wind/solar renewable energy systems used in desalination which may be considered as a gap of the research subject. These systems took into consideration both prediction models and a techno-economic framework that would allow renewable energy sources to be incorporated into the desalination-freshwater production systems. The balance of energy and desalination as seen in these researches' objective should be further discussed in order to achieve reduced emission and low cost for the freshwater growth cycle.
This study primarily aims to evaluate and compare the cost-effectiveness of two separate technologies of renewable energy (on-grid) Photovoltaic Reverse Osmosis and Wind Turbine Reverse Osmosis systems (PVRO and WTRO) using SAM 2018.11.11 r4 software for a small RO desalination system in the new Egyptian community of Ras Gharib, Egypt and to construct a process simulation model of small-scale solar desalination plant using software programs to disintegrate the process into its constituent elements for performance prediction used analytical techniques. The levelized cost methodology is applicable on two different methods for calculating the unit energy and water costs in terms of different economic conditions. In the first option the components are Photovoltaic panels (PV), inverter, and RO Unit while the second option Wind turbine (WT) is used with the RO Unit. For each option the following methodology steps used:
Choose appropriate components of the energy system;
Conduct an economic study of electricity prices (COE) and the cost of desalinated water (CODW);
Choose the optimum renewable energy source for the selected desalination system selected;
Technical and economic evaluation of both solar energy and wind energy to choose what is more suitable for the desalination system.
This paper is organized as follows: first, the paper discusses previous studies dealing with RO structure design with renewable sources including a financial analysis. Section 2 assists in gaining an understanding of the requisite information for PVRO/WTRO simulations, energy calculation methodology, the relevance of the current proposal, and the software brief used in this simulation. The case study GIS details and load patterns are given in section 3. Section 4 outlines the conceptual definition of the RO method and the assumptions about the model. Finally, section 5 exhibits the findings of the technological and economic evaluation. Section 6 also presents findings from this study.
In this paper, mathematical models for system components are investigated as shown following, and software package is also applied.
Different model equations of each component are following below.
A pump is provides the mechanical energy that drives the RO desalination plant. This pump is driven by electricity provided by PV panel and wind turbine. Solar/wind performance has different effects on the RO system's operating pressure. The membrane model with two parameters is implemented according to the activities of the membrane constructor. In the present model, the spiral-wound membranes are taken into account.
The mass of salts in seawater is considered to be negligible in comparison with that of the water, the concentration of salts in seawater is high, and seawater density is 1000 kg/m3 and is considered constant. The water flow rate Qp (m3/h), the salt flow rate Qs (m3/h) and concentration, Cp (kg/m3) are expressed by the next equations [37], [38]:
(1)
(2)
(3)
(4)
where are: A - the membrane's permeability of pure water (kg/N); B - the salt membrane's permeability (kg/m2 s); S - the tube's surface area (m2); Cf and CB - the feed water and concentrate salt concentration of membrane (kg/m3); Δp - the pressure difference between the trans-membrane (MPa); pB and pf are feed water and concentrate pressure of membrane (MPa).
Osmotic pressure difference of the trans-membrane Δπ in MPa is specified as [38]:
(5)
where are: R - the universal gas constant of 8.314 J/(mol K); T - the water temperature (K), C - the salt concentration (kg/m3), and MNaCl - the NaCl molar mass of 0.0585 kg mol.
The pressure drop along the membrane channel Δp (MPa) in eq. (4) is defined by [38]:
(6)
The mass balance for the membrane unit is given as follows [38]:
(7)
The water recovery rate Φ is defined as [37], [38]:
(8)
and the rate of membrane salt rejection r as:
(9)
RO plant is equipped with pressure vessels Np. The total flow rate of feed (Qf,t) and the total product rate (Qp,t) are estimated by equations [38]:
(10)
(11)
where is the water flow product rate through membrane k.
The RO systems total cost can be calculated using [30]:
(12)
where IRO is the specific cost of capital for the desalination system and QP is the hourly output in m3.
The Levelized Cost of Water (LCOW) can be found using [30]:
(13)
where are: CRO - the overall cost of the RO system ($); Ct - the cost of the tank ($); CRO,M&O - the total cost of running and sustaining the RO system ($); Celect - the price of the electricity produced by the hybrid system ($/kWh); Efromhs - the electricity generated by the power generation system (kWh), and Qannual - the annual water output of the plant (m3/year).
The PV panel is the principal building block of a PV system and it is possible to connect any number of panels together to provide the necessary electrical efficiency. It is one of the PV system's tremendous benefits, in which we can install any number of panels can be installed as per the requirement. While the cost of producing electricity from the solar panel is high, current trends indicate that it is starting to decline [39]. The total energy production from PV modules can be calculated by eq. (14) [40], [41] as follows:
(14)
where are: E - energy production from PV modules (kWh); As - area of the solar panel (m2); Y - yield of PV panel (%); H - average of solar radiation annually (kWh/m2), and PR - Performance Ratio.
A wind turbine combines a rotor, a generator, blades, and a drive train. The pitch angle is regulated to restrict the output power of the generator to its face value for top wind velocities. The power produced by a turbine is obtained via eqs. (15, 16) [40], [42]:
(15)
where are: Pm - wind turbine mechanical output power (W); ρ - density of air (kg/m3); A - swept area of wind turbine (m2); V - wind speed (m/s); Cw (λ, β) - turbine performance coefficient (0.59 Betz Law); λ - ratio of tip speed (rotor blade speed to wind speed) (-), and β - pitch angle of the blade (deg).
(16)
where are: Em - the electric power is given by the wind turbine and sent out to the rotor (W); Pm - the mechanical power torque practical of rotor (Nm), and ωr - the rotor rotational speed (rpm).
An electrical current device in which the inversion phase is done, which transforms DC into AC. The power of the inverter is calculated using an automatic sizing technique from SAM software.
System performance or efficiency depends on meteorological parameters, namely wind speed, solar radiation, the temperature in the atmosphere, temperature in the environment. Apart from the meteorological parameters, it also relies on water parameters such as salt concentration, development of water algae, and mineral layers in the basin liner. The Production Rate Performance (PRP) of the whole RO desalination system using PV/WT is calculated as following [43]:
(17)
The rate of instantaneous condensation is m ̇_i and the performance of production rate within Δt is expressed as [44]:
(18)
where are: Δt - the time interval over the solar radiation intensity (I(t)/v(t) in W/m2); I - solar irradiance, V - wind speed (m/s), and the rate of condensation (kg/s) are measured.
The energy efficiency of the desalination system is:
(19)
where is defined as the mass flow rate (kg/h), hv is specific enthalpy (kJ/kg), and is the rate of heat transfer (kW).
To maximize the system efficiency, solar panels should be sited at very shiny area while wind turbines need to be installed at windy sites, as a small change in wind speed and solar radiation results in a significant change in power output. The main objective of this study is technical and economical evaluation to determine the optimum energy source for this case study. Also, studying the feasibility and sustainability of wind and solar power systems for desalination systems depends on their ability to generate electricity at low operating costs. On the selected site within this analysis, the SAM 2018.11.11 r4 software package was used to estimate the annual output energy, cost of energy, and cost of water from the wind/solar RO system. System Advisor Model (SAM) is a financial performance model designed to calculate energy costs for grid-connected power projects based on construction and operating costs and suitable system design to promote decision-making for those engaged in the renewable energy sector [45]. SAM is a techno-economic software model that facilitates decision-taking for people in the renewable energy industry. The financial models of SAM can be used to determine the efficiency of the following types of projects: residential and commercial projects, Power Purchase Agreement (PPA) projects, and ownership by private entities [46].
Residential and industrial enterprises in SAM purchase and sell electricity at retail tariffs. They can be funded by a loan. Such projects recover investment costs by selling energy at prices fixed by a service provider with energy. As the project level, SAM calculates metrics for such projects, assuming the project is created, owned, and run by a single entity. SAM measures the levelized energy expense of the project for residential and industrial facilities, which reflects the expense of building and running the system including debt and tax payments, and incentive accounting. The model then estimates the net present value of the after-tax cash flow and a payback period which reflects the number of years expected to cover the initial equity investment of the project for the accumulated after-tax cash flow.
Although residential and commercial systems are typically smaller than 500 kW, SAM does not restrict system sizes, and either the residential or commercial financial model could be used to model any size. The SAM Electricity Tariffs offers a selection of options for determining a project's retail electricity rate structure. The Levelized Cost of Energy (LCOE) Calculator uses the following equation [46]:
(20)
where are: FCR - the rate of a fixed charge ($/year); TCC - capital cost ($); FOC - fixed operating cost annually ($); AEP - electricity production per year (kWh), and VOC- variable operating cost ($/kWh).
This section illustrates all the required data: of the desalination application selected site, climatic data and water supply requirements. The present work investigates PVRO/WTRO desalination systems to select the proper one for the new Egyptian communities. In this regard, a model is being developed for designing small-scale PVRO/WTRO systems, and the outputs are incorporated into a Geographical Information System (GIS) to determine the feasibility of techno-economics. The PVRO-GIS model, based on available data on brackish water salinity and solar input, provides a reliable method for forecasting water quality, water costs, and energy usage. Therefore, all results can be combined into a map showing the capacity of each region to adopt the technology and the regional need for the program.
Ras-Gharib is the second-largest city in the Red Sea Governorate and the most important Egyptian city in oil production. It is the north part of municipal governments situated on the African side of the Gulf of Suez in the Red Sea Governorate, Egypt. It has an area of 10,464.46 km2. It is a tanker loading facility managed by the General Petroleum Corporation of Egypt. This site has an abundant capacity of solar and wind resources. This study focuses on the desalination unit of the new community site of Ras-Gharib town in the Gulf of Suez, Egypt. There are also some small new communities in this area that are connected to the grid. The PV/wind desalination on-grid system will supply these communities with water and electricity to enhance their living quality. Figure 1 [47] shows the selected site map (Ras-Gharib city) in Etsa region, Fayoum, latitude of 28° 21' North and longitude of 33° 04' East, with an elevation of 16 above sea level and shear factor α= 0.220.
Geographical location for Ras-Gharb town, Gulf of Suez, Egypt [47]

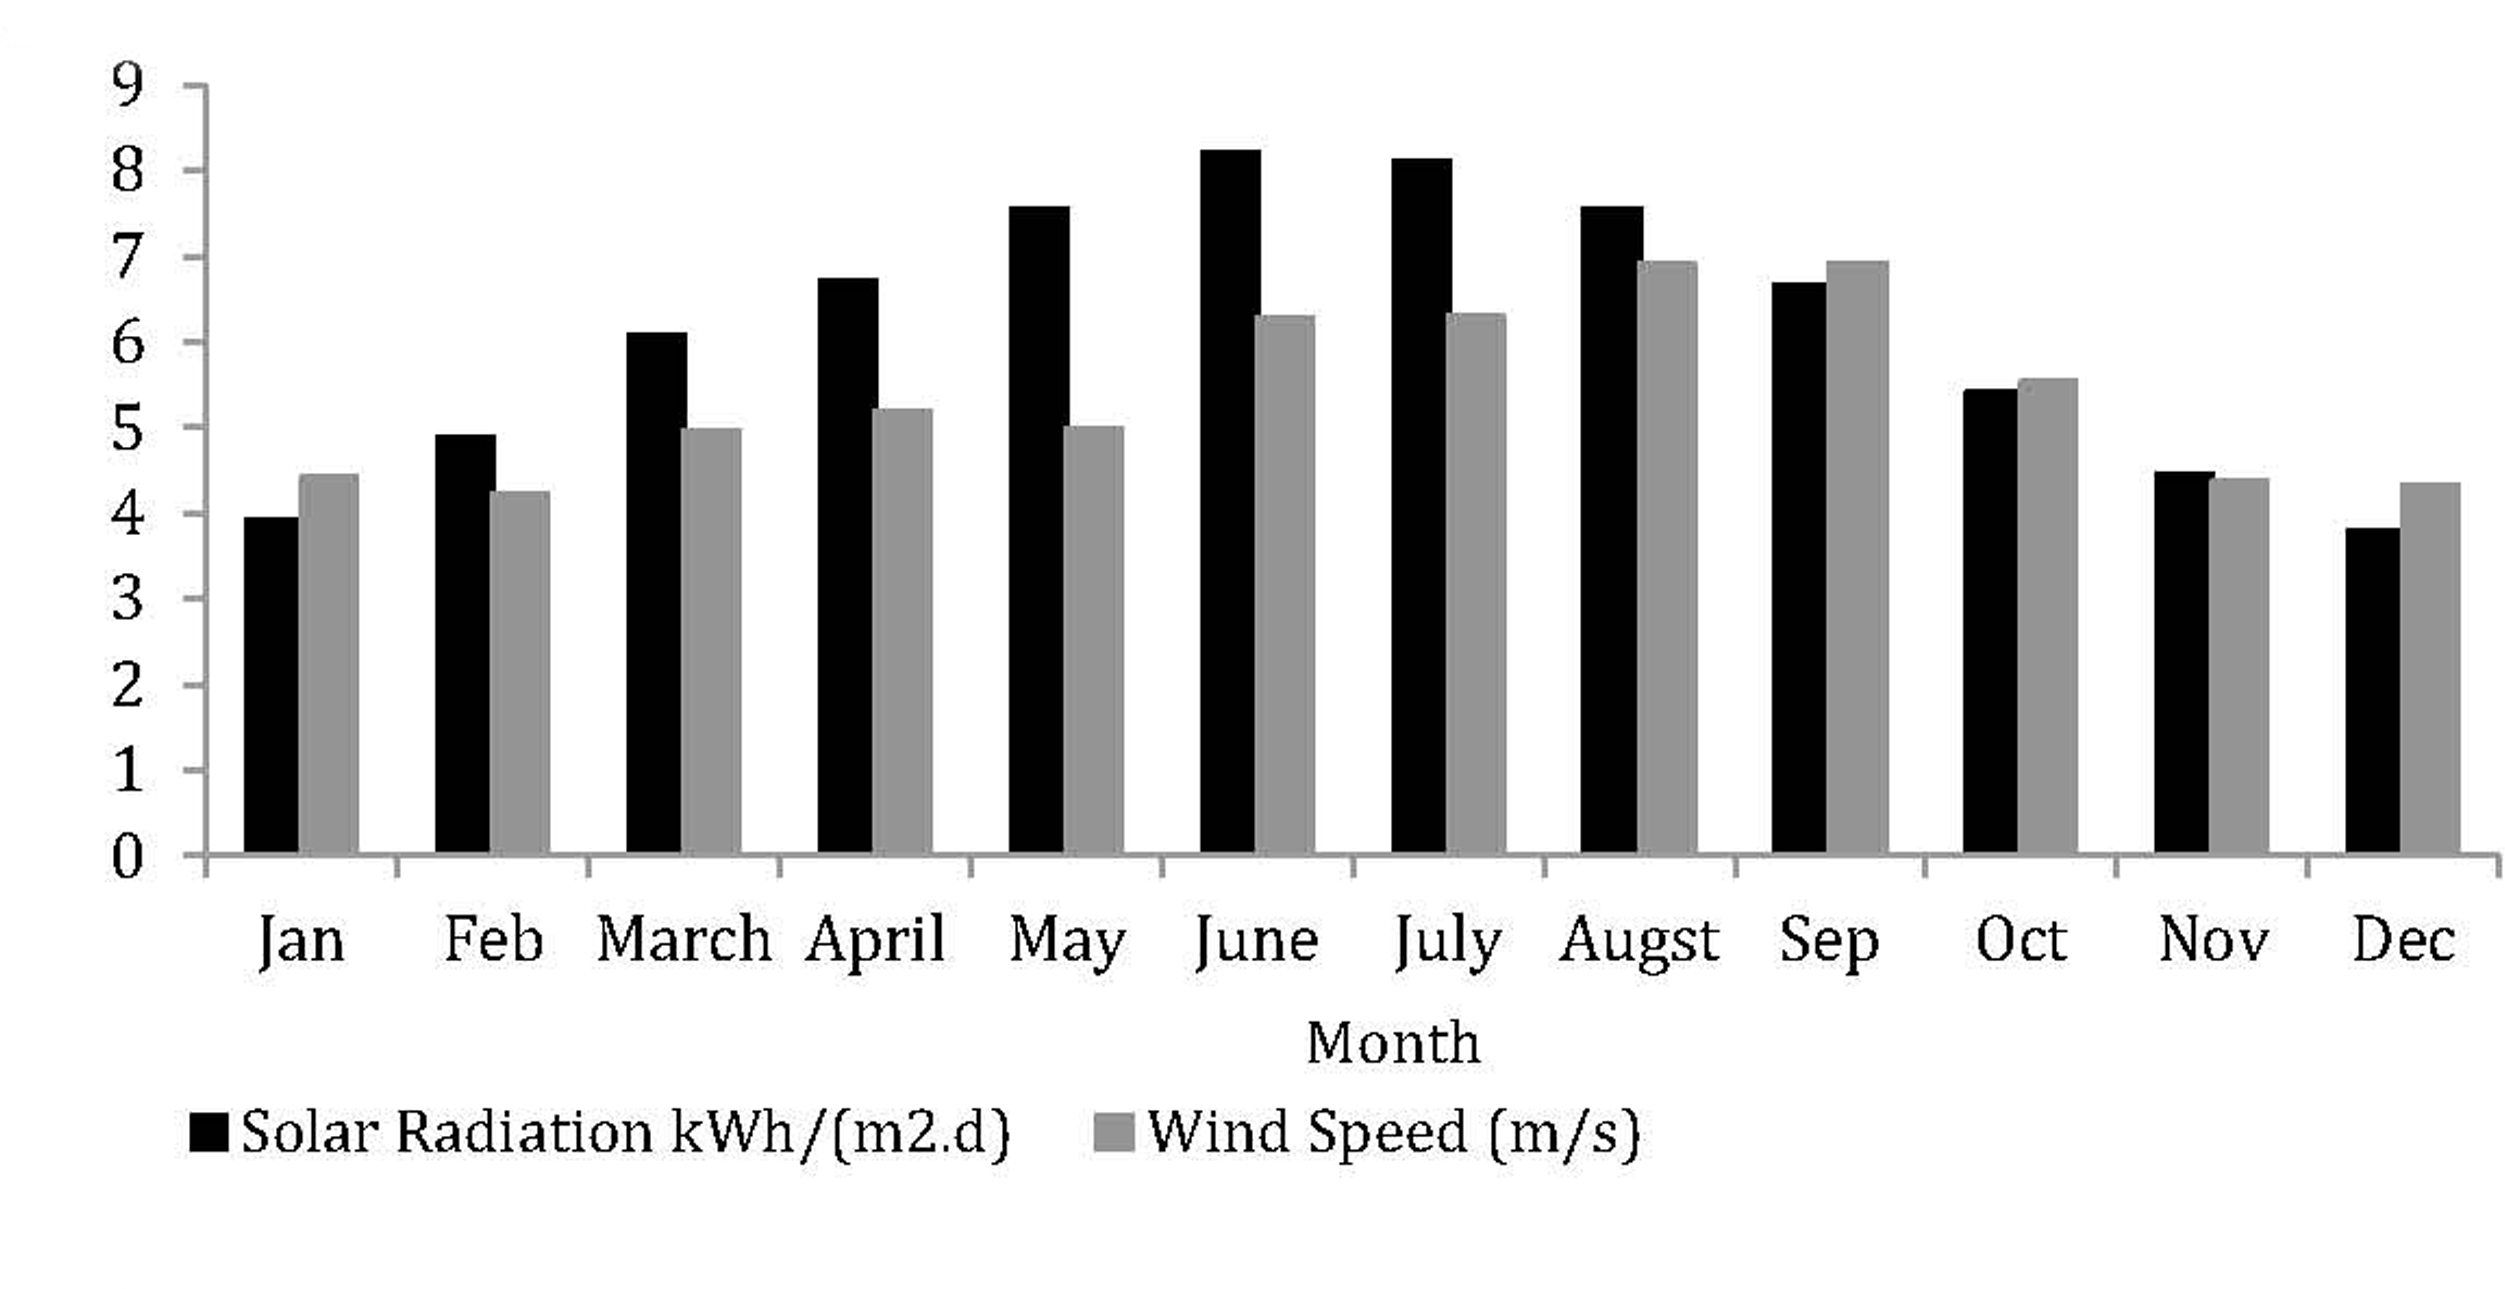
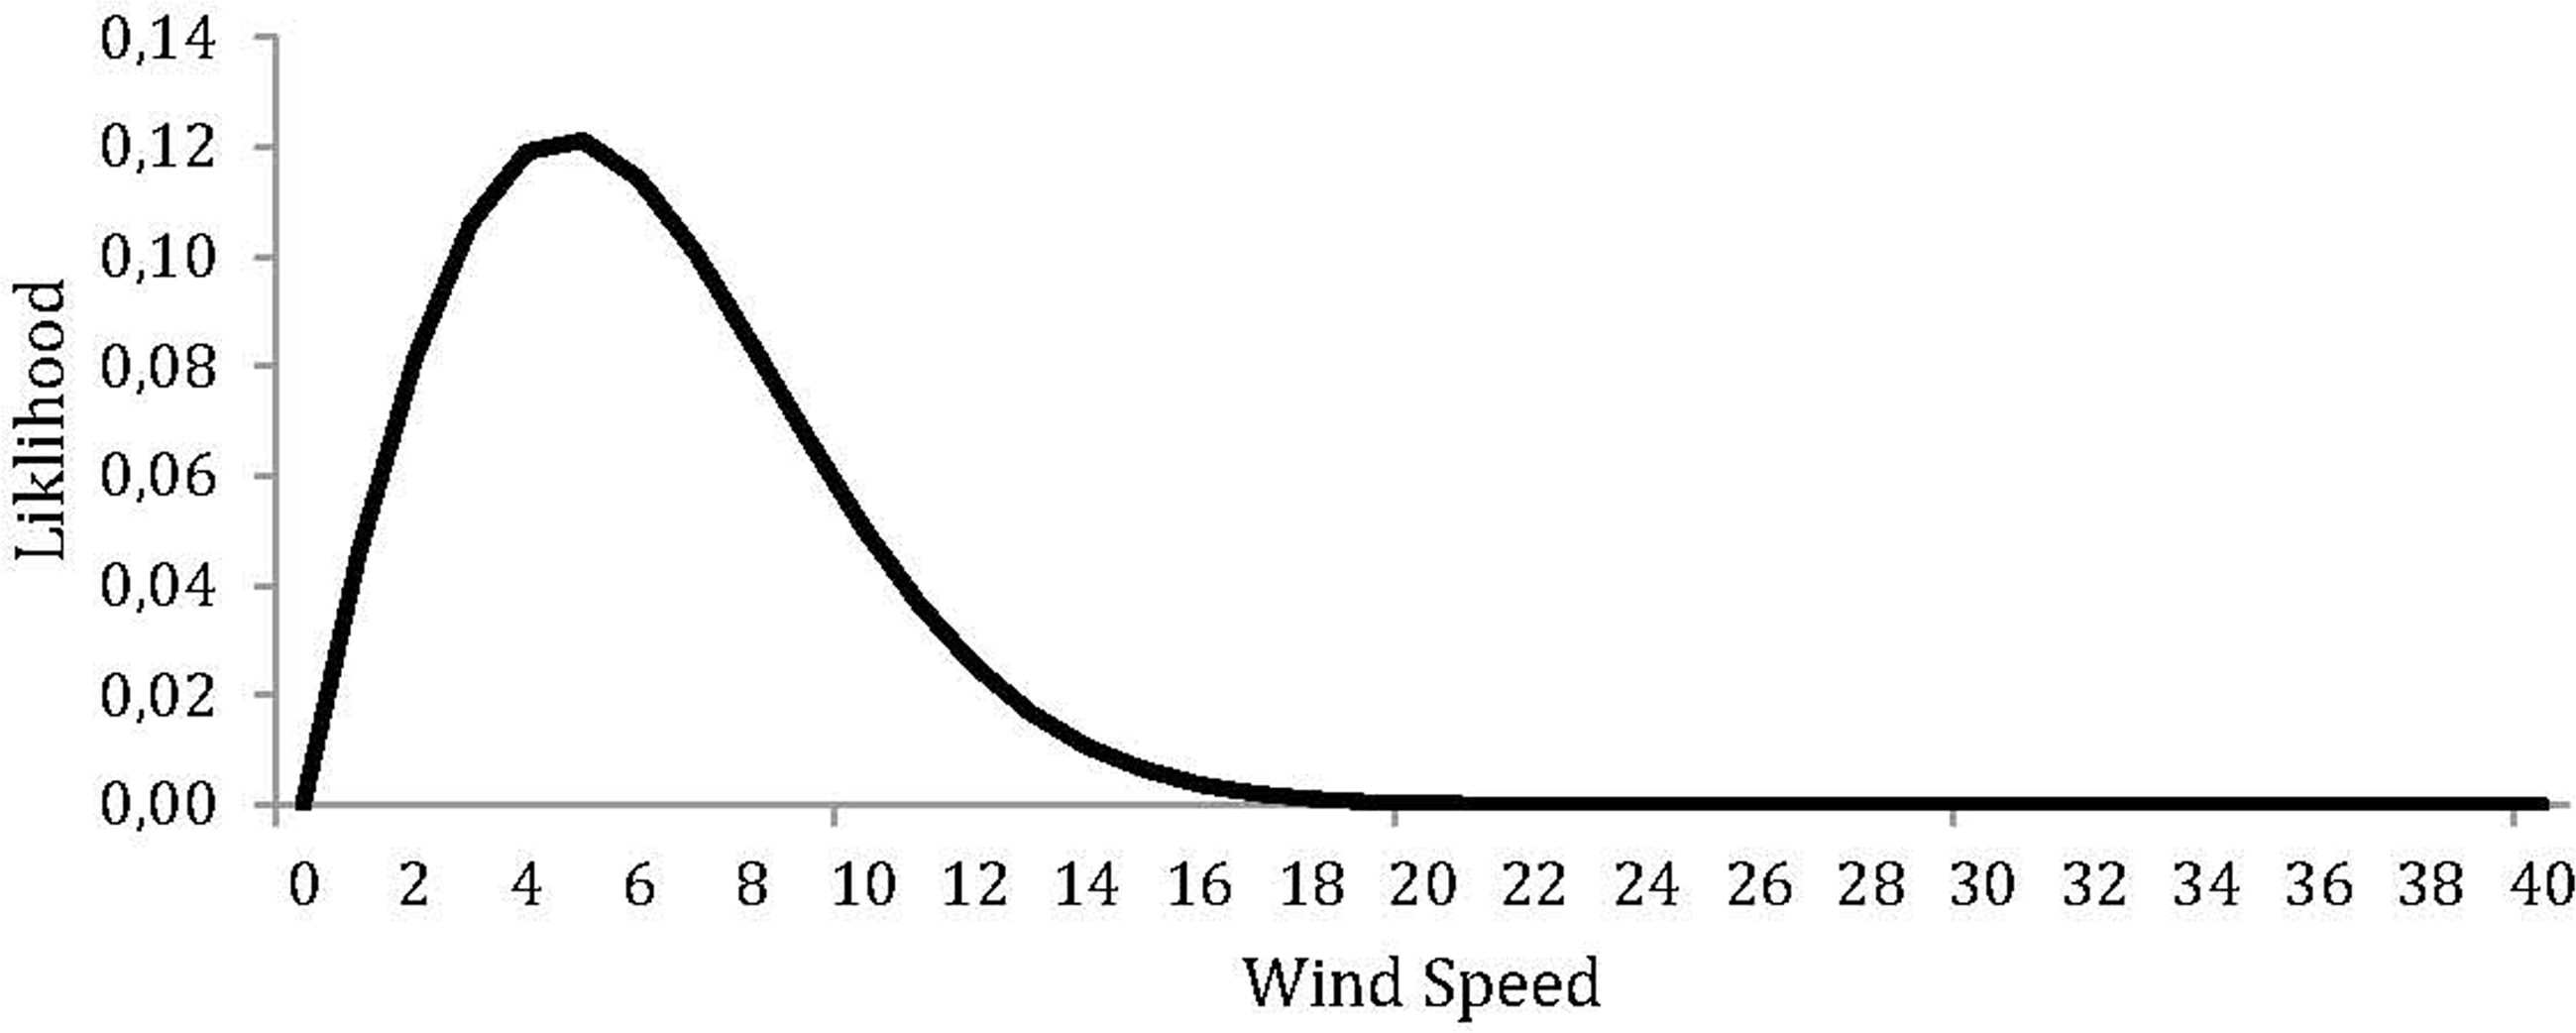
PV systems convert solar radiation directly into electric energy; photovoltaic effect, electricity generated from PV system increases as the intensity of solar radiation on its surface increases. Egypt enjoy high solar radiation, which ranges from 5.0 kW/(m2day) to 9.0 kW/(m2day) [48]. Egypt also has abundant wind resources, with several coastal areas where high and stable wind speeds are frequent, especially in the Suez Gulf and the Nile Valley, as wind speeds at 50 meters above sea level can reach 10.5 m/s [49]. The irradiance and wind speed distribution are appropriate for the case under study. In this case study, the hourly solar irradiance and wind speed data; for the years 2017-2019, are obtained from the National Aeronautics and Space Administration (NASA), and then the mean monthly solar radiation, wind speeds are determined as shown in Figure 2 [50]. It was found that this chosen site has maximum solar radiation of about 8.13 kWh/m2 day in June and 6.9 m/s in September associated with high wind speeds. The actual sunshine period is approximately 8 hours/day and 9 hours/day for the same period [48], [49]. If average wind speed and variance are determined beforehand, then the value of k (shape factor) and c (scale factor) as Weibull parameters can be estimated by the maximum likelihood method follows [51]:
(21)
(22)
where are: Vav- mean wind speed and Г- gamma function. Figure 3 shows the Weibull distribution of the hourly wind speed at 10 m AGL for Ras Gharib. Based on the collected data, it can be observed from this case study that there is tremendous potential for solar photovoltaic and wind applications. Solar/wind power generation has many advantages in Egypt:
The solar/wind capacity of Egypt is among the highest in the world;
An appropriate amount of land available with low economic alternative value;
Increasing market electricity and other energy sources significantly;
Air quality issues are a significant environmental concern in major cities;
Donor assistance was extremely high, including research, capacity-building, and grants.
Monthly average solar radiation & wind speed of Ras-Gharib Site (2010-2018) [50]
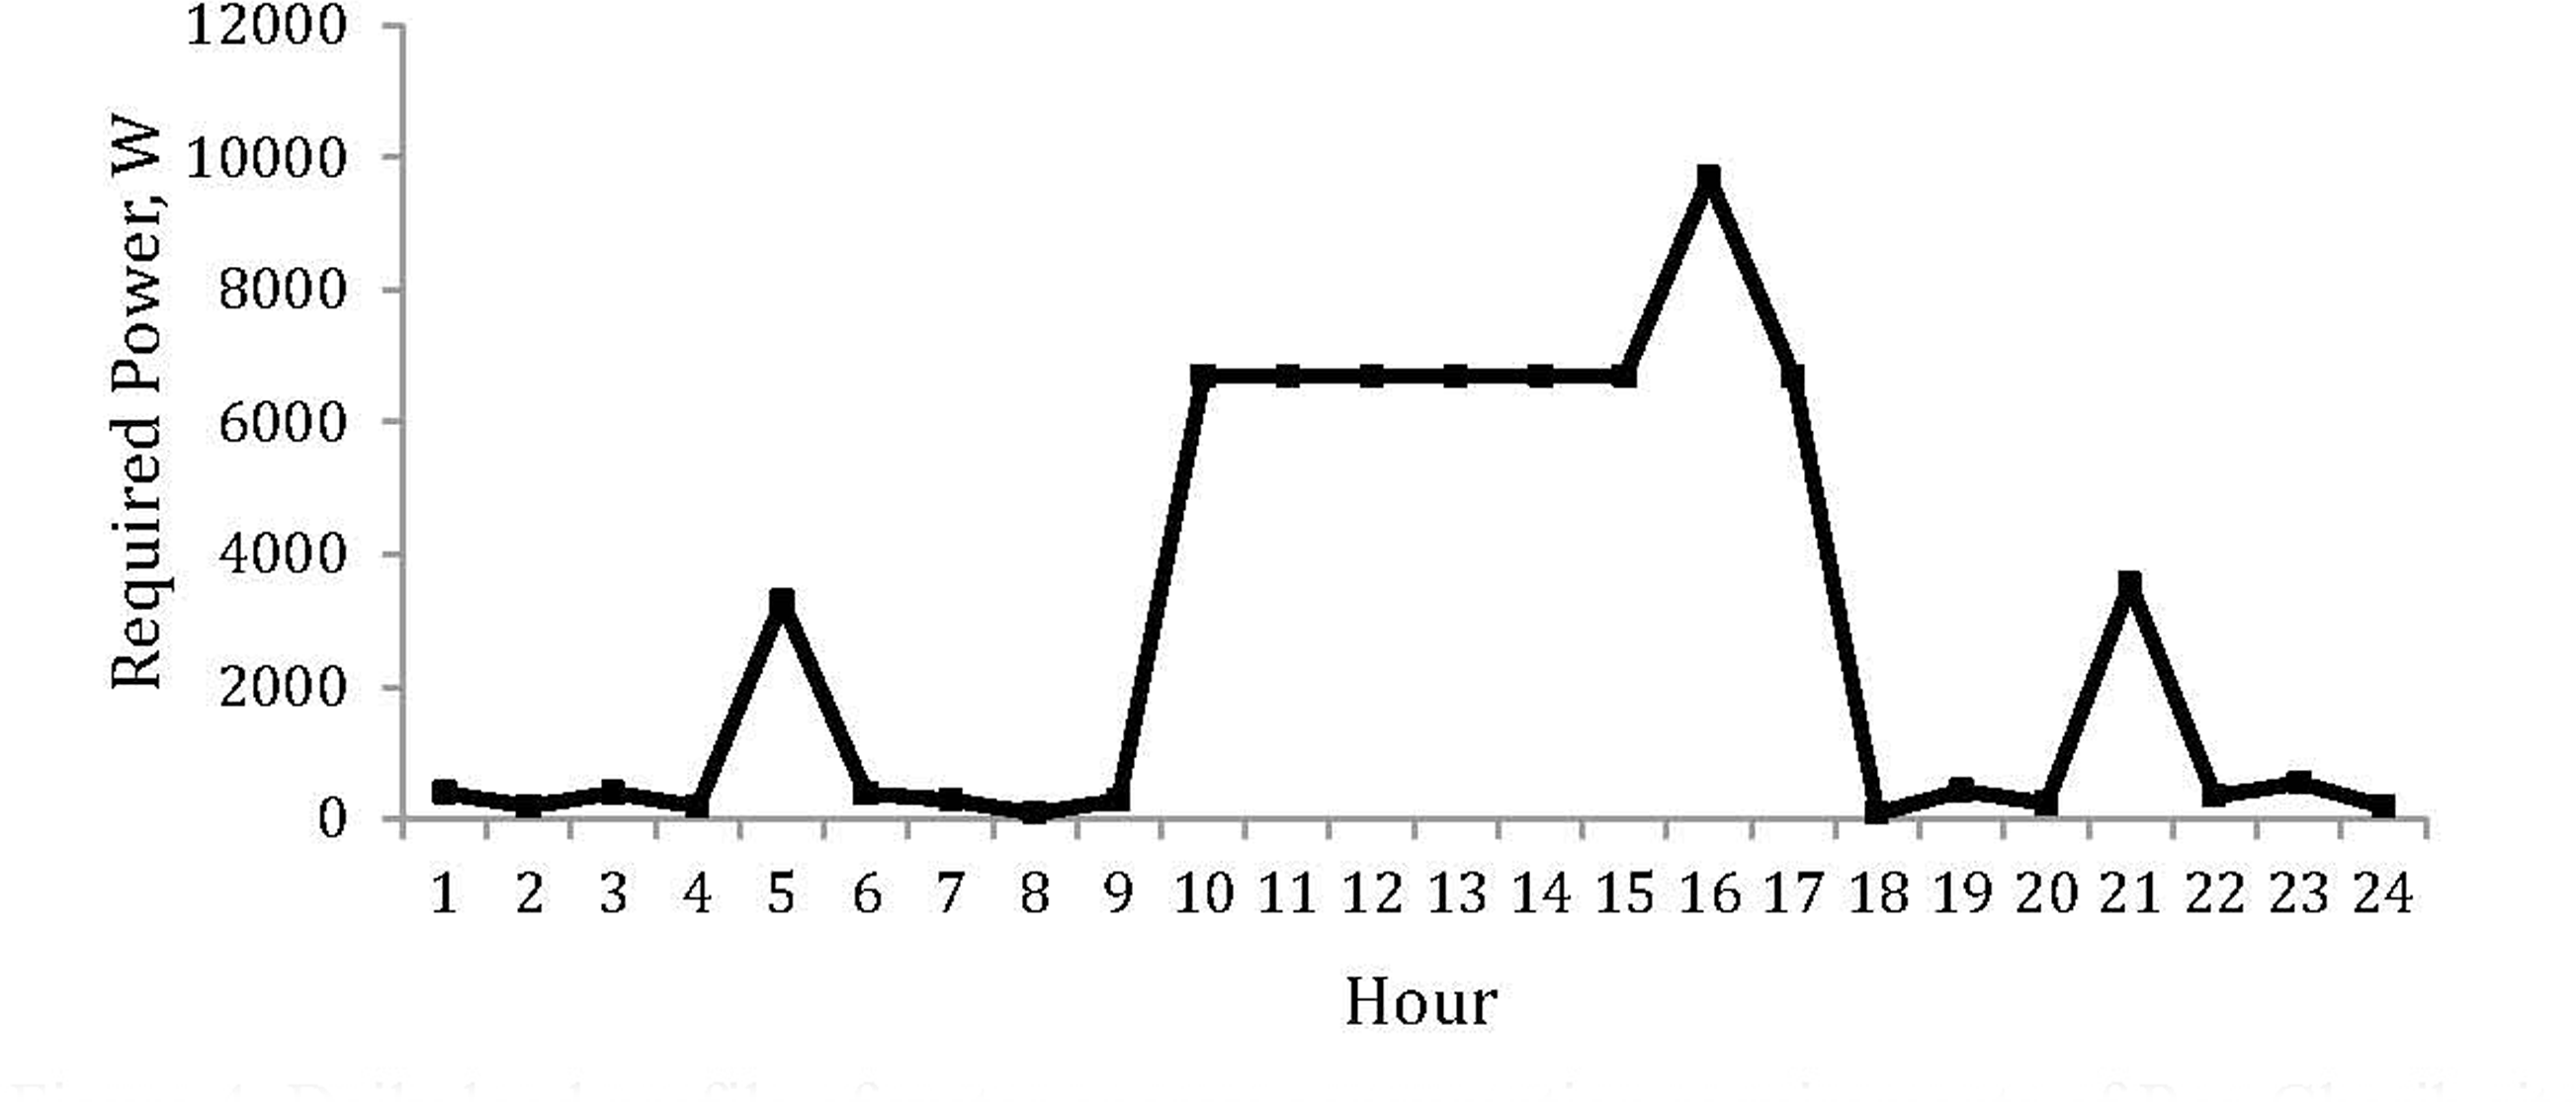
To find the exact electric power required to calculate the optimum proposed system sizing, it is necessary to the size of the desalination unit and people need water amounts in the selected site. For this case study, the daily electric demand of this proposed system is divided into two items: the desalination unit and inhabitant residential needs (fan, light, TV, washing machine). The average daily load profile is 2800 W and 10 kW peak.
Weibull probability distribution of wind speed (m/s), Ras Gharib at 10 m AGL; k=1.921, c=6.042
The system was planned to generate 0.5 m3/h equal to 4 m3/day of product water according to tank size under an eight hours of RO unit operating cycle that corresponds to daytime offering the highest solar and wind power. The desalination system specification is outlined in the following System Description section. The whole-day load profile estimation is shown in Figure 4.
Daily load profile of water energy consumption requirements of Ras-Gharib site
This section comprises all details of system description and all variables assumptions.
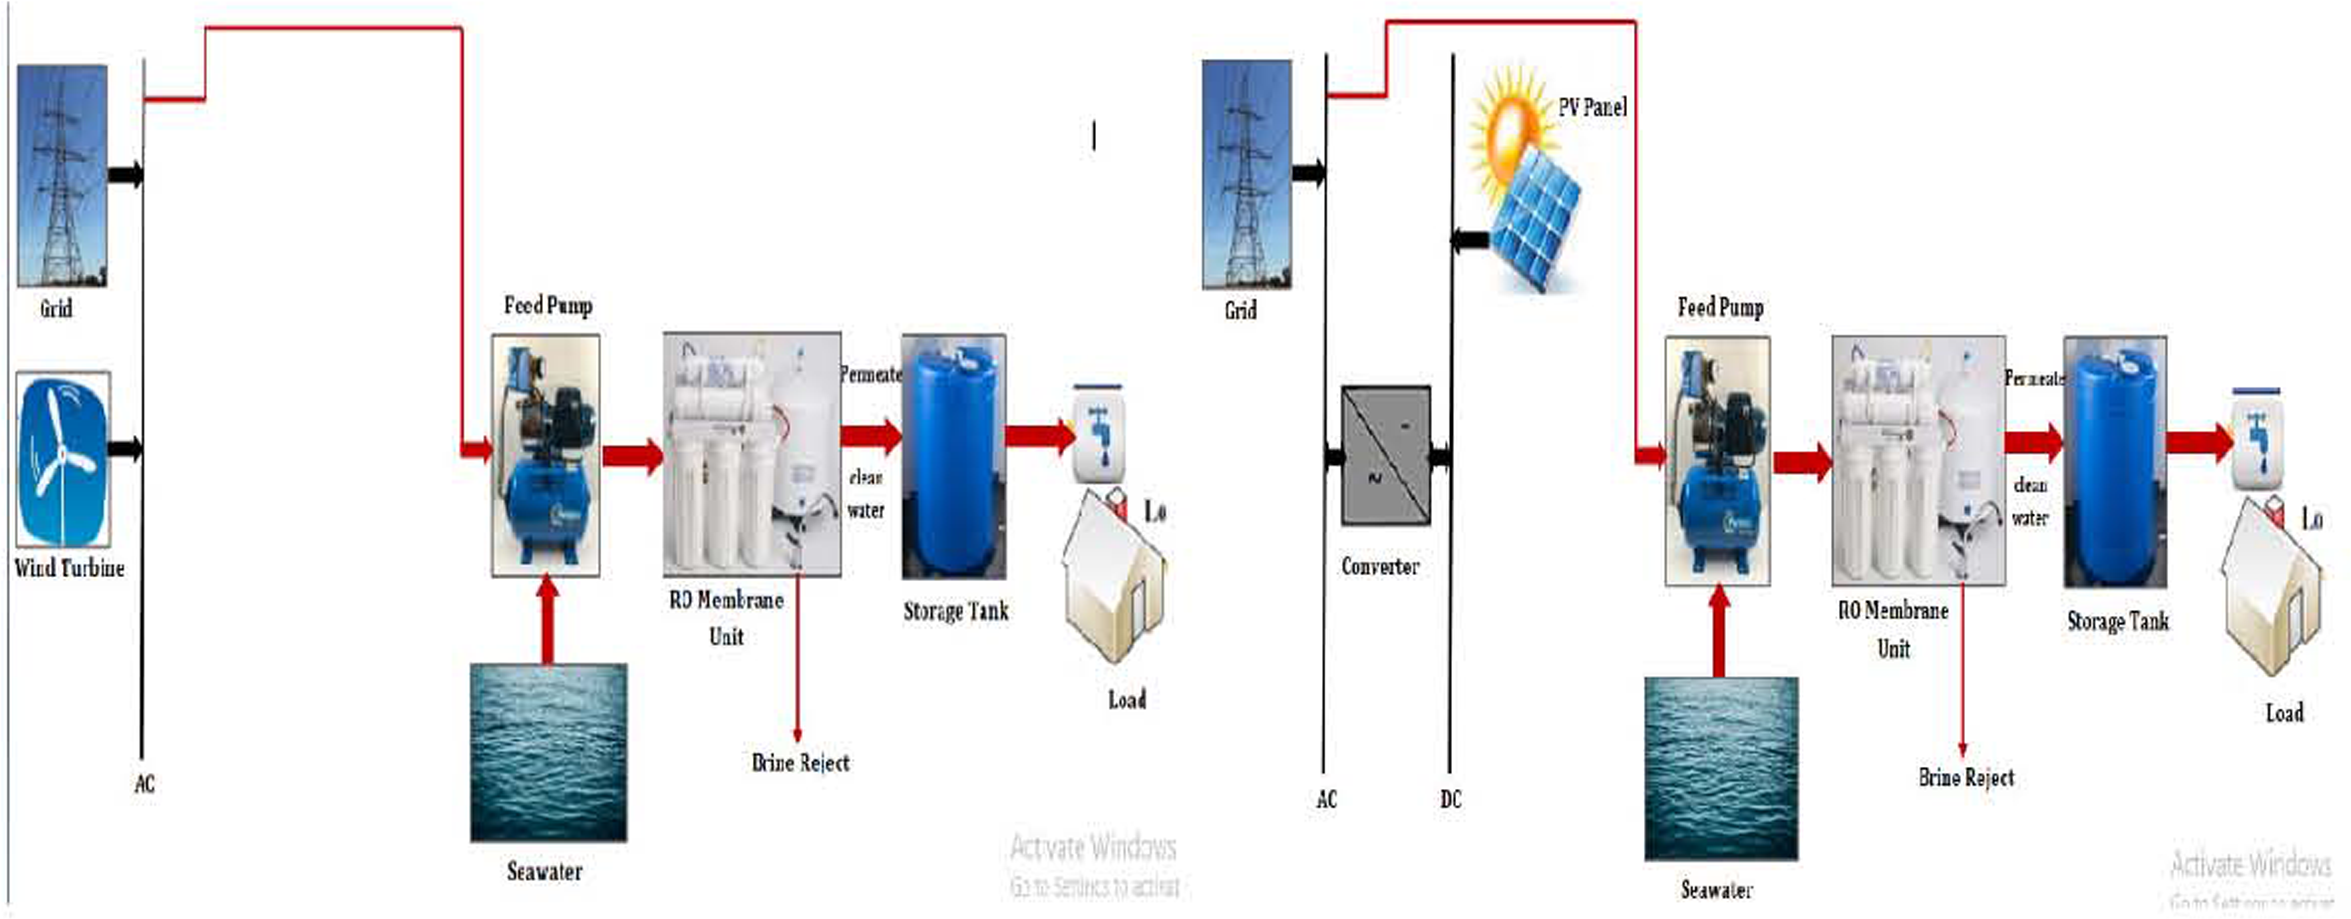
Figure 5a shows solar on-grid PVRO desalination system layout while Figure 5b illustrates wind on-grid WTRO desalination system layout. The proposed system electric demand is divided into two items: desalination unit and inhabitant residential needs as mentioned previously. The proposed on-grid system consists of the desalination RO unit powered by solar panels or wind turbines in addition to an inverter in case of PVRO. The solar panels proposed for the system are poly-crystalline modules, which will be primarily mounted on the rooftop of the small residential house containing the desalination unit, and a wind turbine on the ground with the rest of the system components. All specifications data of the proposed desalination system are shown in Appendix. The PV module used is 325 Wdc and its I-V curve is described in Figure 13 [52]. The wind turbine power is used in this study is 7.8 kW and it power curve is presented in Figure 14 [53]. The two-stages RO desalination unit of 500 L/h is used in this study [54]. This will include one main building that houses the desalination equipment, inverters [55], and data acquisition for data transfer or communication.
Solar RO Desalination System (left) and Wind RO Desalination System (right) on-grid proposed system
Several sources of social, economic, and governmental data were used to build the economic model and identify the key parameters for the hypothetical desalination plant. Numerous data sources were utilized for this study, including textbooks, databases, governmental sources, and country-specific websites for this selected region of Ras Gharib. Key parameters of the model are as follows:
Salinity - a lower feed salinity allows for higher conversion rates and increased production, the salinity of seawater in Ras Gharib was considered to be 32,000 mg/L.
Product - the permeate (effluent) is expected to be within the standards of the World Health Organization (WHO).
System capacity of 8 kW - the system will operate at 80% renewable fraction of peak load capacity; it will thus produce 4,000 L/day.
The tank size used here is 4 m3, so this tank will be complete in 8 hours. (Due to desalination unit capacity is 500 L/h).
Real Interest Rate: 6%, Inflation Rate: 4%.
Project Life Time: 25 yr for PVRO and 20 yr for WTRO depends on the lifetime of PV & WT.
PV Mismatch module Losses, AC inverter Wiring or WT Wiring Losses: 3%.
Electricity grid rates: 0.1 $/kWh for purchasing and 0.05 $/kWh for sold to grid [56].
Energy consumption to become drinkable in water treatment processes, including reverse osmosis systems, is the main factor for these desalination plants. The RO desalination system, in which the 12 m3/day freshwater energy consumption concentrated in the current research, is calculated to be 6.6 kW/h of 4 m3/day according to tank size. The energy of this proposed system covers the energy needed at the selection site for generating the proposed RO desalination system and people's basic needs, and the power system's surplus power can be used for grid sale. Some of the main challenges that come with Renewable Energy Systems (HRES) built to supply the Autonomous Desalination Systems (ADS) are a lot of variables to be considered, including the size of each component. The selection of capacity for the components used in an electrical system significantly affects the electricity's total energy efficiency, working capital, and thermal cost.
The first option components of the energy system are; PV panel and RO desalination unit inverter that may have been displayed when connected to the grid in SAM software, while the second option used a wind turbine for this RO desalination unit. This simulation is carried out hourly as it is imperative for intermittent renewable energy sources of Photovoltaics and wind turbines. SAM software modelled all possible integration with the lowest Levelized Energy Cost LCOE, as described by the input parameters and needed simulation results from the highest Net Present Value NPV.
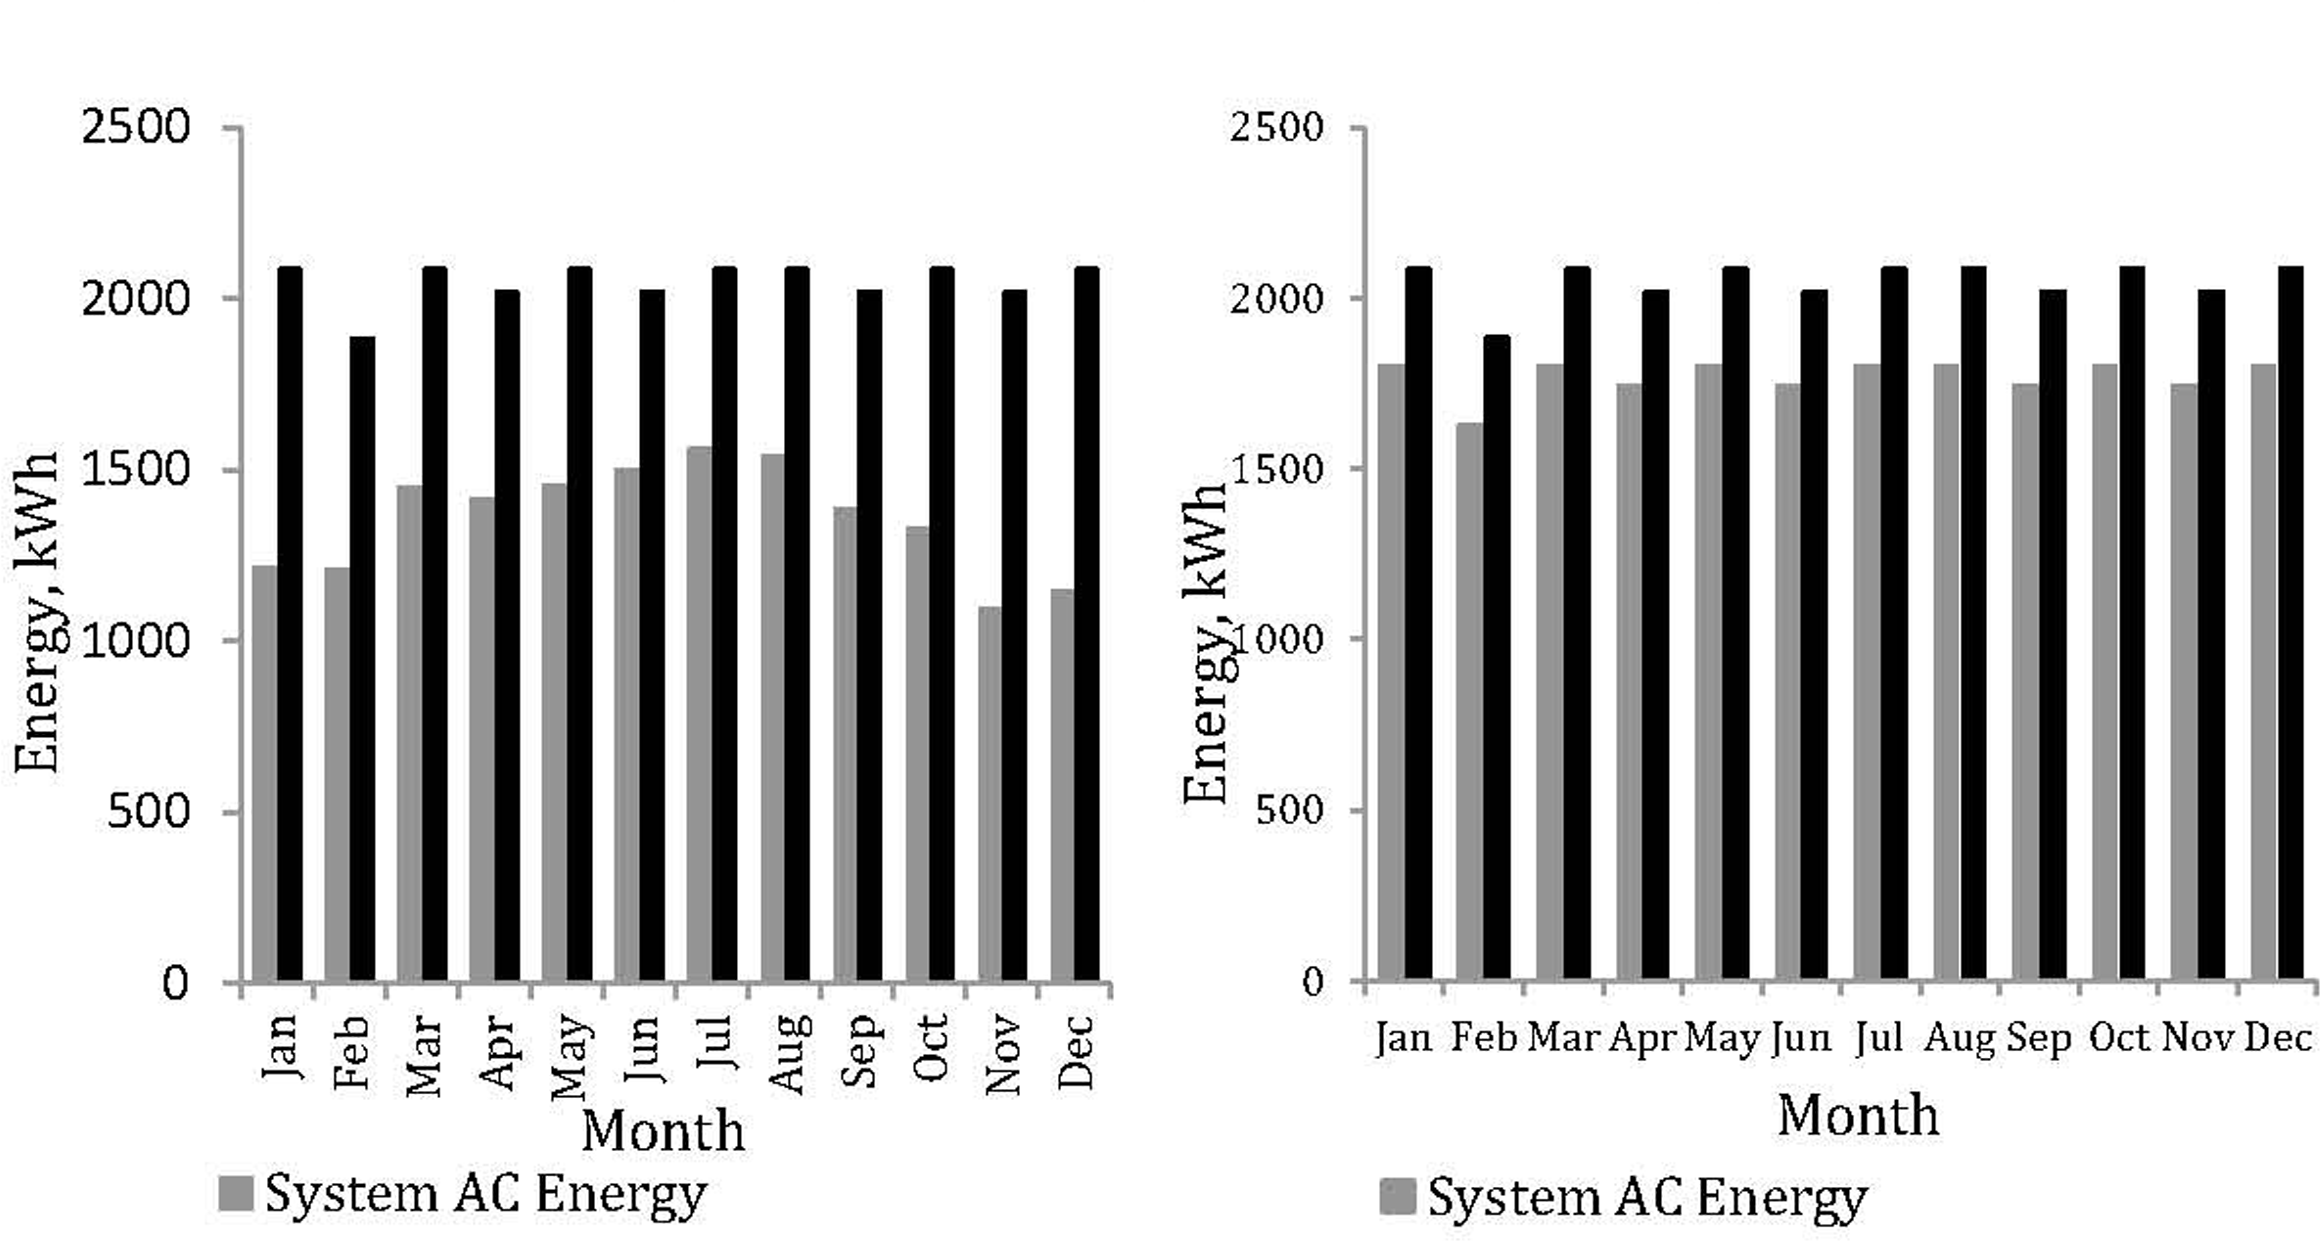
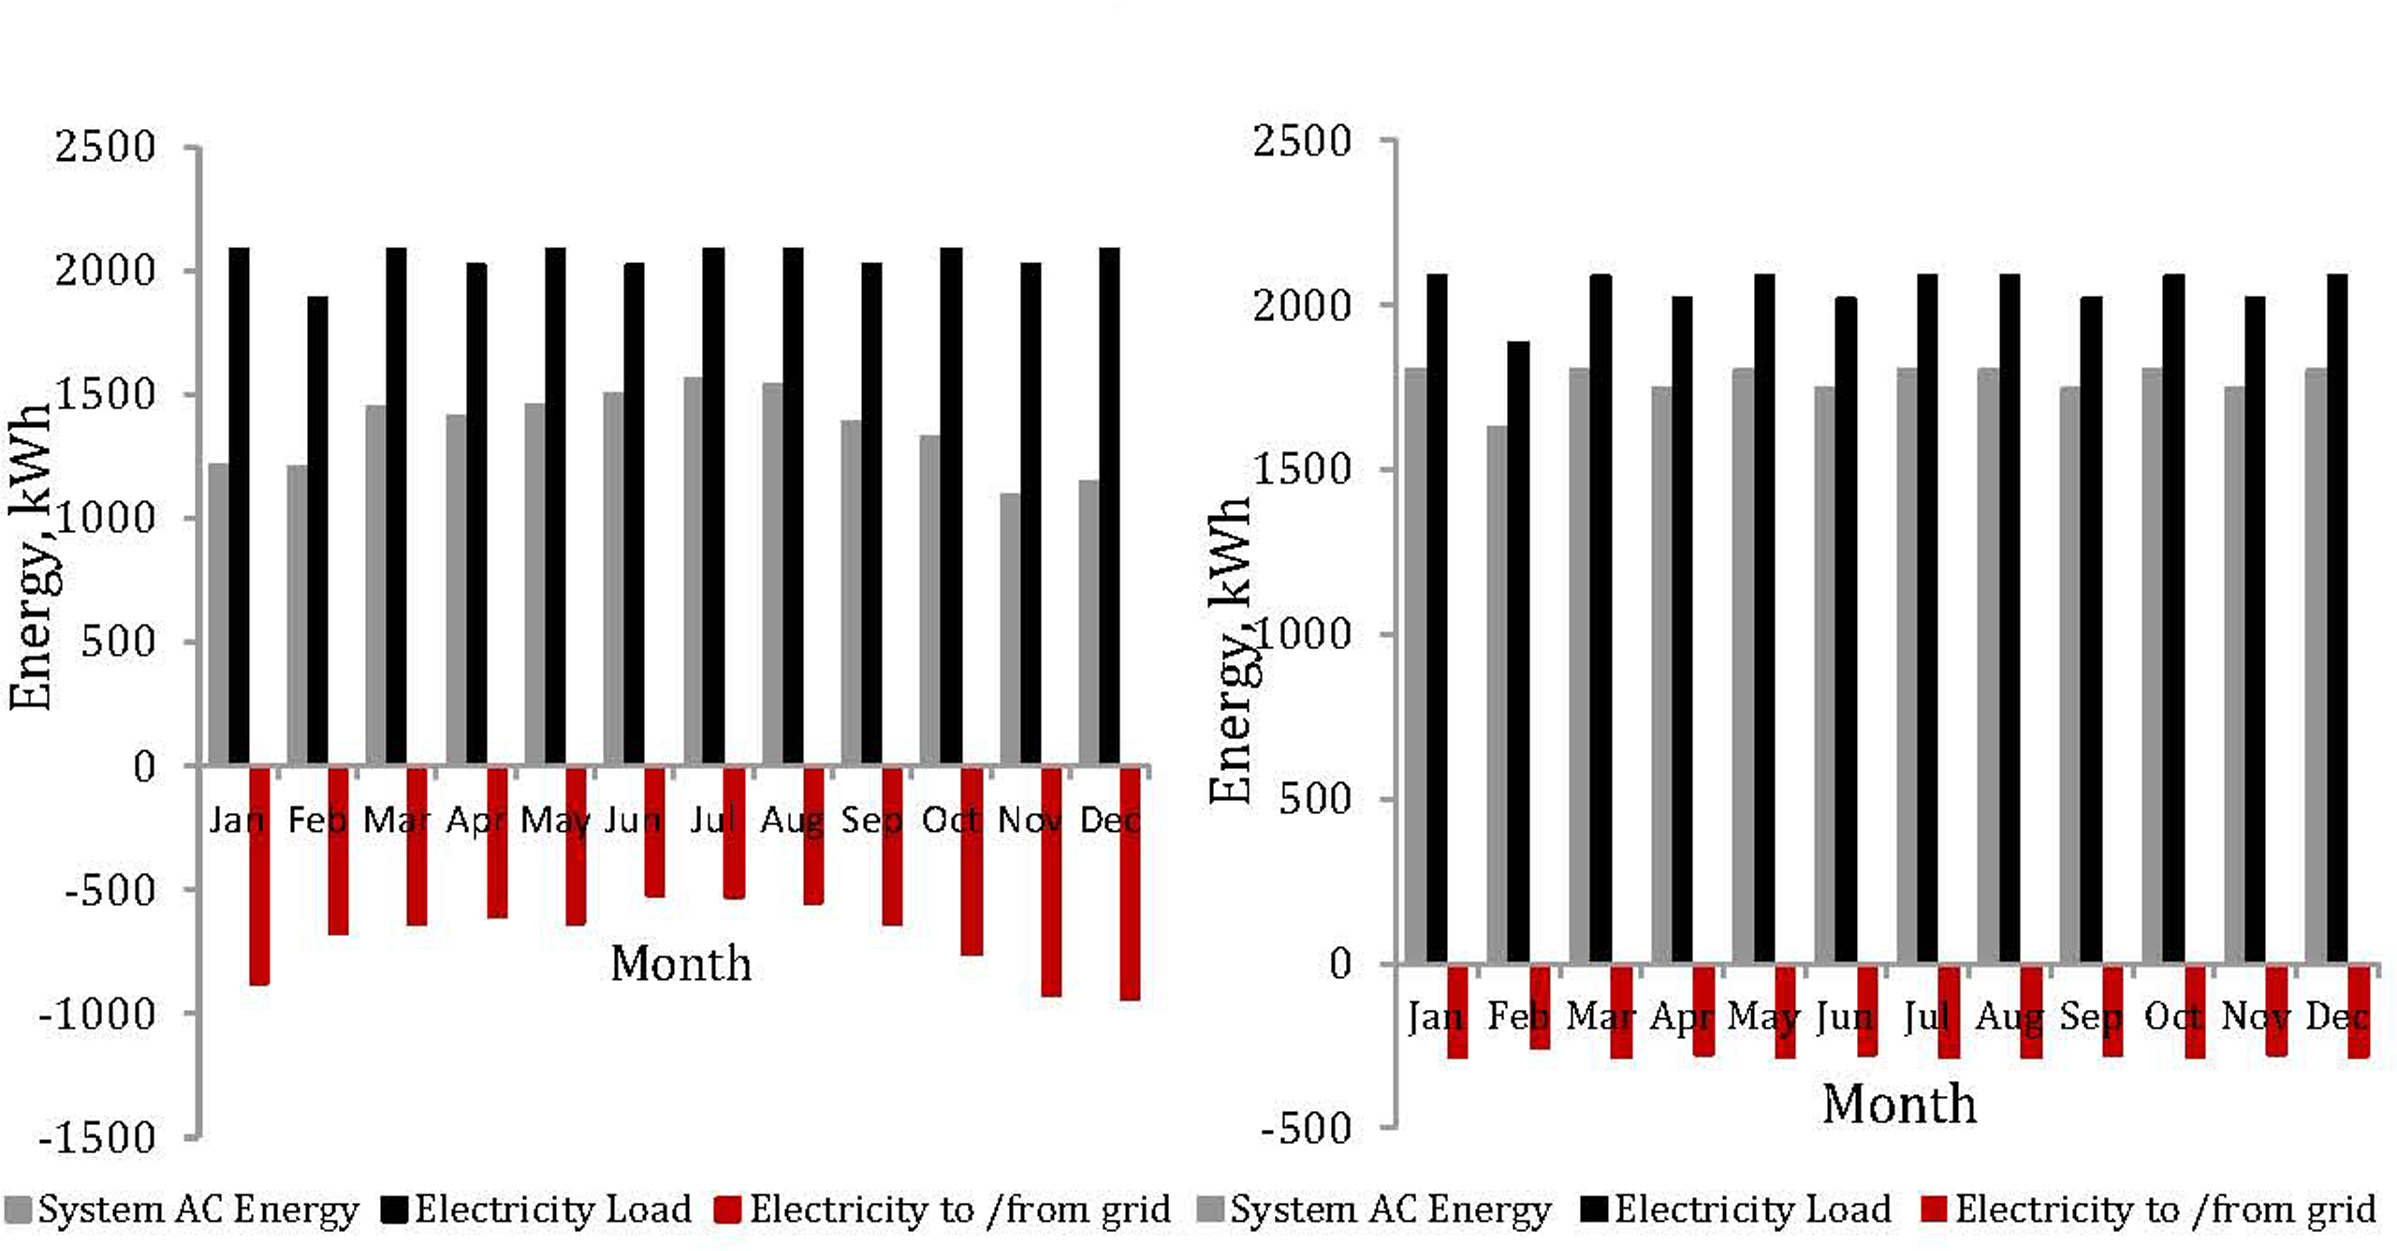
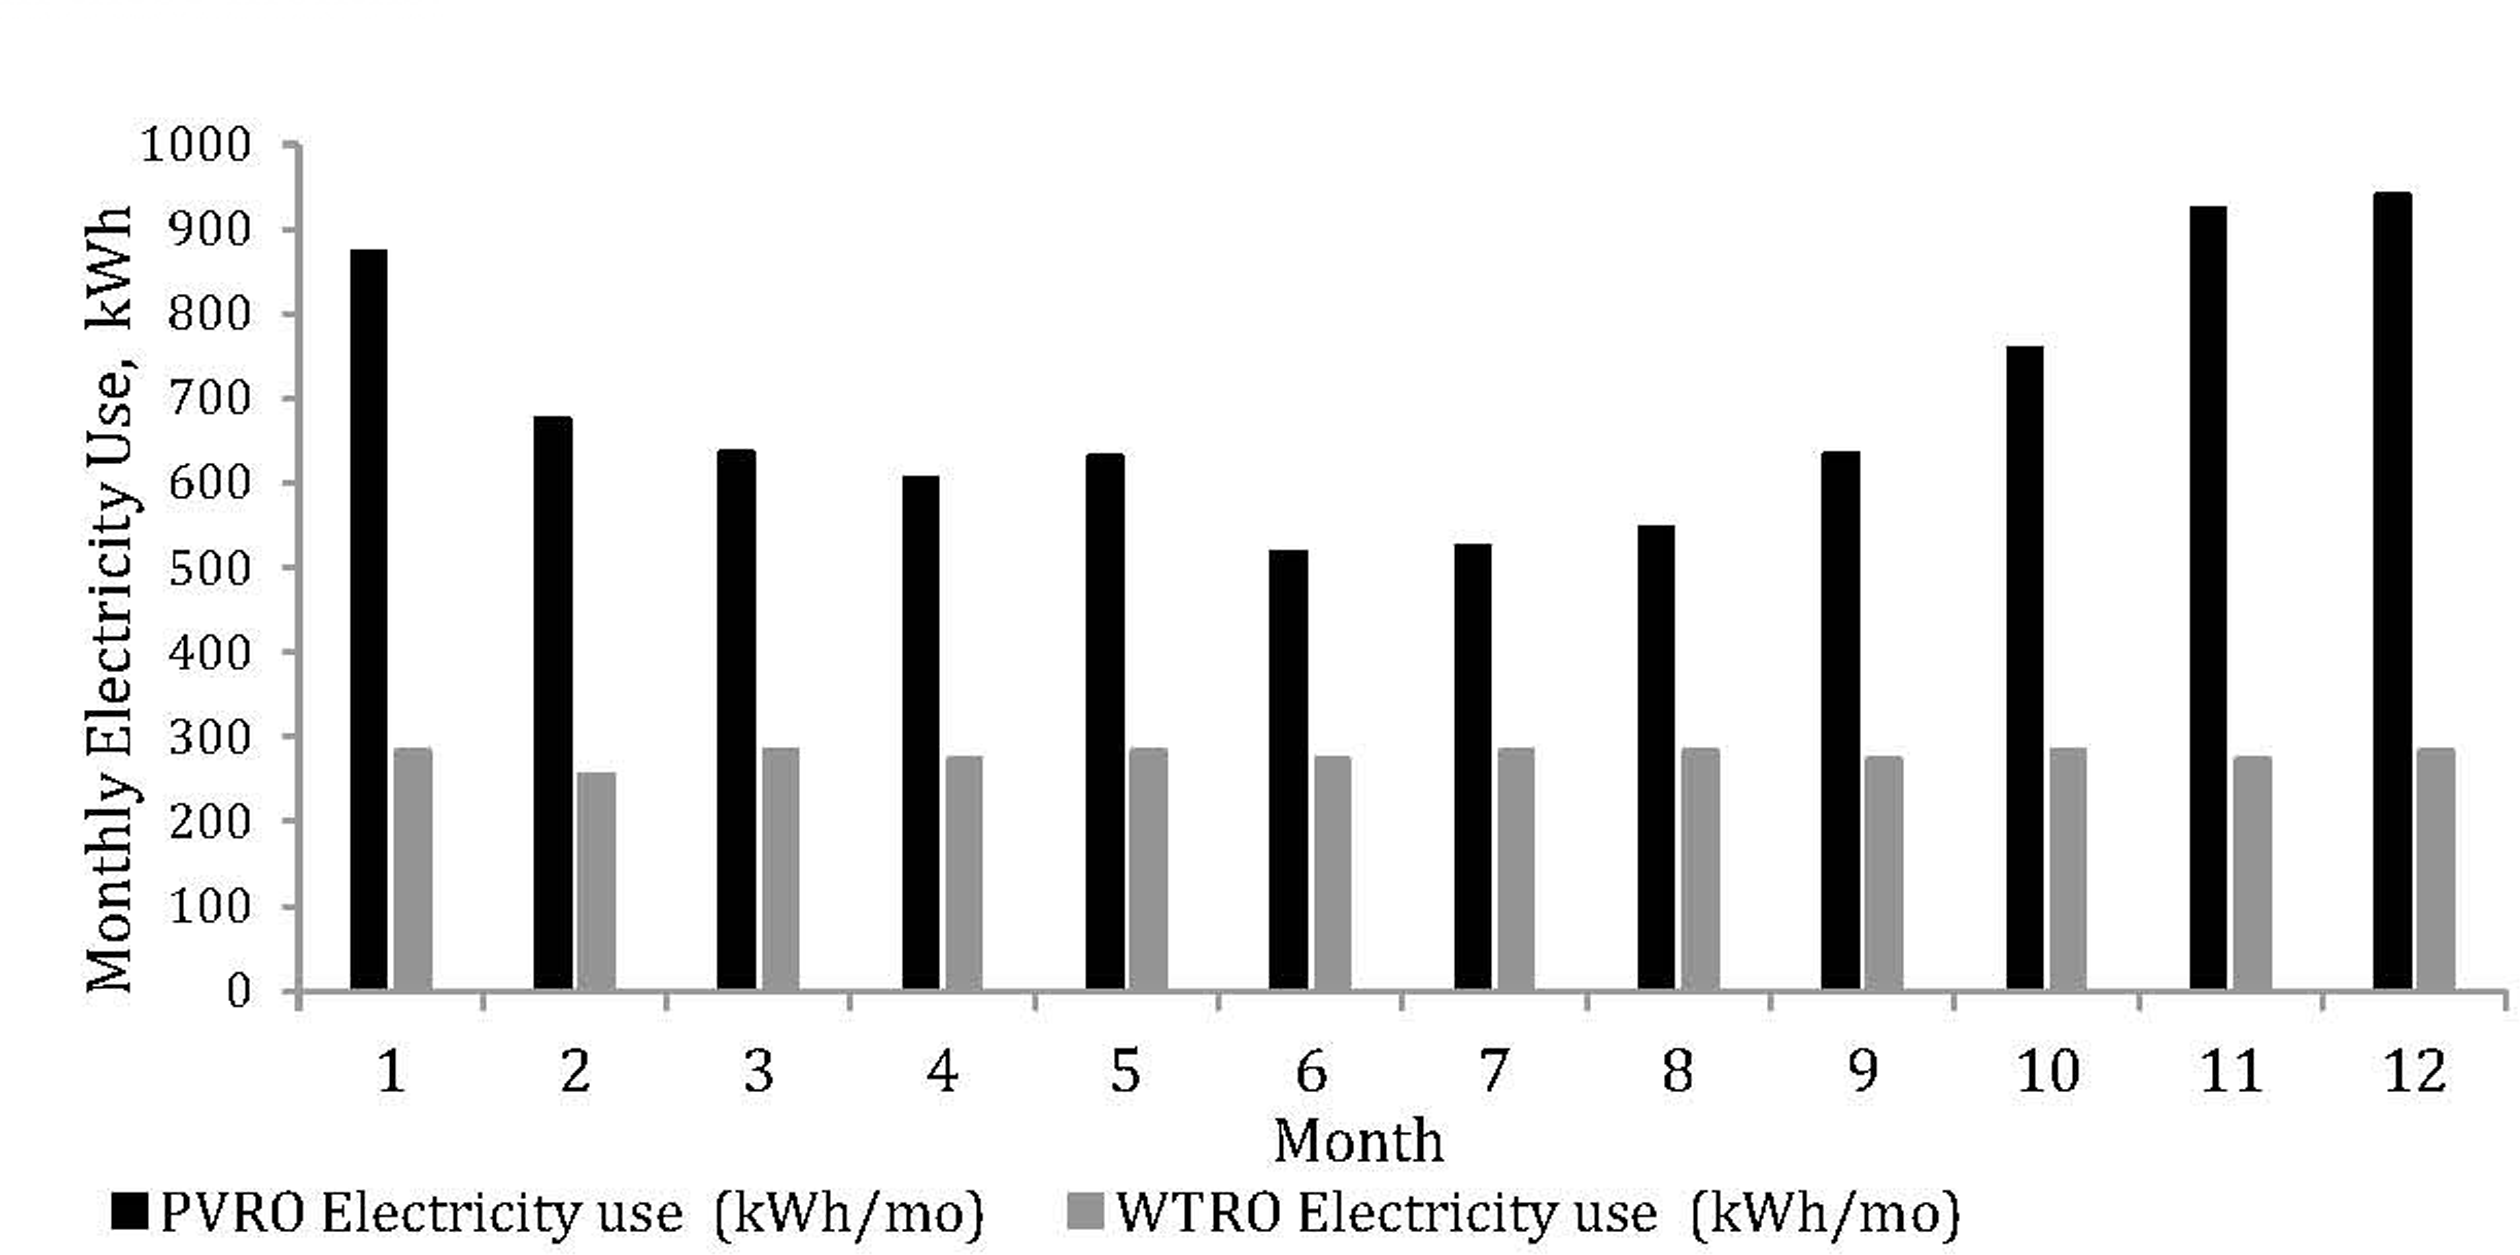
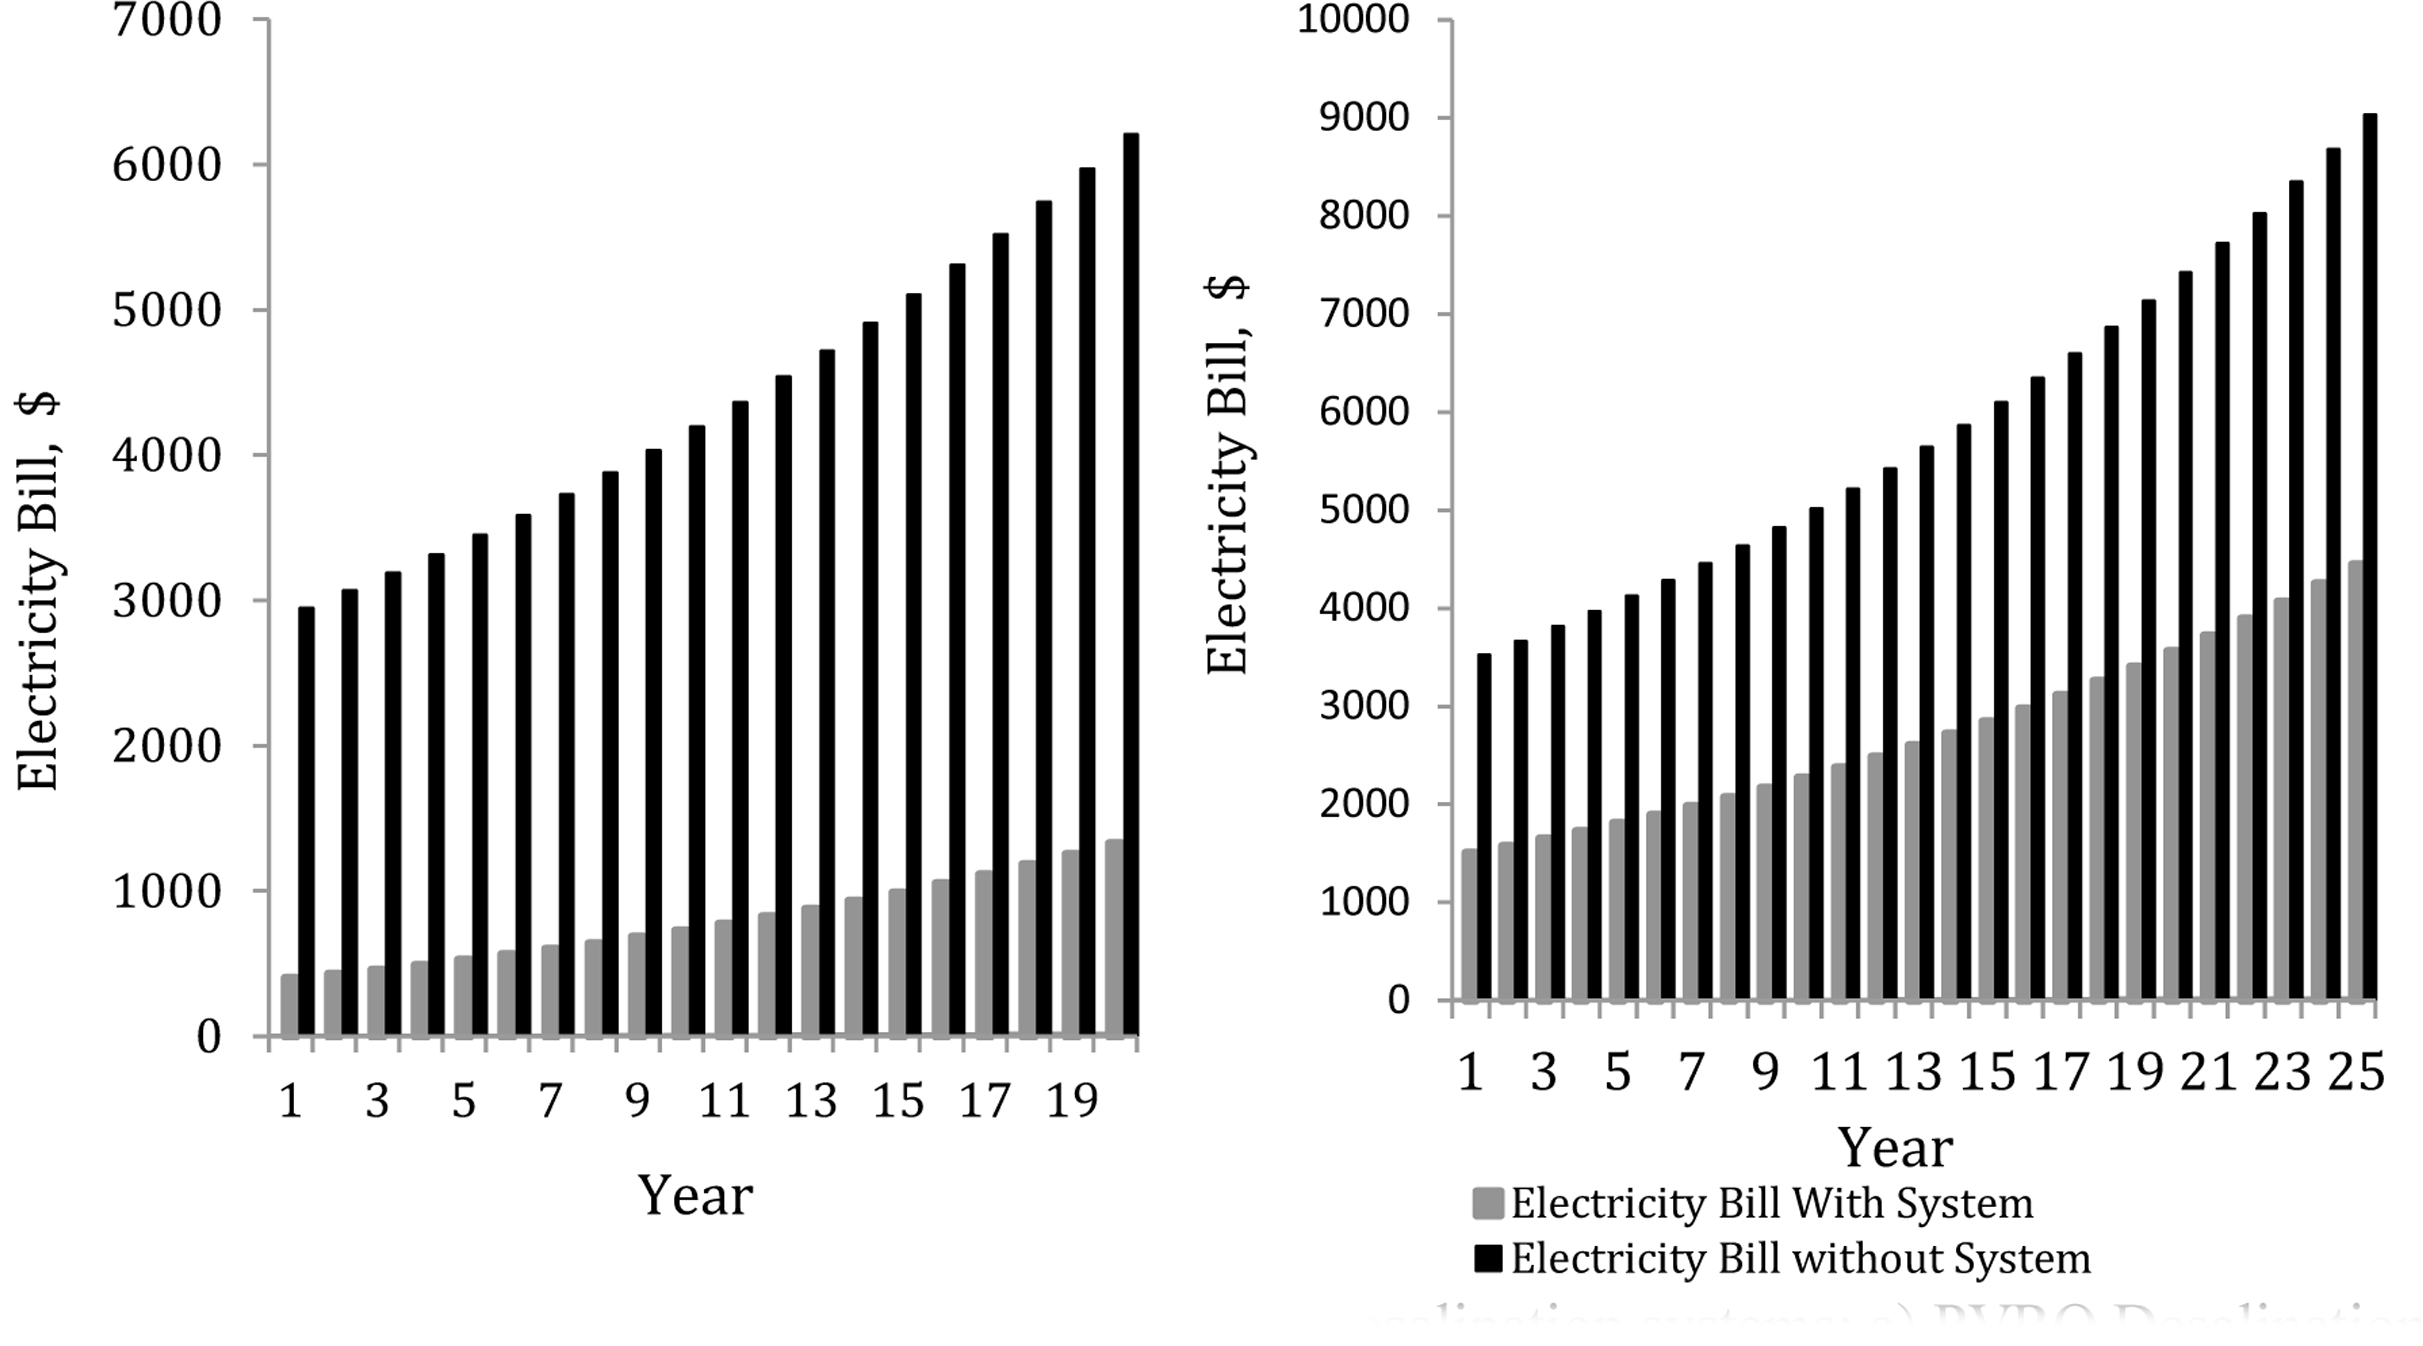
The technical and economic simulation results of SAM are demonstrated in-depth as follows for the renewable energy system of PVRO and WTRO systems. Table 2 shows the annual energy production from PVRO and WTRO desalination systems. Monthly electric energy production from PVRO and WTRO with the energy required to supply the defined load is presented in Figure 6 while Figure 7 exhibits the monthly electric production comparing to electricity load and electricity to/from the grid. Monthly electricity use in kWh of PVRO/WTRO Desalination Systems is given in Figure 8. Figure 9 describes the electricity bill with/without PVRO/WTRO desalination systems, while Figure 10 focuses on electricity bill share percentages of PVRO and WTRO systems. After-tax cash flow-system lifetime diagram of PVRO/WTRO desalination systems is shown in Figure 11. Figure 12 collects vital economic indicators of compassion between PVRO and WTRO desalination systems in NPV, LCOE, payback period, and cost of water distilled terms.
Annual energy production of PVRO/WTRO desalination systems
Year |
The Energy of PVRO (kWh) |
The Energy of WTRO (kWh) |
Year |
The Energy of PVRO (kWh) |
The Energy of WTRO (kWh) |
1 |
16279.8 |
21216.7 |
14 |
15252.8 |
19878.3 |
2 |
16198.4 |
21110.7 |
15 |
15176.5 |
19778.9 |
3 |
16117.4 |
21005.1 |
16 |
15100.7 |
19680 |
4 |
16036.8 |
20900.1 |
17 |
15025.2 |
19581.6 |
5 |
15956.7 |
20795.6 |
18 |
14950 |
19483.7 |
6 |
15876.9 |
20691.6 |
19 |
14875.3 |
19386.3 |
7 |
15797.5 |
20588.1 |
20 |
14800.9 |
19289.3 |
8 |
15718.5 |
20485.2 |
21 |
14726.9 |
|
9 |
15639.9 |
20382.8 |
22 |
14653.3 |
|
10 |
15561.7 |
20280.9 |
23 |
14580 |
|
11 |
15483.9 |
20179.5 |
24 |
14507.1 |
|
12 |
15406.5 |
20078.6 |
25 |
14434.6 |
|
13 |
15329.4 |
19978.2 |
From Table 2, it is clear the annual energy produced from the WTRO system is larger than the annual energy produced from PVRO. For the PVRO system; the greater annual energy production occurred in the first year is 21216.7 kWh while 16279.8 from the PVRO system. In the last five years, the WTRO system hasn't produced energy because the project lifetime is 20 yr depends on a lifetime of wind turbine.
From above Figure 6: the difference between monthly energy produced from the WTRO system and required electrical energy supplying the defined load (300 kWh average) is greater than the difference in case of 600 kWh - PVRO system as energy generated from WTRO is larger than that generated PVRO, as previously mentioned. In the PVRO system the highest generated energy is produced is in July of 1550 kWh monthly average while the highest energy produced from the WTRO system is in January of 1750 kWh average.
Monthly energy produced with electricity load. a) PVRO Desalination System; b) WTRO Desalination System
As shown in Figure 7, the WTRO system electricity from the grid is less than from PVRO due to energy produced from WTRO is larger than from PVRO. In the WTRO, the electricity from the grid is small because the wind turbine produced energy that fulfills the required load and the excess sold to the grid. The monthly average electricity from the grid of PVRO is around 800 kWh while 300 kWh of WTRO system.
Monthly energy produced comparing to electricity load and electricity from/to grid:
From Figure 8, it is found the monthly electricity use of the WTRO system is less than of the PVRO system because the energy produced from the WTRO system is larger than produced from PVRO. The monthly average electricity used of the PVRO system is around 600 kWh and 250 kWh for the WTRO system. The lowest electricity use occurred in January for the WTRO system and July for PVRO because the WT and PV produced the highest energy in these months.
Monthly electricity usage in kWh of PVRO/WTRO desalination systems
In Figure 9, the electricity bill without PVRO or WTRO system is more expensive. The annual average electricity bill without a PVRO system is around 6000 $ while with this system the bill is 3000 $ almost half of the bill. For the WTRO system, the annual average bill electricity becomes after installation system to 600 $ while without this system, it was 4000 $. As mentioned before; the electricity bill of PVRO is more than of WTRO due to electricity use in PVRO is more than in WTRO.
Electricity bill with/without PVRO/WTRO desalination systems: a) PVRO Desalination System; b) WTRO Desalination System
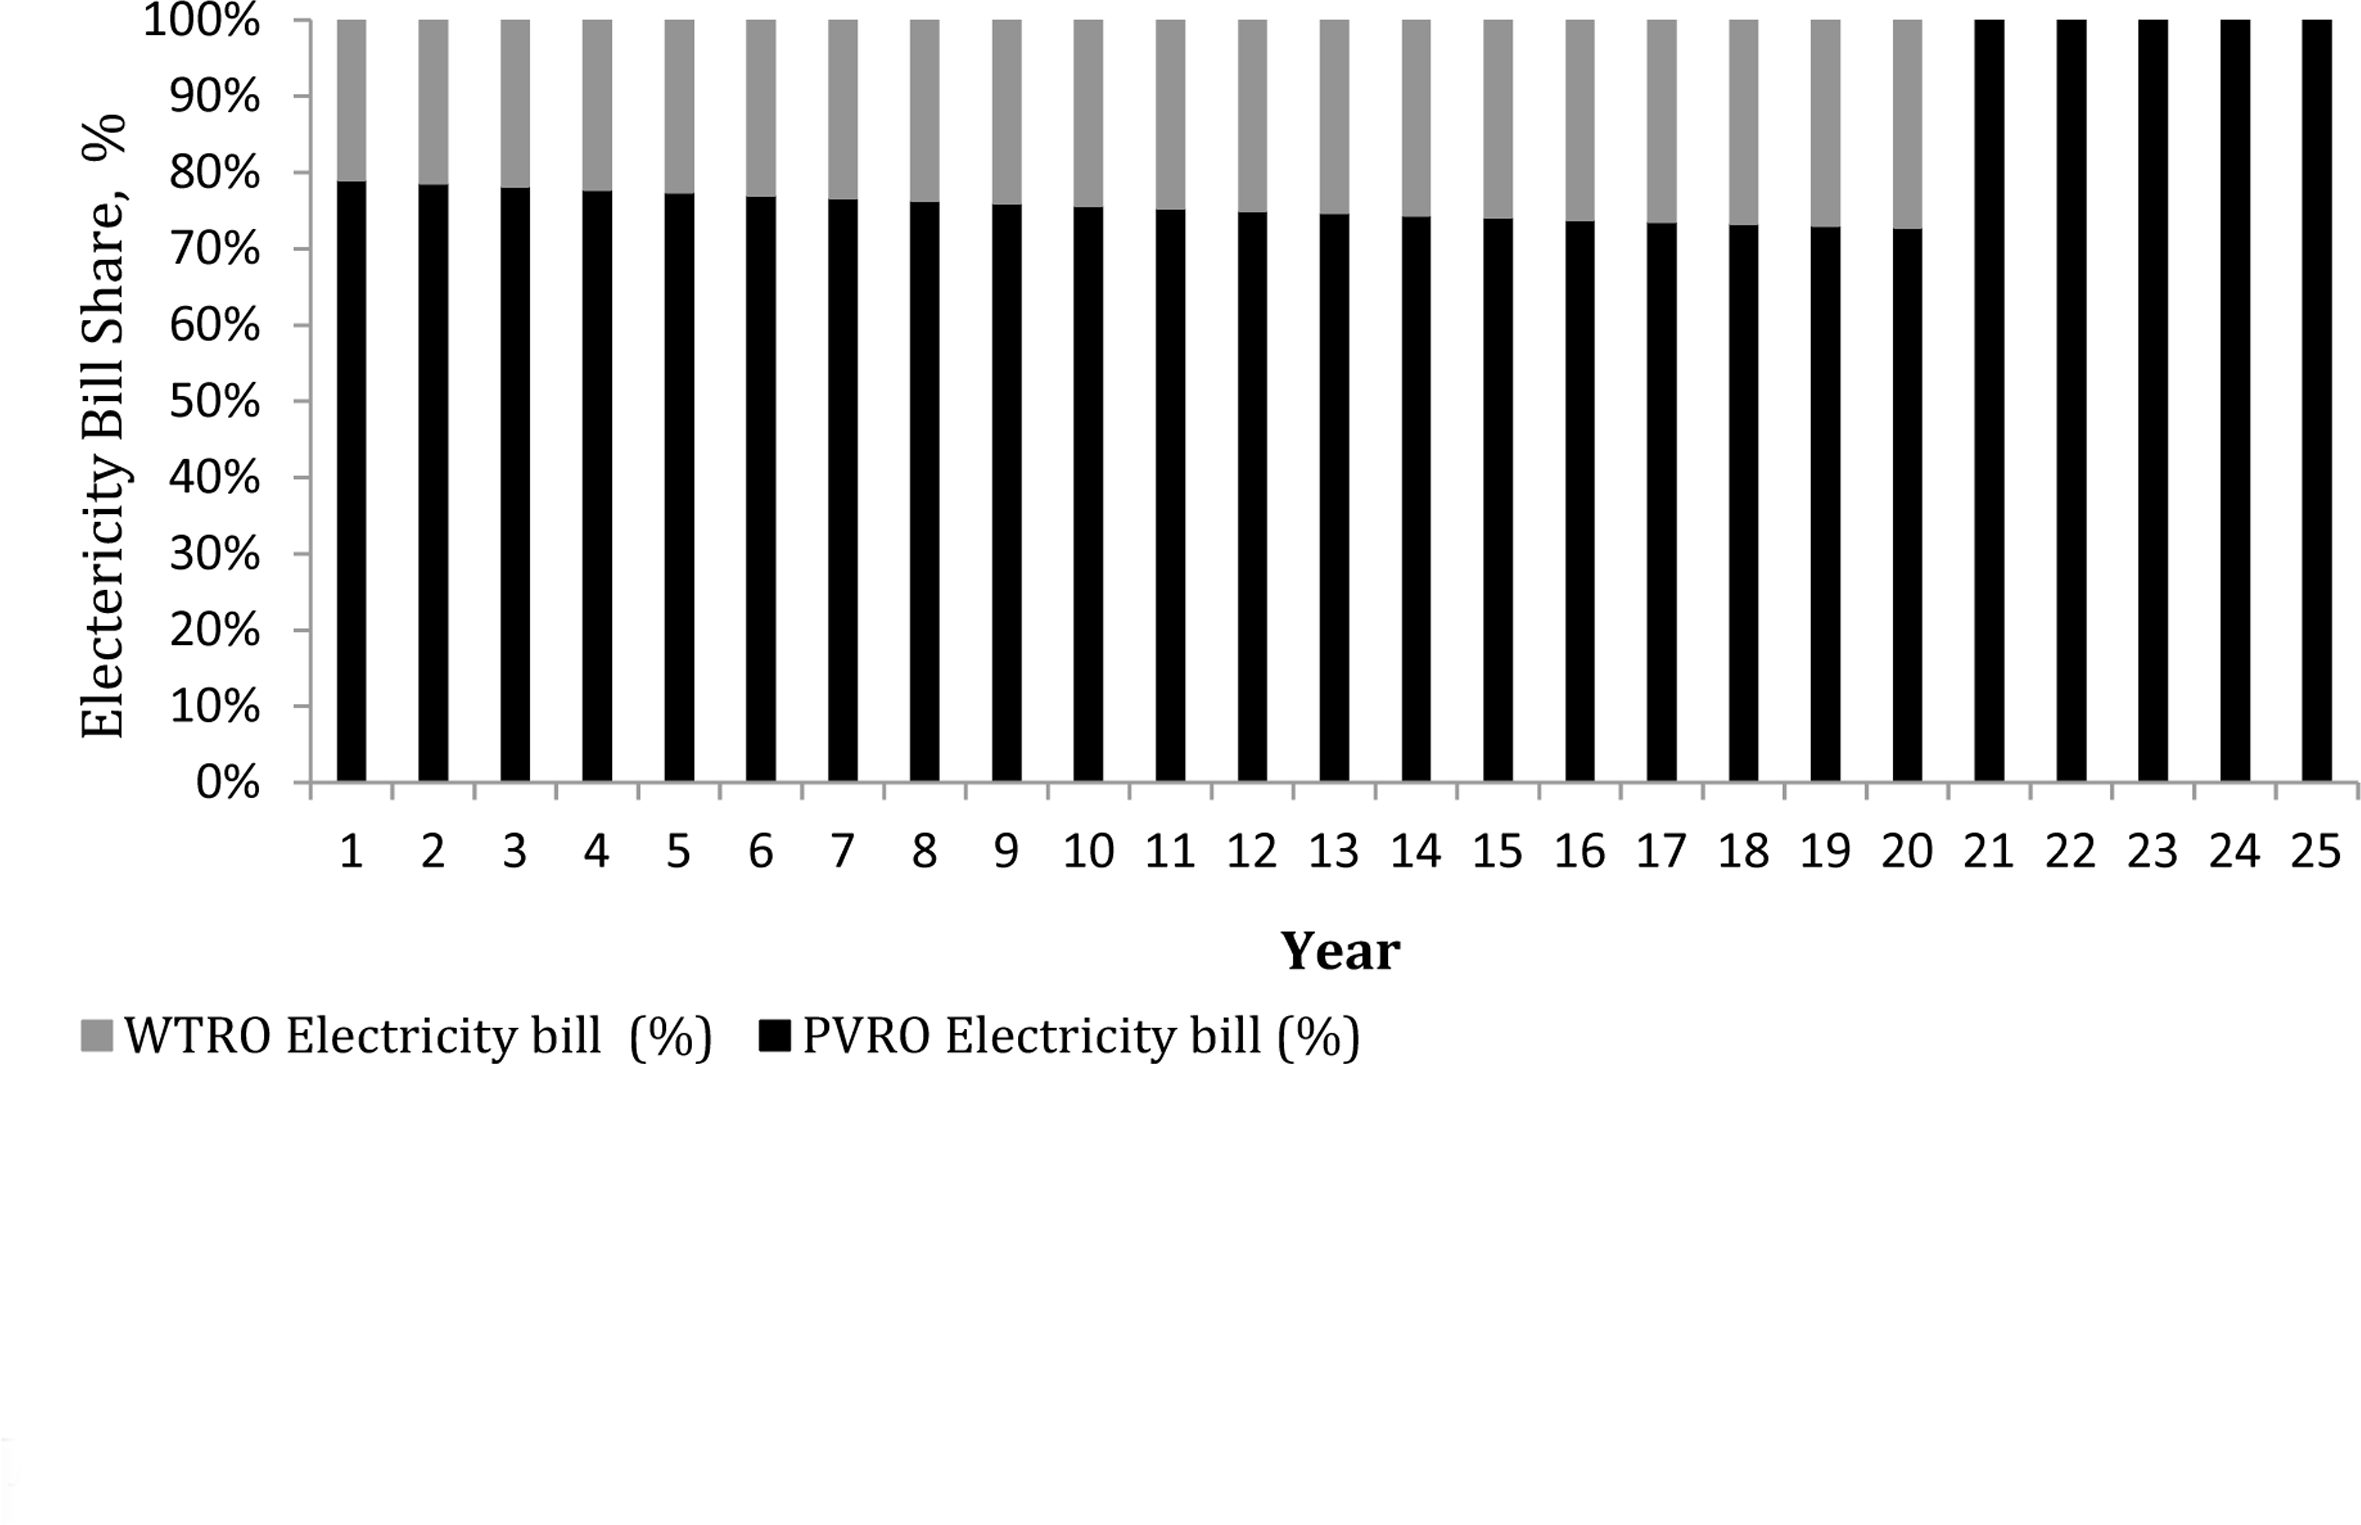
From Figure 10, the electricity bill share of the PVRO system has the maximum percentage compared to that of WTRO. It is found that the electricity bill share of PVRO is around 78% but WTRO is 22%. This is due to large electricity use in PVRO than the WTRO system.
Electricity bill share in % of PVRO/WTRO desalination systems
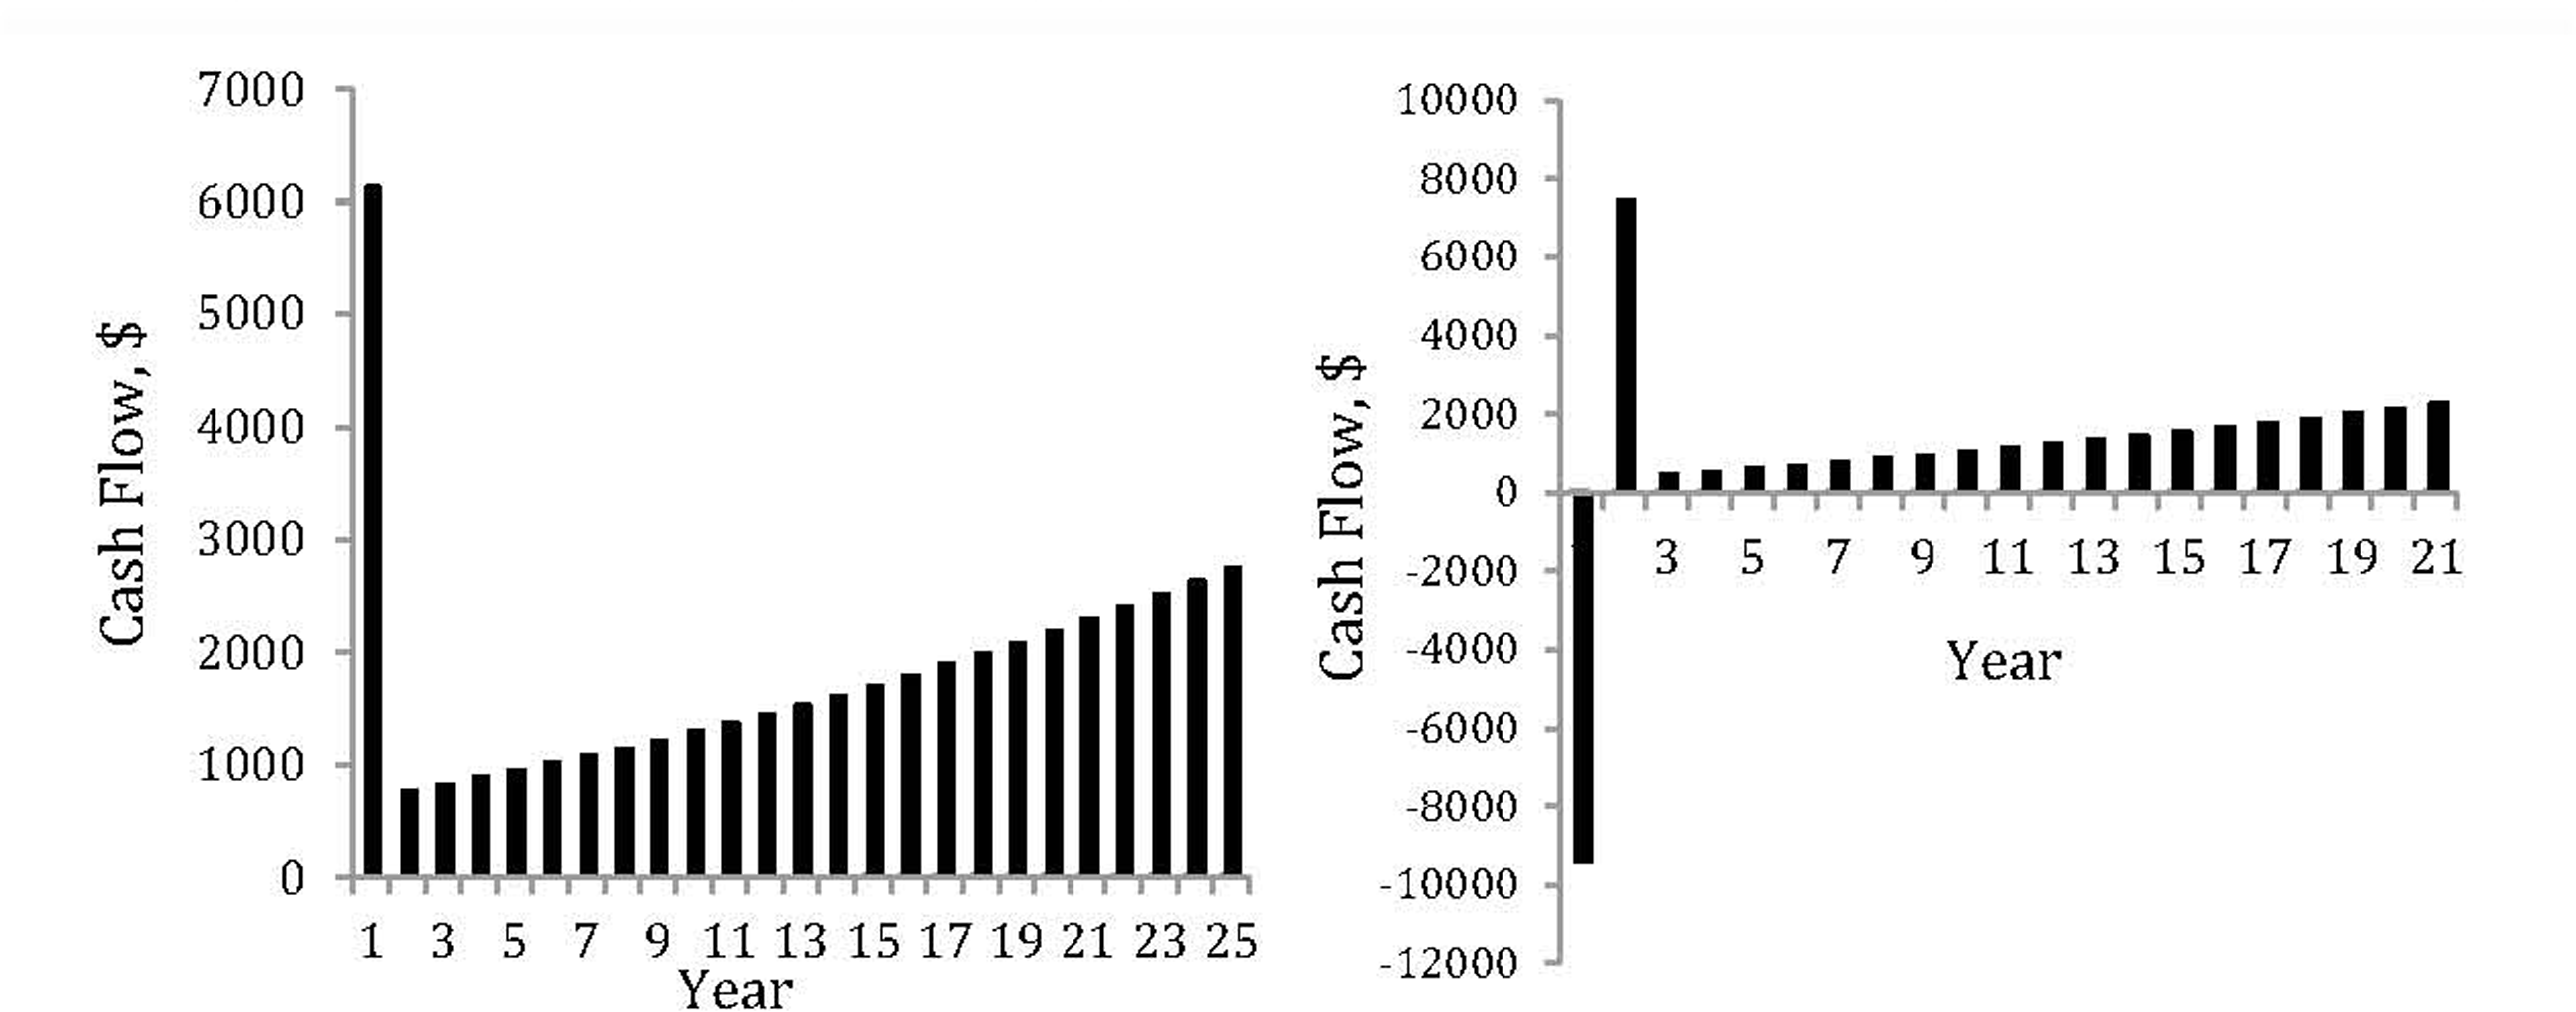
After-tax cash flow-system lifetime of PVRO/WTRO desalination systems: a) PVRO Desalination System; b) WTRO Desalination System
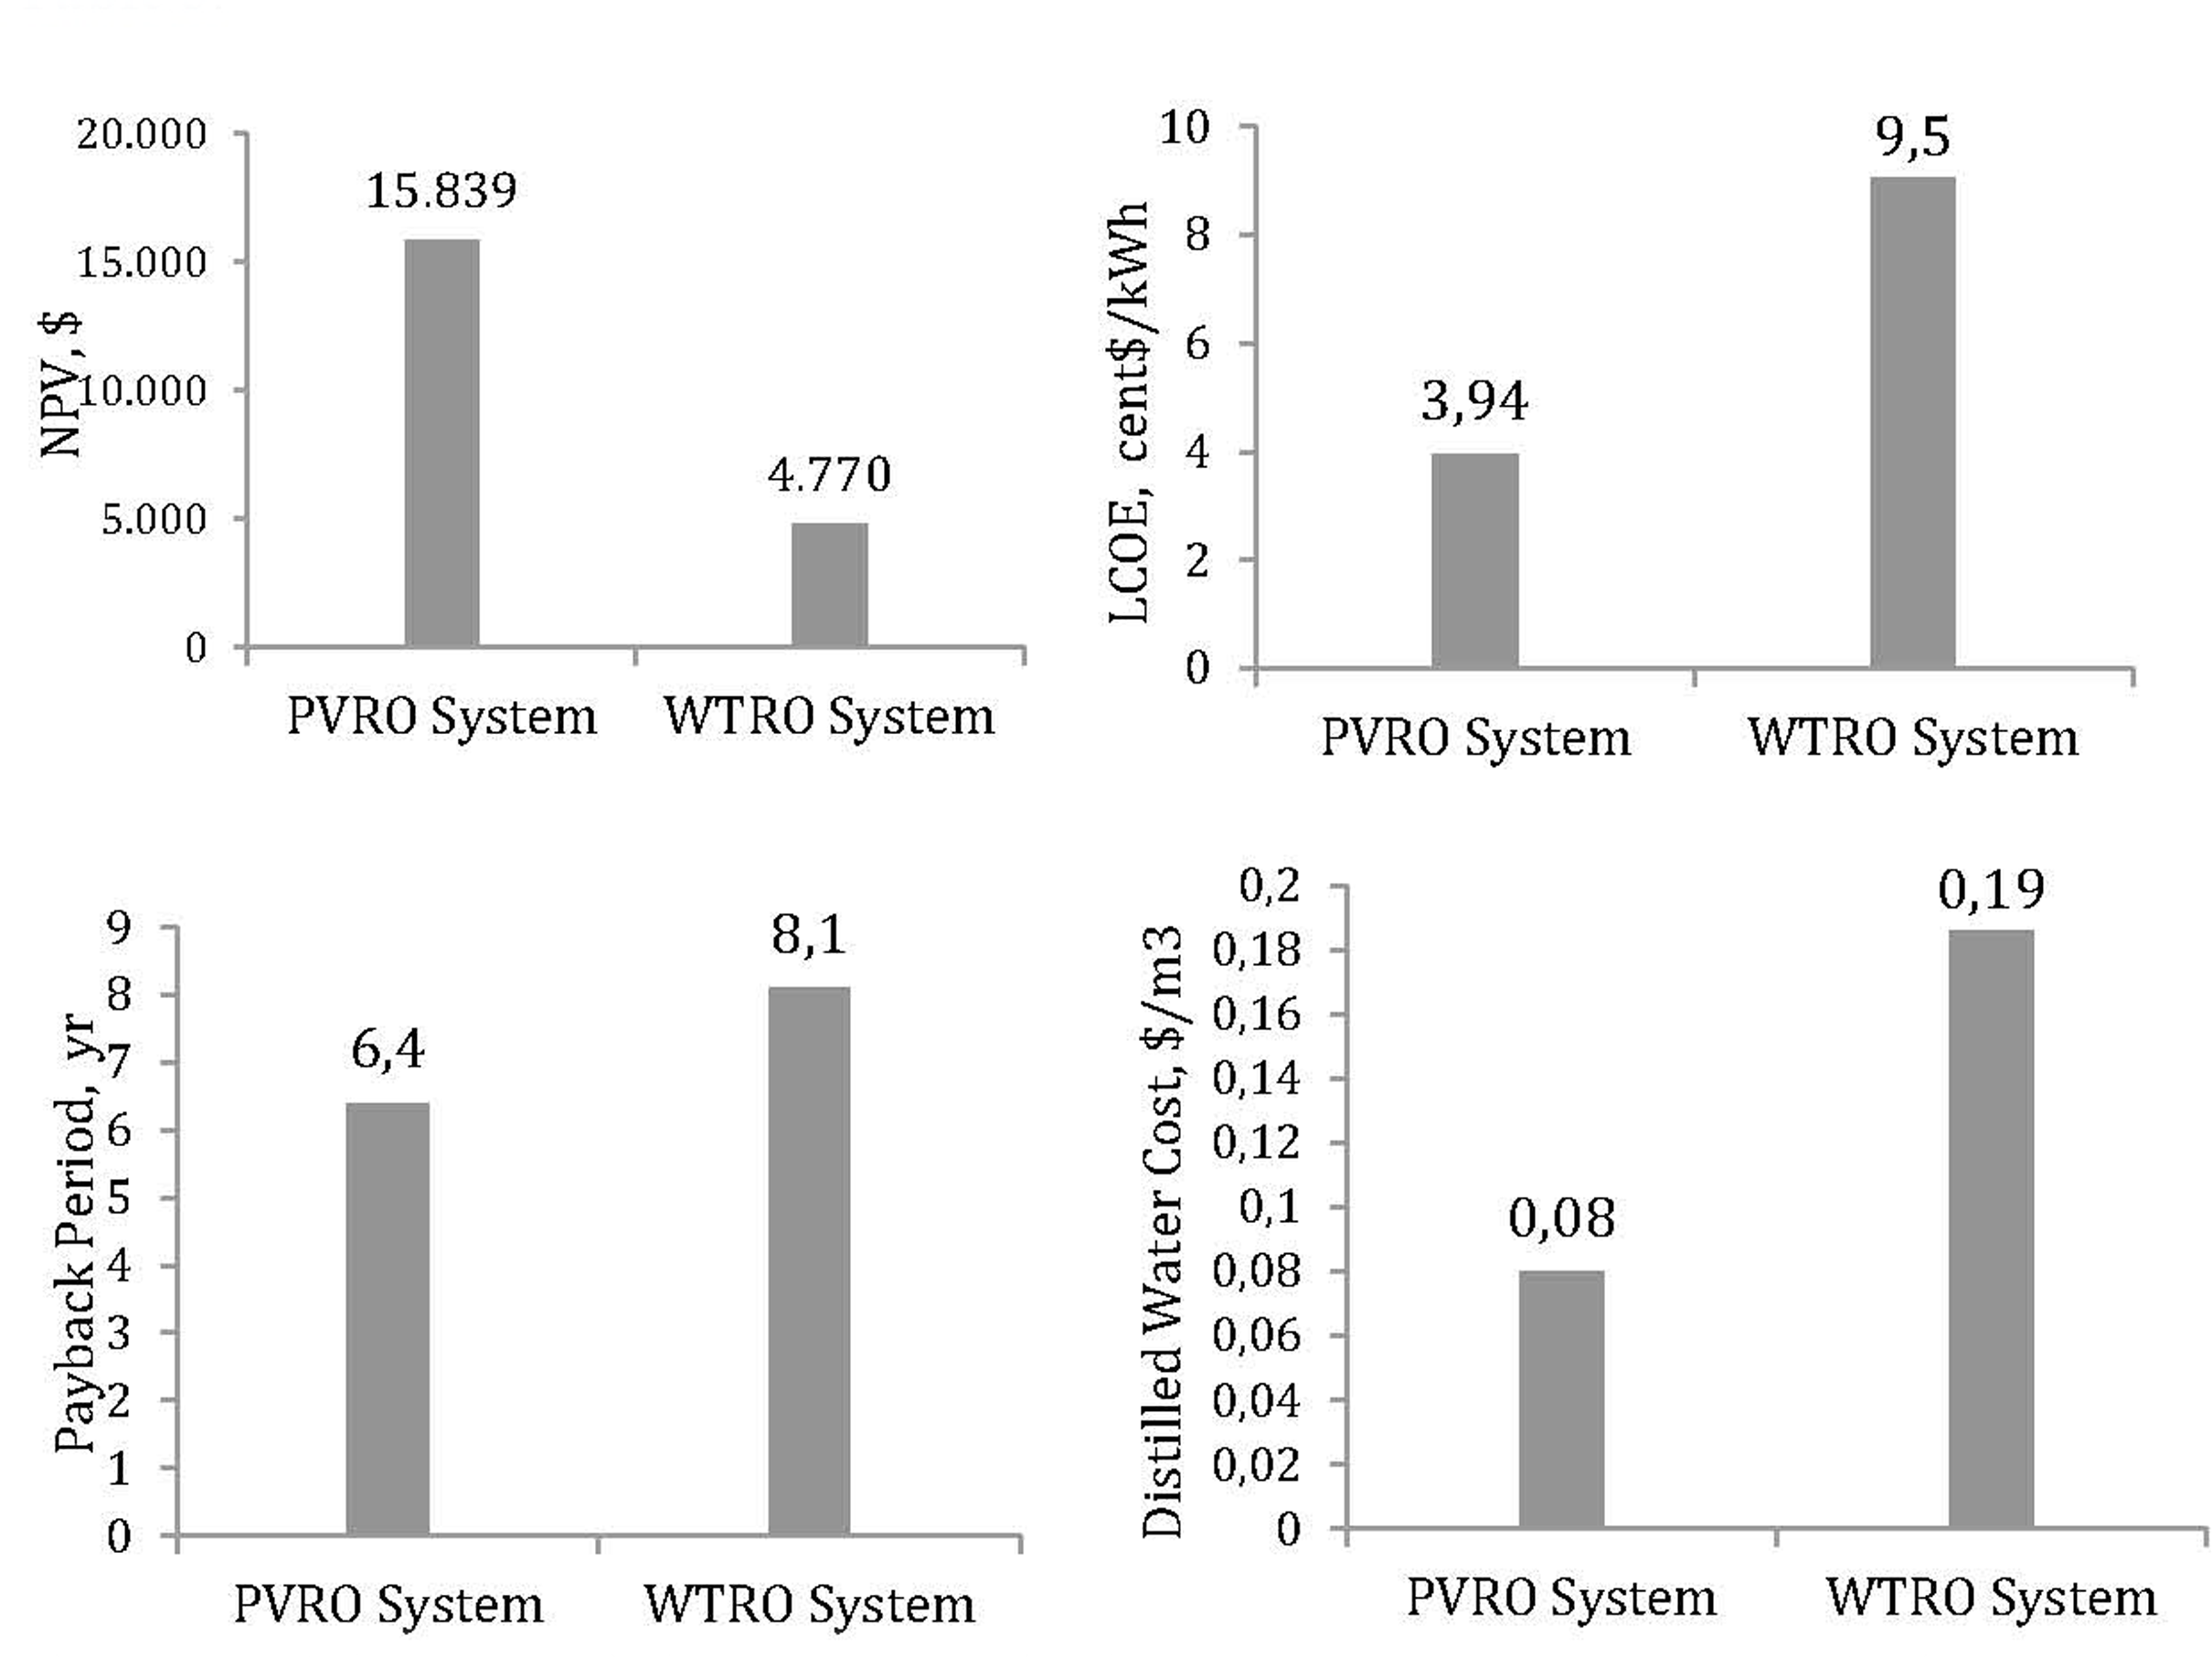
As illustrated in Figure 12, the NPV of PVRO and WTRO systems have positive values that indicate that these proposed systems are profitable. The NPV of the PVRO system (15,839 $) is greater than of the WTRO system (4,770 $). Consequently, the cost of energy of the PVRO system is less than of WTRO (3.94 and 9.5 cent$/kWh). The PVRO system payback period is 6.4 yr while it is 8.1 yr for the WTRO system. The cost of desalinated water produced from this desalination system is 0.08 $/m3 (1.28 EGP/m3) for PVRO and 0.19 $/m3 (3.04 EGP/m3) for WTRO systems. These factors lead to the conclusion that the PVRO system is more economical for this case study. The summary of the results is illustrated as following in Table 3.
Vital economic indicators compassion between PVRO and WTRO desalination systems: a) Net Present Value (NPV), $; b) Cost of Energy (LCOE), ȼ$/kWh; c) Payback Period (yr); d) Cost of 1m3 distilled water ($/m3)
Summary of results from PVRO/WTRO desalination systems comparison
PVRO System |
WTRO System |
|
Capital Cost, $ |
48,080 |
53,500 |
NPV, $ |
15,839 |
4,770 |
LCOE, cent$/kWh |
3.94 |
9.50 |
Cost of 1 m3 Distilled Water, $/m3 |
0.08 |
0.19 |
Payback Period, yr |
6.4 |
8.1 |
Performance Ratio, % |
82 |
77 |
Capacity Factor (year 1), % |
23.8 |
30.2 |
Annual Energy (year 1), kWh |
16,280 |
21,217 |
Electricity bill with the system (year 1), $ |
1,507 |
400 |
Electricity bill without the system (year 1), $ |
3,521 |
2,946 |
The main result of this study is that the PVRO solar desalination system is the best choice system for the case under study in view of technological and economic appraisal. Also, this proposed system is environment friendly considering due to the environmental impacts of CO2 that have not been emitted because of renewable energy supplies. This system investigated illustrated the cost of one cubic meter of distilled water is cheap compared to other scientific researches in this field and prices of water by conventional methods in other regions of Egypt.
So, this work is a powerful tool to demonstrate Solar or Wind RO desalination unit's techno-economic and environmental feasibility in implementing this approach for new Egyptian communities.
Nowadays, the water desalination field has a vital role in Egypt's asset projects. In addition to non-conventional water sources, desalination is used for domestic water supply at some places along the Mediterranean and the Red Sea coasts. Water collected from groundwater wells is brackish in new Egyptian communities, and typically non-potable. In this analysis, the possibility of combining the grid desalination plant with a solar photovoltaic (PV) or the wind turbine (WT) is discussed; with the objective of producing water at low cost and sustainably. Using the SAM software package as a simulation tool to producing clean water for the new community area in Ras-Gharib Region, Egypt; a small-scale Solar/Wind Reverse Osmosis system was proposed. The proposed system was planned to generate 0.5 m3/h which equals 4 m3/day of potable water, (according to the tank size), for eight hours of RO unit operating cycle. Conclusions of this study are presented in the following points:
The capital cost of the PVRO system is 48,080 $ while 53,500 $ for the WTRO system.
The cost of electricity of the PVRO system is less than the WTRO (3.94, 9.50 cent$/kWh respectively).
The Payback period of the PVRO system is 6.4 yr which is less than the WTRO system of 8.1 yr.
The cost of one cubic meter of distilled water is 0.08 $ for the PVRO and 0.19 $ for the WTRO systems.
From above points, it is clear that the PVRO is better than WTRO due to technical and economic evaluated aspects. So, the outcome of this study is that solar RO desalination system is the optimum and more appropriate choice for this case study from both technical and economic point of view.
Desalination using renewable energy sources will provide a safe route to freshwater development. This is expected to become economically attractive, as renewable energy costs continue to decline and fossil fuel prices continue to increase. It is reasonable that the wind turbine component has the highest output of the current study; the wind turbine component has the highest capital and overall cost. Thus in future studies, it is suggested that the portion of the wind turbine is replaced by a hydrokinetic turbine and that the economic analysis of the proposed model can be examined.
A |
membrane permeability for pure water |
[kg/N] |
A |
wind turbine swept area |
[m2] |
AS |
area of the solar panel |
[m2] |
B |
membrane permeability for salt |
[kg/m2 s] |
C |
salt concentration |
[kg/m3] |
Celect |
price of the electricity produced |
[$/kWh] |
CRO |
total cost of RO unit |
[$] |
Ct |
tank cost |
[$] |
CRO,M&O |
cost of operating & maintaining RO system |
[$] |
Cw |
wind turbine performance coefficient |
[-] |
c |
Weibull scale factor |
[-] |
E |
energy production from PV modules |
[kWh] |
Em |
electric power given by the wind turbine |
[W] |
Efromhs |
electricity generated by power system |
[kWh] |
H |
annual average of solar radiation |
[kWh/m2] |
hv |
specific enthalpy |
[kJ/kg] |
I |
solar irradiance |
[kWh/m2day] |
IRO |
specific capital cost of RO unit |
[m2] |
k |
Weibull shape factor |
[-] |
MNaCl |
molar mass of NaCl |
[m2] |
mass flow rate |
[m2] |
|
mi |
instantaneous condensation rate |
[m2] |
Np |
pressure vessels |
[Pa] |
Pm |
wind turbine mechanical power torque |
[Nm] |
pB |
feed water pressure |
[Pa] |
pf |
concentrate pressure |
[Pa] |
heat transfer rate |
[kW] |
|
Qannual |
annual water production |
[m3/yr] |
Qf,t |
total feed flow rate |
[m3/h] |
Qp,t |
total product rate |
[m3/h] |
QP |
hourly production in m3 |
[m3/h] |
Qp |
the product water flow rate |
[m3/h] |
Qs |
salt flow rate |
[m3/h] |
product water flow rate of membrane k |
[m3/h] |
|
R |
universal gas constant |
[J/mol K] |
r |
membrane salt rejection rate |
[-] |
S |
module surface area |
[m2] |
T |
water temperature |
[K] |
V |
wind speed |
[m/s] |
Vav |
mean wind speed |
[m/s] |
Y |
PV panel yield |
[%] |
α |
shear factor |
[-] |
β |
blade pitch angle |
[deg] |
Г |
gamma function |
[-] |
Δp |
difference of trans-membrane pressures |
[Pa] |
Δt |
time interval |
[s] |
Δπ |
difference of trans - membrane osmotic pressures |
[Pa] |
η |
energy efficiency desalination system |
[%] |
λ |
tip speed ratio |
[-] |
ρ |
air density |
[kg/m3] |
ϕ |
water recovery rate |
[-] |
ωr |
rotor rotational speed |
[rpm] |
AGL |
Above Ground Level |
AEP |
Annual Electricity Production |
ANN |
Artificial Neural Network |
ADS |
Autonomous Desalination Systems |
BB |
Battery Bank |
TCC |
Capital Cost of Overall System |
CSP |
Concentrating Solar Power |
CODW |
Cost of Desalinated Water |
COE |
Cost of Energy Produced |
DG |
Diesel Generator |
EWRA |
Egyptian Water Regulatory Agency |
FOC |
Fixed Annual Operating Cost |
FCR |
Fixed Charge Rate |
FO |
Forward Osmosis |
GIS |
Geographical Information System |
GHG |
Green House Gases |
HOMER |
Hybrid Optimization Modelling for Electric Renewables |
HRES |
Hybrid Renewable Energy System |
LCOW |
Levelized Cost of Water |
LCOE |
Life Cost of Energy |
MM |
Membrane Method |
MED |
Multi Effect Distillation |
PV |
Photovoltaic |
PVRO |
Photovoltaic Powered Reverse Osmosis |
PR |
Performance Ratio |
PRP |
Production Rate Performance |
RE |
Renewable Energy |
RO |
Reverse Osmosis |
SAM |
System Advisor Model |
ST-RO |
Solar Thermal Reverse Osmosis |
VOC |
Variable Operating Cost |
WT |
Wind Turbine |
WTRO |
Wind Turbine Powered Reverse Osmosis |
WHO |
World Health Organization |
- , Hybrid renewable energy systems for desalination, 2020
- ,
Performance analysis of a stand-alone hybrid energy system for desalination unit in Egypt ,Energy Convers Manag , Vol. 215 (February),pp 112941 , 2020, https://doi.org/https://doi.org/10.1016/j.enconman.2020.112941 - Sustainable Development Strategy: Egypt's vision 2030 And Planning Reform, https://Sustainabledevelopment.un.org, Accessed: 21-Dec-2020
- Smart water magazine, Desalination Projects in Egypt,2020, https://smartwatermagazine.com/news/smart-water-magazine/egypt-build-47-desalination-plants-following-5-years, Accessed: 21-Dec-2020
- Mohamed Farag, Egypt Desalination Plans, 2019, https://dailynewsegypt.com/2019/12/02/egypt-receives-3-international-bids-to-implement-joint-water-desalination-projects, Accessed: 21-Dec-2020
- ,
Introduction to Renewable Energy Powered Desalination ,Renewable Energy Powered Desalination Handbook ,pp 3-46 , 2018, https://doi.org/https://doi.org/10.1016/B978-0-12-815244-7.00001-5 - ,
Local cost of seawater RO desalination based on solar PV and wind energy: A global estimate ,Desalination , Vol. 385 ,pp 207-216 , 2016, https://doi.org/https://doi.org/10.1016/j.desal.2016.02.004 - ,
Seawater desalination using renewable energy sources ,Prog Energy Combust Sci , Vol. 31 (3),pp 242-281 , 2005, https://doi.org/https://doi.org/10.1016/j.pecs.2005.03.001 - ,
Desalination using renewable energy sources on the arid islands of South Aegean Sea ,Energy , Vol. 94 ,pp 262-272 , 2016, https://doi.org/https://doi.org/10.1016/j.energy.2015.11.003 - ,
Water resources management II ,Prog Water Resour , Vol. 8 (2),pp 269-279 , 2003, https://doi.org/https://doi.org/10.21608/jesaun.2009.121215 - ,
Osmotic desalination by solar energy: A critical review ,Renew Energy , Vol. 134 ,pp 1473–1490 , 2019, https://doi.org/https://doi.org/10.1016/j.renene.2018.09.038 - ,
Solar powered desalination – Technology, energy and future outlook ,Desalination , Vol. 453 (November),pp 54-76 , 20182019, https://doi.org/https://doi.org/10.1016/j.desal.2018.12.002 - ,
Thermodynamic analysis of a solar thermal facilitated membrane seawater desalination process ,J Clean Prod , Vol. 256 ,pp 120398 , 2020, https://doi.org/https://doi.org/10.1016/j.jclepro.2020.120398 - ,
Modeling and performance analysis of a fully solar-powered stand-alone sweeping gas membrane distillation desalination system for island and coastal households ,Energy Convers Manag , Vol. 205 (December 2019),pp 112375 , 2020, https://doi.org/https://doi.org/10.1016/j.enconman.2019.112375 - ,
Technical and economic evaluation of an off-grid solar desalination system in Myanmar ,J Water Supply Res Technol - AQUA , Vol. 65 (4),pp 354–360 , 2016, https://doi.org/https://doi.org/10.2166/aqua.2016.009 - ,
Techno-economic analysis of low impact solar brackish water desalination system in the Brazilian Semiarid region ,J Clean Prod , Vol. 248 ,pp 119255 , 2020, https://doi.org/https://doi.org/10.1016/j.jclepro.2019.119255 - ,
Evaluating the economic viability of solar-powered desalination: Saudi Arabia as a case study ,Int J Water Resour Dev , Vol. 32 (3),pp 412-427 , 2016, https://doi.org/https://doi.org/10.1080/07900627.2015.1109499 - ,
Design and economic evaluation of solar-powered hybrid multi effect and reverse osmosis system for seawater desalination ,Desalination , Vol. 465 (November 2018),pp 114-125 , 2019, https://doi.org/https://doi.org/10.1016/j.desal.2019.04.016 - ,
Technoeconomic analysis of solar thermal desalination ,Desalination , Vol. 474 (September 2019),pp 114168 , 2020, https://doi.org/https://doi.org/10.1016/j.desal.2019.114168 - ,
Optimal design and scheduling of a solar-assisted domestic desalination systems ,Comput Chem Eng , Vol. 132 ,pp 106605 , 2020, https://doi.org/https://doi.org/10.1016/j.compchemeng.2019.106605 - ,
Simulation and optimization of solar desalination plant using Aspen Plus simulation software ,Procedia Eng , Vol. 105 (Icte 2014),pp 739-750 , 2015, https://doi.org/https://doi.org/10.1016/j.proeng.2015.05.065 - ,
Solar desalination system with a focal point concentrator using different nanofluids ,Appl Therm Eng , Vol. 174 (December 2019),pp 115058 , 2020, https://doi.org/https://doi.org/10.1016/j.applthermaleng.2020.115058 - ,
Performance improvement of thermal-driven membrane-based solar desalination systems using nanofluid in the feed stream ,Sustain Energy Technol Assessments , Vol. 39 (April, 2020), , https://doi.org/https://doi.org/10.1016/j.seta.2020.100715 - ,
Utilization of waste heat of a high-capacity wind turbine in multi effect distillation desalination: Energy, exergy and thermoeconomic analysis ,Desalination , Vol. 439 (April),pp 119-137 , 2018, https://doi.org/https://doi.org/10.1016/j.desal.2018.04.010 - ,
Wind-powered desalination for strategic water storage: Techno-economic assessment of concept ,Desalination , Vol. 408 ,pp 36-51 , 2017, https://doi.org/https://doi.org/10.1016/j.desal.2017.01.002 - ,
Wind-driven SWRO desalination prototype with and without batteries: A performance simulation using machine learning models ,Desalination , Vol. 435 (December 2017),pp 77-96 , 2018, https://doi.org/https://doi.org/10.1016/j.desal.2017.11.044 - ,
Reduction of water cost for an existing wind-energy-based desalination scheme: A preliminary configuration ,Energy , Vol. 167 ,pp 548-560 , 2019, https://doi.org/https://doi.org/10.1016/j.energy.2018.11.004 - ,
A hybrid renewable energy system as a potential energy source for water desalination using reverse osmosis: A review ,Renew Sustain Energy Rev , Vol. 97 (January),pp 456-477 , 2018, https://doi.org/https://doi.org/10.1016/j.rser.2018.08.049 - ,
Reverse osmosis (RO) membrane desalination driven by wind and solar photovoltaic (PV) energy: State of the art and challenges for large-scale implementation ,Renew Sustain Energy Rev , Vol. 112 (June),pp 669-685 , 2019, https://doi.org/https://doi.org/10.1016/j.rser.2019.06.008 - ,
Integration of hybrid power (wind-photovoltaic-diesel-battery) and seawater reverse osmosis systems for small-scale desalination applications ,Desalination , Vol. 435 (April 2017),pp 210-220 , 2018, https://doi.org/https://doi.org/10.1016/j.desal.2017.07.006 - ,
Assessment of Hybrid Renewable Energy Systems to supplied energy to Autonomous Desalination Systems in two islands of the Canary Archipelago ,Renew Sustain Energy Rev , Vol. 101 (February 2018),pp 221-230 , 2019, https://doi.org/https://doi.org/10.1016/j.rser.2018.11.009 - ,
Preliminary assessment of innovative seawater reverse osmosis (SWRO) desalination powered by a hybrid solar photovoltaic (PV) - Tidal range energy system ,Desalination , Vol. 477 (December 2019),pp 114247 , 2020, https://doi.org/https://doi.org/10.1016/j.desal.2019.114247 - ,
Artificial Neural Network power manager for hybrid PV-wind desalination system ,Math Comput Simul , Vol. 167 ,pp 443-460 , 2020, https://doi.org/https://doi.org/10.1016/j.matcom.2019.09.005 - ,
Optimal integration of small scale hybrid solar wind RO-MSF desalination system ,Renew Energy Focus , Vol. 27 (December),pp 120-134 , 2018, https://doi.org/https://doi.org/10.1016/j.ref.2018.05.003 - ,
Design of a cost-effective wind/photovoltaic/hydrogen energy system for supplying a desalination unit by a heuristic approach ,Sol Energy , Vol. 139 ,pp 666-675 , 2016, https://doi.org/https://doi.org/10.1016/j.solener.2016.09.028 - ,
Simulated annealing-chaotic search algorithm based optimization of reverse osmosis hybrid desalination system driven by wind and solar energies ,Sol Energy , Vol. 173 (April),pp 964-975 , 2018, https://doi.org/https://doi.org/10.1016/j.solener.2018.07.094 - ,
Economic evaluation of reverse osmosis desalination system coupled with tidal energy ,Front Energy , Vol. 12 (2),pp 297-304 , 2018, https://doi.org/https://doi.org/10.1007/s11708-017-0478-2 - ,
Multi-objective optimization of RO desalination plants ,Desalination , Vol. 222 (1-3),pp 96-118 , 2008, https://doi.org/https://doi.org/10.1016/j.desal.2007.02.064, A. and P. FrançoisVince, FrançoisMarech - ,
Design And Simulation Of Photovoltaic Energy System To Drive RO Desalination Plant , Vol. 2 (3),pp 1-10 , 2013 - ,
Simulation of a Hybrid Power System Consisting of Wind Turbine, PV, Storage Battery and Diesel Generator with Compensation Network: Design, Optimization and Economical Evaluation , Vol. 1 (1),pp 1-199 , 2008 - ,
YaoAzoumah, Modeling and optimization of batteryless hybrid PV (photovoltaic)/Diesel systems for off-grid applications ,Energy , Vol. 86 ,pp 152-163 , 2015, https://doi.org/https://doi.org/10.1016/j.energy.2015.03.128 - ,
An environmentally friendly factory in Egypt based on hybrid photovoltaic/wind/diesel/battery system ,J Clean Prod , Vol. 112 ,pp 3884-3894 , 2016, https://doi.org/https://doi.org/10.1016/j.jclepro.2015.07.008 - ,
A review of desalination by solar still ,Sol Desalin 21st Century , (June), 2007, https://doi.org/https://doi.org/10.1007/978-1-4020-5508-9 - ,
Solar Energy: Fundamentals, Design, Modelling and Applications ,Alpha Science International Ltd , 2015 - ,
System Advisor Model (SAM) General Description , (NREL/TP-6A20-70414), 2018 - ,
A manual for the economic evaluation of energy efficiency and renewable energy technologies ,Renew Energy , Vol. 95 (March),pp 73-81 , 1995, https://doi.org/https://doi.org/10.2172/35391 - Ras Gharib location, https://en.wikipedia.org/wiki/Ras_Ghareb#/media/File:Egypt_adm_location_map.svg, Accessed: 21-Dec-2020
- ,
Experimental implementation of meteorological data and photovoltaic solar radiation monitoring system ,Int Trans Electr ENERGY Syst , Vol. 25 ,pp 3573-3585 , 2015, https://doi.org/https://doi.org/10.1002/etep.2053 - ,
Wind resource assessment and economics of electric generation at four locations in Sinai Peninsula, Egypt ,J Clean Prod , Vol. 183 ,pp 1170-1183 , 2018, https://doi.org/https://doi.org/10.1016/j.jclepro.2018.02.182 - National Aeronautics and Space Administration, NASA, https://power.larc.nasa.gov/data-access-viewer/, Accessed: 21-Dec-2020
- ,
A Statistical Analysis of Wind Speed and Power Density Based on Weibull and Rayleigh Models of Jumla, Nepal ,Energy Power Eng , Vol. 08 (07),pp 271-282 , 2016, https://doi.org/https://doi.org/10.4236/epe.2016.87026 - Suntech 325 Watt, Mono half cell solar module, https://dzcn.nl/wp-content/uploads/2020/07/Datasheet-Suntech-325-WP-003.pdf, Accessed: 21-Dec-2020
- Windspot 7.8 Kw, https://en.wind-turbine-models.com/turbines/1372-windspot-7.8kw, Accessed: 21-Dec-2020
- , https://zhwywater.en.made-in-china.com/product/MjQmlBOzLHkw/China-Industrial-Reverse-Osmosis-System-RO-Plant.html, Accessed: 21-Dec-2020
- SMA-Sunny Boy 6000TL-US / 7000TL-US / 8000TL-US / 9000TL-US / 10000TL-US / 11000TL-US, https://www.suncolombia.com/pdf/70.sma-us-installation-manual-TL-US-12-models.pdf, Accessed: 21-Dec-2020
- Renewable Energy Electricity Cost, 2019, http://www.moee.gov.eg/english_new/EEHC_Rep/2018-2019en.pdf, Accessed: 21-Dec-2020