


The energy consumed by a building is over one-third of the final energy consumption [1]. Moreover, buildings are responsible for around 36% of CO2 emissions [2]. Utilizing renewable energy sources and improving energy efficiency for buildings are considered an attractive solution to reduce the impact of this problem. Jordan is a non-oil producing country with limited natural and mineral resources. The annual energy bill for the country exceeding 20% of its total GDP [3]. The demand for primary energy has tripled in the last 15 years [4]. The increase in electricity demand in Jordan is estimated to be around 7.4% [5]. Table 1 shows the electrical energy distribution in Jordan [6]. It is clear from the data listed in Table 1 that the electricity consumption for the household sector approaches almost half of the total electricity consumption in 2016. Hence, it is anticipated that improving energy efficiency for buildings leads to great economic, social, and environmental benefits. Due to the poor design of typical Jordan buildings, it is anticipated that retrofitting programs lead to cost-effective large energy savings [7].
Electrical energy distribution 2016 [6]
Sector |
House hold |
Industrial |
Commercial |
Water pumping |
Street lighting |
|---|---|---|---|---|---|
Electrical energy consumption [%] |
43% |
25% |
15% |
15% |
2% |
Due to awareness of the exhaustion of fossil energy reserves and their harmful effect on the environment, enhancing energy efficiency through building envelope has been targeted by many investigators [8]. The objective of these studies was to minimize energy consumption and reducing harmful emissions. The building orientations, glazing, changing the room set point, replacement of lamp into LED, and upgrading HVAC, a system-operating schedule, thermal insulation, and resident behavior have a significant impact on the energy saving of the buildings [9]. Roof ventilation significantly reduces the cooling load demand in the Mediterranean region especially for south-facing roof [10]. Caputo et al. investigated two retrofit scenarios for the historical well-protected building located in a peripheral context of Milan, Italy. The simulations showed a negligible difference between the two alternatives in terms of heating and cooling load [11].
Building window design and wall insulation are considered major parameters affecting heat transfer through the building envelope. A study conducted under hot climate concluded that between 20% and 55% of energy saving can be realized with thermal insulation and proper glazing type [12]. Among several insulation materials found in Mediterranean construction, polyurethane outperforms mineral wool, and polystyrene [12]. Although both external and internal thermal insulations have significantly reduced the total energy requirements in buildings, external insulation outperforms the internal insulation configuration by 8% [13]. On the other hand, internal insulation requires approximately 50% less investment cost than external insulation. Windows shading in buildings can cause substantial thermal heat gain or loss. Double glazing with gap shading equipment increased the overall energy performance [14]. An internal shading system, properly built, could be as successful as an external one [15].
Heat gain or losses through building roofs are substantial. It was found that a green roof (consists of clay and grass) outperforms regular roofs in terms of thermal performance [16]. For different locations in Turkey, the optimum roof insulation thickness ranges between 3.8 and 7.39 cm [17]. It is worth mentioning that excess insulation thickness reduces the effectiveness of passive cooling strategies [18]. In this case, energy savings up to 58% are achieved with a payback period of 3.11 years. It was reported that the integration of buildings has an advantage of 23% of primary energy reduction for on-site energy management as compared with the present situation [19]. Meulen presented a comparison between costs and benefits of green roof types, both on a building- and city scale [20].
Extensive research is found in the literature that investigated several techniques for improving energy building performance. However, few studies have linked the energy performance requirements and the cost [21]. The high initial investment cost of energy retrofit programs should be justified by higher cost savings in energy consumption. A new methodology focusing on minimizing costs during a building's lifecycle while maximizing energy saving should be developed. Ihm and Krarti evaluated the optimal and cost-effective energy efficiency design and operation options for office buildings in Tunisia [22]. Their results indicated that the cost-effective measures are: utilizing daylighting controls, energy efficient lighting fixtures, and low-E double glazing, and roof insulation. The reduction of annual energy can reach up to 50% for those measures. The optimal cost point is achieved by introducing an artificial light control system only to the base reference building. Serra and Filho demonstrate the potential of Building Information Modeling to optimize the execution of reference instructions [23]. The new method showed an approximately 85% reduction in classification time.
Several creative techniques and innovative building envelope materials have recently been developed to minimize the consumption of energy. A Phase Change Material (PCM) may be added to building components that use their thermal energy storage properties to minimize heating, cooling, and overall energy usage, including exterior walls, roof, ground floor, internal walls, and interior floor [24]. During the energy storage process, the temperature of PCMs remains almost constant, making them ideal for energy storage and recovery applications [25]. Thermal energy is retained by PCMs as latent heat that is greater than sensible heat per unit mass. It was reported careful installation of PCM, the percentage potential for energy saving per cubic meter of phase change materials ranges from 1.9 percent/m3 to 18.8 percent/m3 [24].
The relation between energy performance requirements and economic targets is still not fully addressed [22]. Conducting a set of parametric analysis using single energy-efficient measures, cannot choose the most cost-effective building design features that lead to the best level of energy efficiency. The new trend should concentrate on the development of new methodologies that encourage cost minimization during the lifecycle of a building while optimizing environmental benefits. These methodologies serve to illustrate that cost savings can be greater than high initial investments by reducing building energy consumption. There are several studies in the field of cost and cost-effectiveness of retrofitting, but few studies have concentrated on cost-optimal retrofitting of reference buildings [26]. The Leutgob et al. [27] study concluded that the characteristics of the reference building and environmental conditions were found to be the main key factors affecting the outcomes of "cost-optimal" studies. Kurnitski et al. [28] performed a cost-optimal analysis for a reference detached home, apartment, and office building in the cold climate zone (Estonia). They found that, depending on the type of building and the energy sources used, energy efficiency can be increased by 20% - 40%. A cost-optimal analysis was proposed by Becchio et al. for the Italian reference office building [29]. The optimum cost point is reached by introducing only the base reference building with an artificial light control system.
The objective of this paper is to introduce a methodology for finding the optimal energy performance packages at the lowest cost for single-family house located in three cities in Jordan. The impact of several conservation energy measures on the total energy consumption of the reference residential building is evaluated. The costs of the different energy packages were estimated.
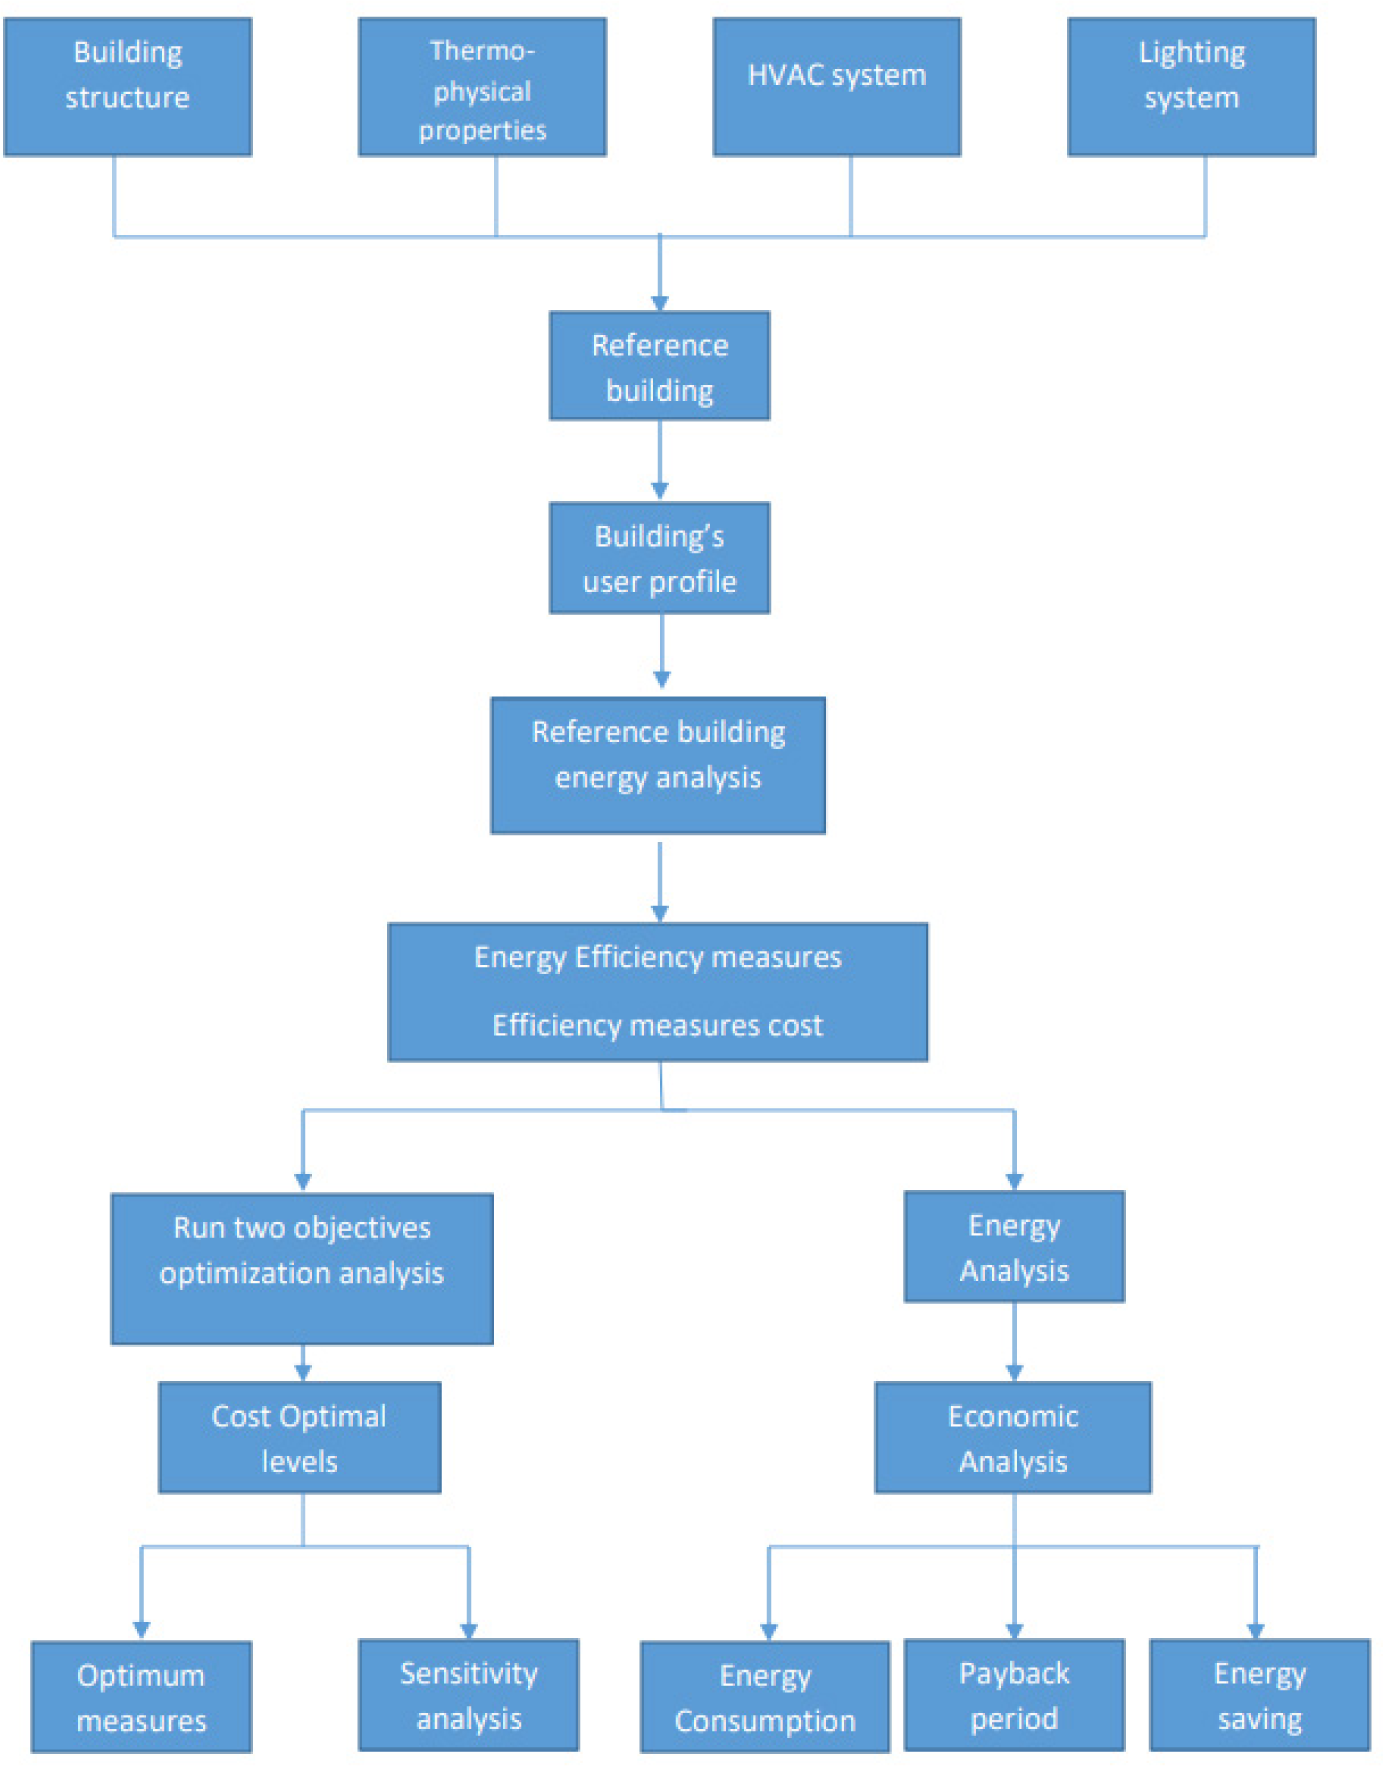
In the present study, the sequential search optimization technique along the path to zero net energy is used to identify cost-optimal efficiency packages. The main steps used for this research study are:
Step 1: Determine base case reference building that represents national building stock;
Step 2: Determine the building structure, thermos-physical properties, the HVAC system, and lighting system, and etc.;
Step 3: Determine user profile for the reference building;
Step 3: Calculate energy consumption of reference building and energy analyses;
Step 4: Identify energy efficiency measures and packages;
Step 5: Execute energy analyses for each retrofit measure;
Step 6: Determine the amount of energy saving;
Step 7: Calculate costs of energy efficiency packages considering a certain calculation period, run sensitivity analysis;
Step 8: Determine minimum-cost building designs at different target energy-savings levels;
Step 9: Connect minimal cost points for various levels of energy savings.
Dynamic simulation software DesignBuilder (DB) which is based on EnergyPlus (EP) simulation engine is used to evaluate energy conservation measures. DesignBuilder allows more flexibility in geometry input and has extensive material libraries and load profiles. DB generates a virtual environment where HVAC and lighting systems of the building are evaluated in order to determine the feasibility of various energy conservation measures (ECMs) without compromising thermal comfort.
A building energy optimization software (Beopt) is used to find the optimal building designs along the path to zero net energy (ZNE) at the minimum life cost. Beopt utilizes the sequential search optimization technique to automate the process of identifying optimal building designs along the path to ZNE. The optimal path is defined as the lower bound of results from all possible building designs (i.e., connecting minimal cost points for various levels of energy savings). BEopt finds optimal and near-optimal designs along the path based on discrete building options reflecting realistic construction options. To complete the optimization process, various combinations of the available options must be simulated. A various combination is simulated to account for the interaction among different options. First, determine all categories used in the analysis. Second, searching for the most cost-effective options along the path. Then, the most cost-effective option is selected as an optimal point on the path.
Methodology flow chart for determining cost-optimal efficiency packages
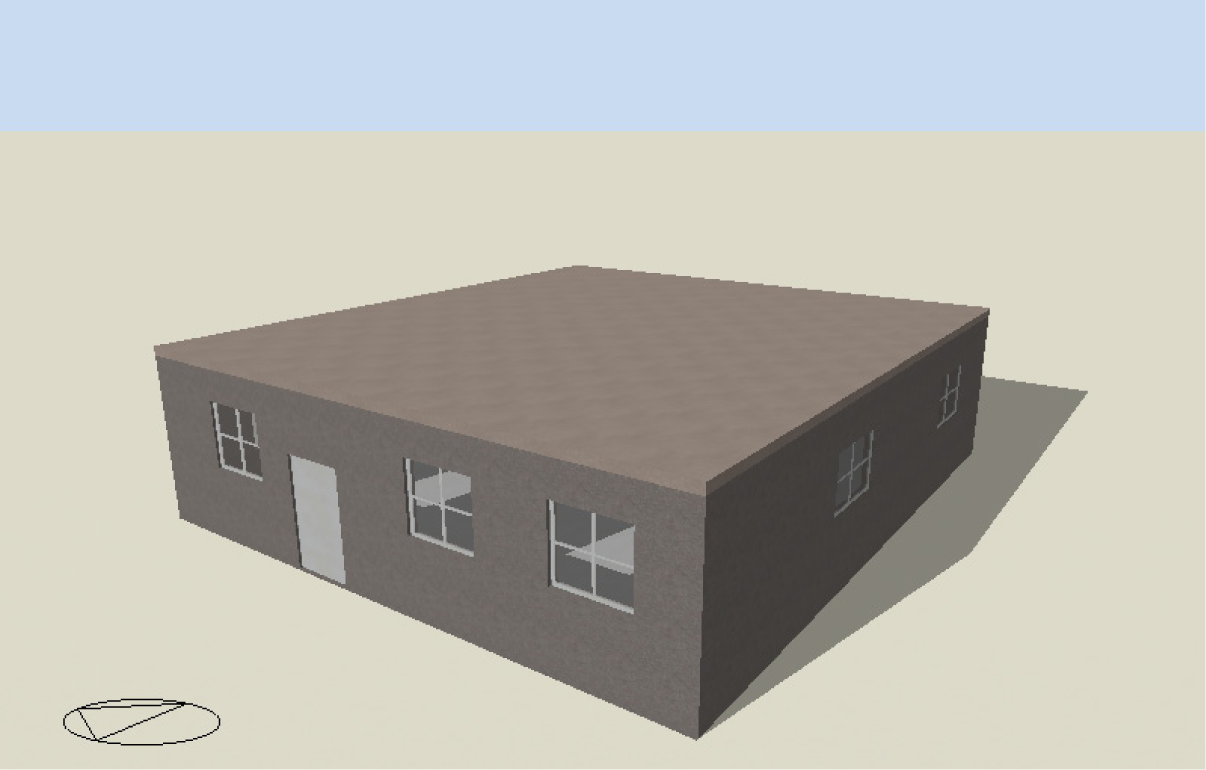
A typical single-family detached building is used for the application of the cost optimality calculation method with national factors of Jordan. Figure 2 shows the 3D rendered model for the reference building model. Table 1 summarizes the reference building specifications and characteristics, and typical load scheduling. The reference building consists of one story. The floor area is about 144 m2 and the ceiling height is 2.75 m. The floor plan has been divided into several rooms that have different schedules and requirements. These rooms are occupied throughout the whole year, bedrooms during the night while the living room and the kitchen during the day. The heating thermostat setting is adjusted at 21 #x00B0;C during winter and 24 °C during the summer. All window frames are sliding aluminum, with one layer of glazing 6 mm each. The windows area constitutes 30% of the total wall area. For the cooling season, the house is served with a split unit type, on the other hand, an electric heater is being used for the heating season. The roof is flat made of cast in situ reinforced concrete. The roof consists of four layers namely; concrete plaster 50 mm, reinforced concrete 100 mm, hollow concrete block 140 mm, and concrete plaster 25 mm. The wall consists of 150 mm hollow concrete blocks are surrounded by 25 mm cement plaster. The house has been divided into several thermal zones per room with a separate thermostat that controls the heating and cooling temperature in each zone. The activity factor has been set to 0.9 as a default value to account for various occupants within the building (men, women, and children).
3D model of the reference building in Jordan
Three cities located in Jordan have been considered in this study, namely; Irbid, Ma'An, and Aqaba. These cities representing three distinct climatic zones of Jordan. Jordan weather is generally classified as hot and dry summer and moderately cold winter. Irbid, Jordan (latitude 31.9° North, longitude 35.9° East) is located in the northern part of Jordan. Ma'An, Jordan (latitude 30.2°, longitude 35.8°), located in the southern part of Jordan, has the highest potential for solar power generation. Aqaba, Jordan (latitude 29.5°, longitude 35.01°), has the only port in Jordan. The climate condition in Aqaba can be described as hot-humid. Some data of the climatic conditions of three selected cities in Jordan are listed in Table 3.
To determine the cost-optimal energy performance, energy efficiency technologies available in Jordan market are considered. The considered ECMs include building envelop materials and thermal mass, glazing type and size, HVAC, natural ventilation and lighting system type, and associated control settings (See Table 4). The baseline building characteristics are represented in bold.
In this study, the life cycle cost LCC is chosen as the cost function in the optimization analysis, is given as [30]:
(1)
where, IC is the initial cost of the applied measures, EC is annual energy cost, USPW is the uniform series present worth value that depends on both the project lifetime (N) and the discount rate (rd), which will be given through the following relation:
(2)
The project lifetime (N) and the discount rate (rd) are assumed to be 30 years and 5% respectively [30]. The inflation rate was set equal to be 8.9%. The local current oil price is taken to be 2.67 $/gallon [6].
Number of floors |
1 |
Total floor area |
144 m2 |
Total wall area |
96.25 m2 |
Total windows area |
41.25 m2 |
Wall (U value) |
25 mm cement plaster |
150 mm hollow concrete block | |
25 mm cement plaster | |
(2.509) | |
Roof construction layers (U value) |
Concrete plaster 50 mm |
Reinforced concrete 100 mm | |
Hollow concrete block 140 mm | |
Concrete plaster 25 mm | |
(2.36) | |
Glazing (U value) |
Single clear |
6 mm (5.778) | |
Glazing specification |
Total solar transmission (SHGC) |
0.819 | |
Direct solar transmission 0.775 | |
Light transmission 0.881 | |
WWR |
30% |
Infiltration |
1 ACH |
Heating set point |
21 °C |
Cooling set point |
24 °C |
COP for cooling |
2 |
COP for heating |
1 |
Lighting density |
5 W/m2 |
Number of occupants |
5 |
Appliances |
Bedroom 10 W/m2 (15:00-18:00) |
Kitchen 30 W/m2 (10:00-15:00) | |
Heating system |
Bedroom (14:00-22:00) |
Living room (10:00-15:00) | |
Master bedroom (20:00-24:00) | |
Reception (19:00-21:00) | |
Cooling System |
Living room (13:00-22:00) |
Master bedroom (20:00-24:00) | |
Reception (19:00-21:00) |
Summary of average monthly climatic conditions for the selected cities in Jordan
City |
Climate data |
Month |
|||||||||||
|---|---|---|---|---|---|---|---|---|---|---|---|---|---|
Jan |
Feb |
Mar |
Apr |
May |
Jun |
Jul |
Aug |
Sep |
Oct |
Nov |
Dec | ||
Aqaba |
Avg. outside dry-bulb temperature [°C] |
14 |
16 |
19.3 |
23.9 |
28 |
31 |
32.3 |
32.2 |
30 |
26.3 |
21 |
16 |
Avg. wind speed m/s |
2.4 |
2.8 |
3.9 |
4.2 |
4.4 |
4.6 |
4.3 |
5.1 |
5.2 |
4.2 |
3.2 |
2.6 | |
Avg. direct normal solar [Wh/mm2] |
165 |
152 |
223 |
213 |
236 |
281 |
274 |
259 |
213 |
202 |
171 |
167 | |
Avg. diffuse horizontal solar [Wh/mm2] |
34 |
42 |
45 |
59 |
68 |
46 |
53 |
50 |
49 |
43 |
33 |
29 | |
Maan |
Avg. outside dry-bulb temperature [°C] |
7.5 |
9 |
12.2 |
17 |
21 |
24 |
25.6 |
25.7 |
23.9 |
19.5 |
13.6 |
9 |
Avg. wind speed [m/s] |
2.9 |
3.6 |
3.8 |
3.4 |
3.1 |
2.8 |
2.8 |
2.3 |
1.9 |
1.9 |
1.8 |
2.2 | |
Avg. direct normal solar [Wh/mm2] |
172 |
163 |
235 |
234 |
269 |
295 |
287 |
260 |
226 |
218 |
177 |
170 | |
Avg. diffuse horizontal solar [Wh/mm2] |
31 |
38 |
44 |
51 |
57 |
44 |
51 |
51 |
45 |
37 |
31 |
28 | |
Irbid |
Avg. outside dry-bulb temperature [°C] |
9 |
10 |
13 |
16 |
21 |
23 |
25 |
25 |
23 |
20 |
14 |
10 |
Avg. wind speed [m/s] |
2.3 |
2.5 |
2.4 |
2.7 |
2.9 |
3.2 |
3.6 |
3.4 |
2.5 |
1.6 |
1.7 |
2 | |
Avg. direct normal solar [Wh/mm2] |
127 |
113 |
156 |
170 |
237 |
272 |
276 |
245 |
207 |
186 |
153 |
110 | |
Avg. diffuse horizontal solar [Wh/mm2] |
34 |
42 |
58 |
66 |
65 |
50 |
55 |
56 |
50 |
43 |
33 |
35 | |
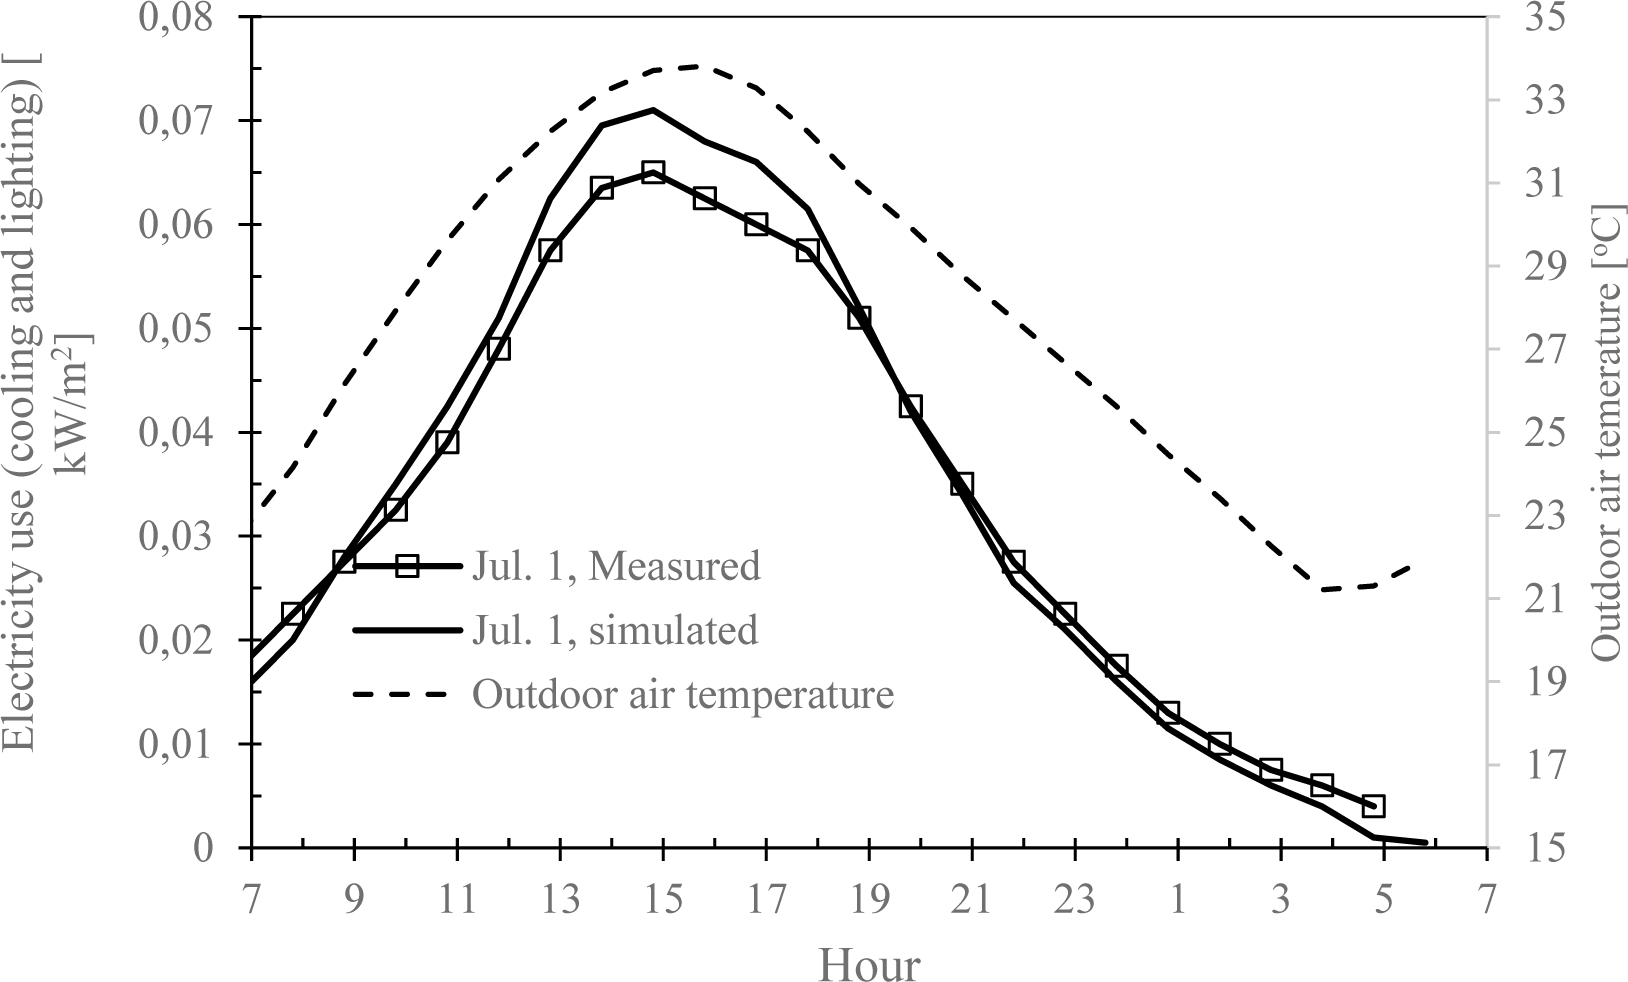
Validation of building energy simulation programs is very a complex process. In practice, it is not possible to perform a complete validation of building energy simulation programs due to a large number of interlinked factors and a large number of applications and combinations. Empirical whole model validation is a highly demanding task, requires expertise in experimental design and modelling. Therefore, the empirical validation technique applied at the level of few processes is considered in this study. The occupant's behavior is highly complicated and cannot be accurately included in models, therefore, this parameter is not included in the idealized validation. To simplify the validation process, a controlled single-detached room equipped with measuring sensors is used. The test cell located in Irbid is equipped with one 1.5 ton split unit. The physical characteristic of the test cell is similar to the reference building. Cooling and lighting schedules are given and then the test cell is run for two consecutive days in summer to collect hourly data.
Various options related to the energy conservation measures and their related cost [22], [30], [34]
Energy efficiency measures (EEM) |
Options |
Cost |
|---|---|---|
Orientation |
North |
0 for all options |
East |
||
South |
||
West |
||
Window to wall ratio (WWR) |
30% |
0 for all options |
10% |
||
20% |
||
40% |
||
Roof insulation |
None |
|
2 cm polystyrene layer |
5.8 $/m2 | |
4 cm polystyrene layer |
10.7 $/m2 | |
6 cm polystyrene layer |
16 $/m2 | |
Glazing |
Single clear metal |
50 $/m2 |
Double clear metal air |
90 $/m2 | |
Low E double metal air |
102 $/m2 | |
Triple metal clear air |
130 $/m2 | |
Overhangs |
None |
|
0.5 m |
18 $/m2 | |
1 m |
18 $/m2 | |
1.5 m |
18 $/m2 | |
2 m |
18 $/m2 | |
Wall insulation |
None |
|
2 cm Polystyrene |
5.14 $/m2 | |
4 cm Polystyrene |
8.56 $/m2 | |
6 cm Polystyrene |
11.5 $/m2 | |
Split air conditioning unit |
2 COP |
129 $/kW |
2.5 COP |
171 $/kW | |
2.8 COP |
217 $/kW | |
3.5 COP |
343 $/kW | |
Lighting |
5 W/m2 |
|
30% reduction |
1.8 $/m2 | |
50% reduction |
2.35 $/m2 | |
70% reduction |
4 $/m2 |
Results presented in Figure 3 show that the dynamic response of the test cell is well represented by the building energy simulation model.
Comparison between measurements and predictions for a single day, Irbid
The impact of five ECMs on the energy consumption for one-story family has have been investigated. Table 5 lists the end-use energy distribution for the one-story family house in three different locations in Jordan. Results listed in Table 5 show that the cooling load constitutes 12% and 74.5% of the total energy consumption in Irbid and Aqaba respectively. The heating load for Irbid is 39.5%, while for Aqaba (hot environment) is 1%.
Energy end-use distribution for base model for a one-story building
Ma'an |
Irbid |
Aqaba |
||||
|---|---|---|---|---|---|---|
Consumption [kWh] |
End-use % |
Consumption [kWh] |
End-use [%] |
Consumption [kWh] |
End-use [%] | |
Lighting |
1371 |
19.7 |
1371 |
20.0 |
1371 |
10.2 |
System miscellaneous |
1951 |
28.1 |
1951 |
28.4 |
1951 |
14.5 |
Heating |
945 |
13.6 |
2711 |
39.5 |
104 |
0.8 |
Cooling |
2686 |
38.6 |
827 |
12.1 |
10000 |
74.5 |
Total energy consumption [kWh] |
6953 |
100.0 |
6860 |
100.0 |
13426 |
100.0 |
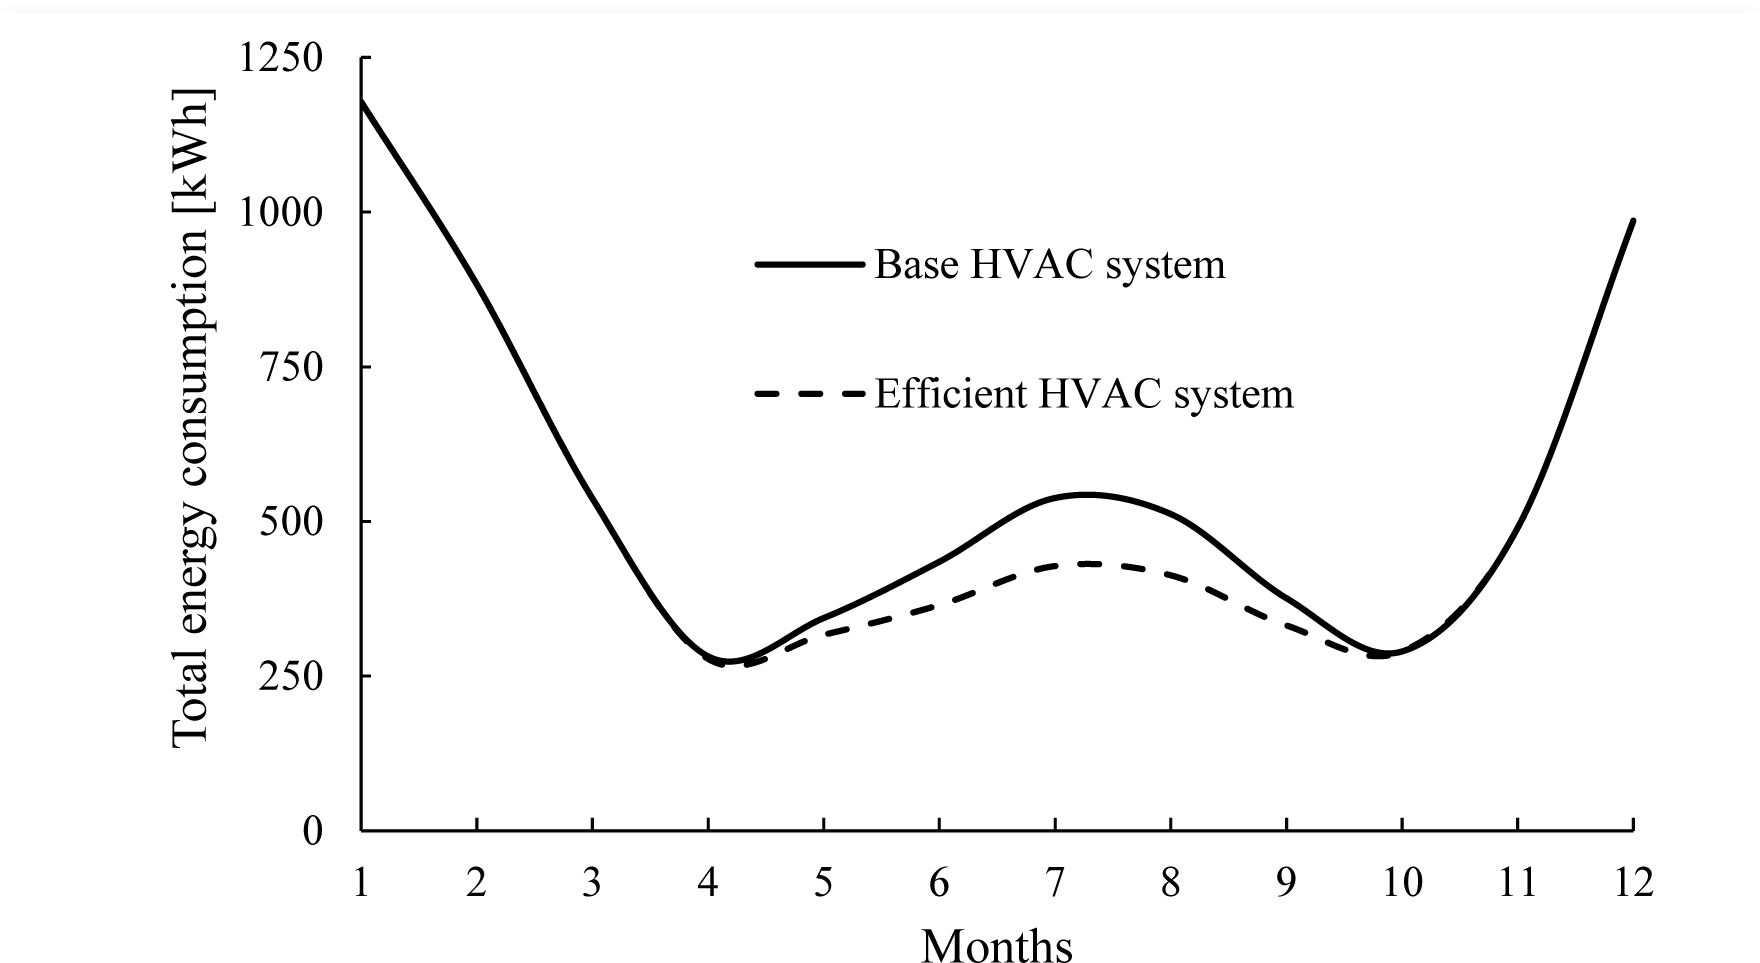
The simulation results shown in Figure 4 predicts that the total energy savings of 5% can be achieved when increasing the COP of the cooling system from 2 to 3.5.
Energy consumption profile for various HVAC systems, Irbid
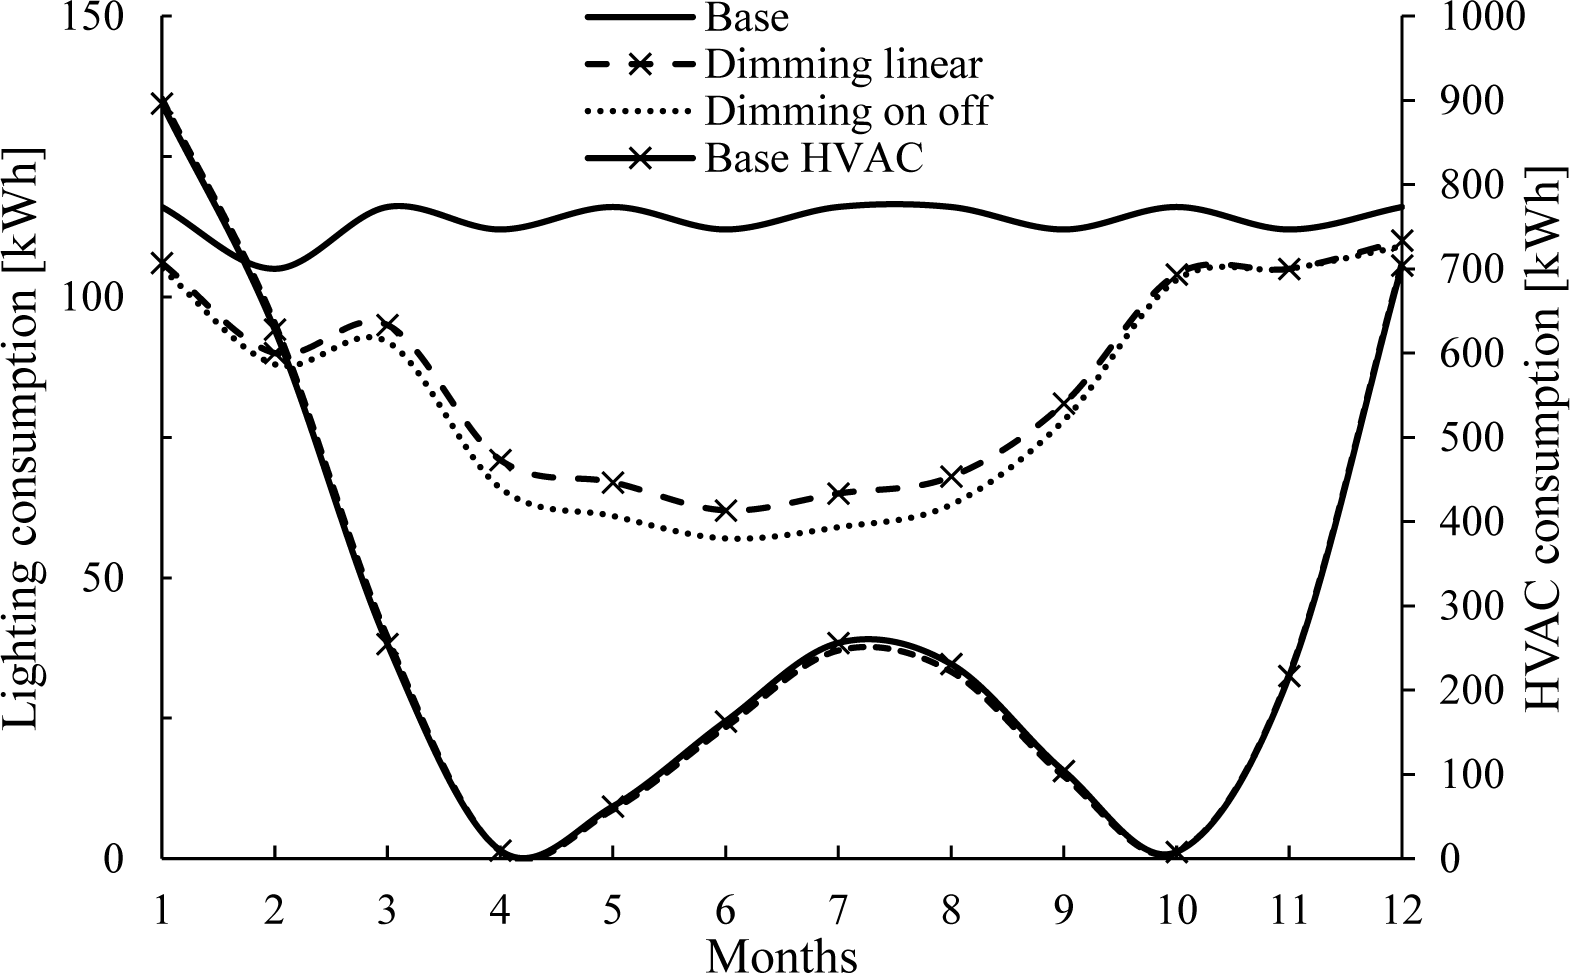
The results listed in Table 5 demonstrate that the lighting system load ranges between 10% and 20% for the three regions studied. Lighting energy consumption profiles for three daylight control strategies are shown in Figure 5. Simulation results predict that (25-28)% of lighting energy savings can be achieved when using (linear – ON/OFF) dimming control. As mentioned previously, utilizing light control further decreases the cooling load. Results presented in Figure 5 show that an additional 0.25% of HVAC energy savings can be achieved when utilizing the daylight control strategy. It is worth mentioning that, utilizing light control leads to 4.3% saving in cooling load and a 1% increase in heat load.
Lighting energy consumption profiles for various lighting control, Irbid
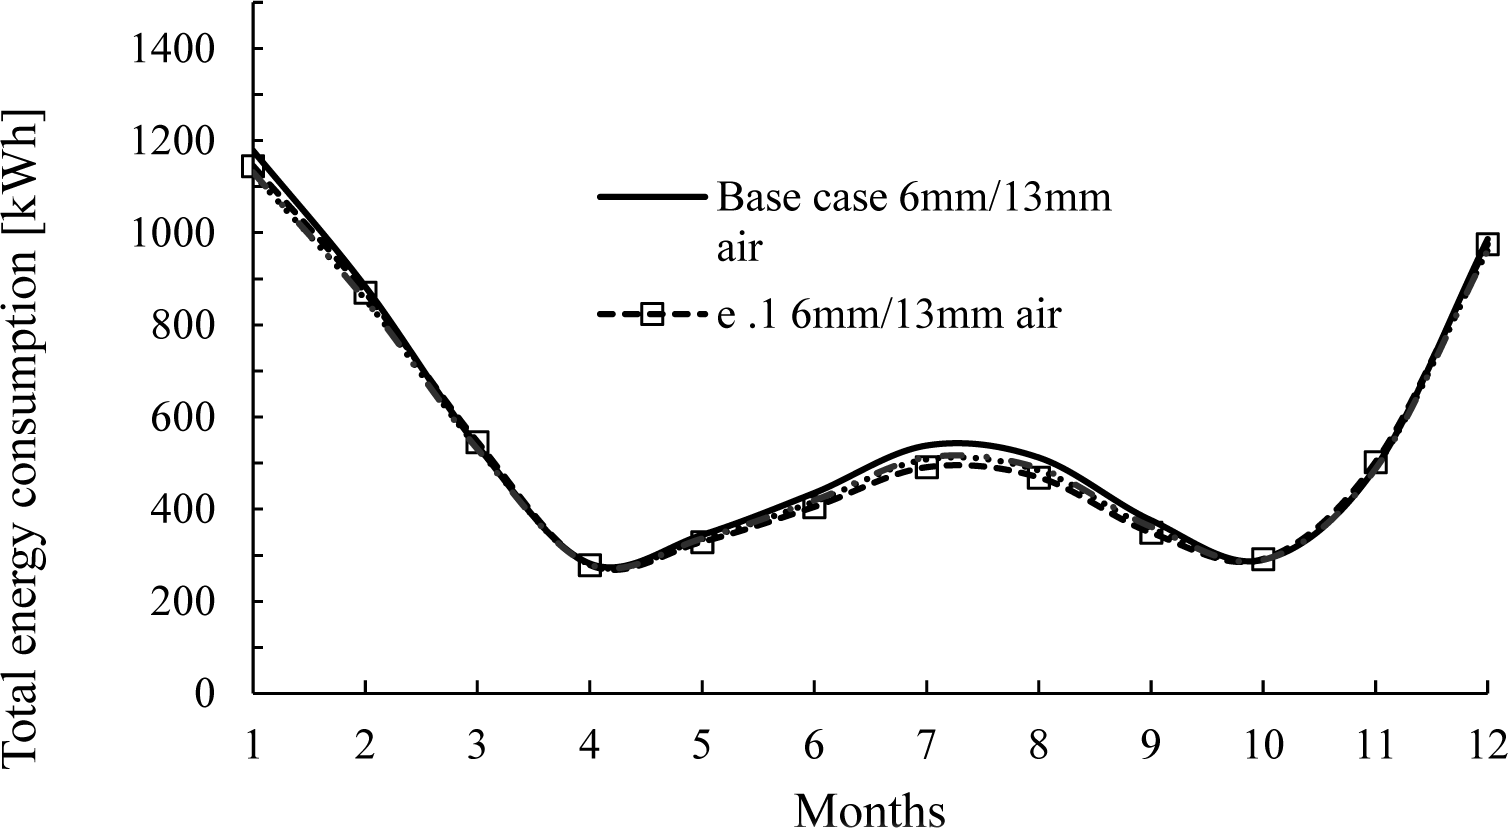
Simulation results presented in Figure 6 show that up to 2.9% of total energy consumption can be saved by utilizing glazing with the lowest emissivity value.
Energy consumption profile for various glazing types, Irbid
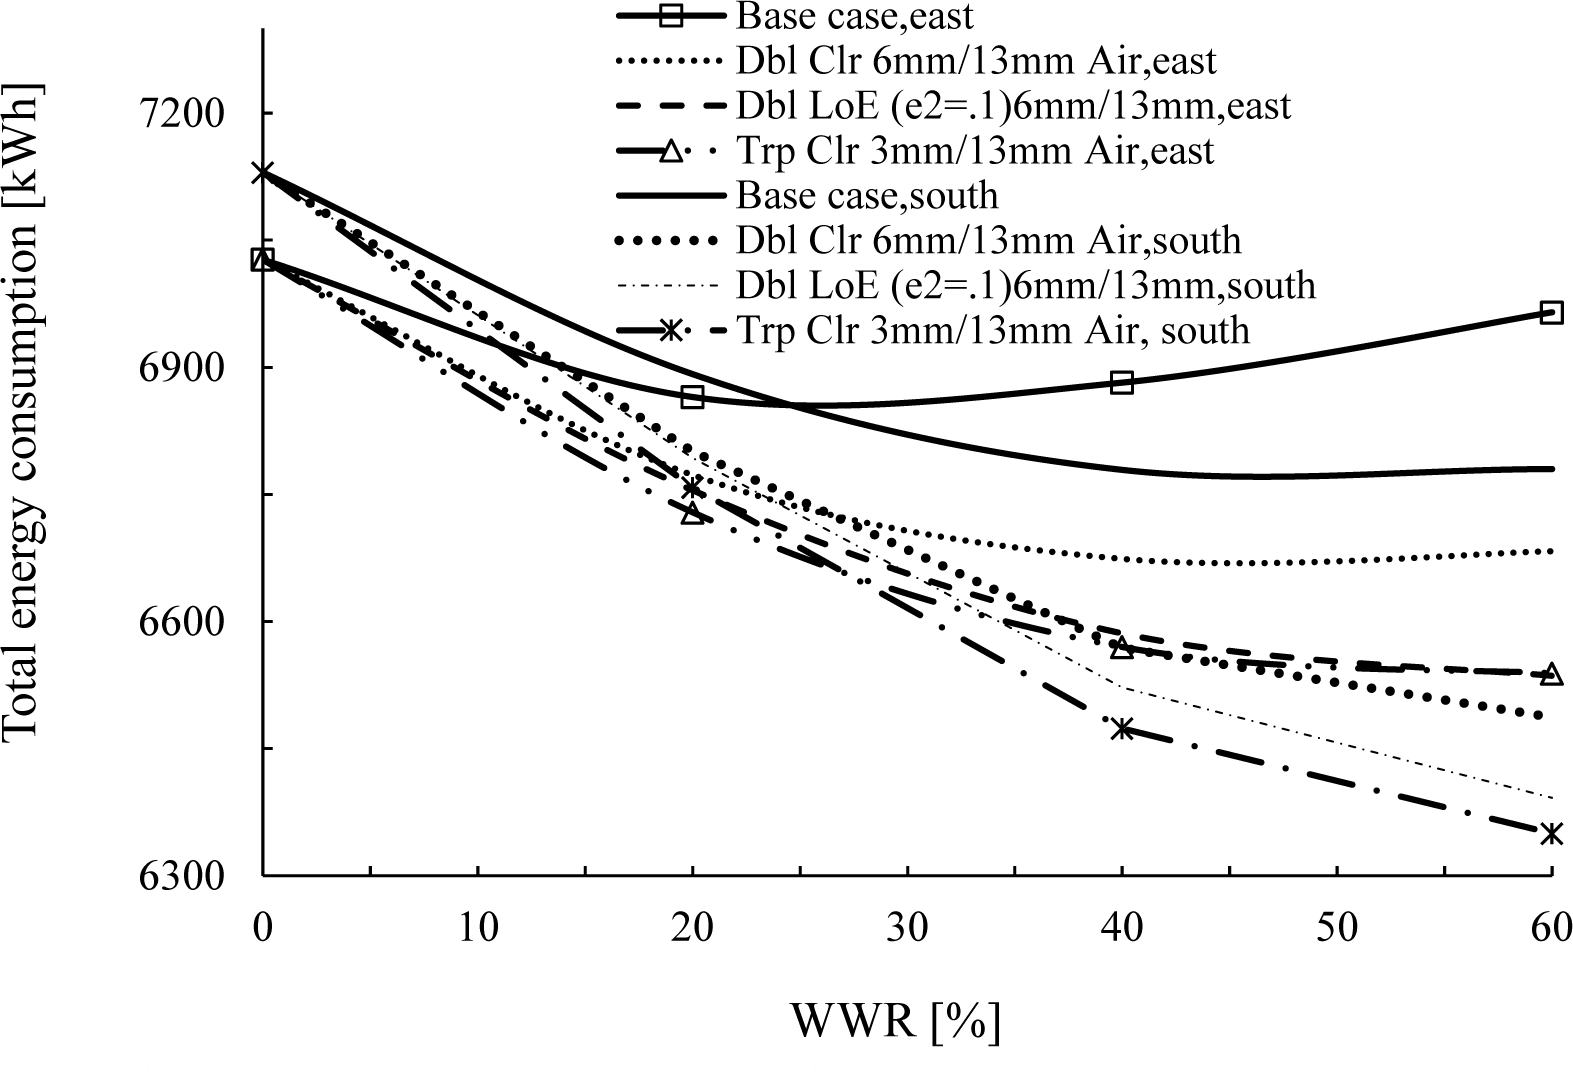
The effect of window to wall ratio (WWR), glazing types, and orientation on the total energy consumption is illustrated in Figure 7. Simulation results predict that the total energy consumptions decrease with a larger window area. This can be explained as follow; during winter time, larger window area allows solar gain which reduces the heating load. On the other hand, a larger window area increases cooling load requirements due to excess solar gain. Simulations predict that the positive effect in winter is larger than the negative effect in summer. For all glazing types and WWR, house oriented to the south has lower energy consumption compared to those oriented to the east. Utilizing triple clear windows outperform a double low emissivity window for a traditional house. Opposite behavior was observed for two stories villa.
Energy consumption for various glazing area and glazing types, Irbid
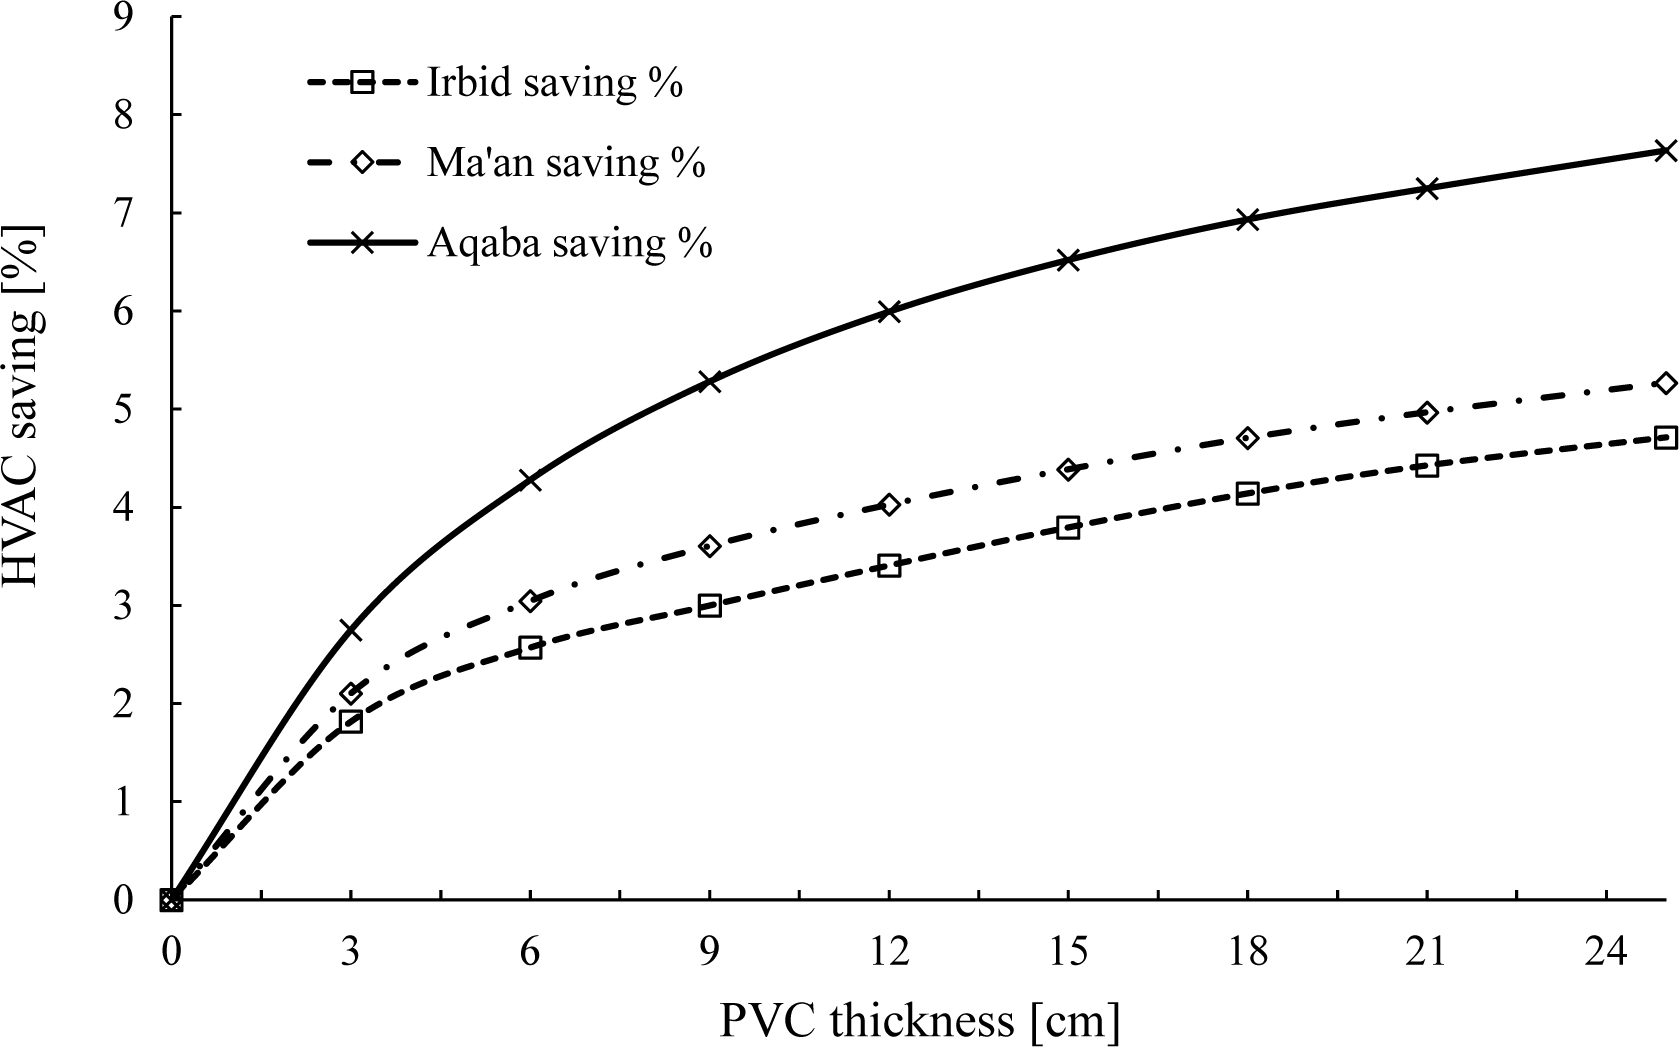
The space heating and cooling load of buildings are the largest contributors to the total energy consumption. It can reach up to 70 % of the total building energy requirements [35]. Wall insulations have a significant effect on the amount of energy consumed by buildings. It has a direct effect on HVAC energy requirements. The thickness of thermal insulation is a curial factor and should be carefully investigated. Simulations are carried out to investigate the effect of the thickness of PVC material on the heating and cooling load. It should be stressed that the thermos-economic optimization of insulation thickness on walls of buildings should be further investigated in order to select the best scenario. Figure 8 illustrates the impact of the PVC insulation thickness on HVAC load for various selected locations in Jordan. These locations are Irbid, Ma'an, and Aqaba. The highest energy saving is achieved for Aqaba due to the highest HVAC load in this region. Larger wall thickness leads to higher savings.
HVAC saving from wall insulation for various locations
Solar radiation admitted into the occupied spaces through transparent parts of the building, have a significant impact on the visual and thermal comfort. Solar gain has a negative impact in the summer and positive impact in winter.
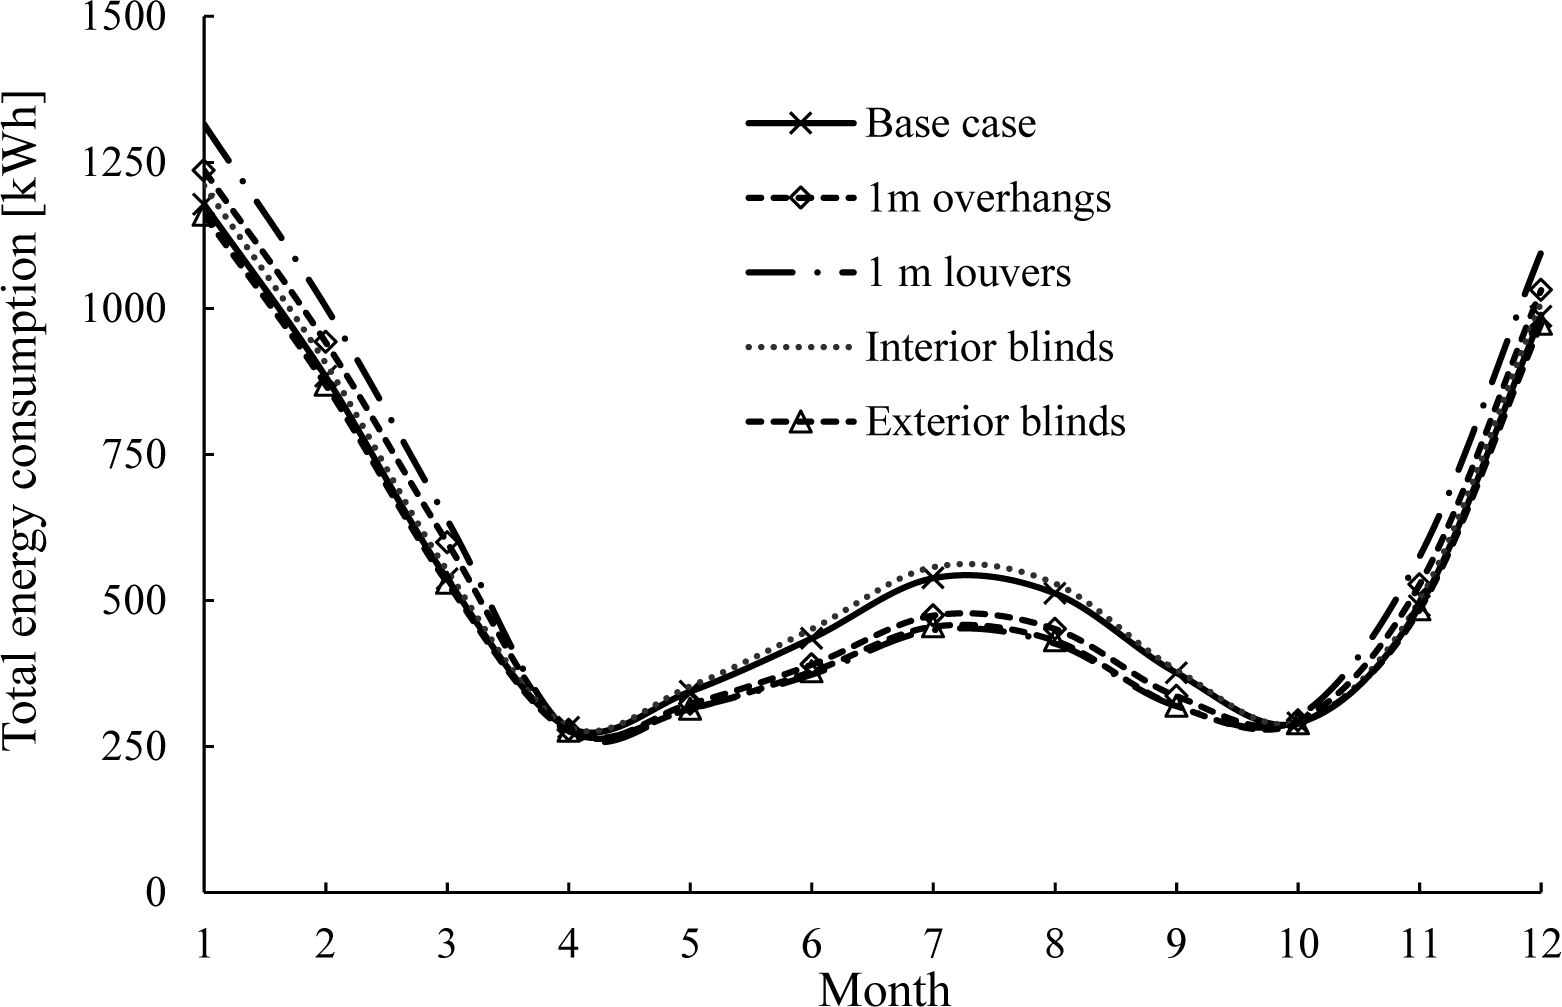
Three types of shadings will be used in the analysis:
Blinds;
Overhangs with 1 m projection;
Louvers with 1 m projection.
The following simulation results describe the impact of window shading on the cooling load in summer. As shown in Figure 9, the highest saving could be achieved when using the exterior blinds. On the other hand, louver has a negative impact on total energy consumption.
Total energy consumption using various shading techniques
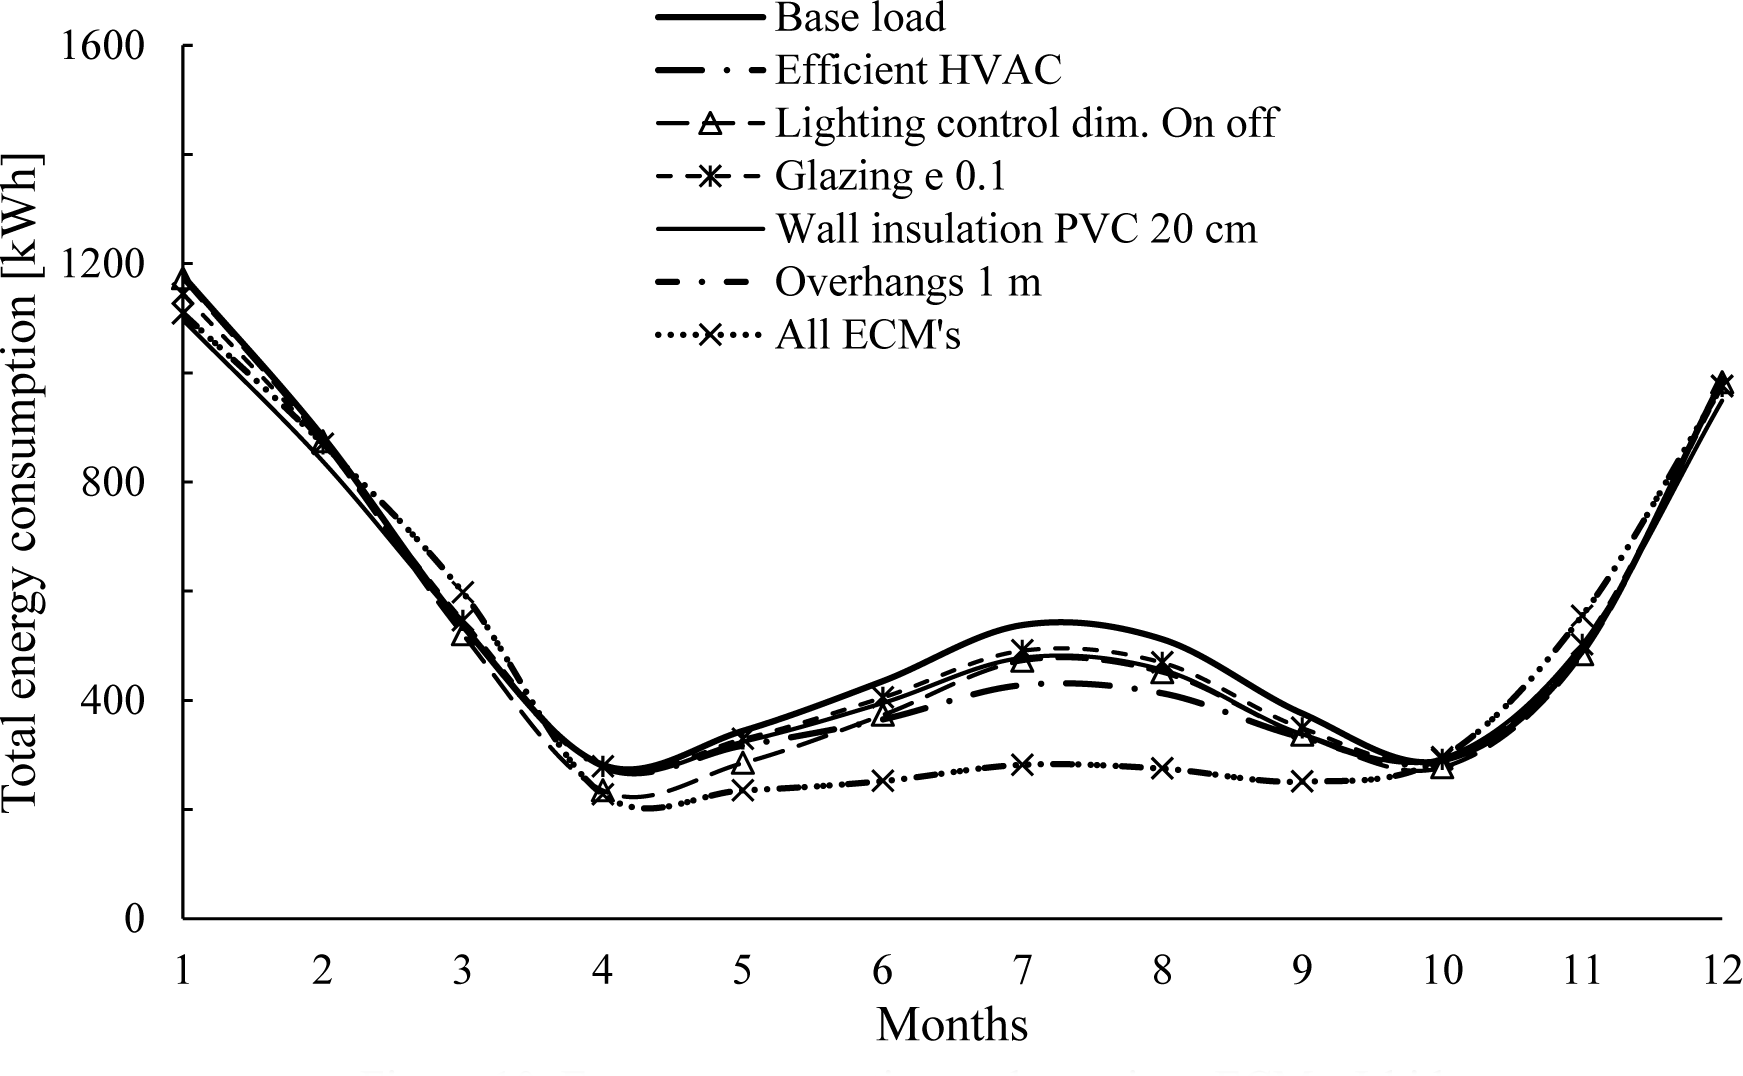
The total energy consumption profile for various energy conservation measures is shown in Figure 10. The simulation results show that an efficient HVAC system alone achieves 5% energy saving. Lighting control saves up to 5.6%. Low emissive glazing saves only 2.9% from the base load. When implementing all the ECMs, about 13.5% savings could be achieved. Glazing and shading have a negative effect in winter as there will be less solar gain and thus higher heating load. A summary of the impact of each measure on various energy-consuming systems is described in Table 6.
Summary of the annual energy consumption, Irbid
Case |
Cooling [kWh] |
Heating [kWh] |
Lighting [kWh] |
Total [kWh] |
Energy saving [%] |
|---|---|---|---|---|---|
Base |
827 |
2708 |
1371 |
6851 |
|
Eff. HVAC |
472 |
2708 |
1371 |
6497 |
5.2 |
Dimming linear |
795 |
2735 |
1029 |
6494 |
5.2 |
Dimming ON/OFF |
792 |
2737 |
992 |
6456 |
5.8 |
e.1 |
661 |
2677 |
1371 |
6645 |
3.0 |
e.2 |
721 |
2605 |
1371 |
6632 |
3.2 |
e.4 |
737 |
2601 |
1371 |
6644 |
3.0 |
Louver |
506 |
3276 |
1371 |
7088 |
-3.5 |
overhangs |
599 |
2977 |
1371 |
6884 |
-0.5 |
Exterior Blinds |
530 |
2645 |
1371 |
6497 |
5.2 |
Interior blinds |
810 |
2709 |
1371 |
6841 |
0.1 |
Energy consumption under various ECMs, Irbid
Simulation results presented in Table 7 show that level one and two of the retrofit program is highly cost-effective while, level 3 is the least cost-effective for building located in the northern part of Jordan. The cooling demand is relatively low in that region, hence, replace AC units with high COP unit, is not justified in that region.
Payback periods of individual measures, Irbid
Energy efficiency measures (EEM) |
Initial investment cost [$] |
Payback period [yrs] | ||
|---|---|---|---|---|
Cooling set point |
24 °C |
|||
Le |
Heating set point |
20 °C |
48 |
0 |
Infiltration |
0.21 ACH |
|||
Glazing |
Double, LOE |
|||
Le |
Shading |
Overhang 1.5 m |
1,207 |
3.6 |
Lighting |
60% reduction |
|||
Wall insulation |
40 mm polystyrene |
|||
Le |
Roof insulation |
60 mm polystyrene |
3,723 |
11 |
Heating COP |
0.9 |
|||
Cooling COP |
3.5 |
|||
In this section, the results of the sequential search technique were summarized. First, the optimal path between the life cycle cost and the energy savings associated with installing various design options is determined. The optimum energy efficiency measures for the selected climate zones are determined. Then, the annual energy saving and life cycle cost in each climate zone are determined. Figure 11 describes the cost-optimal energy performance design path for three locations across Jordan. From the results, it could be concluded that the life cycle cost and energy savings of the optimum design options varied based on the climate zone within Jordan. The cost-optimal curve for the Irbid climate condition is nearly flat. The flat curves mean that energy performance investments are just paid back by energy savings. The optimal point is not well defined. The reason can be explained due to the weather condition which is relatively moderately hot in summer and slightly cold in winter. On the other hand, the cost-optimal point for Aqaba is well identified. It can be concluded that, under a hot climate, large energy savings can be achieved at minimum cost.
The optimum energy efficiency measures for each climate zone in Jordan are provided in Table 8. Table 9 summarized the life cycle cost of the base and optimum cases. The annual energy saving is measured relative to the base case annual energy consumption. The results presented in Table 8 indicate that one-story buildings achieve optimal source energy savings and life cycle costs with slightly different energy efficiency measures (EEM sets). The cost-optimal result of all tested combinations for hot climate can be achieved by north orientation, single clear glazing with WWR =10%, Air conditioning COP=3.5, no insulation, no overhangs, and 70% reduction in light intensity. For the building under Irbid weather conditions, the cost-optimal design is achieved with south -orientation, single clear glazing with WWR =10%, air conditioning COP=2, no overhangs, and 70% reduction in light intensity. The optimal building energy costs in Aqaba, are higher than those in other sites due to higher cooling energy use. For Aqaba region, there is no need to invest in a high-efficiency boiler since it is rarely utilized. Moreover, the use of a marginally efficient boiler is only effective only for Irbid.
Summary of the optimal package for the three climate zones selected for Jordan
Measures |
Irbid |
Ma'an |
Aqaba |
|---|---|---|---|
Orientation |
South |
East |
North |
WWR |
10% |
10% |
10% |
Air conditioning (COP) |
2 COP |
2.8 COP |
3.5 COP |
Glazing |
Single clear |
Single clear |
Single clear |
Roof Insulation |
R-15 XPS |
None |
None |
Wall insulation |
R-5 XPS |
None |
None |
Overhangs |
None |
None |
None |
Lighting |
70% reduction |
70% reduction |
70% reduction |
Life cycle cost and annual energy saving for a traditional house
Location |
Base level |
Optimum measures | |||
|---|---|---|---|---|---|
Energy saving |
LCC [$] |
Energy saving |
LCC [$] |
LCC reduction [%] | |
Irbid |
0 |
12,726 |
30% |
11,199 |
12.0 |
Ma'an |
0 |
12,674 |
23% |
9,562 |
24.6 |
Aqaba |
0 |
22,576 |
39% |
14,786 |
34.5 |
The optimal building orientation is south for Irbid to help capture higher solar radiation levels to both reduce heating loads but especially to increase natural light and thus reduce lighting electricity energy use. On the other hand, the optimal building orientation is north for Aqaba to block the high level of solar radiation.
Figure 11 shows that the cost-optimal design can save up to 30% and 39% for Irbid and Aqaba building respectively. Moreover, the optimal design can reduce the life cycle costs from 12% to 34.5% for Irbid and Aqaba respectively. Moreover, the reduction in the life-cycle cost is higher in a hotter environment. The LCCs are largely due to the lower operating costs associated with the annual decrease in the consumption of electricity. For the lifespan of the building, the annual decrease in energy costs outweighs the rise in the cost of building construction to incorporate more productive features. The LCCs is lower than the baseline LCCs, all cities will achieve more than 35% of annual energy consumption savings.
Optimum path in various locations across Jordan
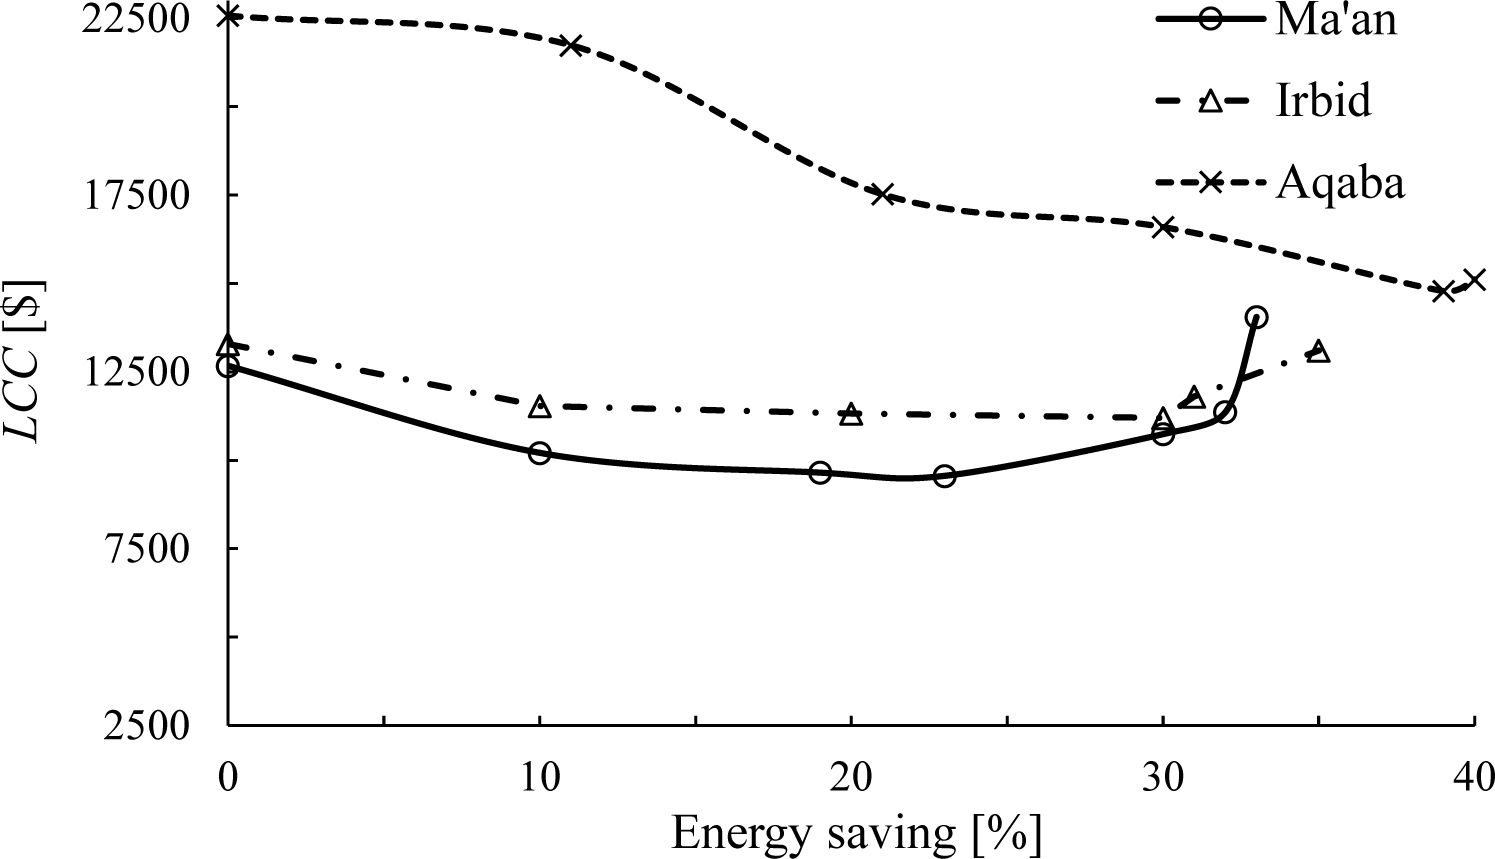
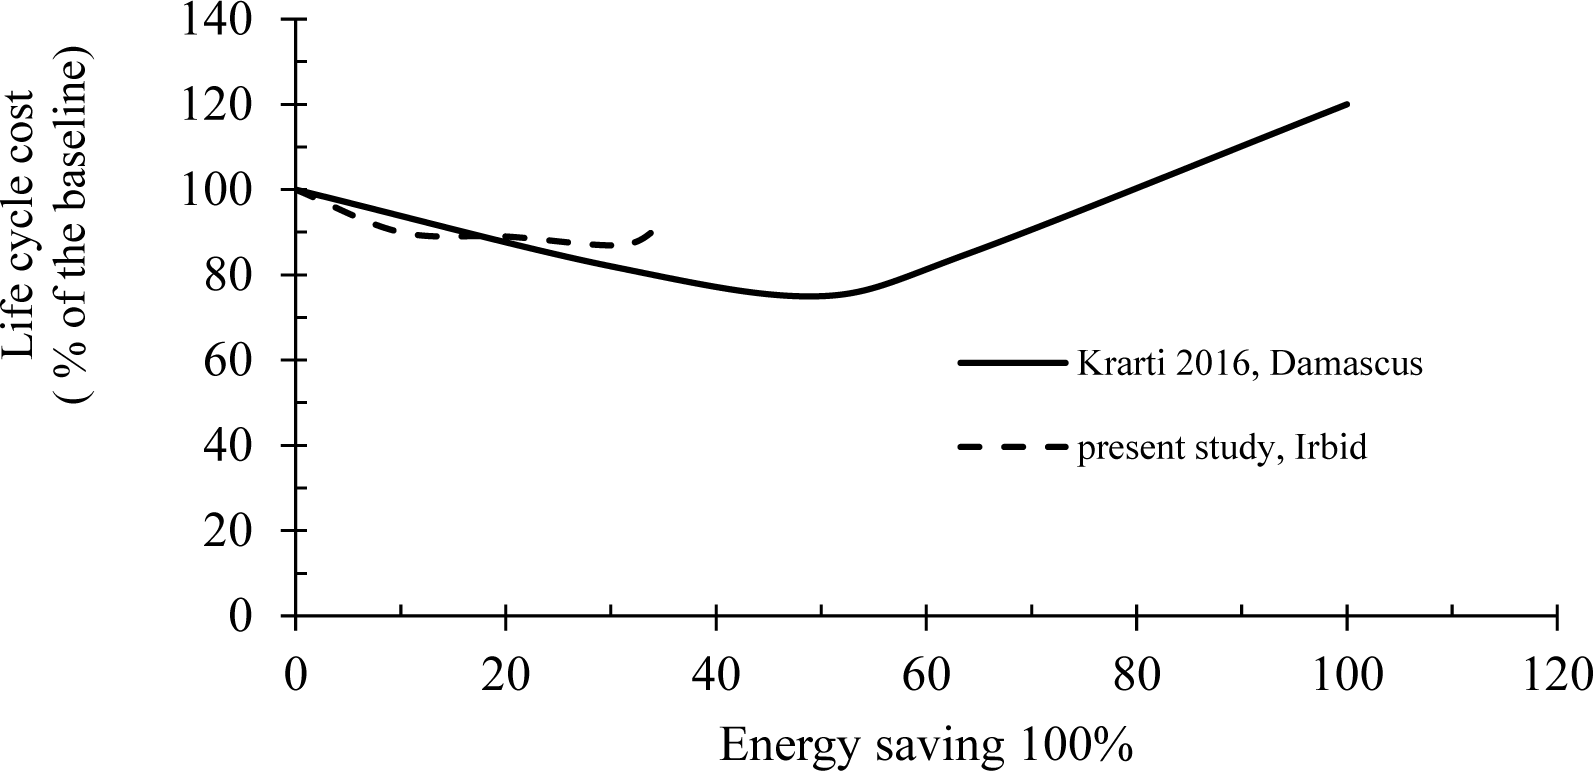
Figure 12 shows a comparison between the optimal path for Irbid obtained from the current study and the previously published work of Krarti and Ihm [30] for Damascus city. It is worth mentioning that Irbid and Damascus are neighboring cities about 200 km apart. They have almost identical weather profile. Inconsistency of financial values such as inflation rate, and interest rate, and calculation period are the main reasons for the small differences between the two studies.
Comparison between current study for LCC Irbid, and Damascus (at the neighboring city)
Sensitivity analysis measures the economic impact resulting from alternative values of uncertain variables that affect the economics. It shows just how sensitive the economic payoff to uncertain values of a critical input. Several parameters can alter the shape of the curve, among them geometrical building features, utilities rate, data on energy price, calculation period, discount rate, and costs. Therefore, a sensitivity analysis is performed to reduce variability within calculations. A sensitivity analysis was performed to determine the effect of the discount rates, lifetimes, energy cost, and the energy conservation measures cost to identify the most effective parameters and to validate the current methodology. The original optimization analysis is based on the discount rate 5%, and 30 years to represent the condition in Jordan.
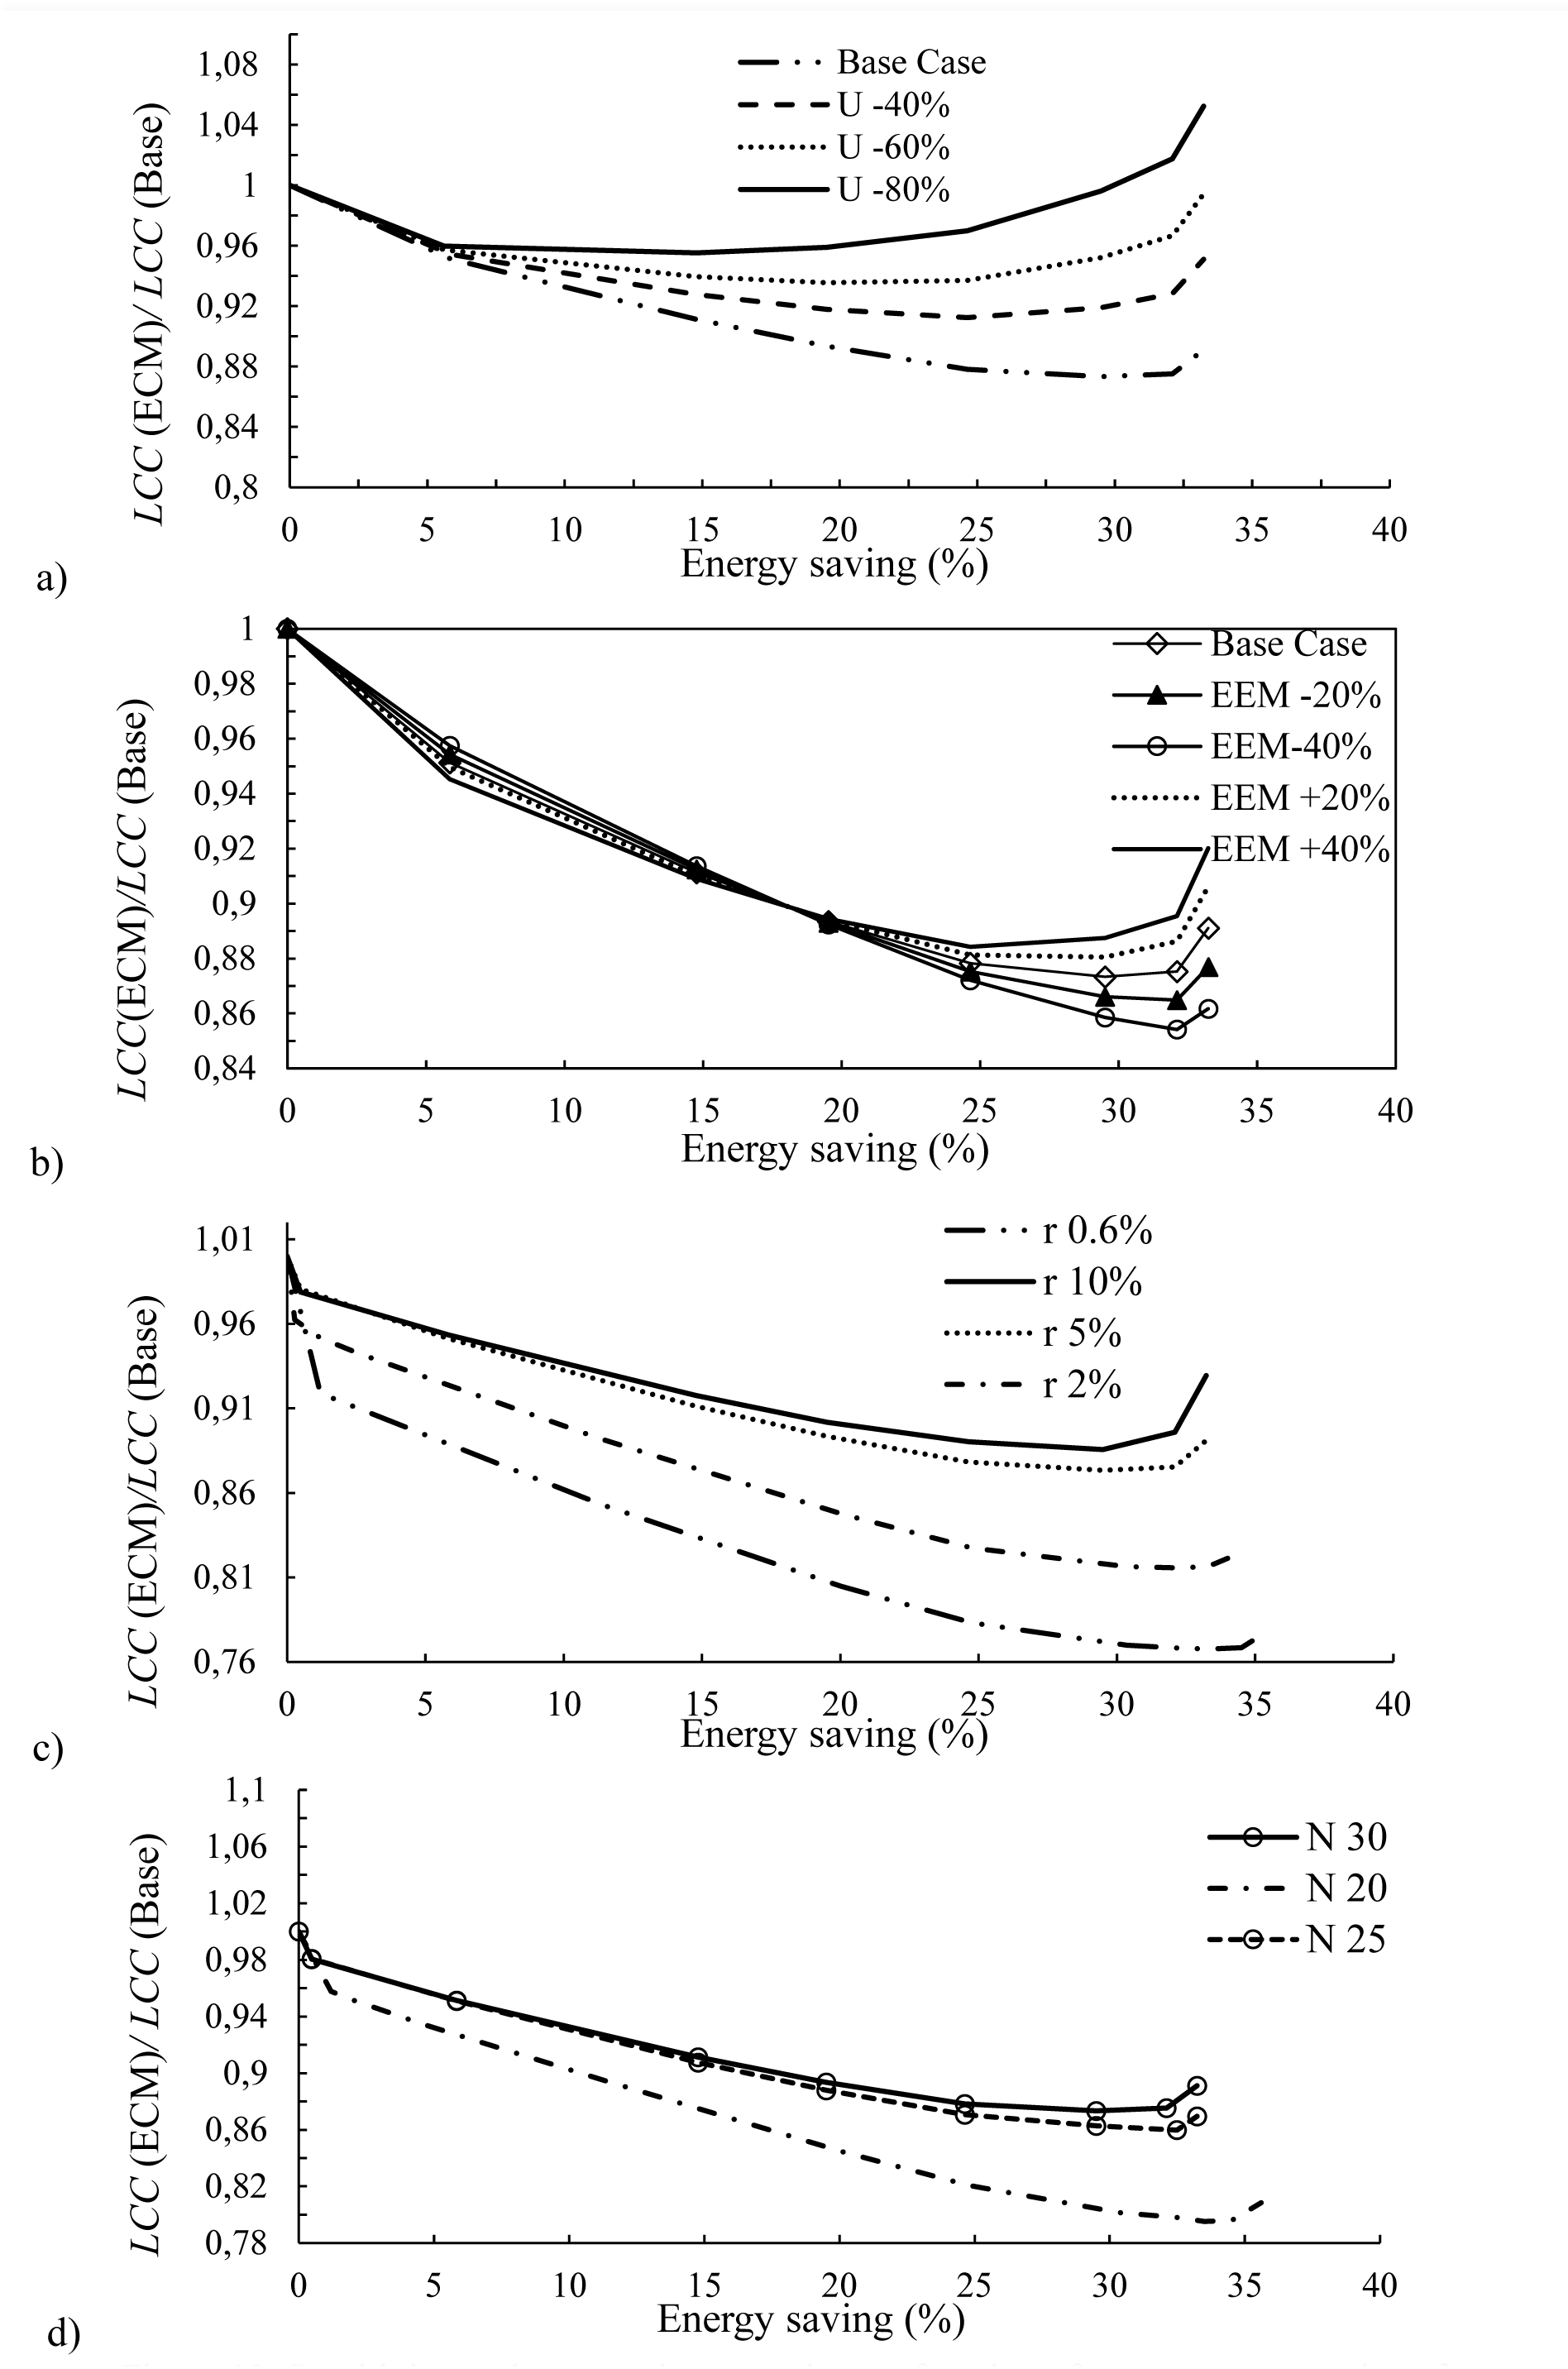
The impact of the electricity rate is analyzed by decreasing electricity rates from 40% to 80% of the current utility rates. The effect of the reduction of electricity rates on the normalized LCC ratio is shown in Figure 13a. The current utility cost is 0.1$/kWh in Jordan. Results show that the utility rate has a significant effect on the shape of the cost – energy efficient optimal paths. In particular, the optimal energy saving is reduced from 30% to 14.8% as utility prices are reduced from the baseline rate (100%) to 20% of the original level. It was observed that energy consumption reduction initiatives are cost-effective for homeowners as long as the is no significant drop in the utility rates in the future. In particular, the optimal source energy savings is decreased from 30% to just 14.8% as the utility rates are decreased from the baseline rate (100%) to 20% of the original cost as shown in Figure 13b. This figure describes the fact that with the high subsidies in electricity costs, it is not cost-effective for the homeowners to invest in measures to reduce energy consumption. Meanwhile, the optimal normalized LCCs are decreased with the increase in utility rate. Figure 13a. illustrates the variation of the optimal normalized LCC as a function of the increased level in utility rates in Irbid.
The energy conservation measures cost is considered a key factor in design cost-efficient buildings. The effect of uncertainty of the cost of EME is investigated by varying from -40% (reduction) to 40% (increase). The results shown in Figure 13b show that the optimal normalized LCCs are slightly increased when the ECM costs are increased, while the optimal energy savings are slightly reduced. For instance, as the cost of ECM implementation rises by 40% of the current cost, the optimal normalized LCC values rise from 0.87 to 0.88 and the optimal annual savings in energy usage are marginally reduced from 29% percent to 25%. However, as the cost of ECM implementation through a rebate scheme decreases by 40%, the optimal normalized LCCs are decreased from 0.87 to 0.85 and the optimal savings in energy consumption are increased from 30% to 32%. Indeed, lower prices for EEM options contribute to additional energy-efficient characteristics that are cost-effective for homeowners to design their residential buildings, resulting in higher energy savings and lower LCC values.
The effect of discount rate is investigated by studying several values of discount rates ranging between 0.6% and 10%. Results shown in Figure 13c generally indicate that the cost-optimal calculations have low sensitivity toward changing the discount rate values. Moreover, the life cycle cost and energy savings slightly decrease with increasing discount rates. The energy-efficiency measures become more cost-effective with lower annual discount rates. For the 10% discount rate, the optimal energy saving was 29% while it was 32.5% for the 0.6% discount rate. In order to investigate the applicability of calculation periods, the effect of cost calculation period is analyzed with three alternatives: 30 years, 25 years, and 20 years. It is clear from the results presented in Figure 13d that the cost - optimal values were insensitive to the calculation period. Almost the same energy savings is observed for the three values of the calculation period. The results of sensitivity analysis are in agreement with previously published results [22], [35].
Sensitivity analyses. cycle cost ratio as a function of source energy savings for a residential 436 building in Doha (a) and the cost of energy-efficient measure increase for five 437 selected cities in the MENA region (b)
In this study, a methodology used to identify cost-optimal efficient design solutions is applied for single-family one-story building located in three climate zones. Domestic market conditions are considered to strengthen the validity of the methodology. Detailed simulation and optimization analyses are conducted. The cost-optimal design for residential buildings is identified by performing optimization analysis. A wide range of energy efficiency measures was involved in the optimization analysis. These measures include building orientation, window size, various glazing types, roof materials, wall insulation, infiltration, shading, lighting system, and HVAC coefficient of performance. The cost-optimal design can save energy up to 30-39% compared with the base case building. Furthermore, it has been concluded that the economic and climate conditions affect the selection of the optimal design options. The minimum life cycle cost for a one-story building for the three climate zone in Jordan ranged from $14,786 $ in Aqaba, to $9,562 in Ma'an.
Based on the results, the climatic characteristic is a very key factor affecting the definition of a reference building. Defining one reference building for a whole country that has different climatic zones leads to unreliable results. Every climate zone should have its own reference building characteristic. In this study, the global cost calculation period is set equal to 30 years for residential buildings. To assess the validity of the methodology, sensitivity analyses are carried out and found out that the cost - energy efficient calculations are insensitive to the discount rates, cost calculation period, and marginally sensitive to the utility rates.
This work is funded by Jordan University of Science and Technology.
- ,
Vacuum glazing for highly insulating windows: Recent developments and future prospects ,Renew. Sustain. Energy Rev. , Vol. 54 ,pp 1345-1347 , 2016, https://doi.org/https://doi.org/10.1016/j.rser.2015.10.134 - ,
The characteristics of photosensors and electronic dimming ballasts in daylight responsive dimming systems ,Build. Environ. , Vol. 40 (1),pp 39-50 , 2005, https://doi.org/https://doi.org/10.1016/j.buildenv.2004.07.014 - ,
Evaluation of energy use in Jordan using energy and exergy analyses ,Energy Build. , Vol. 59 ,pp 1-10 , 2013, https://doi.org/https://doi.org/10.1016/j.enbuild.2012.12.035 - ,
Employment of renewable energy in Jordan: Current status, SWOT and problem analysis ,Renew. Sustain. Energy Rev. , Vol. 49 ,pp 490-499 , 2015, https://doi.org/https://doi.org/10.1016/j.rser.2015.04.050 - ,
Evaluation of Solar Electric Power Technologies in Jordan ,Jordan Journal of Mechanical and Industrial Engineering , Vol. 4 (1),pp 121-128 , 2010 - Annual report 2016, 2016, https://www.memr.gov.jo/ebv4.0/root_storage/en/eb_list_page/annual_report_2016.pdf
- ,
Potentials and Barriers of Energy Saving in Jordan’s Residential Sector through Thermal Insulation , Vol. 11 (3),pp 141-145 , 2017 - ,
Electricity Consumption in the Industrial Sector of Jordan Application of Multivariate Linear Regression and Adaptive Neurofuzzy Techniques ,AIP Conference Proceedings , Vol. 1159 ,pp 135 , 2009, https://doi.org/https://doi.org/10.1063/1.3223918 - ,
Economic evaluation of energy saving measures in a common type of Greek building ,Appl. Energy , Vol. 86 (12),pp 2550-2559 , 2009, https://doi.org/https://doi.org/10.1016/j.apenergy.2009.04.029 - ,
The Effect of a Naturally Ventilated Roof on the Thermal Behaviour of a Building under Mediterranean Summer Conditions ,pp 508-519 , 2020, https://doi.org/https://doi.org/10.13044/j.sdewes.d7.0297 - ,
Preliminary Energy Evaluations for the Retrofit of Rural Protected Buildings in a Peripheral Context of Milan ,pp 715-734 , 2020, https://doi.org/https://doi.org/10.13044/j.sdewes.d8.0332 - ,
Experimental study on the performance of insulation materials in Mediterranean construction ,Energy Build. , Vol. 42 (5),pp 630-636 , 2010, https://doi.org/https://doi.org/10.1016/j.matpr.2020.09.171 - ,
Comparative assessment of internal and external thermal insulation systems for energy efficient retrofitting of residential buildings ,Energy Build. , Vol. 64 ,pp 123-131 , 2013, https://doi.org/https://doi.org/10.1016/j.enbuild.2013.04.004 - ,
Experimental Characterization and Energy Performances of Multiple Glazing Units with Integrated Shading Devices ,Energy Procedia , Vol. 113 ,pp 1-8 , 2017, https://doi.org/https://doi.org/10.1016/j.egypro.2017.04.002 - ,
Experimental study on the effectiveness of internal shading devices ,Energy Build , Vol. 111 ,pp 154-163 , 2016, https://doi.org/https://doi.org/10.1016/j.enbuild.2015.11.040 - ,
Optimal parameters of green roofs in representative cities of four climate zones in China: A simulation study ,Energy Build , Vol. 150 ,pp 118-131 , 2017, https://doi.org/https://doi.org/10.1016/j.enbuild.2017.05.079 - ,
Thermoeconomic analysis method for optimization of insulation thickness for the four different climatic regions of Turkey ,Energy , Vol. 35 (4),pp 1854-1864 , 2010, https://doi.org/https://doi.org/10.1016/j.energy.2009.12.022 - ,
Optimum insulation thickness of residential roof with respect to solar-air degree-hours in hot summer and cold winter zone of china ,Energy Build. , Vol. 43 (9),pp 2304-2313 , 2011, https://doi.org/https://doi.org/10.1016/j.enbuild.2011.05.012 - ,
On-site Energy Management by Integrating Campus Buildings and Optimizing Local Energy Systems - Case Study of the Campus in Finland , Vol. 4 (4),pp 347-359 , 2016, https://doi.org/https://doi.org/10.13044/j.sdewes.2016.04.0027 - ,
Costs and Benefits of Green Roof Types for Cities and Building Owners ,pp 21-25 , 2019, https://doi.org/https://doi.org/10.1016/j.rser.2020.110111 - Towards nearly zero- energy buildings. Definition of common principles under the EPBD - Final report, 2013, https://ec.europa.eu/energy/sites/ener/files/documents/nzeb_full_report.pdf
- ,
Design optimization of energy efficient residential buildings in Tunisia ,Build. Environ , Vol. 58 ,pp 81-90 , 2012, https://doi.org/https://doi.org/10.1016/j.buildenv.2012.06.012 - ,
Methods for Assessing Energy Efficiency of Buildings ,pp 432-443 , 2019, https://doi.org/https://doi.org/10.13044/j.sdewes.d6.0243 - ,
Building Integrating Phase Change Materials : A Dynamic Hygrothermal Simulation Model for System Analysis Building Integrating Phase Change Materials : A Dynamic Hygrothermal Simulation Model for System Analysis , (April), 2019, https://doi.org/https://doi.org/10.13044/j.sdewes.d6.0255 - ,
A review on phase change material application in building , Vol. 9 (6),pp 1-15 , 2017, https://doi.org/https://doi.org/10.1177/1687814017700828 - ,
Methodology to Define Cost-Optimal Level of Architectural Measures for Energy Efficient Retrofits of Existing Detached Buildings in Turkey ,Energy Build , 2016, https://doi.org/https://doi.org/10.1016/j.enbuild.2016.03.074 - , Cost optimality - brake or accelerator on the way towards nearly zero energy buildings, 2012
- ,
Cost optimal and nearly zero energy performance requirements for buildings in Estonia Cost optimal and nearly zero energy performance requirements for buildings in Estonia , (January), 2013, https://doi.org/https://doi.org/10.3176/eng.2013.3.02 - ,
Cost optimal levels of energy requirements for nearly-ZEB : application to an Italian reference building for existing offices ,CLIMA 2013, 11th REHVA World Congress , 2013 - ,
Evaluation of net-zero energy residential buildings in the MENA region ,Sustain. Cities Soc. , Vol. 22 ,pp 116-125 , 2016, https://doi.org/https://doi.org/doi:10.1016/j.scs.2016.02.007 - ,
Environmental assessment of popular single-family house construction alternatives in Jordan ,Build. Environ , Vol. 92 ,pp 192-199 , 2015, https://doi.org/https://doi.org/10.1016/j.buildenv.2015.04.032 - ,
Technical and economical assessment of the utilization of photovoltaic systems in residential buildings: The case of Jordan ,Energy Convers. Manag. , Vol. 51 (8),pp 1719-1726 , 2010, https://doi.org/https://doi.org/10.1016/j.enconman.2009.11.026 - ,
Comparative study of continuous versus intermittent heating for local residential building: Case studies in Jordan ,Energy Convers. Manag , Vol. 65 ,pp 709-714 , 2013, https://doi.org/https://doi.org/10.1016/j.enconman.2011.12.036 - ,
Optimal design of residential building envelope systems in the Kingdom of Saudi Arabia ,Energy Build. , Vol. 86 ,pp 104-117 , 2015, https://doi.org/https://doi.org/10.1016/j.enbuild.2014.09.083 - ,
Analytical periodic solution for the study of thermal performance and optimum insulation thickness of building walls in Tunisia ,Appl. Therm. Eng. , Vol. 30 (4),pp 319-326 , 2010, https://doi.org/https://doi.org/10.1016/j.applthermaleng.2009.09.009