


A worldwide steady increase of the waste amounts is a direct consequence of economic growth without taking care for the disposal of the products after their final use, which is particularly evident in terms of putting cheap but not durable products on the market. The consequences are significant, and the problem of municipal waste has been recognised as a priority environmental problem worldwide. The answer to the current situation involves two main groups of activities: remediation of the consequences of previous unacceptable waste management in order to reduce the intensity of further harmful effects on the environment and human health, and the establishment of new waste management systems which include measures for the prevention of waste generation and stipulate mandatory procedures with individual waste categories all in order to separate the individual waste streams and to reduce the amount of the residual mixed municipal waste.
The European Union (EU) has been importing between 20% and 30% of all resources (raw materials and energy carriers) around 42% of natural gas, 56% of coal and 88% of oil, 50% of copper, 85% of bauxite, 89% of iron ore and 100% of a wide range of hi-tech metals [1]. However, the European economy simultaneously loses significant amounts of potential secondary raw materials that are a part of waste streams and are currently ending up in landfills. In 2016, total waste production in the EU amounted to 2.3 billion tonne (t), of which 1.1 billion t [2] were not reused or recycled and therefore represent a loss for the European economy. By this, the EU misses the opportunities to significantly improve resource efficiency and create a wider circular economy. It is estimated that an additional 600 million t of waste could have been recycled or reused [3].
The European Union's goals in the field of municipal waste management, as defined in various directives and plans, prescribe an increase of the recovery and recycling rate for municipal waste to 50% by 2020, and 65% for the period up to 2035 [4]. At the same time, the share of packaging waste recycling in the EU (according to modified goal in 2018 in plans of the circular economy [5]) has to rise to 70% by 2030, which will be difficult to achieve without efficient and comprehensive separate collection and material recovery (recycling) of packaging waste. In addition to preserving resources and protecting the environment, such an approach also offers a great potential for development of economic activities through the development of economic branches based on the management and recovery of different types of wastes.
Modern deposit refund systems (DRS), also known as deposit return systems, are recognized today as a very efficient instrument to reduce littering and improve recycling. Although limited to beverage packaging, deposit refund systems exhibit a unique ability that they could ensure very high levels of collection (return that regularly surpasses 90% and sometimes even above 95% [6]), but even more important is that they enable sufficient supply of high-quality feedstock for recyclers, which leads to high levels of recycling (especially in closed loop recycling, like bottle-to-bottle). The EU also gave a special attention to deposit refund systems in a recent EU Plastics Strategy [7], where national and regional authorities are encouraged to put in place well-designed deposit systems, among other measures, for improving the economics and quality of plastics recycling. Consequently, the EU directive from 2019 [8] recommends establishing deposit refund schemes for products listed in Part F of the Annex (beverage bottles with a capacity of up to 3 L, including their caps and lids).
Dating back in 1984 with the start of the first modern deposit refund system in Sweden [9], deposit refund systems are now spread worldwide with about 40 implemented DRSs, of which 10 are in the EU and EEA countries: Denmark, Estonia, Finland, Croatia, Iceland, Lithuania, Norway, Germany, Netherlands and Sweden, while several more countries in Europe are currently considering introducing it. The deposit refund systems are also in place in the United States (10 federal states), Canada (12 provinces), Australia, Israel, and the island states of Micronesia, Kiribati and Palau [10].
In essence, the deposit refund system embodies two main instruments: a tax on the purchase of a product in a packaging, and a subsidy on separate collection of the same packaging after using the product. It is generally accepted that DRS is an efficient scheme for packaging waste collection entailing high environmental benefits [11], but there are some doubts about and critics on economic viability of such systems [12] which effectiveness and their implementation efficiency is directly related to the context they are enforced in [13], as well as to the type of waste/products which are covered by this type of a system [14]. In some countries where DRS were introduced, they sometimes generate excessive costs (for industry, government, or taxpayers) and, in rare cases, it could even lead to complete failure (in 2017 twelve months voluntary trial to introduce DRS (although no household waste was involved) ended unsuccessfully [15]) or near bankruptcy of such systems (usually transient issue, more probable in initial years of implementation).
The legitimate question put here is if the environmental efficiency and benefit should be maintained at any cost, or only if such schemes could operate on sustainable grounds. So, the main research question laid is how to make such systems economically sustainable or even self-sufficient, and if that is even possible taking into account a complexity, interdependency of the subjects, and the costs generated in each phase of the DRS. Additional question is if the cost of packaging waste management in the DRS that mainly burdens the industry (producers, importers) can be minimized but still enabling the system to operate, even on non-profit grounds. The fact is that the deposit refund system will always entail spending for one of the market actors [11], most often for the industry.
This research encompasses identification and analysis of cost and income drivers of DRS and economic modelling of DRS system. This way complexity of DRS system is explained, and model is further used for analysis of the case study DRS system. The case study analysis is built upon the case of the youngest member of the EU Republic of Croatia, and shows how such system can be organized. In that sense, the DRS will be designed as done from scratch, not considering the present organizational layout. Implementation of DRS in Croatia is more challenging because of its geographic characteristics (elongated, long and narrow crescent-shaped, with two more densely populated regions separated by a mountainous area and a very indented coast with many islands) as well as influence of tourism (large difference in population distribution and beverage consumption/waste packaging production between seasons). Thus, the work presented can serve decision-makers in other countries and regions which do not have yet implemented such systems but are discussing that possibility to take into account all drivers that influence economic sustainability of DRS, especially the systems which need to be implemented in countries with similar peculiarities. This way the DRS system, which represents a market-based instrument to address externalities [16], can be better understood, especially from the economic point of view. As a form of extended producer responsibility system [17], it can well realize internalization of external diseconomy [18]. Through stipulation of financial responsibility of the producers, DRS systems can help to the success of environmental policies based on extended producer responsibility [19] and provide support to the implementation of the waste management hierarchy [20]. At the same time, due to the flexibility and economic stimulation of deposit, it can effectively recover the environmental pollution that is difficult to regulate (such as illegal waste disposal [21]).
The deposit refund system setup may vary sufficiently according to legislation, ownership structure, system processes and technical logic [10], but the core of the DRS in different countries is the same, especially from the consumer perspective [18]. The principle is well known: consumer pays product price plus deposit upon purchase of the beverage product and reclaims the deposit, when returns the empty container. In traditional and well-functioning DRSs, retailers' motivation is essential as they are very much involved to provide maximum collection points density and convenience for the consumers, that guarantees high return rates. So, these are two very important factors for DRS which are discussed later: convenience for consumers and high coverage of collection points.
Since the standard deposit refund systems embody the principle of producer responsibility, all the stakeholders in the chain (beverage producers, importers, but also retailers who help to put huge quantities of beverage packages to the market) counted as responsible for the collection of such packaging, are considered as polluters. Therefore, majority of bodies managing the deposit refund systems (the central DRS organizations) are formed and owned jointly by the industry and retailers (in different ownership shares). Although for the central DRS organization being under producer and retailer control, usually means it is very much efficiency orientated in all aspects, from the other hand it could be affected by industry and retailers' different interests. In a government owned and run DRS organization (such as in the case study DRS) there is possibility to make decisions quicker and take into consideration more the environmental aspects rather than business aspects. But it should not matter, if DRS organization is owned by industry or government, it is clear that environmental and financial aspects both have to be considered and balanced to guarantee DRS sustainability on a long run [22].
The literature review shows that there is a growing number of research papers and studies on DRS mainly of an organizational [23], technical and environmental [18] side, as well as others that are case dependent [24] and can be even more case-oriented by analysing system from a standpoint of only one specific type of packaging [25], at the same time there are quite limited sources dealing with the economic aspects [26] and financial efficiency of DRS [27]. Fundaments of an efficient DRS were discussed by Numata [26], who minimised negative impacts on suppliers, and Walls [21], who examined DRS in theory and practice.
There are also country-specific works, the most recent for Latvia that is preparing to implement a DRS from 2022, of Dāce et al. [28] in which they assessed sustainability and economy of Latvian DRS, while in [29] it is concluded that care must be taken that economic costs do not outweigh the environmental benefits. More recent analysis of Latvian system is given in [30], where it is found that introduction of deposit refund system requires substantial, not only financial, but also organisational resources which can be alleviated with implementation of deposit system after other separate waste collections systems are already in place, and [31] which emphasised the importance of paying attention on system cost and reduction of payback period. Different authors reviewed DRS in other countries, e.g. the work of Growth [32] in which he analysed the German DRS. Furthermore, in [33] Numata optimized the DRS considering allocation of unredeemed deposits, while in [34] he discussed the policy on DRS in Finland and Norway. There are also other documents on this topic, like the economic analysis of introduction of DRS in Slovakia [35], a social cost-benefit analysis of Danish deposit system [36] and cost-benefit analysis of deposit refund program in Israel [37], but they do not give sufficient emphasis on economic issues. Other researchers focused only to certain packaging materials in DRS, like aluminium [38], PET [25], or glass [39]. Compared to other studied countries, the case study represents a more challenging country for implementation of DRS due to its geographical features and changes in population density due to tourist migration and thus represents a case study of implementation of organizational, transport, and thus economically more complex DRS.
Establishing and managing DRS tend to exhibit high operation costs if the system is not optimized and run properly. Ideally, the deposit refund system should operate on non-profit basis, which is in practise not often the case. In this work, system economy is modelled on the presumption of operation of the system on the positive zero yearly cash flow, in a sense that sum of system incomes and expenses gives zero profit at the end of the year. On a basis of this approach, a variety of waste management systems are modelled [40], and their overall cost is tracked [41]. While all other economic flows are modelled as a function of system configuration and integration requirements, a fee that producers and importers of packaging need to pay for system operation is adjusted to achieve defined equality its minimum required value is tracked to operate the system economically, on a positive zero.
As the system is modelled from beginning, all economic flows are also modelled, thus this calculation can be used for modelling of economy of any given system/country, only with modifying input data and adapting to local conditions. To do that, all the factors influencing investment in and efficient operation of a DRS are identified and explained.
To model any system, it is important to clarify and understand some key details upfront, which represent key drivers for DRS system modelling as well as tracking of corresponding economic flows. To enable the use of developed model in different situations, these also need to encompass possible integration particularities that can be expected like population distribution, distribution of stores, as well as time/periodic population migrations that are mostly related to tourism.
The following factors influence the investment size, and what the refund deposit system for beverage packaging encompasses:
A most important factor in the calculation of the size of the investment in DRS and in planning of handling (recycling) centres is to understand the quantity (number) of packaging, covered by DRS, that is put to the market. This number influences waste generation the most, and needs to be defined/estimated as accurately as possible. Other influencing factors that can influence waste generation are changes in data quality, changes in waste generation due to socio-economic influences, system efficiency or changes in the number of citizens generating waste [42]. To enable modelling of the last factor, as well as changes due to tourism related migrations, it is good to express waste generation per capita. Comparison of amounts of collected packaging waste per capita, as well as number of tourists, for three EU countries is given in Table 1.
Amount of packaging waste per capita [43]
| Country | Mass of packaging waste per capita [kg PC]* | No. of tourists [106] |
|---|---|---|
| Croatia | 48.2 | 17.0 |
| Lithuania | 110.7 | 1.5 |
| Estonia | 173.1 | 2.1 |
kilogram per capita
Another side is represented with a quantity of collected packaging per type of packaging through DRS system. It is different from put to market value by the system efficiency. In the case of DRS, usual system efficiency ranges between 80 and 90% [44].
Also, as some economic flows are connected to the mass of the packaging, and other to a number of collected packaging, it is important to calculate each value. Depending on available data, unknown values can be calculated using average mass of average mass of packages. Average mass of usual packaging that can be found as a part of DRS are measured and amounts to ca 44 gram (g) for PET, ca 13.5 g for CANs and ca 360 g for glass bottles.
In the planning phase of a DRS, it is very important to assess the collection structure, meaning if packages are collected with RVMs and are counted and compacted in the shop or collected manually. To ensure DRS transparency, each collected package has to be identified by EAN code, which means that all manually collected packages or non-compacted packages should be counted by DRS itself or its appointed and controlled third party. As the RVMs decrease DRS operating costs, as they count and compact the packages immediately after acceptance, it is logical that use of RVMs should be motivated through the system because its usage entails bigger investment cost for retailers. The retailers are obliged to invest into the deposit system infrastructure, including package return rooms and the RVMs. DRS should compensate the initial investment according to the accepted packages over time, but the initial investment obligation will remain with the retailers. Many retailers would delegate the package return solution to third parties (service providers). It is important to note that even in such case, the retailer would still remain responsible in front of consumers.
Through the comparison of the statistics in different countries with deposit systems (Table 2), a suggested number of inhabitants per one RVM can be defined, and it ranges between 2,500 and 3,000.
Number of RVMs per inhabitants [22]
| Country | Population [106] | No. of RVMs with compaction | Average inhabitant/RVM |
|---|---|---|---|
| Norway | 5.20 | 3,700 | 1,405 |
| Denmark | 5.60 | 3,000 | 1,867 |
| Finland | 5.44 | 4,000 | 1,360 |
| Sweden | 9.59 | 5,000 | 1,918 |
| Lithuania | 2.96 | 900 | 3,289 |
| Estonia | 1.33 | 500 | 2,650 |
| TOTAL | 30.12 | 17,100 | 1,761 |
| Croatia | 4.15 | 1,100 | 3,773 |
When packaging is collected it is transported to handling (counting/processing) centres. These centres receive packaging from surrounding areas and count it, sort and compact. Thus, they need to be positioned and dimensioned taking into account packaging waste generation/collection distribution and quantity, including sessional changes.
All of these steps lead to data transparency which is an important basis for the deposit system and represents the foundation for its controlling. Controlling helps to analyse and monitor possible frauds, including fraud by consumers or workers and cross-border risk. Considering the data volume (basically every sold and returned package is in the database) a DRS must be capable of using the so-called big data analysis.
Economic model of DRS is as complex as is the system itself. In the following subchapters operating costs of each part of the system are separately modelled and discussed, as well as system revenues.
In the countries with deposit refund system, a standard practice is that the system covers direct costs which are in a relation with the collection of packaging. This practice can be different in different EU countries, but a general principle is the "polluter pays" principle in which the polluter is responsible to cover the costs of collection of (beverage) packaging it puts to the market and its recycling. Therefore, the importers and producers have to pay the expenses of operation of the deposit refund system through the so called recycling fee. The contribution of retailers is that they accept the packaging and must not put their usual profit margin to that service [45].
The main costs of the DRS are:
Retail handling fee,
Costs of transport and logistics,
Handling (counting, recycling) centre costs,
Cost of administration,
Depreciation on investment.
It should cover the direct costs for the stores arising from the collection of packaging (included in the deposit system) returned by the consumers and their delivery to the DRS [22]. In majority of DRS countries, there is agreement that the DRS should cover the direct costs of the packaging with deposit marking (some indirect costs for producers and importers are discussed later), while the retailers will not profit from that activity. The difference can arise if the example store, upon which the calculation of RHF is made, is the most effective one or is it a store with an efficiency average over the whole country. Since the retail handling fee is the largest cost in the DRS, it must be agreed with the retailers and other stakeholders of the DRS, and so calculated based on correct basis and at an effective level [22].
Usually, RHF is divided in two fees, an automated (RVM) retail handling fee, and a manual reception RHF. The RVM RHF can vary based on the packaging material since the cost of accepting different materials can be different. Apart from collecting packaging at retail stores, DRS can offer its collection service of packages with deposit markings also to Horeca sector companies. Companies in that sector usually pay only deposit, so there is no need for an additional fee like the one that is paid to the retailers (RHF) for collection in stores. The difference is that retailers must enable the collection of the packages marked with the deposit marking from the consumers and invest into it, while companies in Horeca sector collect such packages as a result of their own activity (serving drinks to clients) and they do not need to organize collection of packages from the consumers [46]. So, for the Horeca sector it is useful that the DRS takes over their packaging relieving them from that burden and at the same time paying them value of the deposit.
Based on the review of DRS in different countries [45] the fee for automated acceptance (via RVM) of packaging for the retailers goes in range from 1.7 to over 4.0 cents EUR per package/unit. This is clearly shown in Figure 1, where handling fees of DRS systems in five EU countries are presented. Also in Figure 1, the difference in the handling fee amounts for the automatic acceptance compared to the manual can be seen. If the relative (percentage) differences in the amount of automatic handling fee (with compaction) is compared to the manual acceptance, it can be seen that most of these countries have a much higher ratio of these fees (ranging between 20302%). The larger (relative) ratios contribute to investment in the purchase of RVMs and ultimately greater system efficiency.
Handling fees in some countries (darker colours indicate the fees for manual acceptance while lighter colours indicate the fees for automatic acceptance)
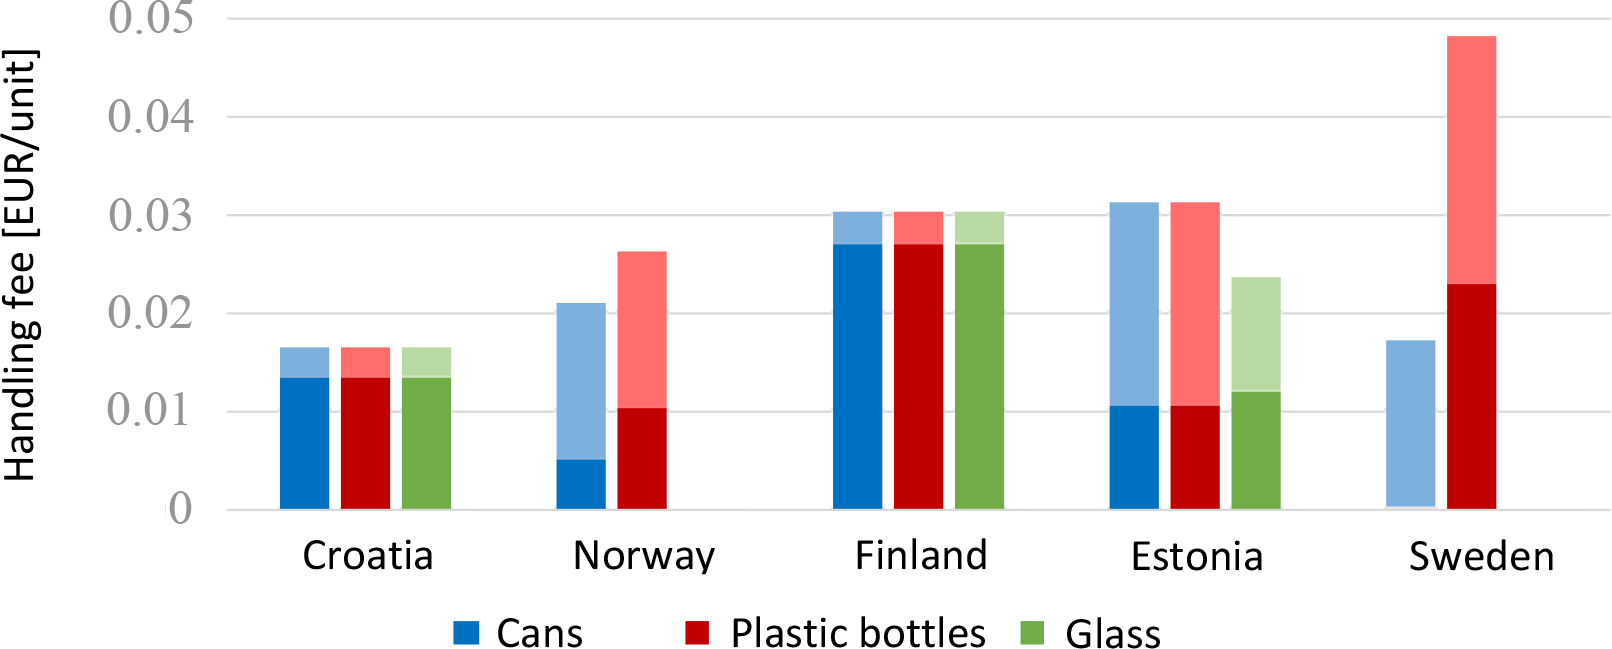
As it is said, these fees need to cover retailers' costs associated with collection of packaging returned by consumers and its handling, regardless is it manually collected or via RVMs.
If the presumed volume of returned packages with deposit marking per month crosses 10,000 packages, then it would make sense for the store to invest into an RVM instead of accepting packages manually. The market offers RVMs with varied sizes and speeds. The optimum return of a regular, medium size and full compacting (PET/CAN) RVM is between 40,00060,000 packages per month. There are (market) solutions that could increase that number even further due to the fact that such RVMs do not have to stop operating, continuing to accept the packages, even when being emptied. The characteristics of the country and on which days and at which times the consumers go to the stores must be considered (it can usually be presumed that the packages are returned before shopping). If the number of returned packages exceeds the optimum amount, the store can always add an additional RVM.
When packages are collected with RVM deposit system will cover the costs of:
If the volume of accepted packages is less than 10,000 per month, it is usually economically unreasonable to install an RVM, thus manual acceptance is a logical option. In the case of manual collection, cost structure is much simpler. Taking into consideration all previously said and with the assumption that collection is not done inside the store, the retailer only needs to ensure 2 m2 of storage space on average [9]. Cost of this can be valuated through the local rental cost for business/storage space. Only additional costs are associated with the need for additional man-hours for the packaging acceptance, management and deposit return to customers. The time required for a worker to accept an average of 30 units of packaging waste and temporarily store them is estimated at 90 seconds. The cost of this can be valuated through the local average salary for this job type.
They depend on different factors [45] such as:
These costs are very case dependent and need to be modelled specifically for each specific case due to local specifics.
Another part of the collection infrastructure are the handling (counting/processing) centres used to further process the empty containers collected at the retailer (stores) and to prepare them for selling and recycling. In a modern counting/processing centre, the already compacted packaging (collected via RVMs having compacting ability) is further compressed in industrial presses into large cubes which are then sold to material recycling plants. When using non-compacting RVMs, or packages that are accepted manually, or collected from Horeca sector companies, empty containers will need to be counted to check the number collected by what is referred to as an industrial RVM (this is because the packages are not crushed, as in compacting RVMs, and so could be re-entered back into the system to claim back the deposit twice). The value of deposit and RHF is paid to the respective retailer depending on the amount counted. The packaging is counted based on the EAN code, which ensures that no deposit is paid out for packaging which is not included (registered) in the system, and for which no deposit was initially paid. The payment to the retailers for the deposit packaging that has to be counted by the industrial RVM, is done according to the data generation of such equipment. In the case of compacted packaging, the amount paid to retailers as compensation is based on the data obtained from the RVMs (at collection points, in stores).
The most relevant are [45]:
Type of transportation packaging that is used. E.g., in Sweden, "bulk transport" is used, which means that a reusable container is emptied in a compactor-container truck, which can be easily emptied in the handling centre without the need for workers.
Depending if the glass bottles are counted at the handling centre or whether some other method is used as a basis for determining appropriate compensation to retailers. For example, in Finland, the basis for payment to the retailers is the average glass container capacity, which was mutually agreed upon (this, however, allows deceiving the DRS). If there is no need to count the glass bottles, cost for labour and counting equipment are reduced significantly.
Whether glass bottles are crushed at the retailer. In such case, the crushed glass bottles can be transported directly from the store to the recycling plant, which means the material does not need to go through the handling centre at all.
Need for manpower in counting/processing can be estimated to 40 and 55 workers per 10,000 units of capacity, but local specifics should be taken into account for calculation of labour costs.
These costs include labour, IT infrastructure (which is considered among depreciation), promotion and communication, office rent, and general administrative costs. Regarding the core labour costs, it is estimated that an average of 1012 people is needed in the central DRS operator organisation, which includes management staff, finance staff, security/system accountability staff, customer service representatives, and communication staff [45]. These costs can differ from case to case depending on specific system needs as well as locally dependent requirements (such as legislative dependent requirements regarding employment of workers on specific job functions). To preserve financial sustainability, system accountability and security must be carefully monitored to reduce the risks and effects of possible fraud. Regarding communication costs, it is necessary to inform the public, so that consumers understand the importance of returning their empty packages, know what types of packaging are included in the program, and how the deposit refund can be retrieved. One of the main purposes of communication is to increase recycling rates. Another way to raise recycling rates is to increase the deposit value but this may lead to higher risk of fraud [22]. Regarding IT costs, they include maintenance and support, software licenses, and development costs. In total, from the analysis of different systems, the costs of annual administration can be estimated to amount to around 2% of the system income.
The majority of previously defined system costs need to be covered by system revenues. The main sources of revenue for the DRS are incomes from unredeemed deposit, sale of materials and industry/administrative fees.
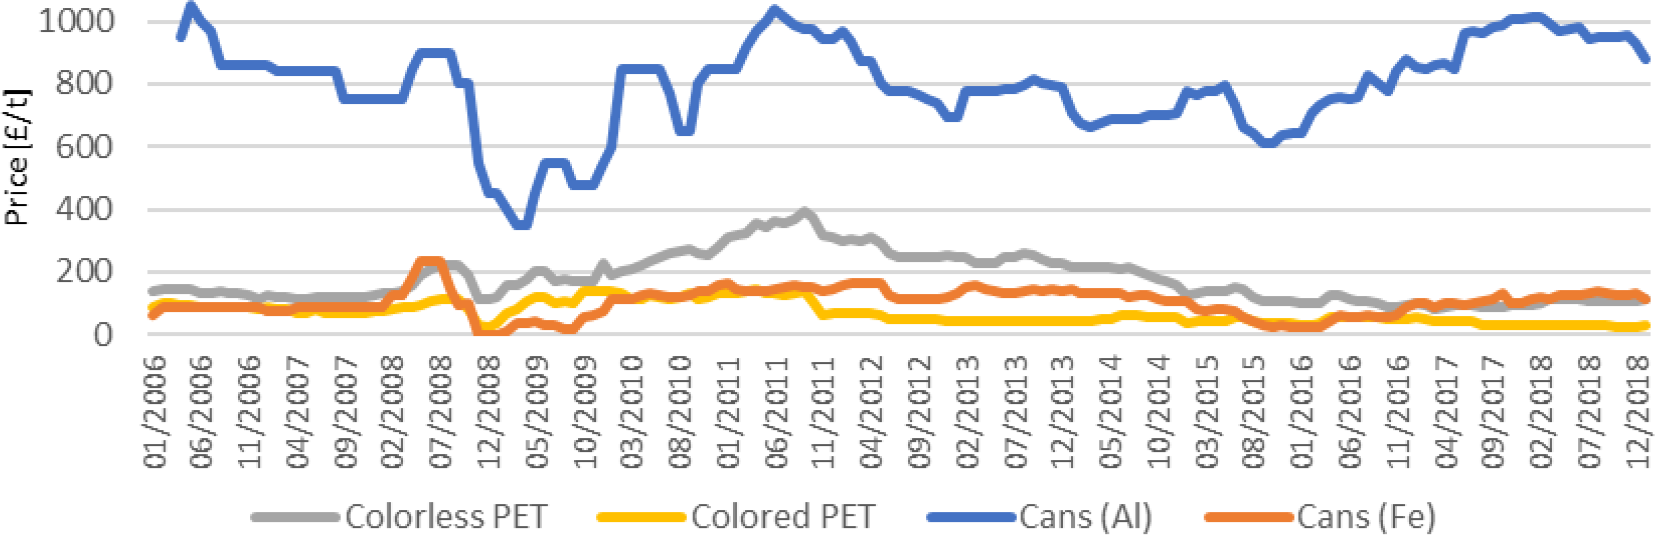
Secondary material market trends for PET and cans [49]
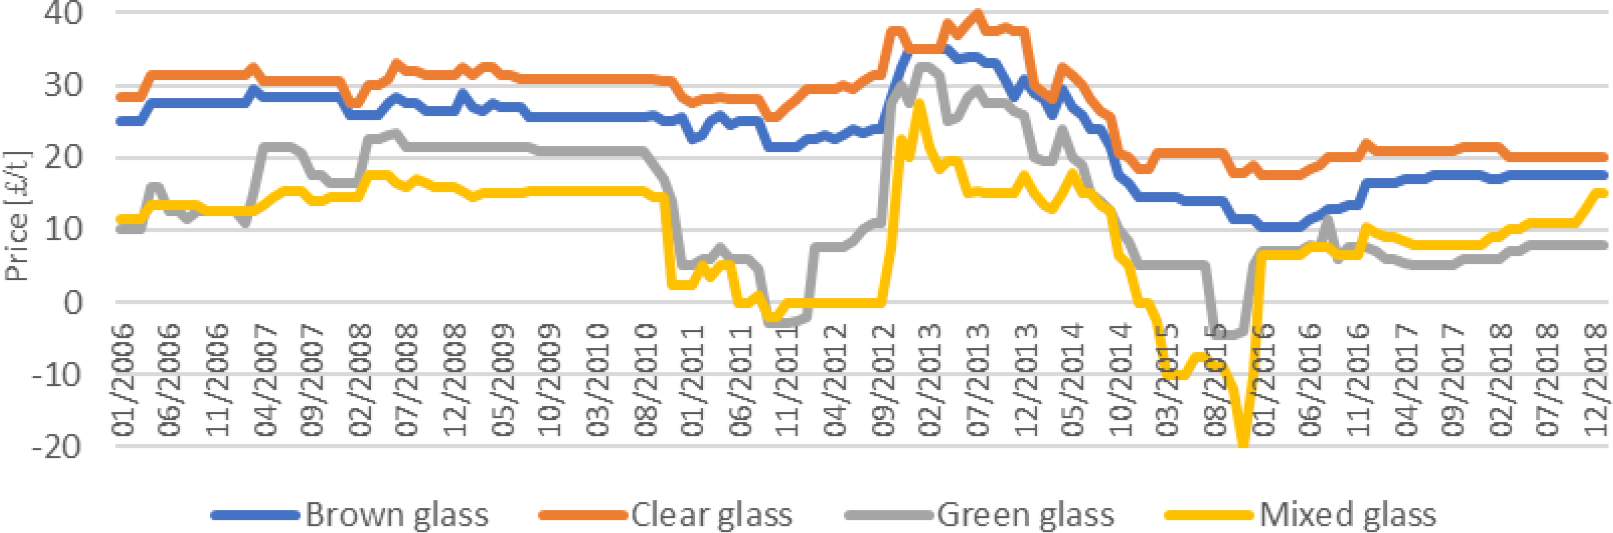
Secondary material market trends for glass [49]
The DRS organisation should operate on the non-profit basis. In other words, the organisation must cover the costs of system operation without a profit motive, i.e. the idea is that DRS system operates at positive zero Equation 1.
(1)
Described model is used on the case of Republic of Croatia. As far as Croatia is concerned, it is far behind the EU average regarding sustainable waste management goals. In Croatia only 25.3% of municipal waste was recycled and composted in 2018, while the European average was 47% [50]. The Republic of Croatia, like other European countries, will have to meet the abovementioned targets for municipal waste recycling (50% by 2020, and 65% by 2035). Data for 2018 showed that the remaining 66% of municipal waste in Croatia was disposed of by landfilling (the remaining 9% are quantities sent to mechanical-biological treatment plants, quantities disposed of by some of the other disposal operations (D8D11, D13, D15) and estimated quantities for the non-covered part of the population). This is a major loss of potential material resources (including recyclable materials) which ends in landfills, occupying space, which could be used as secondary (recovered) raw materials.
In industrialised countries, discarded waste packaging takes a big share in municipal household waste (especially if volume share is observed). Of the average 492 kg of municipal waste per capita in the EU, 174 kg is packaging waste. Due to the widespread distribution of packaging and a large number of users, it is a major source of environmental contamination, especially through the littering. The EU strategy on the packaging waste management asks for reduction of packaging waste generation, design changes which would reduce packaging, restriction and cessation of landfilling of packaging waste, as well as the introduction of fees for manufacturers and importers which would be used for financing of the organisation of the collection, processing and disposal system for the packaging waste. This path is defined by the Packaging and Packaging Waste Directive (94/62/EC) [3] which prescribes the minimum recycling goal of 55% (and 60% recovery) for packaging waste. The EU has also determined that the member states have to organise a collection and recycling system for the packaging waste, but each state is free to decide on the most acceptable method for the implementation.
As for the packaging waste management, Croatia with 53.3% of a recycled packaging waste in 2017, is also lagging behind of the EU/EEA countries, where the EU average was 67% [40]. If the minimum required recycling rate of 55% is taken into account, this means that Croatia did not meet the target in 2017. In the future, the share of packaging waste recycling in the EU (according to plans of the circular economy) will rise, as said, to 70% by 2030, which will be difficult for Croatia to fulfil without improving the systems of packaging waste collection and recycling.
In 2017, 278,068 t of packaging were placed on the Croatian market. This amount includes the quantity of packaging encompassed by DRS but also the returnable (reusable/refillable) packaging (9,649 t). Of these quantities of disposable (one-way) packaging, 138,502 t were produced in Croatia, 131,461 t were imported, and 1,544 t were exported.
According to the data [51], in 2017, 140,672 t of all waste packaging was collected in Croatia. Of these quantities 140,538 t was recycled (all by material recovery). Furthermore, the individual recycling rate targets were achieved for paper (84%) and plastics (37%), of the set targets 60% and 22.5% respectively, while the achieved recycling rate for glass was 57% of the requested minimum of 60%, for metals 16% of the set minimum of 50%, and for wood 3% of the set minimum of 15% [52].
In all of this, the share of beverage packaging collected through the deposit system (in 2017) was about 34.7% (by mass) of the total amount of collected waste packaging (through all systems), which is significant because it is a high quality and clean material fraction. In relation to the amount of beverage packaging in the deposit system which is placed on the market of the Republic of Croatia, about 85% of these quantities were collected through the deposit system in 2017, which is much more than through other means of waste packaging collection. About 42% of the packaging placed on the market in that year were collected through all other packaging waste collection systems in Croatia.
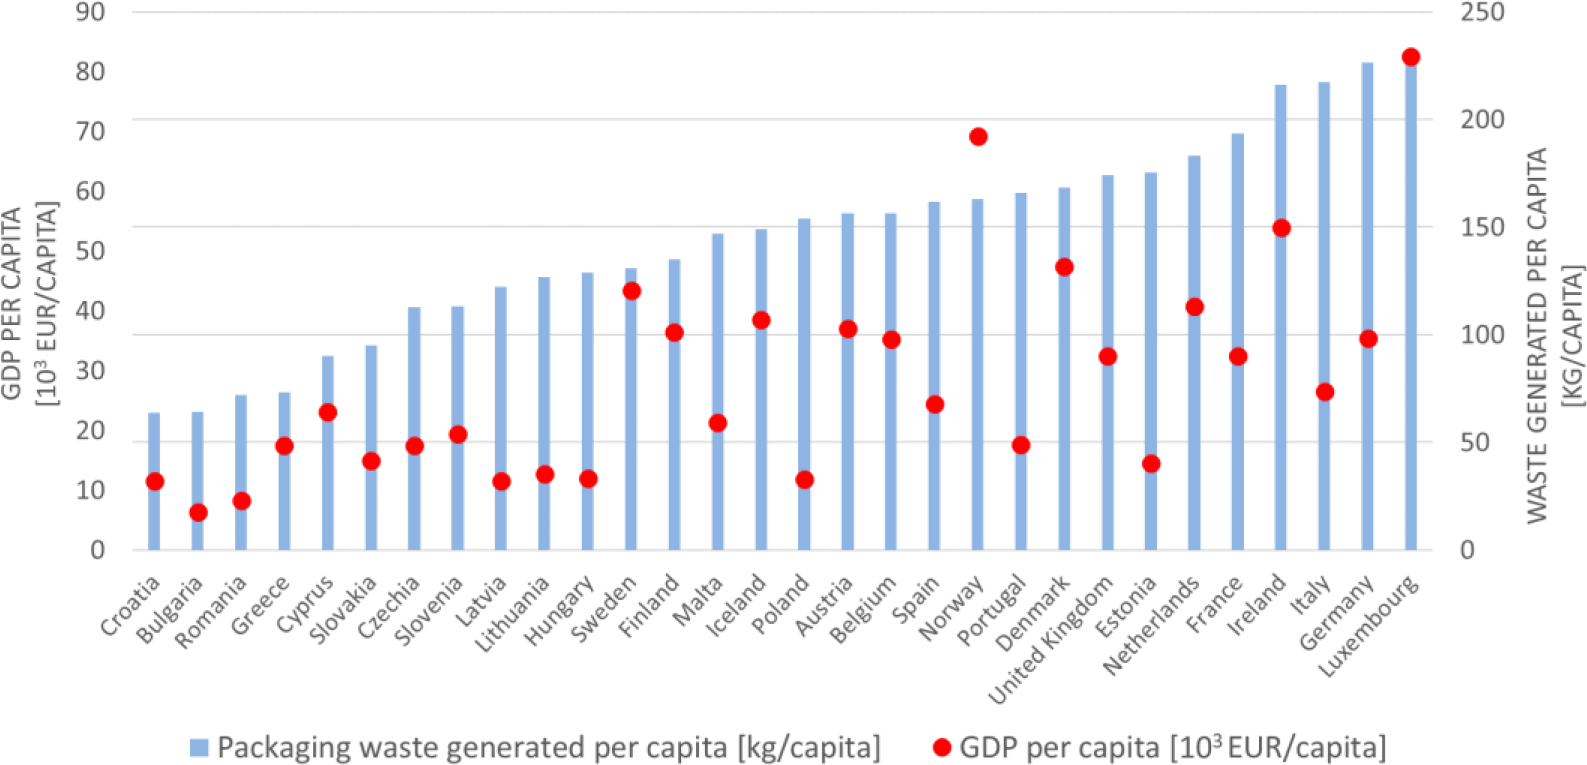
An additional moment is that Croatia officially reports the least quantities of packaging waste generated per capita (63.8 kg PC) in the EU (Figure 4), which is likely to increase in the future with rising standards and more accurate monitoring of waste streams (at the same time Croatia shows the smallest amount of collected or recycled packaging waste in the EU). This is corroborated by the comparison that also takes into account GDP per capita [50]. When looking at countries with a similar GDP per capita (e.g. Latvia, Lithuania, Estonia), in the case of Croatia, there are large deviations from the amount of packaging produced per capita compared to those countries (Latvia 122.2 kg PC, Lithuania 126.8 kg PC, Estonia 175.5 kg PC). Even countries with lower GDP than Croatia (Bulgaria with 6,310 EUR PC and Romania with 8,320 EUR PC, compared with Croatia, which in 2017 had a GDP of 11,560 EUR PC) have recorded larger amounts of packaging waste generated per capita (Bulgaria 64 kg PC and Romania 72 kg PC) than Croatia.
Produced packaging waste and GDP per capita in 2017 (adapted from Eurostat [53])
Regarding the reported deposit refund system results, the Croatian DRS shows relatively high recovery rates (collection) of waste packaging, which in the last years range from 85% (in 2013 and 2017) to 93% (2014), or 89% in average (2013-2016). These return rates are still lower than return rates for the waste packaging in the deposit systems in some EU and EEA countries, such as Germany, Norway, Finland, which often reach 90 percent and more. The five best performing Member States with deposit schemes for PET bottles (Germany, Denmark, Finland, the Netherlands and Estonia) reached an average collection rate for PET of 94% in 2014 [7]. The highest achieved return rates were recorded in Germany, where 97% of waste packaging is returned (data for 2014), while the second was Norway with a return rate of 94%.
Although at the first glance it seems that these figures of 87% in 2016 (or 85% in 2017) of the collected packaging waste by the deposit system in Croatia do not leave much room for improvement, it can be misleading because the figures include only beverage packaging that is reported to the DRS operator, i.e. for which the corresponding fees have been paid. As previously stated, the Republic of Croatia officially reported the least quantities of packaging waste generation per capita in the EU. A similar situation is also with the officially reported quantities of beverage packaging in the deposit system which are placed on the market. However, it is assumed that the actual quantities of beverage packaging that are placed on the market of Croatia are substantially higher. Since there are no official data on these volumes, it was compared [50] to four well performing DRSs in EU/EEA countries (Norway, Finland, Sweden, Estonia). On the basis of the amounts of reported beverage packaging (covered by the deposit systems) placed on the market in each of the countries, divided by the total number of inhabitants of a given country, the amount of one-way beverage packaging per capita [units/capita] was obtained, which is shown in Figure 5. Glass packaging (even when it is in some countries' DRSs, it is not taken here (in this graph) into account, in order to compare the quantities in different countries with different system scope; e.g. deposit systems in Sweden and Norway do not include glass packaging, while in Croatia, Estonia and Finland it is included in DRS).
Amounts of packaging (excluding glass) put on the market per capita in 2016 [50]
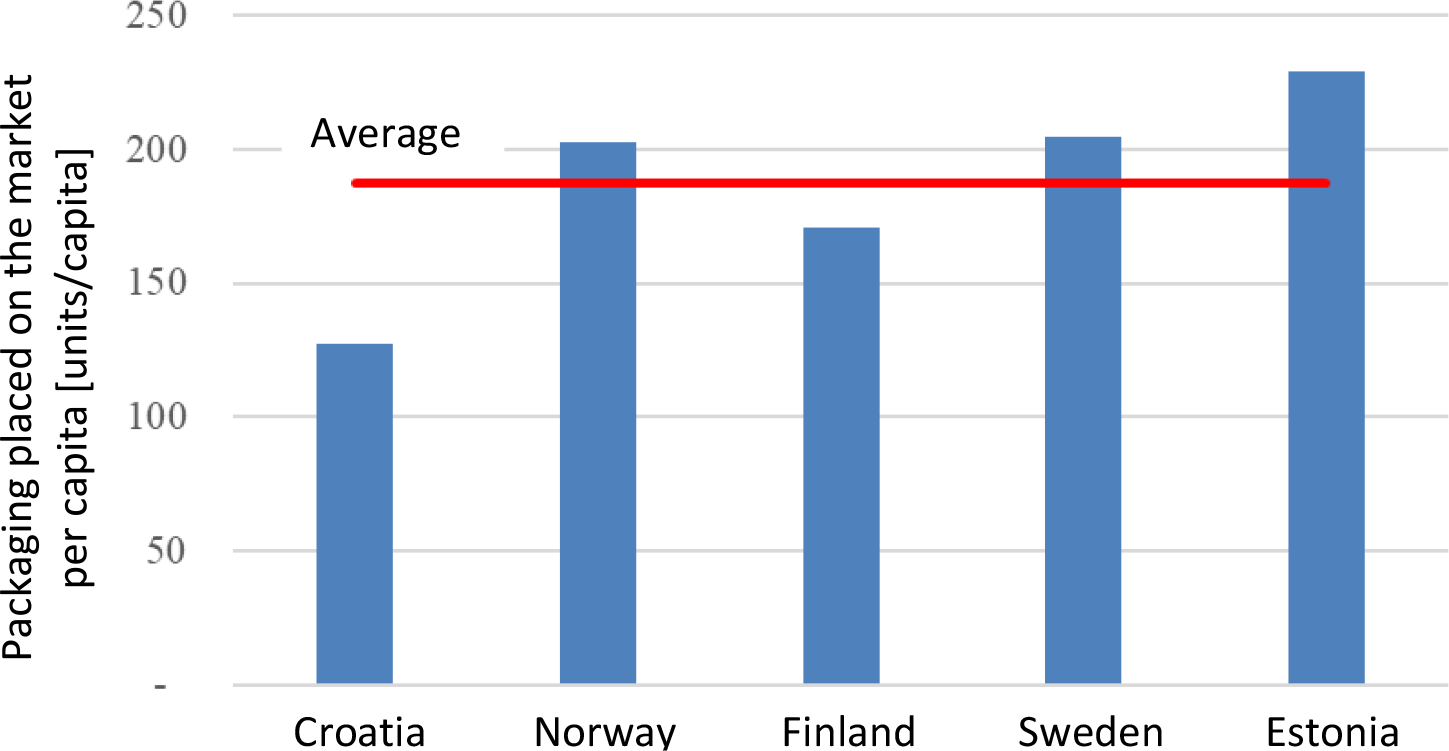
Compared with other countries, the amount of reported beverage packaging (covered by the deposit system) placed on the market in Croatia is considerably lower than in the other four countries. Even when compared with a country that has a similar GDP as Croatia (Estonia has 20% higher GDP per capita than Croatia), the amount of packaging significantly deviates. In Estonia, the amount of reported packaging (without glass) put on the market was 229 units PC and in Croatia only 128 units PC (also not including glass). When the deviation from the average of all five countries is observed (Croatia is also included in calculation of the average value), which is 187 units PC, it can be seen that the amount of one-way beverage (in the deposit system) per capita in Croatia is well below this average, namely 32% below this average. This assumption can be further substantiated by taking into account a large number of tourists that visit Croatia each season (around 17 million in 2017), which was not included in that previous calculation. From all this, it can be indirectly inferred that in the Republic of Croatia not all quantities of beverage packaging placed on the market are reported and registered in the system and in that respect, it is possible to improve the deposit system in Croatia, i.e. to make it more efficient and cost-effective. Some of the measures recommended in a previous study [50] are directed to identification of all payers in the DRS (introduction of "domestic" (national) EAN code along with "international" EAN codes), system control and monitoring (on-line clearing), improvement of transparency and system reporting, and other measures for improvement of the efficiency of the system, like increasing the share of automated acceptance via RVM, etc.
And lastly, it should be mentioned that the Croatian deposit refund system is unique in this sense, meaning governmental institution the Environmental Protection and Energy Efficiency Fund is at the same time the regulator and the implementing body, also the owner of the central DRS organization, as well as being in charge of its everyday management.
In this work, a hypothesis is laid out for zero cost of DRS system, and methodology given in the Methods section is used for case system definition and economic calculation. This is carried out on Croatian DRS, which regularly exhibited substantial costs of operation from its very establishment in 2006 [50]. Therefore, an extensive economic analysis of a deposit refund system in Croatia was conducted, in which the system was designed from beginning, not taking into account previous developments but considering most efficient system design elements. The financial model of Croatian DRS is presented taking into account current available data regards Croatian beverage market but disregarding current system setup. Such presumption allows that similar analysis can be applied at any given system/country, only with modifying input data and adapting to local conditions.
Three scenarios were examined, two evolutive ones in which the system is upgraded in near future, and a current suboptimal one taken as a starting point. But before one starts to analyse economic aspects of any DRS all the factors influencing investment in and efficient operation of a DRS, as they are identified in the Methods chapter, should be defined. All data are given on annual basis.
For modelling location specific economic data for valorisation of used space data from Central Bureau of Statistics [21] on average turnover per square meter of the store is used, as well as market data on price of monthly rent of business storage space [54], while labour costs are modelled based on the Trading Economics data [47].
As with any investment, it is important to clarify and understand some key details which should be prescribed. It is defined that DRS system encompasses plastic bottles, aluminium cans, steel cans and glass bottles for products like beer, water (carbonated and non-carbonated), soft drinks (carbonated and non-carbonated), juices and juice concentrates, wine, spirits, etc. As it is said, dairy products are usually not recommended, although the dairy products were part of Croatian DRS until 2015, after which they were excluded. They are considered again, and so dairy products are to be reintroduced in the Croatian DRS from 2020 [55]. Geographical particularity of Croatia includes areas of different population densities as well and around 700 islands of which 48 permanently inhabited and this presents a special problem for packaging collection and logistics. Regarding retailers' responsibility, stores with area under 300 m2 do not have to accept packages. Also, pronounced seasonality of tourism in Croatia needs to be emphasised as it presents an important issue.
Number of packages put to the market through the sales represents one of the most important factors for modelling DRS. Table 3 shows the estimated number of packages that enter the Croatian market. According to data [22], annual sales volume declared to Croatian DRS by producers is 620 million pieces. Free riding§ share cannot be clearly defined.
Size of the market [106 pcs] and packaging mix
| Sales period | Current (2017) [22] | After the change | 3–5 years after the change |
|---|---|---|---|
| PET | 403.0 | 523.9 | 550.1 |
| CAN* | 124.0 | 161.2 | 169.3 |
| OWG** | 93.0 | 120.9 | 126.9 |
| TOTAL | 620.0 | 806.0 | 846.3 |
CAN denotes here both aluminium and steel cans
OWG denotes one-way glass
If to rely on findings presented in [50], it was estimated that around 30% of the products was not registered at the time (estimation done for 2017). Based on that, it was assumed that producer declared sales will increase by 30% (very soon) after the changes based on recommendations in the previous study [43] are implemented, reaching 806 million units annually. It was also taken that in the next 35 years sales will increase additionally by approx. 5%, derived from the estimated economic growth. These two analysed scenarios are named "After the change" (immediate increase of registered packaging volumes for 30%) and "35 years after the change" (further increase of packaging volumes put to the market), starting from the present (2017) situation a suboptimal scenario named "Current".
The doubts shown in [50], about real market size, were justified with the fact that amount of generated (general) packaging waste per capita in Croatia (which was previously shown in Table 1) is the smallest in the EU and also very small compared to Lithuania and Estonia, which have similar GDP (Figure 4). In addition, the study [50] does not take into account tourists' visits compared to mentioned other countries, with Croatia having the largest number of tourists of the three (especially when compared to population of Croatia of 4.2 million inhabitants), which offers an additional justification to that hypothesis. Considering refillable packaging, DRS countries which have return systems for refillable packaging, have a system in which such packaging and its deposit value circulates directly between producer and retailer. Although refillable packaging is not managed by DRS organization, it still influences the DRS system, because the same infrastructure for their return is often used (RVMs). It was estimated [22] that the annual market in Croatia for refillable packaging is around 500 million packages, but nevertheless refillable packaging is not considered in this work (only one-way DRS packaging).
According to available data for 2017 [22], the collection amounts of Croatia in tons are given in Table 4.
Collection of packaging [22]
| Material | Collection [t/year] |
|---|---|
| PET | 16,000 |
| CAN | 1,500 |
| Glass | 30,000 |
If to use the average mass of packages, like PET ca 44 g, CAN ca 13.5 g, glass bottle ca 360 g, then it can be derived that the annual amount of packages collected in Croatia is 558 million packages (Table 5). In addition, the collection data after system change and 35 years after implementation of changes are calculated. The estimation is that after 35 years the market would transform into a clear and transparent one, which would motivate consumers to contribute more into environment and packages collection. An efficient DRSs packages return rate is usually between 8090%, therefore the presumption, that Croatian return rate will be 85%, was taken.
Collection of packaging [106 pcs/year]
| Material | Current (2017) [22] | After the change | 3–5 years after the change |
|---|---|---|---|
| PET | 362.7 | 362.7 | 467.6 |
| CAN | 111.6 | 111.6 | 143.9 |
| OWG | 83.7 | 83.7 | 107.9 |
| TOTAL | 558.0 | 558.0 | 719.4 |
Currently Croatian DRS has 97% of manual collection and only 3% is collected via RVM**. The most probable reason for such very low RVM share is mainly derived from the relatively low level of retail handling fee, which is paid per each package collected from consumer (Figure 1). Increase in the use of RVMs need to be motivated as the RVMs decrease DRS other operating costs.
Collection structure [%]
| Material | Current | After the change | 3–5 years after the change |
|---|---|---|---|
| Manual/RVM | Manual/RVM | Manual/RVM | |
| PET | 97/3 | 30/70 | 20/80 |
| CAN | 97/3 | 30/70 | 20/80 |
| OWG | 97/3 | 30/70 | 20/80 |
Table 6 shows current RVM share and the scenario after changes implementation. In addition, it was presumed that after 35 years RVM share will rise to 80%. RVM share in collection in some efficient and long experience DRSs is even 9095%.
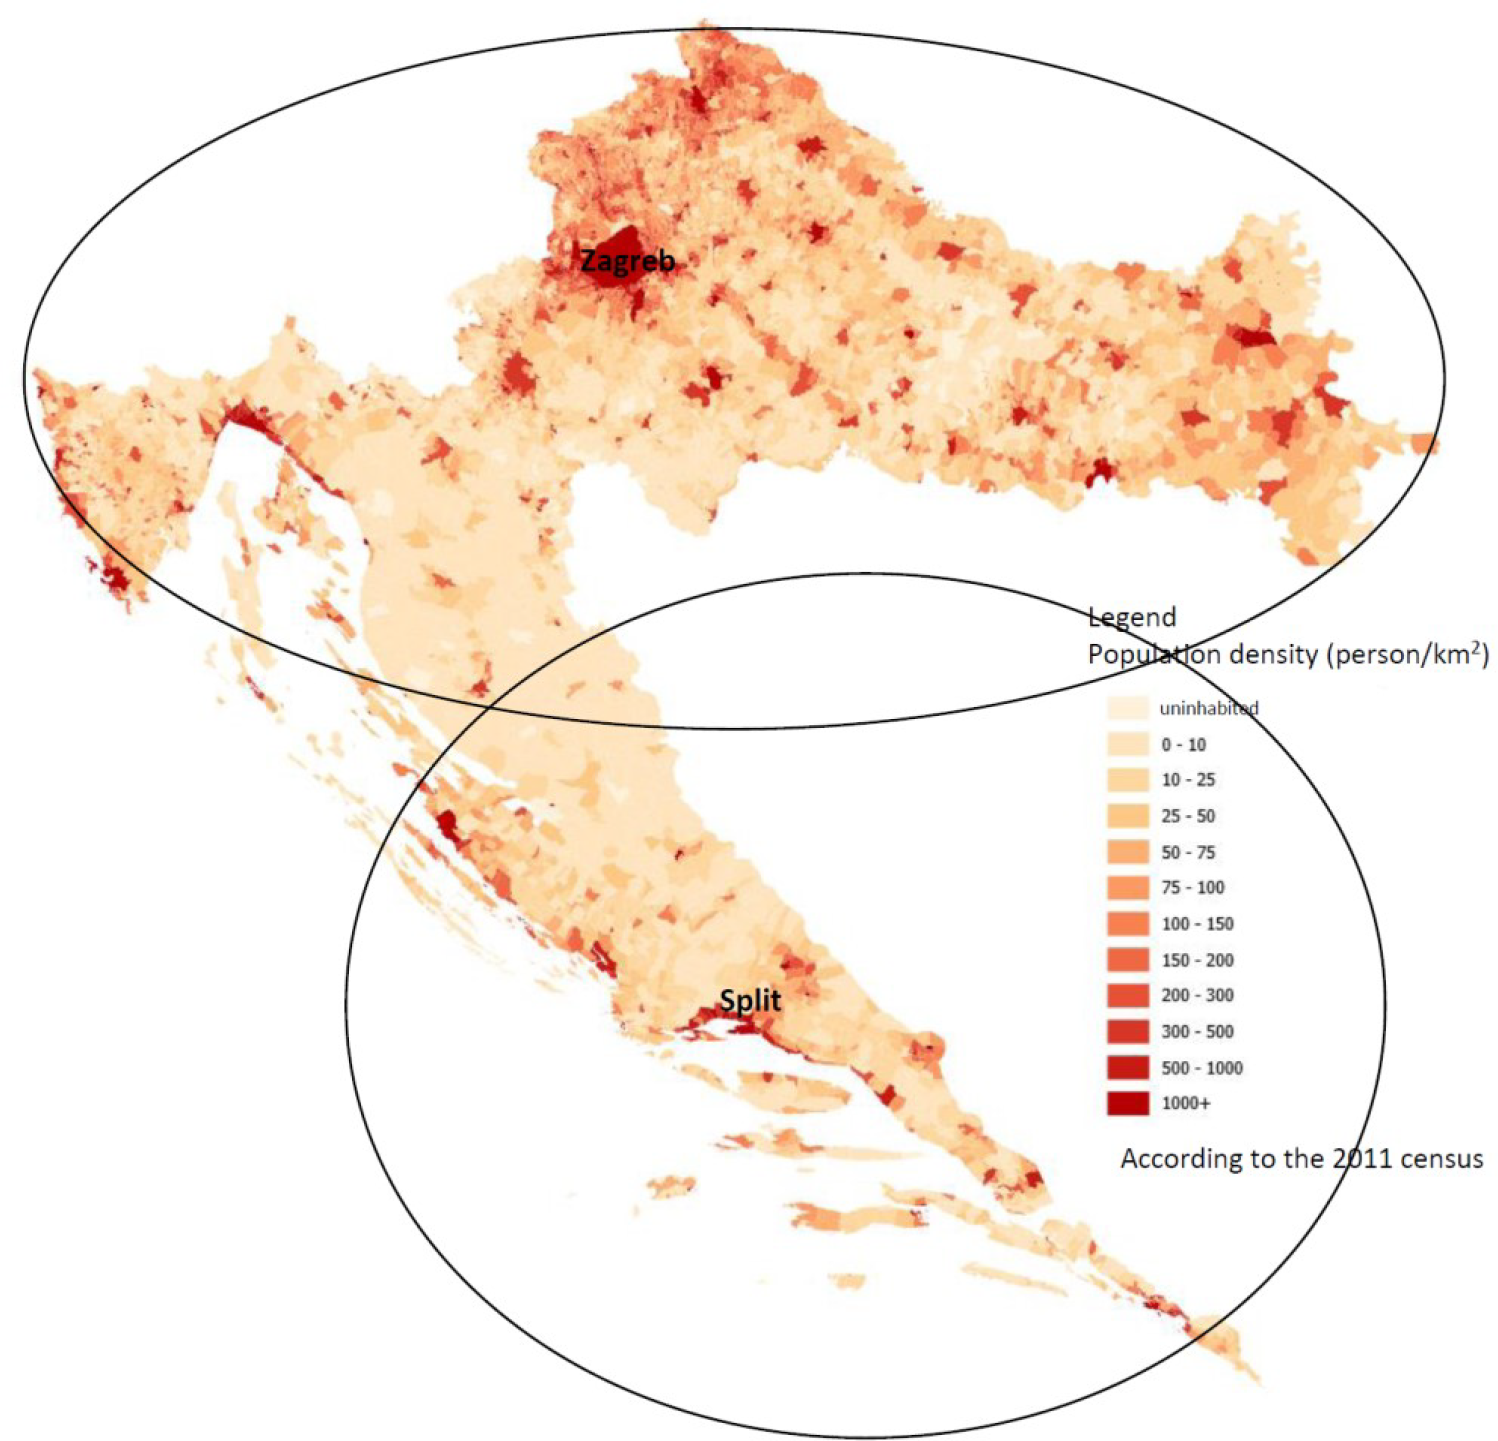
According to current distribution of collection of packaging in the Croatian deposit refund system (Figure 6) and considering the size, shape and distribution of population in Croatia, it was assessed that at least two handling centres are needed, one should be located around the city of Zagreb and another near the city of Split two biggest agglomeration areas (Figure 7).
Collection in Croatian deposit refund system, by counties [51]

Figure 7 depicts two influence areas of handling (counting/processing) centres covering accordingly 80% (Zagreb) and 20% (Split) of the population. But one must take into consideration tourism, that results in ca 65% of the packages being consumed and collected in the Zagreb area and ca 35% in the Split area.
Areas serviced by the proposed handling centres (adapted from [22])
Detailed overview of the packaging volumes processed by the handling centres is described in Table 7.
Annual quantity of packaging processed in the handling centres
| Material | Zagreb | 65% | Split | 35% | ||||
|---|---|---|---|---|---|---|---|---|
| After the change | 3–5 years after the change | After the change | 3–5 years after the change | |||||
| [106 units] | [t] | [106 units] | [t] | [106 units] | [t] | [106 units] | [t] | |
| PET | 235.8 | 10,400 | 303.9 | 13,407 | 126.9 | 5,600 | 163.6 | 7,219 |
| CAN | 72.5 | 975 | 93.5 | 1,257 | 39.1 | 525 | 50.4 | 677 |
| Glass | 54.4 | 19,500 | 70.2 | 25,139 | 29.3 | 10,500 | 37.8 | 13,536 |
| TOTAL | 362.7 | 30,875 | 467.6 | 39,803 | 195.3 | 16,625 | 251.8 | 21,432 |
This analysis assumes that both centres will receive packaging from surrounding areas on equal basis, i.e. the amount of manually accepted packages and volume of glass bottles is similar in both centres. Thus, the investments into both centres include industrial counting machines that count manually accepted packages and glass bottles, compactors, sorting and baling lines and other necessary machinery and equipment. Additionally, it is taken into account that the DRS central office is in Zagreb handling (counting/processing) centre, meaning an administrative unit with IT system. Pursuant to this, the planned investment into the two handling centres would be around 7.17 million EUR (net value). It is important to point out, that according to this projection, the handling centre facilities will be rented. It is also important to note, that beverage products consumption and collection is very seasonal, and sales volumes differences between low season (winter) and high season (summer) may be double. The biggest investments in both handling (recycling) centres are industrial counting machines in amount of ~2.3 million EUR, sorting lines ~1.9 million EUR, balers ~1.8 million EUR, IT system (including software and hardware) ~0.4 million EUR, other equipment (including office and other handling centres equipment) and setup cost ~0.77 million EUR.
The retailers are obliged to invest into the deposit system infrastructure, including package return rooms and the RVMs, which then should be compensated over time trough DRS operation. Taking into account previously defined average number of RVMs per inhabitants it was calculated that ca 1100 RVMs are needed to install in Croatia to reach situation where 80% of packages are collected with RVMs. Overall initial investment by the retailers into the package recycling system is calculated on the basis of previously defined costs and ranges between 3040 million EUR (without VAT).
In this chapter an operating costs structure and system overview are given. The system is optimized to run on a non-profit basis where the difference in costs and revenues of DRS is covered according to Producer Responsibility Principle by producers/importers of the beverage packaging.
As it is defined, retail handling fee (RHF) should cover previously estimated investment costs of the retailers as well as operating costs of the stores arising from the collection of packaging (included in the deposit system) returned by the consumers and their delivery to the DRS [22]. As there are two different approaches to packaging collections, they are separately analysed.
As it is previously said, investment in RVM makes sense if volume of returned packages with deposit marking per month crosses 10,000 packages, and optimum return of a regular, medium size and full compacting (PET/CAN) RVM is on average ca 50,000 packages per month. Previously defined range of fees associated with automated acceptance of packaging (via RVM) for the retailers goes between 1.74.0 cents EUR per package. Since the compensation paid to the retailers is the largest cost for DRS, it should be carefully agreed with retailers according to concrete and fair terms. This calculation takes the average RVM (automated) RHF of 2.13 cents EUR per package (the same for all types of packaging materials).
Manual collection is a logical choice for retailers if the volume of accepted packages is less than 10,000 per month, since is economically unreasonable to install an RVM. It is up to the store to decide, but in such case the RHF paid by the DRS will not completely cover the costs related to accepting the packages. Depending on the legislation to be provided, small stores near each other can cooperate and install a common RVM together, which would have an optimum packaging volume per month and the deposit receipts issued by the RVM could be used in the stores that have joined the agreement.
When the packages are collected manually, there are following costs that should be included: labour costs, cost of the space (rooms) and utilities. The calculation for Croatian DRS considers the average fee for manual reception of packages to be 0.53 cents EUR per package.
More detailed overview is provided in Table 8 (considering that the RVM ratio is 70% after the change and 80% 35 years after that).
Retail handling fee costs [106 EUR/year]
| Material | After the change | 3–5 years after the change | ||
|---|---|---|---|---|
| Manual | RVM | Manual | RVM | |
| PET | 0.58 | 5.42 | 0.50 | 7.98 |
| CAN (Al, Fe) | 0.18 | 1.67 | 0.15 | 2.46 |
| Glass (OWG) | 0.13 | 1.25 | 0.12 | 1.84 |
| TOTAL | 0.89 | 8.34 | 0.77 | 12.28 |
| Grand TOTAL | 9.23 | 13.05 | ||
Cost of transportation and logistics incorporates costs of accepting the packages (from the packaging storage in stores), costs of loading the transport packaging, costs related to transfer stations (if these are used), all up to the point the transported packaging reaches the handling centre/recycling plant (for glass). That cost is calculated with the assumption that in (immediate) "after the change" scenario, the share of automated (RVM) acceptance is 70%, while that share increases to 80% in "35 years after the change" scenario. Another assumption is introduced that all RVM-accepted packages are compacted (apart from glass packaging). Unloading of the packaging in the handling/counting centre/recycling plant is not incorporated into transportation/logistics cost but into the handling centre/recycling plant costs. The calculated transportation and logistics costs, along with the cost of transport packaging, totals to 8.3 million EUR. Although the collection of packaging is expected to grow 29% in 35 years, logistics costs will remain practically on the same level, because RVM and therefore compacted packages share will increase by 10% point, from 70% to 80% (Table 9).
Total logistics costs including transport packaging [106 EUR/year]
| Material | After the change | 3–5 years after the change |
|---|---|---|
| PET | 2.54 | 2.89 |
| CAN | 0.22 | 0.24 |
| OWG | 5.43 | 5.15 |
| TOTAL | 8.19 | 8.28 |
As presented, it is possible to reduce costs of transportation and logistics by introducing different solutions, like crushing glass packages in RVMs (on site at the store), as well as implementing advanced IT solutions. The logistics can be optimized using IT solution that helps to track and process information on the number of packages being accepted on different reception points (stores), so that the logistics company and the carriers could know when to go the stores to pick up the packages and how many transport packages will be waiting to be collected at the different stores. That would be necessary information both for collection rounds and for optimum use of storage space [45].
Already compacted packaging (collected via RVMs having compacting ability) is further compressed by industrial presses into large cubes, and then sold to material recycling plants. When using non-compacting RVMs, from Horeca sector of manual collection, empty containers need to be once again counted by using industrial RVM. All of this is done in handling centres. Based on counting/processing data from handling centre, and data obtained from RVMs, the value of deposit and RHF paid to the respective retailer is defined.
The central DRS operator often has a decision to make, that is, whether to manage the handling centre operations itself or to outsource these services to a private sector operator. In many countries, such as Estonia, Lithuania, Norway and Sweden, some components of counting/processing operations are operated by the DRS operator, while others are outsourced (e.g. compaction centres, where only compacted material collected via RVM is directed). Other countries such as Finland have outsourced 100% of handling centre services. Nevertheless, it is convenient to manage one's own handling centre from the beginning in order to minimize costs. While the DRS organisation is a non-profit company, a third-party service provider would probably add a profit margin to its service.
Another important issue is to estimate the number of needed counting/processing centres. Apart from the number of inhabitants, significant factors include population density, level of tourism, and geography (e.g. number of small islands and their inhabitants). In order to keep the logistics costs acceptable, a counting/processing centre should have a range of around 150250 km radius [22]. Considering such range and the size of Croatia and its population density, it has been estimated that it is optimal to have two such centres, as mentioned earlier, one in the Zagreb region and the other near Split (Figure 4).
Considering previously defined most relevant costs of handling centres, more detailed estimation of overall costs is shown in Table 10.
Estimated annual costs of two handling (counting/processing) centres [106 EUR/year]
| Cost item | After the change | 3–5 years after the change |
|---|---|---|
| Total* | 4.65 | 5.52 |
| Rental | 0.58 | 0.58 |
| Operating cost | 0.62 | 0.80 |
| Production labour cost | 2.39 | 3.08 |
Excluding costs related to administration. Without VAT.
Administration costs encompass all main central administration and include labour, IT infrastructure, promotion and communication, office rent, and general administrative costs.
Considering the sheer quantity of packaging that is put to the market (0.81 billion units and 0.85 billion pcs in 35 years) and the value of deposits paid (0.50 HRK or 6.7 cents EUR), the annual income of the company is calculated to be between 5356 million EUR. Therefore, as previously said in the methodology chapter, the security and system accountability are of the utmost importance for the efficient functioning of DRS.
Taking that in count, as well as previously defined costs dependencies, the costs of annual administration are calculated to be 1.06 million EUR (including office rent and office related costs, labour cost, IT operating and marketing costs).
Overall system revenues are defined as a sum of main income streams of the DRS:
Revenue from unredeemed deposit [106 EUR/year]
| Unredeemed deposit | After the change | 3–5 years after the change |
|---|---|---|
| PET | 10.75 | 5.50 |
| CAN | 3.31 | 1.69 |
| OWG | 2.48 | 1.27 |
| TOTAL | 16.54 | 8.46 |
Amount of collected material [t/year]
| Material | After the change | 3–5 years after the change |
|---|---|---|
| PET | 16,000 | 20,627 |
| CAN | 1,500 | 1,934 |
| OWG | 30,000 | 38,675 |
| TOTAL | 47,500 | 61,236 |
The market value of different materials varies depending on demand and a number of other factors which are mainly accounted in market indicators. Not all materials sale generate net income, for instance, it can be seen that, aluminium and clear polymer sales usually cover the overall processing costs while on the other end, glass do not. By using market data for secondary materials and quantity of collected materials, total sales revenue is estimated to range between 7.8 and 10.1 million EUR. The estimated revenues by material type are presented in Table 13.
Revenue from sale of materials [106 EUR/year]
| Material | After the change | 3–5 years after the change |
|---|---|---|
| PET | 5.82 | 7.51 |
| CAN | 1.67 | 2.19 |
| Glass | 0.30 | 0.39 |
| TOTAL | 7.79 | 10.09 |
Operating costs and incomes of DRS are presented in Table 14. The overall goal in this work was to optimize the DRS to reach a zero (net) profit, considering a non-profit principle of DRS organizations and as lowest possible cost for the industry (producers). This is done by calculating minimal needed industry/administrative fee to satisfy equality defined by Equation 1.
Calculated annual total costs of DRS and cost per package put to the market
| Cost item* | After the change | 3–5 years after the change | |||
|---|---|---|---|---|---|
| Total cost [106 EUR] | Cost per sold piece [EUR] | Total cost [106 EUR] | Cost per sold piece [EUR] | ||
| Retail handling fee (RHF) | -9.2 | -0.0114 | -13.0 | -0.0154 | Expenditures |
| Transport and logistics costs (TLC) | -8.2 | -0.0102 | -8.3 | -0.0098 | |
| Handling centres costs (HCC) | -4.7 | -0.0058 | -5.5 | -0.0065 | |
| Central administration costs (CAC) | -1.1 | -0.0013 | -1.1 | -0.0013 | |
| Unredeemed deposit (UD) | 16.5 | 0.0205 | 8.5 | 0.0100 | Incomes |
| Material sales (MS) | 7.8 | 0.0097 | 10.1 | 0.0119 | |
| Industry/administrative fee (IAF) | -1.2 | -0.0015 | 9.4 | 0.0111 | |
| Net result | 0.0 | 0.0000 | 0.0 | 0.0000 | |
Negative value means that producers/industry do not have to pay any administrative fee because of unredeemed deposit and income from material sales will cover all expenditures.
As it can be seen from Table 14, the largest cost is the cost of compensating the retailers (through retail handling fee). The second largest is cost of transportation and logistics. Therefore, it is of utter importance to make such an agreement with the retailers, that the compensation in a form of RHF for the collection of packaging with deposit markings is determined on the basis of direct costs of most effective sample stores. Furthermore, additional savings in increasing the efficiency of transport and logistics can be accomplish, which would reduce the total cost of the handling (counting/processing) centres and the initial investment.
In terms of the system revenues, the value of deposits which are not redeemed represents the largest source of income (at least in the first phase of the system change). That revenue will depend on the return rate, because, if the return rate is growing, the revenue from unredeemed deposits is decreasing.
Summarizing all the costs and revenues of deposit refund system, in the scenario "after the change" (with implemented recommendations and changes of the DRS, when the return rate is ~69%) the system generates profit in amount of 1.2 million EUR and will have a shortfall of 9.4 million EUR in the scenario "35 years after the change" (when the average return rate increases to 85%), which means that the average producer/administrative fee can be 0 cents EUR and 1.11 cents EUR per package respectively.
This short sensitivity analysis considers situation when some of the main parameters which affect costs of DRS or revenues change. In all cases, the "35 years after the change" has been taken as a basis and if the referred factor should change, then all other indicators remain the same. The main purpose of the sensitivity analysis is to observe, what will happen with the industry (producer/administrative) fee if one relevant cost or income should change. Most observed instances deal with some cost type increasing, but similar positive effect to industry fee is achieved if some cost type should reduce. Following is the influence of key factors in terms of DRS functioning:
In addition to the industry/administrative fees, producers may have additional indirect costs, the most relevant of which are described below. These costs will vary depending on the size and types of products they put on the market:
A deposit refund system is generally accepted as an efficient scheme for packaging waste collection and recycling entailing high environmental benefits, but if not organized and managed properly it could exhibit high costs that could jeopardize its economic viability. Therefore, the main research question put in this work was how to make such systems economically sustainable or even self-sufficient, and if that is even possible taking into account a complexity, interdependency of the subjects, and the costs generated in each stage of the DRS. Additional question was if the cost of packaging waste management in the DRS that mainly burdens the industry (producers, importers) can be minimized, but still enabling the system to operate, even on non-profit grounds. What is also known, is that the deposit refund system will always entail spending for one of the market actors, most often the industry, or in other cases government and indirectly taxpayers.
In this research, an extensive overview of economic drivers, driving both system costs and incomes, is given. This overview shows the complexity of DRS and what needs to be looked upon by the decision makers when considering the implementation of such a system. On the basis of this overview, system modelling, based on the premise of positive zero cash flow operation of the system, is conducted and its implementation on the case study country is shown. A deposit refund system of the case study country the case study of Croatia, is modelled with a goal of showing how such a system can be organized. In doing so, the DRS was designed from the beginning, not taking into account previous developments but considering most efficient system design elements. The financial model of Croatian DRS was presented considering current available data regards Croatian beverage market but disregarding current system setup. Such presumption allowed that similar analyses can be applied at any given system/country, only with modifying input data and adapting to local conditions. Three scenarios were examined, two evolutive ones in which the system is upgraded in near future, and a current suboptimal one taken as a starting point.
Implementation of DRS in Croatia is more challenging because of its geographic characteristics (elongated, long and narrow crescent-shaped, with two more densely populated regions separated by a mountainous area and a very indented coast with many islands) as well as influence of tourism (large difference in population distribution and beverage consumption/waste packaging production between seasons). Thus, the work presented can serve decision-makers in other countries and regions which do not have yet implemented such systems but are discussing that possibility, especially the systems with similar peculiarities.
Taking into account the current situation in Croatia, where one-way packaging made of plastic, metal and glass is included in the DRS, and regarding the new scenario in which "free riding" packages is included in the DRS (packages, which deposit is currently not paid and their share is about 30% (estimation in 2017)), then it can be concluded that market share is 806 million packages, which will again grow within the next 35 years by 5% due to economic growth (reaching in total 846 million packages).
With the current value of deposit of 0.50 HRK per package, which is 0.066 EUR, and a market volume of 806 million packages that will be declared after the system change, the number of returned packages will be the same, but derived from the increase of market volume, return rate will decrease to 69%. Also, a market volume will increase up to 846 million packages in 35 years and return rate will increase up to 85%, similar to other countries with efficient DRS.
Comparing all the system costs, the biggest cost is the cost of compensating the retailers, and the second largest is the cost of transportation and logistics. Therefore, it is very important to make such an agreement with the retailers, that the compensation (retail handling fee) for the collection of packaging with deposit markings is calculated on the basis of direct costs of most effective sample stores. Besides that, additional savings can be achieved in increasing the efficiency of transportation and logistics, which would reduce the total cost of the handling (counting/processing) centres and the initial investment.
In terms of the system revenues, the value of deposits which are not redeemed represents the largest source of income (at least in the first phase of the system change). This revenue depends on the return rate, and so, if the return rate is growing, the revenue from unredeemed deposits is decreasing. The second source of revenue is sale of collected packaging material, but that income can vary a lot depending on the current market price of material.
Summarizing all the costs and revenues of the deposit refund system, and retaining a non-profit principle of DRS, it was calculated that the average administrative (producer) fee should be 1.11 cents EUR per package (with the return rate of 85%) for the DRS to be able to operate on the zero net result. This administrative fee could be even lower if all the different possibilities and measures described in this paper and earlier studies of the authors [43] and [50] are to be implemented.
To conclude, it can be said that the deposit refund system, as a form of extended producer responsibility principle, is a well thought market-based instrument to address externalities. At the same time, due to the flexibility and economic stimulation of deposit, it can effectively recover the environmental pollution that is difficult to regulate, such as illegal waste disposal, which was heavily present in Croatia prior to introduction of DRS in 2006. Also, it can be said that it is the deposit, not the value of the material from which the packaging is made, the reason why packaging in the deposit system is separately so successfully collected.
This work has been fully supported by the Reloop Platform and supported in part by Croatian Science Foundation under the project Neoplast (IP-2018-01-3200).
- , , SOER 2010 Material resources and waste - 2012 update, 2012
- , 2020, http://ec.europa.eu/eurostat
- , , Directive (EU) 2015/596 of the European Parliament and of the Council of 2 December 2015 amending Directive 94/62/EC on packaging and packaging waste, 2015
- , 2018, http://www.europarl.europa.eu/RegData/etudes/BRIE/2018/625108/EPRS_BRI(2018)625108_EN.pdf
- , , Directive (EU) 2018/852 of the European Parliament and of the Council of 30 May 2018 amending Directive 94/62/EC on packaging and packaging waste, 2018
- Reuse and Recycling Systems for Selected Beverage Packaging from a Sustainability Perspective, 2011, http://www.duh.de/fileadmin/user_upload/download/Projektinformation/Kreislaufwirtschaft/PwC-Study_reading_version.pdf
- , 2018, http://ec.europa.eu/environment/circular-economy/pdf/plastics-strategy-brochure.pdf
- , , Directive (EU) 2019/904 of the European Parliament and of the Council of 5 June 2019 on the reduction of the impact of certain plastic products on the environment, 2019
- , 2020, https://www.zerowastescotland.org.uk/sites/default/files/DRS Case Study - Sweden FINAL.pdf
- , 2016, https://www.cmconsultinginc.com/wp-content/uploads/2017/05/BOOK-Deposit-Global-24May2017-for-Website.pdf
- , https://www2.deloitte.com/content/dam/Deloitte/pl/Documents/Brochures/pl_DRS_Brochure_Deloitte.pdf
- ,
Environmental impact assessment of the implementation of a Deposit-Refund System for packaging waste in Spain: A solution or an additional problem? ,Sci. Total Environ. , Vol. 721 ,pp 137744 , 2020, https://doi.org/https://doi.org/10.1016/j.scitotenv.2020.137744, Jun. - ,
Municipal solid waste prevention: A review of market-based instruments in six European Union countries ,Waste Manag. Res. , Vol. 38 (1_suppl),pp 322 , 2020, https://doi.org/https://doi.org/10.1177/0734242X19894622, May - ,
Effectiveness of deposit-refund systems for household waste in the Netherlands: Applying a partial equilibrium model ,J. Environ. Manage. , Vol. 232 ,pp 842850 , 2019, https://doi.org/https://doi.org/10.1016/j.jenvman.2018.11.102, Feb. - , https://www.polimerica.it/articolo.asp?id=18722
- Rotterdam, 2011, https://ec.europa.eu/environment/enveco/mbi/pdf/studies/role_marketbased.pdf
- ,
Review of extended producer responsibility: A case study approach ,Waste Manag. Res. , Vol. 33 (7),pp 595611 , 2015, https://doi.org/https://doi.org/10.1177/0734242X15592275, Jul. - ,
A systematic review of the deposit-refund system for beverage packaging: Operating mode, key parameter and development trend ,J. Clean. Prod. , Vol. 251 ,pp 119660 , 2020, https://doi.org/https://doi.org/10.1016/j.jclepro.2019.119660, Apr. - ,
An overview of the problems posed by plastic products and the role of extended producer responsibility in Europe ,J. Clean. Prod. , Vol. 214 ,pp 550558 , 2019, https://doi.org/https://doi.org/10.1016/j.jclepro.2018.12.256, Mar. - ,
Extended producer responsibility: a differential fee model for promoting sustainable packaging ,J. Clean. Prod. , Vol. 108 ,pp 343353 , 2015, https://doi.org/https://doi.org/10.1016/j.jclepro.2015.07.084, Dec. - ,
Deposit-Refund Systems in Practice and Theory ,Encyclopedia of Energy, Natural Resource, and Environmental Economics , Vol. 3 ,pp 133137 , 2013 - ,
Croatian deposit return system model change recommendations (Technical report) ,Tallin , 2018 - ,
From flow to stock. New circular business models for integrated systems: A case study on reusable plastic cups ,Procedia Environ. Sci. Eng. Manag. , Vol. 6 (1),pp 8194 , 2019 - ,
What factors determine attitudes towards the implementation of a packaging deposit and refund system? A qualitative study of the perception of Spanish consumers ,J. Environ. Manage. , Vol. 270 , 2020, https://doi.org/https://doi.org/10.1016/j.jenvman.2020.110891 - ,
Performance simulation and policy optimization of waste polyethylene terephthalate bottle recycling system in China ,Resour. Conserv. Recycl. , Vol. 162 ,pp 105014 , 2020, https://doi.org/https://doi.org/10.1016/j.resconrec.2020.105014, Nov. - ,
Economic analysis of depositrefund systems with measures for mitigating negative impacts on suppliers ,Resour. Conserv. Recycl. , Vol. 53 (4),pp 199207 , 2009, https://doi.org/https://doi.org/10.1016/j.resconrec.2008.11.008, Feb. - ,
Deposit-refund system vs. compliance scheme membership: How to comply with producer responsibility regulations? ,Int. J. Prod. Econ. , Vol. 162 ,pp 2544 , 2015, https://doi.org/https://doi.org/10.1016/j.ijpe.2014.12.027, Apr. - ,
, Analysis of sustainability aspects of the packaging deposit-refund system in Latvia ,pp 729740 , 2013, https://doi.org/https://doi.org/10.2495/SDP130611, May - ,
Evaluation of economic aspects of the deposit?refund system for packaging in Latvia ,Manag. Environ. Qual. An Int. J. , Vol. 24 (3),pp 311329 , 2013, https://doi.org/https://doi.org/10.1108/14777831311322631, Apr. - , , Deposit Refund System for Beverage Containers in Latvia: Learnings within the Baltic States, 2019
- ,
Analysis and Economic Evaluation of Deposit Refund System (in Latvian) ,Soc. Integr. Educ. Proc. Int. Sci. Conf. , Vol. 6 ,pp 17 , 2019, https://doi.org/https://doi.org/10.17770/sie2019vol6.3823 - , , A review of the German mandatory deposit for one-way drinks packaging and drinks packaging taxes in Europe, 2008
- ,
Optimal design of depositrefund systems considering allocation of unredeemed deposits ,Environ. Econ. Policy Stud. , Vol. 13 (4),pp 303321 , 2011, https://doi.org/https://doi.org/10.1007/s10018-011-0018-y, Dec. - ,
Policy mix in deposit-refund systems - From schemes in Finland and Norway ,Waste Manag. , Vol. 52 ,pp 12 , 2016, https://doi.org/https://doi.org/10.1016/j.wasman.2016.05.003 - , 2018, https://www.minzp.sk/files/iep/real_price_of_deposit.pdf
- ,
Deposits on single use containers - A social cost-benefit analysis of the Danish deposit system for single use drink containers ,Waste Manag. Res. , Vol. 22 (6),pp 477487 , 2004, https://doi.org/https://doi.org/10.1177/0734242X04049252 - ,
A cost-benefit analysis of a deposit-refund program for beverage containers in Israel ,Waste Manag. , Vol. 30 (2),pp 338345 , 2010, https://doi.org/https://doi.org/10.1016/j.wasman.2009.09.026 - ,
Management of aluminium packaging waste in selected European countries ,Waste Manag. Res. J. a Sustain. Circ. Econ. , Vol. 37 (4),pp 357364 , 2019, https://doi.org/https://doi.org/10.1177/0734242X19832368, Apr. - , 2018, https://feve.org/wp-content/uploads/2018/11/FINAL-Raise-the-Glass-Study-FULL.pdf
- ,
Waste to energy plant operation under the influence of market and legislation conditioned changes ,Energy , Vol. 137 ,pp 11191129 , 2017, https://doi.org/https://doi.org/10.1016/j.energy.2017.04.080, Apr. - ,
Circular economy in waste management Socio-economic effect of changes in waste management system structure ,J. Environ. Manage. , Vol. 267 , 2020, https://doi.org/https://doi.org/10.1016/j.jenvman.2020.110564 - ,
Influence of legislative conditioned changes in waste management on economic viability of MSW-fuelled district heating system: Case study ,Therm. Sci. , Vol. 20 (4),pp 11051120 , 2016, https://doi.org/https://doi.org/10.2298/TSCI160212114T - , , Recommendations for improvement of Croatian deposit return system (Technical report), 2018
- , 2020, http://www.eunomia.co.uk/wp-content/uploads/2015/05/ZWS-DRS-Report_APPENDIX_Final.pdf
- , , Deposit return systems for beverage containers in the Baltic states (Technical report), 2019
- , , Deposit return systems for beverage containers in the Baltic states, 2019
- , https://tradingeconomics.com/croatia/wages
- , 2019, https://www.euwid.de
- , 2019, https://www.letsrecycle.com
- , , Analysis of deposit-based packaging waste management system in the Republic of Croatia (Technical report) (in Croatian), 2017
- , 2018, https://ec.europa.eu/eurostat/databrowser/view/sdg_11_60/default/table?lang=en
- , , Report on packaging waste management (in Croatian), 2018
- , 2020, https://appsso.eurostat.ec.europa.eu/nui/submitViewTableAction.do
- , 2018, https://www.jutarnji.hr/domidizajn/interijeri/poslovni-prostori-u-hrvatskoj-split-medu-skupljima-pula-povoljna-7004265
- , 2020, https://narodne-novine.nn.hr/clanci/sluzbeni/2020_01_7_93.html