


Following the Millennium Summit of the United Nations in the year 2000, all United Nations member states and several international organizations committed to achieve 8 international development goals by 2015, the so-called “Millennium Development Goals” (MDGs). These goals were set in order to make progress in development in the global south. The first MDG mentioned desired progress in eradicating extreme poverty and hunger [1]. By 2015, the number of people who lived on less than $1.25 per day has declined by more than half compared to 1990, but still 836 million people were affected by extreme poverty [2]. Therefore, it remained a major global challenge to further reduce poverty. In 2015, the Sustainable Development Goals (SDGs) were brought out as a new set of development goals with a time period from 2015 to 2030 and with a validity for the global south and the global north alike. The first goal of the SDGs still concerns to “end poverty in all forms everywhere” [3]. Access to clean and affordable energy contributes to achieve this goal.
The correlation between per capita energy consumption and human development has been studied and it was confirmed that the availability of energy is a requirement for economic development [4], for cultural and social development [5], and for human development in general [6]. The correlation grows weaker with an increasing living standard, also known as “saturation” [7] or “plateau” [8], however the correlation isindisputable at low living standards [5], [6]. Consequently, providing “access to clean and affordable energy” to all people is included as a stand-alone goal through SDG 7, while there are a total of 17 SDGs encompassing all areas of human life [9].
Various articles point out causal relationships between making progress under SDG 7 and positive contributions to the other 16 SDGs. The UN agency Sustainable Energy for All [10] acknowledges the significant contribution of energy to improve the quality of life of affected people and it spurs project implementations. The number and the variety of energy projects in the global south increases with the objective to reap the benefits as holistic as possible. This is when a holistic impact assessment of such projects is required to design projects as optimal and impactful as possible.
Methods and frameworks to assess project performance grow in number, however, they mostly outline the inputs and the outputs of a certain project and only partly capture the outcomes on the target group level and the impact on the societal or regional level. This is misleading since the outcomes and the impacts are actually the units of measurement that should be looked at. It is the outcomes and the impacts that allow to assess the impacts of a certain project. The paper hereby refers to the terminology of inputs, outputs, outcomes and impacts as per the logical framework theory. This theory also is the basis for the SDG design.
Inputs are the financial, human and material resources that go into a project for its execution.
Outputs are the services and products produced by a project.
Outcomes are the project's effects at the target-group level.
Impacts are project's effects at the societal or regional level.
In addition, the majority of frameworks stems from the time before the existence of the SDGs and they are mostly tailored to a specific type of project, i.e. rural electrification projects. The intention of the present analysis is to provide the foundation for a universal and holistic assessment framework which is capable of capturing the impact of access-to-energy implementations across the entire array of sustainability criteria. Therefore, it is shown how to select, weight and use the SDG indicators for this purpose.
The structure of this article is as follows: Section 1.1 provides a review of assessment frameworks on access-to-energy projects. A review of the literature on interlinkages between SDG 7 and other SDGs was carried out in section 1.2. Section 2 presents the method to get to the relevant and to the measurable SDG indicators for access-to-energy projects. The resulting indicators are listed and described in section 3. Findings are discussed and prospective research is indicated before we conclude with a summary in the last chapter of this article.
This chapter gives an overview of existing frameworks for access-to-energy projects (subsection 1.1) and on interlinkages between access to energy – in terms of SDG 7 – and other SDGs (subsection 1.2).
Assessment frameworks for access-to-energy projects are used to focus on rural electrification projects in developing countries. A common feature of the frameworks is that they feed indicators from the common thematic areas of ecology, economy, technology, society and institutions. The resulting indicators can either be quantitatively or qualitatively assessed. In some cases surveys provide data as evidence and in other cases persons report perceived changes. Both approaches aim to rank project activities or energy technologies.
A fundamental and widely used assessment framework was developed by Elisabeth Ilskog [11] in 2008. Elisabeth Ilskog defined 39 indicators out of the areas “technical”, “economic”, “social/ethical”, “environmental” and “institutional” sustainability and thereby presented an improved and standardized assessment of electrification projects. The indicators were developed following previous work of the International Atomic Energy Agency and under the MDGs, including both quantitative and qualitative indicators. The scoring is done in a range from one to seven for each indicator and an aggregated result is reached by averaging the scores [11]. In the following work, the author sharpened and modified the indicators slightly by applying the framework to seven rural electrification projects [12].
Detached from Ilskog´s work, Brent and Rogers [13] in 2010 developed a model to apply a sustainability assessment suited to one specific electrification project in Southern Africa. Similar to the prior author, Brent and Rogers defined indicators along the dimensions “economics”, “sociology”, “ecosystem sustainability”, “institutional governance” and the “physics and chemistry of energy conversion processes”, the latter to be a specific approach to describe technical findings. The initial 20 indicators were developed in accordance with the MDGs, and they were additionally sharpened along recommendations of the Brundtland Report [14] and the Stern Review [15]. Subsequently, the authors applied their model to a project to generate additional useful indicators [13].
In contrast to the frameworks mentioned above, Susanto and Smits in 2010 [16] did not aim to develop an assessment framework for electrification projects, but to compare various energy technologies for the off-grid electrification in the Lao People´s Democratic Republic. The authors reduced Ilskog´s framework to the dimensions of “technology” and “economic development”, and modified the indicators for scoring of “low”, “medium” and “high”. The outcomes of their study illustrate how technological complexities and local capacity play a role in the adoption of renewable energy technologies [16].
In 2012 Ferrer-Martí et al. [17] developed a framework to assess the impact of three small-scale community wind electrification projects, all of which were located in northern Peru and differed in the technical solutions. The authors introduced 19 indicators amongst the dimensions “project design and technical aspects”, “socio-economic aspects” and “sustainability and management model”, the latter to focus on tariff structure and community participation in the projects. The indicators were not unified in how contributions towards them were collected. Some indicators were fed by a ranking score between low, moderate and high, for others percentages were used and for again others, a binary “met” or “not met” scoring was used. [17].
Mattarolo et al. [18] in 2014 developed an integrated monitoring and evaluation (M&E) approach to assess electrification projects by combining the Logical Framework Approach (LFA) and the Sustainable Livelihoods Framework (SLF). Based on these two key concepts, the conference paper recommends to highlight participation, ownership and empowerment of the people within the project. The authors stress the importance of people-oriented M&E indicators that early on, starting from the project formulation help steering the project activities towards a sustainable outcome. This approach complements the methodological line developed from the Ilskog's work. In particular, it addresses the technological sustainability of the implemented energy solution by monitoring the functioning of the project's installations.
Bhandari et al. in 2018 [19] suggest a framework, which includes multiple indicators among the dimensions – “social”, “economic”, “environmental” and “technical”. The indicators were defined and developed in collaboration with several stakeholders of a electrification project in rural Nepal. The authors apply their assessment scheme to the project and use a scoring system ranging from lowest grade “1” to highest grade “5”. The authors conclude that applying their framework to different electrification system topologies can help to create a general ranking of the technologies in rural energy supply settings [19].
The chronological analysis of frameworks developed to assess access-to-energy projects reveal multiple limitations and gaps in their application.
Firstly, the listed frameworks were designed and tailored to specific project settings or technologies. Depending on the objective – local setting or technology – the authors were obliged to make modifications to an existing framework or even to develop a completely new framework. These approaches are time-consuming and not universal, and consequently, they contradict the consensus for a universal assessment. Such an assessment would allow for the comparison of different projects and technologies. A particular limitation is that the available frameworks were designed for the assessment of electrification projects and as such, they neglect other energy vectors the like of clean cooking fuels and energy carriers for transport. By the existence of the SDGs, the important role of all three vectors of energy for human development has become clear. Accordingly, it is essential to consider all three in a comparative assessment scheme.
Secondly, the available frameworks aim at assessing the performance of access-to-energy projects by measuring outputs. They fail to capture the desired project outcomes which, together with the project impacts, describe the change at the target group and societal or regional level.
This paper proposes to fill these gaps through a universal and holistic impact assessment framework, which is capable of capturing the impact of access-to-energy projects across all sustainability dimensions and along the three energy vectors. For this matter, all 247 SDG were screened indicators for assessment and weighing in access-to-energy projects.
The “interlinkages and integrated nature” of the SDGs are highlighted in the preamble to the 2030 Agenda for Sustainable Development. Its adoption gave an impetus to a closer examination of interlinkages among the SDGs in the scientific literature as well as in the work of specialized UN agencies and other bodies. The following subsection presents an overview of works on the correlations between SDG 7 and other SDGs. They have been reviewed in the preparation of this manuscript with the intention of detecting those SDGs that, due to their links to the topic of energy, are considered for the proposed framework for the assessment of access-to-energy projects.
In 2015 Le Blanc [20] applied network analysis techniques to map the links between the different SDGs. The author's work was motivated by facilitating deeper integration across the policies pursued in various thematic areas of sustainable development. The paper focuses on a qualitative assessment on the policy level based on the interpretation of wording, rather than examining individual “biophysical, social and economic systems” [20]. While a relatively low number of interlinkages are identified for the SDG 7 in Le Blanc's mapping, the core thematic areas with the largest number of interlinkages include inequality, sustainable production and consumption (SPC), poverty, hunger and education. Further, the interconnection between energy and industrialization is identified as one of several gaps that the author sees not covered by the SDGs [20].
Nilsson et al. [21] developed the idea of synergies and trade-offs between SDGs mentioned already by Le Blanc [20] and contributed with a detailed framework describing different types of interactions between the goals. In order to enable prioritizing among different policy options based on up-to-date empirical evidence, the authors present a scoring system to assess the interdependency between two specific SDGs on a scale from -3 for a strong negative, i.e. cancelling relation, to +3 describing the strongest synergy. Apart from the strength of the interaction, three more criteria are suggested for assessment: whether the impact is (i) reversible or irreversible, (ii) unidirectional or bidirectional, and (iii) more or less certain based on available evidence. Unlike the previously cited work, Nilsson et al. analyse interlinkages on the goal level and do not look into corresponding targets. For our further analysis, it is important to note that the authors stress the role of the local context and available technologies as well as the time and space aspects, encourage attention to specific local root causes and warn against abstract generalizations [21].
More recently, the specific correlations between SDG 7 (Clean Energy for All) and the remaining 16 SDGs raised interest in the scientific community leading to the following research articles. Nerini et al. [22] identified and examined the links between energy and other SDGs that might be remedied by changes in the energy system topology. The research question goes beyond the initial provision of energy (Target 7.1) and covers all energy-related aspects and impacts down the road when the point of actually turning energy into energy services. Unlike the above two articles, the analysis deals with the topic on a detailed SDG target level – SDG targets which are used in the SDG framework to further specify the goals – and is substantiated by qualitative evidence obtained from experts in the relevant thematic fields, i.e. by reference to previous studies. The interlinkages are described using the plain synergy – trade-off classification. Similarly to Nilsson et al. [21], the authors consider the interdependencies on the level of individual SDG targets to be manifold and “highly context specific” [22].
The most comprehensive study on interlinkages between SDG 7 and other SDGs is the work published by McCollum et al. [23]. The authors in 2017 report on a large-scale assessment of relevant energy literature to detect the interactions of SDG 7 with other SDGs, including context-dependencies relating to governance, time, geography, technology and directionality. The authors assess the nature and strength of identified interactions, the robustness of the literature evidence and find knowledge gaps as well as critical areas, building on the scoring framework by Nilsson et al. [21] and a more general description of interdependencies among the goals provided by Nerini et al. [22]. As such, the interdependencies with SDG 7 are calibrated on the level of individual SDG targets or a group of two or more closely related targets. They finally find that positive interactions, in the meaning and ranking of either indivisible, reinforcing or enabling, outweigh negative interactions (constraining, counteracting or cancelling) both in number and magnitude, amongst all SDGs (except SDG 17 “means of implementation”, that was not considered) [23].
In 2017, Pradhan et al. [24] quantified the interactions of the SDGs in both directions of synergies, being positive correlations and trade-offs, being negative correlations. In a novel approach, the authors considered such correlations on the most detailed level of the SDGs by using actual data collected within 227 countries for the SDG indicators which are used to track progress in the respective targets of the SDGs. SDG 7 is found to have a surprisingly balanced ratio of positive as well as negative correlations to 14 other SDGs. The authors show that even the indicators within SDG 7 can correlate negatively in some geographical contexts [24].
The review of the literature examining interlinkages between SDG 7 and other SDGs allows for the conclusion that none of the previously listed considers the impact access to energy can have on a project scale, which would be measurable at indicator level of the SDGs, but all allow for causal linkages and context-dependencies to include governance and political aspects as well. Also, it turns out that it is not distinguished between the types of energy. In addition to a review of research articles, a more detailed literature review including project reports of access-to-energy projects is needed.
Therefore, this article analyses the relevance of access-to-energy in contributing towards respective SDGs on a project level while at the same time differentiate between the three energy vectors.
The identified gap calls for a selection of SDG indicators that are influenced by access-to-energy projects and that play a role in the achievement of other non-energy-related SDGs. Theoretical background of the used method is explained in subsection 2.1 and it is applied to SDG 1 to showcase eligible indicators exemplarily. Subsection 2.2 describes the approach to determine energy vector's relevance for the respective indicator.
Firstly, SDG indicators that are affected by changes in the access-to-energy level are outlined. Particular attention is given to the kind of energy (electricity, cooking fuel, transportation) relevant to this effect. Secondly, the suggested structure and methodology for data collection and computational method of such indicators is examined to see whether this indicator can be used as a unit of measurement for an access-to-energy project. To comprehensively cover all of these aspects, the SMART framework is established method. SMART stands for the five essential attributes of performance indicators. Even though it has been decoded into slightly varying words by different authors, this paper understands the terminology as Specific, Measurable, Achievable, Relevant and Time-bound [25], [26]. Originally introduced by Drucker in 1954 for goal setting as part of the Managing by Objectives approach in the management science [25], SMART criteria have since been widely used in many fields for key performance indicators, including the formulation of indicators for monitoring and evaluation of development projects [27]. In the context of the SDGs, Cormier and Elliott analyse the indicators pertaining to SDG 14 (Life Below Water) using the SMART criteria [28].
The specific definition and design of all the 231 (unique) SDG indicators is seen as given standard by the UN, as valid for the period 2015-2030 and it is therefore not further discussed in this article. However, some SDG indicators are required to be adjusted in order to be applied for the evaluation of access-to-energy projects. This concerns time periods and geographical dimensions in order to match the project duration and the regional zone that the project might have an impact on. The aforementioned adjustments do not involve modification of the indicator design but rather a “zooming in” effect in order to make useful policy level indicators to a grassroots project setting.
The achievability of an indicator for evaluating a project refers to setting a realistic quantitative target to the particular project context. The time-bound criterion is similarly project-specific. Like the achievability, it does not deal with what is measured but rather requires a clear indication by when a specific quantitative target must be achieved. The only time-related aspect to be considered in the formulation of an indicator is the timing of when changes happen and become measurable. This depends on the design of the measured parameter. Potential effects of later and unrelated projects may complicate the measurement of direct impact from access to energy. The distortion is likely to grow with time. Accordingly, the discussion focuses on relevance and measurability.
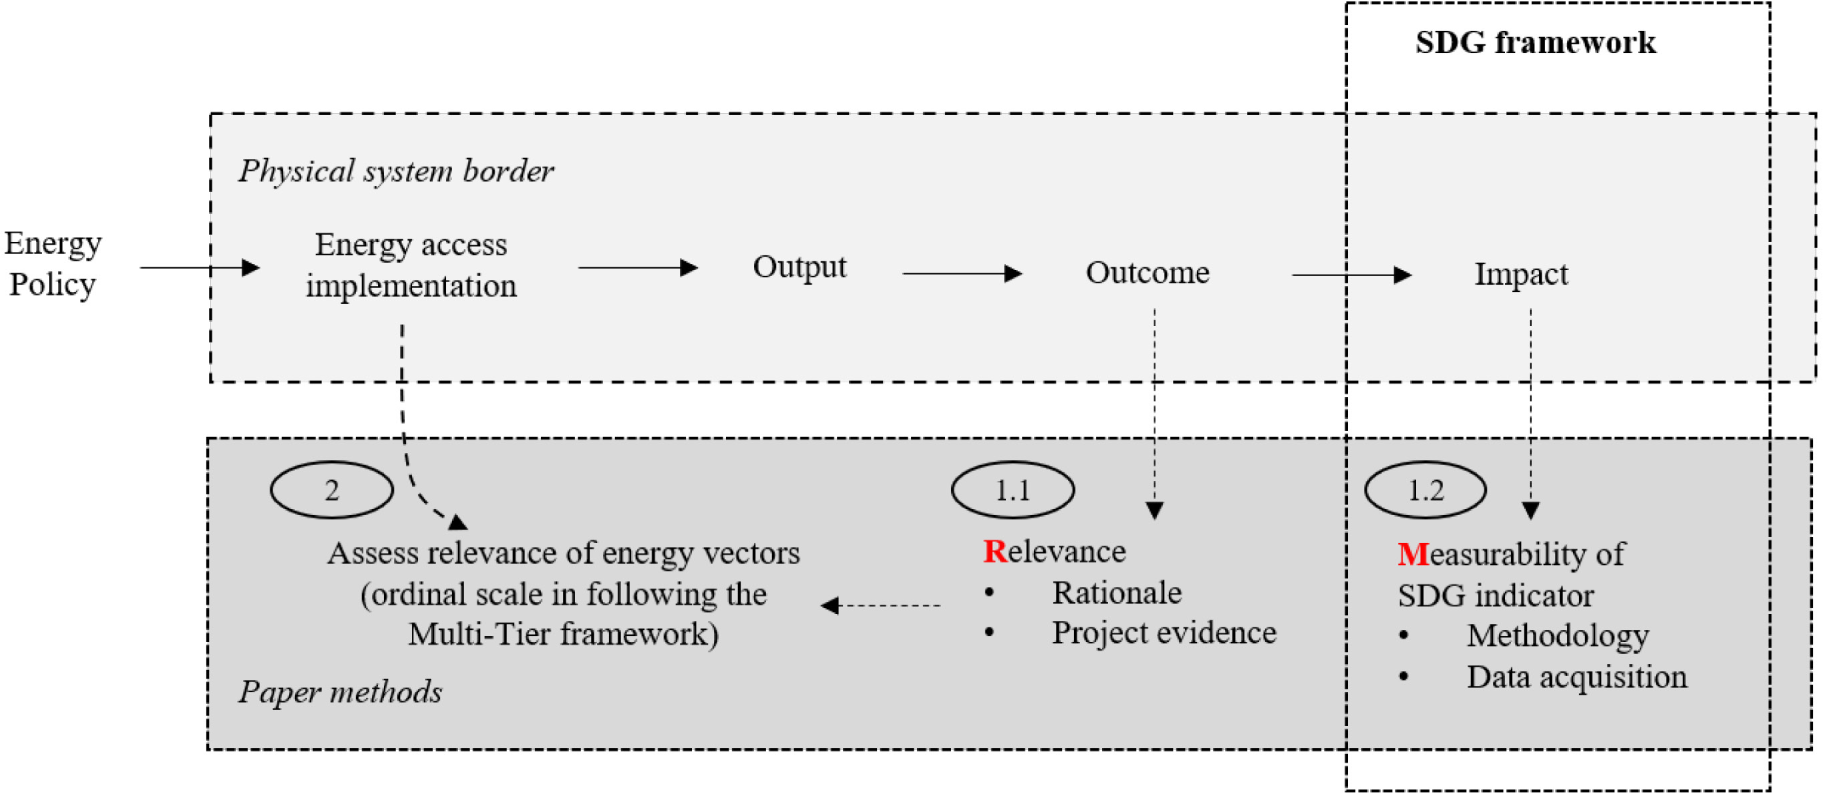
To illustrate the linkage of the two indicators with the logical framework theory, Figure 1 shows the steps from the implementation of a project, to the outputs of the project, over outcomes at the target group level and up to the impact that is brought by the entire implementation. According to the idea of the logical framework theory, any access-to-energy implementation generates outputs which translate into desired effects on the target group level, namely outcomes. For this paper, the outcomes were used to assess the relevance of an indicator.
As the SDG indicators by their nature capture impacts – the outcome at the regional or societal level – the SDG indicators were used to assess the measurability of an indicator. In case of an indicator being relevant and measurable, the next step was to quantify its contribution to the different energy vectors (electricity, cooking fuel, transportation) as found in the project report or article. More on this can be found in section 2.2.
To prove the relevance of an indicator, the rationale and background of the respective indicator is studied. Scientific publications and project reports from international development organizations were considered. The purpose of this paper is to assess and weigh indicators in order to lay the foundation for an assessment framework for access-to-energy projects. All interlinkages with a measurable influence on the local project level are considered relevant. This excludes interlinkages at a higher political or governmental level, those that require causal linkages and/or those that can be observed by meeting significant additional factors only. Further, the paper neglects to differentiate between the direction of correlation, such as positive and negative – but examines the absolute relevance of any type of energy.
Structure of the logical framework theory
To showcase the examination of the criterion relevance, the following section exemplarily goes through the method on indicators 1.1.1 (Proportion of population below the international poverty line, by sex, age, employment status and geographical location (urban/rural)) and 1.2.1 (Proportion of population living below the national poverty line, by sex and age), which both measure the absolute minimum of economic prosperity to quantify progress towards the overall objective of poverty reduction. The literature is consistent about the strong positive impact of access to clean energy to economic development, revealing manifold contributions of energy to improve the economic wealth of households, such as – at a rudimentary stage – that access to clean energy sources can help to displace expensive conventional energy, freeing up resources for other uses [17], [29], further electricity to enable all kinds of productive uses (“all agriculture or commercial activities, which generate income” [30]) – mostly in rural areas such activities are related to agriculture [31], to achieve higher productivity in agricultural [32], [33] or manufacturing processes [33], [34], transportation that can enable access to markets to significantly diversify both sales opportunities and commercial offer [31] and electricity that can enable entrepreneurial activities beyond agriculture through powering electric equipment and tools [32], measurable leading to small scale business development [17], [35] or increased micro-enterprise profitability [36]. Amongst several others, Yadoo et al. [33] even were able to quantify the economic improvements of an electrification project in Nepal. It was found that the displacement of previously used kerosene and batteries for lighting achieved monthly savings of the beneficiary households of 0.7 USD up to 12 USD. Depending on the size of the household and the community ownership structure, electrical productive uses leading to improved productivity and accessible transport of agricultural product to local markets allowed respective households to gain 135 USD/month – 270 USD/month to their income [33]. As for the proof of project evidence work of previous authors is the fundamental, it must be noted that the paper takes up the results of such previous work. Therefore, the focus of the paper is on one indicator at a time and not on correlations or time dependent relations. In future papers, however, correlations between the indicators could be integrated, which are explicitly not considered here, as would go beyond the scope here.
In a second step to test the eligibility, the measurability of the SDG indicator within local energy access projects is assessed. In general, the measurability of the original SDG indicators and their specific character is assumed. However, for the purposes of a universal framework for the assessment of remote and small-scale access-to-energy projects is different from impact measurements for more centralized large-scale projects and localized setting may pose different requirements compared to tracking the overall progress measurement on a country level.
The methodology of data collection and computational method of the respective indicator is analysed, and it is examined whether the indicator is suitable in its characteristics and in its collection effort to measure progress through access to energy in a locally limited context in a meaningful way. An attempt is made to understand whether the data on which the screened projects and analyses were based would have been sufficient to quantify this particular SDG indicator.
Again to be used as a positive example, indicator 1.1.1 quantifies the proportion of the population below the international agreed poverty line – currently USD 1.90 a day at 2011 international prices – by dividing the number of persons living in households below the poverty line by the total number of persons surveyed. To do so, the international poverty threshold must be converted into local currencies in 2011 and subsequently be converted to prices prevailing at the time of the relevant household survey by using a Consumer Price Index [37]. In subsequent for the respective area of project the number Np of poor – being the people living below the calculated poverty line – is to be determined by either consulting authorities or simply by conducting a survey and to be divided by the total number of respondents to calculate the poverty rate via equation:
(1)
Since the simplicity of using a survey as the data collection method allows to tailor the indicator to any project scope, the indicator is considered to be measurable and eligible for the impact assessment framework.
The relevance of energy for the SDG indicators was determined by considering the contributions of electricity, cooking fuel and transportation service. The contribution of the three vectors of energy is strongly dependent on the project context and it might require additional investigation, including the development of an appropriate method, to find a generally valid statement on the relative importance of each energy vector.
The present paper therefore provides estimates for the respective contributions by summarizing findings from project reports and research articles on a six-point ordinal scale ranging from 0 to 6. A project report or an article that mentions in its results and/or in its impacts an effect that can be directly addressed to a certain indicator means that this certain indicator is included as relevant in our listing below. The scores to the indicators were given in a comparative way by ranking the results/impacts from project reports/research articles amongst each other, following the idea of the Multi-Tier-Framework categories including capacity, duration, and availability [38]. For this purpose, the limits in alignment with the Multi-Tier-framework (e.g. availability in more or less than 80% of the year) were applied within the respective categories to evaluate the necessary contribution of a respective energy vector for that a measurable contribution at the considered indicator could be assessed. If an energy vector must be present only to a small extent to already be able to induce progress in the respective indicator (in the example, less than 80% of the year), its relevance is classified as high and a correspondingly high score is assigned. However, if the energy vector must be present to an extent more than the defined limit, its relevance is rated as lower. In a subsequent review of the indicators scores, they were examined to make sure that the scores are valid and verified in the sense that they do not go against known correlations and cross-effects between SDGs. In this way, all relevant SDG indicators could be identified and ranked.
The authors are aware that the six-point ordinal scale and the sorting of indicators by it does not allow for full accuracy, however this just mirrors the limited evidence that is available in up-to-date project reports and research articles. The authors are convinced that the suggest sorting of indicators is currently the most accurate and objective way possible in order to shed light on this topic. As mentioned in the review section, a novel approach for a universal and holistic assessment is required and this paper hereby presents the foundation of it. The current research article and project report findings do allow for the below approximation. The scoring matrix will be provided to interested readers upon request.
Table 1 comprises all indicators of the SDGs found to be affected by access-to-energy projects, the relevant energy vector contributing to the indicator and the estimated weight of the respective energy vector.
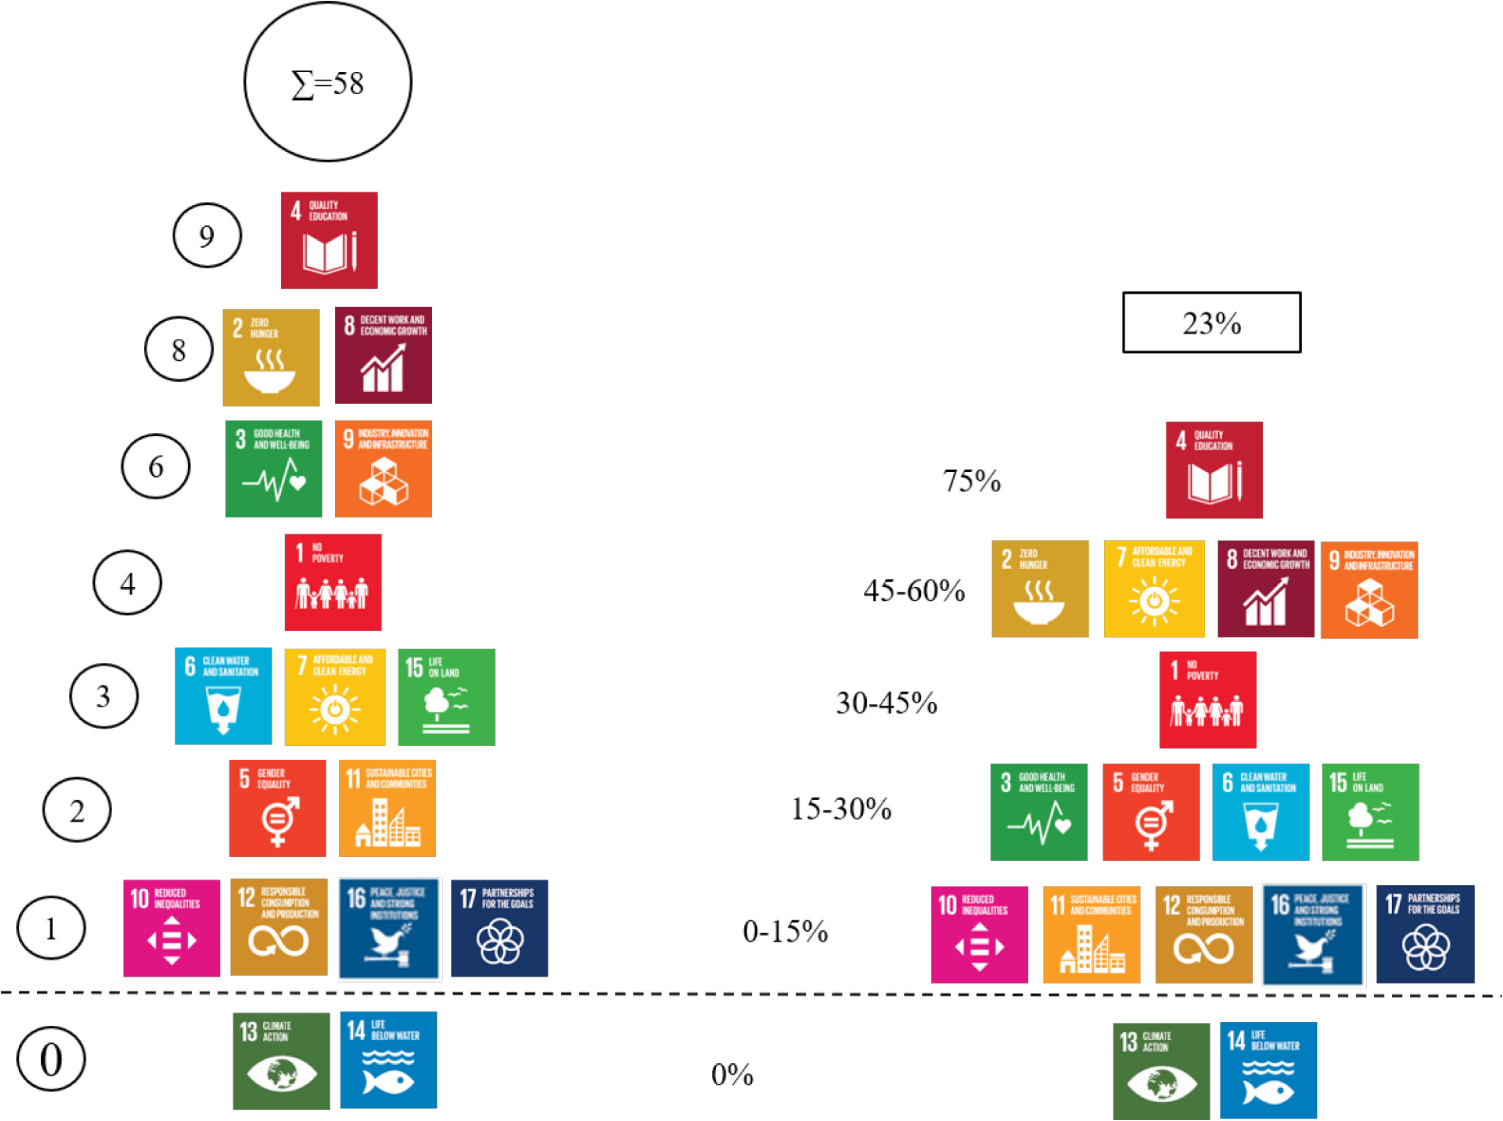
The results of the previous table are illustrated in Figure 2 below. Figure 3 shows the relative contributions of the respective types of energy along the affected 15 SDGs. Figure 2 gives an overview of the number of indicators that are relevant out of a single SDG and a percentage range of how many indicators of a single SDG are affected by access-to-energy projects. SDGs are ordered bottom-up by increasing numbers of relevant indicators. This Figure, aims to depict on the one hand which SDGs are affected at all and on the other hand to what extent the certain SDG is affected. The majority of SDGs is affected through up to 30% of its indicators while 5 SDGs are affected by more than 45% of its indicators. This again shows that our perspective needs to broaden and move away from viewing SDG 7 as the single center for access-to-energy related impacts in sustainable development.
Number of relevant indicators along the SDGs (left) and share of respective eligible indicators within the certain SDGs (right)
SDG indicators including its relevance and form of energy
SDG [5] |
Eligible indicator [5] |
Relevance of energy from project report / research articles |
Sources |
Relevance of electricity, cooking fuel and transportation according to scale |
||
Electricity |
Cooking Fuel |
Transportation |
||||
SDG 1: No poverty |
1.1.1 Proportion of population below the international poverty line, by sex, age, employment status and geographical location (urban/rural) 1.2.1 Proportion of population living below the national poverty line, by sex and age 1.2.2 Proportion of men, women and children of all ages living in poverty in all its dimensions according to national definitions |
|
||||
1.4.1 Proportion of population living in households with access to basic services |
|
|||||
SDG 2: Zero hunger |
2.1.1 Prevalence of undernourishment 2.1.2 Prevalence of moderate or severe food insecurity in the population, based on the Food Insecurity Experience Scale 2.2.1 Prevalence of stunting among children under 5 years of age 2.2.2 Prevalence of malnutrition among children under 5 years of age, by type |
|
||||
2.3.1 Volume of production per labour unit by classes of farming/pastoral/forestry enterprise size 2.3.2 Average income of small-scale food producers, by sex and indigenous status |
|
|||||
2.4.1 Proportion of agricultural area under productive and sustainable agriculture |
|
|||||
2.c.1 Indicator of food price anomalies |
|
|||||
SDG 3: Good Health and Well-Being |
3.1.1 Maternal mortality ratio 3.1.2 Proportion of births attended by skilled health personnel |
|
||||
3.2.1 Under-five mortality rate 3.2.2 Neonatal mortality rate |
|
|||||
3.9.1 Mortality rate attributed to household and ambient pollution |
|
|||||
3.9.2 Mortality rate attributed to unsafe water, unsafe sanitation and lack of hygiene |
|
See SDG 6 |
||||
SDG 4: Quality Education |
4.1.1 Proportion of children and young people: (a) in grades 2/3; (b) at the end of primary; and (c) at the end of lower secondary achieving at least a minimum proficiency level in (i) reading and (ii) mathematics, by sex 4.2.1 Proportion of children under 5 years of age who are developmentally on track in health, learning and psychosocial well-being, by sex 4.2.2 Participation rate in organized learning (one year before the official primary entry age), by sex 4.3.1 Participation rate of youth and adults in formal and non-formal education and training in the previous 12 months, by sex 4.6.1 Percentage of population in a given age group achieving at least a fixed level of proficiency in functional (a) literacy and (b) numeracy skills, by sex |
|
||||
4.4.1 Proportion of youth and adults with information and communications technology (ICT) skills, by type of skill |
|
|||||
4.5.1 Parity indices (female/male, rural/urban, bottom/top wealth quintile and others such as disability status, indigenous peoples and conflict-affected, as data become available) for all education indicators on this list that can be disaggregated |
|
Calculation based on previous underlying indicators4.1.1 – 4.4.1. See relevant respective indicator. |
Calculation based on previous underlying indicators4.1.1 – 4.4.1. See relevant respective indicator. |
|||
4.a.1 Proportion of schools with access to: (a) electricity; (b) the Internet for pedagogical purposes; (c) computers for pedagogical purposes; (d) adapted infrastructure and materials for students with disabilities; (e) basic drinking water; (f) single-sex basic sanitation facilities; and (g) basic handwashing facilities (as per the WASH indicator definitions) |
|
See relevant indicator of the respective basic service. |
See relevant indicator of the respective basic service. |
|||
4.c.1 Proportion of teachers in: (a) pre-primary; (b) primary; (c) lower secondary; and (d) upper secondary education who have received at least the minimum organized teacher training (e.g. pedagogical training) pre-service or in-service required for teaching at the relevant level in a given country |
|
|||||
SDG 5: Gender Equality |
5.4.1 Proportion of time spent on unpaid domestic and care work, by sex, age and location |
|
||||
5.B.1 Proportion of individuals who own a mobile telephone, by sex |
|
|||||
SDG 6: Clean Water and Sanitation |
6.1.1 Proportion of population using safely managed drinking water services |
|
||||
6.2.1 Proportion of population using safely managed sanitation services, including a hand-washing facility with soap and water |
|
|||||
6.3.1 Proportion of wastewater safely treated |
|
|||||
SDG 7: Affordable and clean energy |
7.1.1 Proportion of population with access to electricity |
Inherently relevant. |
||||
7.1.2 Proportion of population with primary reliance on clean fuels and technology |
||||||
7.2.1 Renewable energy share in the total energy consumption |
||||||
SDG 8: Decent Work and Economic Growth |
8.1.1 Annual growth rate of real GDP per capita 8.2.1 Annual growth rate of real GDP per employed person 8.5.1 Average hourly earnings of female and male employees, by occupation, age and persons with disabilities 8.5.2 Unemployment rate, by sex, age and persons with disabilities |
|
||||
8.6.1 Proportion of youth (aged 15-24 years) not in education, employment or training 8.7.1 Proportion and number of children aged 5-17 years engaged in child labour, by sex and age |
|
See relevant sources from 8.1.1-8.5.2, and SDG 4 |
||||
8.9.1 Tourism direct GDP as a proportion of total GDP and in growth rate 8.9.2 Proportion of jobs in sustainable tourism industries out of total tourism jobs (Methodology still under development) |
|
|||||
8.10.1 (a) Number of commercial bank branches per 100,000 adults and (b) number of automated teller machines (ATMs) per 100,000 adults |
|
[97] |
||||
SDG 9: Industry, Innovation and Infrastructure |
9.2.1 Manufacturing value added as a proportion of GDP and per capita 9.2.2 Manufacturing employment as a proportion of total employment 9.3.1 Proportion of small-scale industries in total industry value added 9.b.1 Proportion of medium and high-tech industry value added in total value added |
|
||||
9.4.1 CO2 emission per unit of value added |
|
|||||
9.c.1 Proportion of population covered by a mobile network, by technology |
|
|||||
SDG 10: Reduced Inequalities |
10.1.1 Growth rates of household expenditure or income per capita among the bottom 40 per cent of the population and the total population |
|
See relevant sources under SDG 1, 8, 9 |
See relevant forms of energy under SDG 1, SDG 8, SDG 9. |
||
SDG 11: Sustainable Cities and Communities |
11.2.1 Proportion of population that has convenient access to public transport, by sex, age and persons with disabilities |
|
||||
11.6.2 Annual mean levels of fine particulate matter (e.g. PM2.5 and PM10) in cities (population weighted) |
|
|||||
SDG 12: Responsible Consumption and Production |
12.3.1 (a) Food loss index and (b) food waste index |
|
||||
SDG 15: Life on Land |
15.1.1 Forest area as a proportion of total land area 15.3.1 Proportion of land that is degraded over total land area 15.4.1 Mountain Green Cover Index |
|
||||
SDG 16: Peace, Justice and Strong Institutions |
16.1.4 Proportion of population that feel safe walking alone around the area they live |
|
||||
SDG 17: Partnership for the Goals |
17.8.1 Proportion of individuals using the Internet |
|
[127] |
|||

In total, 58 indicators from 15 SDGs (including SDG 7) meet the criteria of the SMART framework, which accounts for 23% of the total indicators. Most numerous indicators per SDG are found in SDG 4 (Quality education). In 9 of the 11 indicators for measuring progress in education, the SDG indicators can directly determine a quantifiable impact of access to energy. The remarkable contribution of energy to SDG 4 stems from the possibility of providing lighting for evening studies and powering electrical devices that can be used to support teaching or learning. The substitution of traditional cooking fuels, the procurement of which may take up productive learning time, is also found to be a great contribution towards better education. SDG 2 (Zero Hunger) and SDG 8 (Decent work and economic growth) are also strongly represented in Figure 2, each counting 8 indicators out of 14 and 17 possible indicators. Notably, only 3 out of 6 indicators of the energy SDG 7 can be applied for the given purpose of an impact assessment of access-to-energy projects on a local project scale, as the remaining 3 fail in their methodology.
For two SDGs no eligible indicators were found. These are SDG 14 (Life below water) and SDG 13 (Climate Action). In the first case, the relevance of energy cannot be proven directly on a local project scale, but it can be recognized in causal chains, such of which are excluded in this investigation. The latter – Climate Action – however, is indisputably entangled in its logic with energy and SDG 7. Nevertheless, the methodology of the indicators of this SDG does not allow for application on a local project scale, so that the indicators are not included in the framework as eligible accordingly. In fact, most of the indicators under SDG 13 address actions and commitments at the national level, to which the effect of a local access-to-energy implementation cannot be linked.
Contributions to SDGs by energy form. Note that SDG 10 indicators are based on calculations of other SDGs indicators
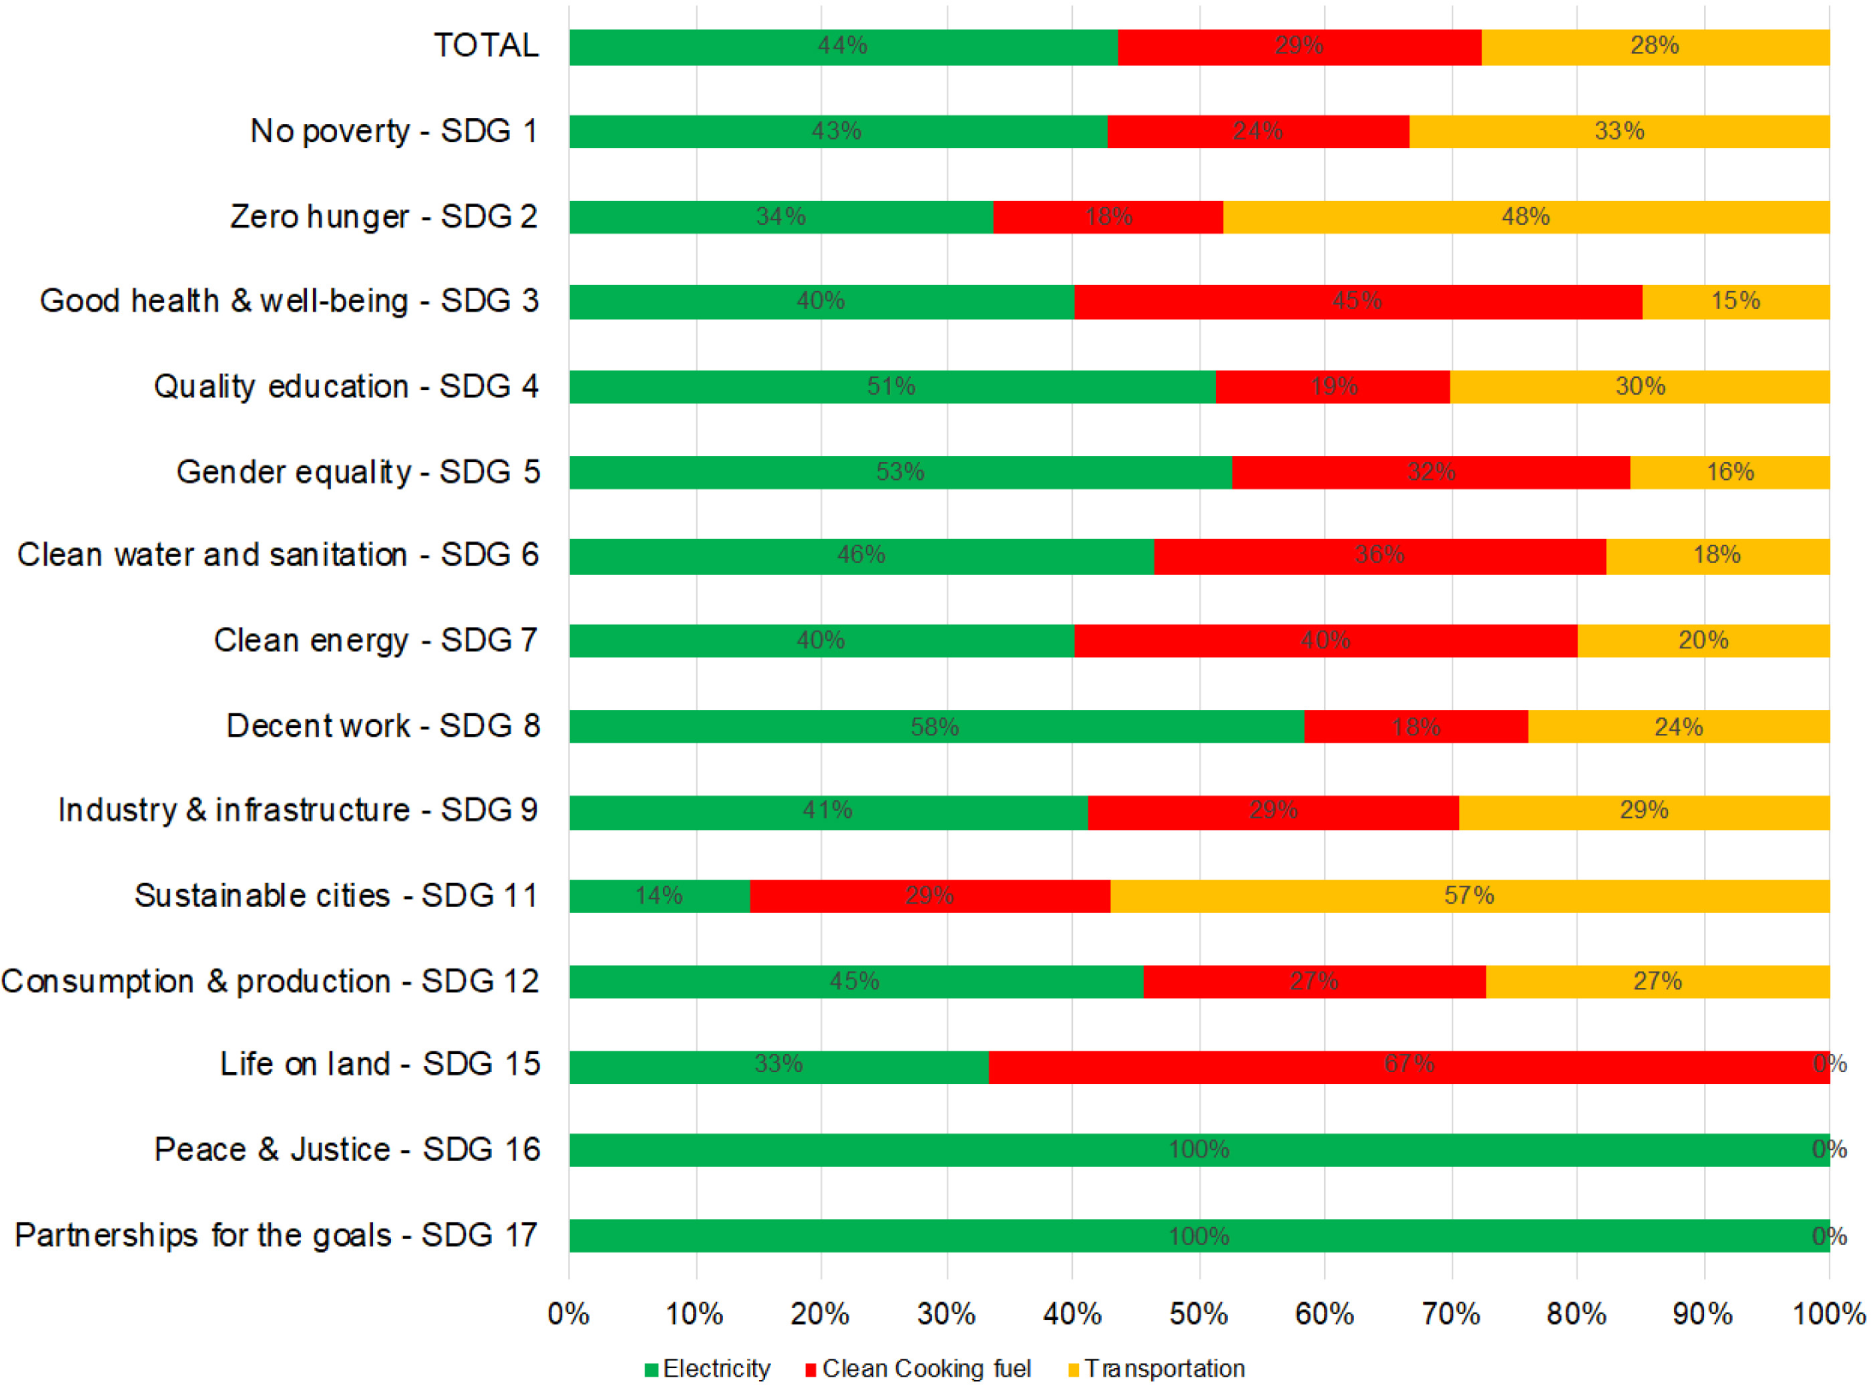
As shown in Table 1, the three energy vectors “electricity”, “cooking fuel” and “transportation” contribute in varying extend to the achievement of the various SDGs. The findings of our analysis were visualized in the percentage bar chart in Figure 3 to show which energy vector contributes in what extent to the achievement of a certain SDG. For this purpose, the scoring of the table was taken and then averages were calculated for each SDG indicator, i.e. for each row of the table. Subsequently, the averaging of these results was repeated for each set of indicators within each SDG. The results are displayed in Figure 3.
The green bars show a dominant contribution of electricity to most of the SDGs. In the overall result, electricity accounts for almost 50% of the contribution to affecting the SDGs. Transportation, indicated as yellow bars, has the smallest contribution just behind cooking fuel, pictured in red. However, this result varies considerably across the SDGs. Transportation, for example, is a key determinant for the two indicators of SDG 11 (Sustainable Cities and Communities), which were found to be eligible and which measure access to public transport and the level of particulate matter emissions in cities. Clean cooking fuel, on the other hand, has an impact especially in SDG 15 (Life on Land) indicators, which primarily quantify the potential degradation of land and forests through deforestation for the purpose of cooking fuel procurement. The Figure clearly shows that all three energy vectors play important roles for achieving holistic impact within all dimensions of development and that none of it must be neglected.
The paper applied the SMART framework for indicator design to the SDG indicators in order to examine, on the one hand, the thematic relevance and contribution of energy to these indicators and thus to achievement of the SDGs. As resources for this, current research articles and project reports were consulted. On the other hand, the applicability of the indicators for the assessment of access-to-energy projects in terms of their methodology was examined. 58 indicators along 15 SDGs (including SDG 7) were found to meet all criteria of the SMART framework and are therefore eligible for an assessment framework to make out the holistic impact of access-to-energy projects. These SDG indicators lay the foundation for a holistic assessment framework and therewith fill the gap of existing frameworks by capturing the actual outcomes and impacts of a project.
However, the derived set of SDG indicators by itself does not dictate the project structure and implementation, which implies that – in the event of either failure or success – the reasons for it remain unclear. The authors therefore propose to apply the indicator set alongside of existing project performance measurements and evaluations.
In addition, such indicators that failed to be eligible since the methodology criteria could not be fulfilled – especially the indicators of SDG 13 – are to be modified to capture these thematic interlinkages and to be introduced to the framework.
As aimed for, the proposed set of indicators for a holistic assessment framework can be applied universally and to any kind of access-to-energy project, without time-consuming modifications to be made – it is universal.
The findings for each type of energy regarding SDG contributions emphasize that access-to-energy projects are by no means to be limited to electrification projects only, as clean cooking fuels and transportation also significantly contribute in separate dimensions of sustainable development. The authors therefore propose to further investigate the contribution of types of energy towards separate indicators of the SDGs and subsequently improve effectiveness of access-to-energy projects by selectively directing specific energy vectors, depending on the required development in the local context.
The authors would like to thank Elena Timofeeva and Aslan Eqbal who continuously supported them with strong commitment in data preparation and paper preparation.
- ,
, United Nations, Millennium Development Goals declaration , 2000 - ,
, United Nations, The Millennium Development Goals Report 2015, Report, United Nations , 2016 - ,
, United Nations, About the Sustainable Develoment Goals , https://www.un.org/sustainabledevelopment/sustainable-development-goals/, Accessed: 11-Mar-2020 - ,
The energy requirements of a developed world ,Energy Sustain Dev , Vol. 33 ,pp 1-13 , 2016, https://doi.org/https://doi.org/10.1016/j.esd.2016.04.001 - ,
Energy poverty: An overview ,Renew. Sust. Energ. Rev. , Vol. 47 ,pp 377-385 , 2015, https://doi.org/https://doi.org/10.1016/j.rser.2015.03.013 - ,
Energy access programmes and sustainable development: A critical review and analysis ,Energy Sustain Dev , Vol. 16 (3),pp 260-271 , 2012, https://doi.org/https://doi.org/10.1016/j.esd.2012.05.002 - ,
Understanding the role of energy consumption in human development through the use of saturation phenomena ,Energ Policy, No. 36 ,pp 1430-1435 , 2008, https://doi.org/https://doi.org/10.1016/j.enpol.2007.12.016 - ,
Global Energy Futures and Human Development: A Framework for Analysis ,Report, U.S. Department of Energy , 2000 - ,
, United Nations, Sustainable Development Goals Knowledge Platform , https://sustainabledevelopment.un.org/, Accessed: 03-Jan-2020 - , , Sustainable Energy for All
- ,
Indicators for assessment of rural electrification - An approach for the comparison of apples and pears ,Energ Policy , Vol. 36 (7),pp 2665-2673 , 2008, https://doi.org/https://doi.org/10.1016/j.enpol.2008.03.023 - ,
And then they lived sustainably ever after? - Assessment of rural electrification cases by means of indicators ,Energ Policy , Vol. 36 (7),pp 2674-2684 , 2008, https://doi.org/https://doi.org/10.1016/j.enpol.2008.03.022 - ,
Renewable rural electrification: Sustainability assessment of mini-hybrid off-grid technological systems in the African context ,Renew. Energy , Vol. 35 (1),pp 257-265 , 2010, https://doi.org/https://doi.org/10.1016/j.renene.2009.03.028 - ,
Report of the World Commission on Environment and Development: Our Common Future ,Report, Brundtland Comission, Oxford , 1987 - ,
Review on the economics of climate change ,Report, Office of the Prime Minister, United Kingdom , 2006 - ,
Towards a Locally Adapted Rural Electrification Assessment Framework: A Case Study of the Lao PDR ,GMSTEC 2010: International Conference for a Sustainable Greater Mekong Subregion, Bangkok ,pp 1-6 , 2010 - ,
Evaluating and comparing three community small-scale wind electrification projects, Renew ,Sust. Energ. Rev. , Vol. 16 (7),pp 5379-5390 , 2012, https://doi.org/https://doi.org/10.1016/j.rser.2012.04.015 - ,
An Integrated Monitoring & Evaluation approach for the assessment of energy technologies-related projects ,Tech4Dev2014, Lausanne , 2014 - ,
Sustainability assessment of a micro hydropower plant in Nepal ,Energ Sustain Soc, , Vol. 8 (1),pp 2668 , 2018, https://doi.org/https://doi.org/10.1186/s13705-018-0147-2 - ,
Towards Integration at Last? The Sustainable Development Goals as a Network of Targets ,Sustain. Dev. , Vol. 23 ,pp 76-187 , 2015, https://doi.org/https://doi.org/10.1002/sd.1582 - ,
Map the interactions between Sustainable Development Goals ,Nature , Vol. 534 , 2016, https://doi.org/https://doi.org/10.1038/534320a - ,
Mapping synergies and trade-offs between energy and the Sustainable Development Goals ,Nat. Energy , Vol. 3 ,pp 10-15 , 2017, https://doi.org/https://doi.org/10.1038/s41560-017-0036-5 - ,
Connecting the sustainable development goals by their energy inter-linkages ,Environ. Res. Lett. , Vol. 13 (3), 2018, https://doi.org/https://doi.org/10.1088/1748-9326/aaafe3 - ,
A Systematic Study of Sustainable Development Goal (SDG) Interactions ,Earth´s Future ,pp 1169-1179 , 2017, https://doi.org/https://doi.org/10.1002/2017EF000632 - ,
Key Performance Indicators ,Report, Wiley , 2015, https://doi.org/https://doi.org/10.1002/9781119019855 - , , 2018
- ,
, United Nations Development Programme, Handbook on planning, monitoring and evaluation for development results, Report, UNDP , 2009 - ,
SMART marine goals, targets and management – Is SDG 14 operational or aspirational, is ‘Life Below Water' sinking or swimming? ,Mar. Pollut. Bull. , 2017, https://doi.org/https://doi.org/10.1016/j.marpolbul.2017.07.060 - ,
Access to Modern Energy: a Review of Impact Evaluations ,FEEM Working Paper No. 96. 2014 , Vol. 96 , 2014, https://doi.org/https://doi.org/10.2139/ssrn.2527874 - ,
The productive use of renewable energy in Africa ,European Union Energy Initiative Partnership Dialogue Facility , 2015 - ,
Off-grid systems for rural electrification in developing countries: Definitions, classification and a comprehensive literature review ,Renew. Sust. Energ. Rev. , Vol. 58 ,pp 1621-1646 , 2016, https://doi.org/https://doi.org/10.1016/j.rser.2015.12.338 - ,
Community-Based Electric Micro-Grids Can Contribute to Rural Development: Evidence from Kenya ,World Development , Vol. 37 (7),pp 1208-1221 , 2009, https://doi.org/https://doi.org/10.1016/j.worlddev.2008.11.005 - ,
Delivery Models for Decentralised Rural Electrification: Case studies in Nepal, Peru and Kenya ,International Institute for Environment and Development , 2012 - ,
Manufacturing Firms in Developing Countries: How Well Do They Do, and Why? ,J. Econ. Lit. , Vol. 38 ,pp 11-44 , 2000, https://doi.org/https://doi.org/10.1257/jel.38.1.11 - ,
Mini-Grid Hydropower for Rural Electrification in Mozambique: Meeting Local Needs with Supply in a Nexus Approach ,Water , Vol. 11 (2), 2019, https://doi.org/https://doi.org/10.3390/w11020305 - ,
The impact of rural electrification on rural micro-enterprises in Niger Delta, Nigeria ,Energy Sustain Dev , Vol. 17 (5),pp 504-509 , 2013, https://doi.org/https://doi.org/10.1016/j.esd.2013.06.004 - ,
, United Nations, SDG Indicators: Metadata repository , https://unstats.un.org/sdgs/metadata/?Text=&Goal=15&Target, Accessed: 05-Mar-2020 - ,
, ESMAP and SE4All, Beyond Connections: Energy Access Redefined, Report , 2016 - ,
The Effects of Rural Electrification on Employment: New Evidence from South Africa ,Am Econ Rev , Vol. 101 (7),pp 3078-3108 , 2011, https://doi.org/https://doi.org/10.1257/aer.101.7.3078 - ,
Productive Uses of Energy for Rural Development ,Annu Rev Environ Resour , Vol. 30 (1),pp 117-144 , 2005, https://doi.org/https://doi.org/10.1146/annurev.energy.30.050504.144228 - ,
Welfare Impacts of Rural Electrification: A Panel Data Analysis from Vietnam ,Econ. Dev. Cult. Change , Vol. 61 (3),pp 659-692 , 2013, https://doi.org/https://doi.org/10.1086/669262 - ,
Replicability and scalability of mini-grid solution to rural electrification programs in sub-Saharan Africa ,Renew. Energy , 2017, https://doi.org/https://doi.org/10.1016/j.renene.2017.01.017 - ,
A review of the water-energy nexus ,Renew. Sust. Energ. Rev. , Vol. 65 ,pp 319-331 , 2016, https://doi.org/https://doi.org/10.1016/j.rser.2016.07.020 - ,
Impacts of Groundwater Constraints on Saudi Arabia's Low-Carbon Electricity Supply Strategy ,Environ Sci Technol , Vol. 50 (4),pp 1653-1662 , 2016, https://doi.org/https://doi.org/10.1021/acs.est.5b05852 - ,
Water-Energy-Food nexus: framing the opportunities, challenges and synergies for implementing the SDGs ,Österreichische Wasser- und Abfallwirtschaft , Vol. 68 (3-4),pp 86-98 , 2016, https://doi.org/https://doi.org/10.1007/s00506-016-0297-4 - ,
The benefits of the use of biogas energy in rural areas in Ethiopia: A case study from the Amhara National Regional State ,Fogera District, AJEST , Vol. 9 (4),pp 332-345 , 2015, https://doi.org/https://doi.org/10.5897/ajest2014.1838 - ,
, United Nations, Mobilizing sustainable transport for development, Report, United Nations, New York , 2016 - ,
Educational benefits from solar technology - Access to solar electric services and changes in children's study routines, experiences from eastern province Zambia ,Energ Policy , Vol. 35 (2),pp 1292-1299 , 2007, https://doi.org/https://doi.org/10.1016/j.enpol.2006.03.019 - ,
Children's education and home electrification: A case study in northwestern Madagascar ,Energ Policy , Vol. 39 (5),pp 2866-2874 , 2011, https://doi.org/https://doi.org/10.1016/j.enpol.2011.02.060 - ,
Estimating the economic impact of the broadband stimulus plan ,Report, Columbia Business School , 2009 - ,
Biogas Cook Stoves for Healthy and Sustainable Diets? A Case Study in Southern India, (in eng) ,Front. Nutr. , Vol. 2 ,pp 28 , 2015, https://doi.org/https://doi.org/10.3389/fnut.2015.00028 - ,
Links between energy access and food security in sub Saharan Africa: an exploratory review ,Food Secur. , 2016, https://doi.org/https://doi.org/10.1007/s12571-016-0570-1 - ,
Transforming Lives in Zimbabwe: Rural Sustainable Energy Development Project ,Oxfam , 2015 - ,
Solar pumping for irrigation: Improving livelihoods and sustainability ,IRENA , 2016 - ,
, World Food Programme, Energy for Food Security - Enhancing people's food security with improved energy access, Report, World Food Programme, Rome , 2019 - ,
, World Bank, Infrastructure services: The building blocks of development, Report, World Bank, Washington DC , 2003 - ,
, FAO, Energy-Smart Food at FAO: An Overview, Report, FAO, Rome , 2012 - ,
Africa Biogas Partnership Program: A review of clean cooking implementation through market development in East Africa ,Energy Sustain Dev, No. 46 ,pp 23-31 , 2018, https://doi.org/https://doi.org/10.1016/j.esd.2018.05.012 - ,
Rural energy in developing countries: A Challenge for Economic Development ,Annu Rev Energ Environ ,pp 34 , 1996, https://doi.org/https://doi.org/10.1146/annurev.energy.21.1.497 - ,
Evaluating benefits of low-cost household digesters for rural Andean communities ,Renew. Sust. Energ. Rev. , Vol. 16 (1),pp 575-581 , 2012, https://doi.org/https://doi.org/10.1016/j.rser.2011.08.023 - ,
Managing the food, water, and energy nexus for achieving the Sustainable Development Goals in South Asia ,Environ. Dev. , Vol. 18 ,pp 14-25 , 2016, https://doi.org/https://doi.org/10.1016/j.envdev.2015.12.001 - ,
E-Choupal: ITC´s rural networking project ,Report, Indian Institute of Management , - ,
Impact of solar photovoltaic lighting on indoor air smoke in off-grid rural Ghana ,Energy Sustain Dev , Vol. 12 , 2008, https://doi.org/https://doi.org/10.1016/S0973-0826(08)60419-6 - ,
A review of sustainable energy access and technologies for healthcare facilities in the Global South ,Sustainable Energy Technol. Assess. , Vol. 22 ,pp 92-105 , 2017, https://doi.org/https://doi.org/10.1016/j.seta.2017.02.022 - ,
Effect of reliable electricity on health facilities, health information, and child and maternal health services utilization: evidence from rural Gujarat, India ,J. Health Popul. Nutr. , Vol. 38 (7), 2019, https://doi.org/https://doi.org/10.1186/s41043-019-0164-6 - ,
Urban air pollution in Sub-Saharan Africa: Time for action ,Environ. Prot. , Vol. 220 ,pp 738-743 , 2016, https://doi.org/https://doi.org/10.1016/j.envpol.2016.09.042 - ,
Assessment of the Cambodian National Biodigester Program ,Energy Sustain Dev , Vol. 46 ,pp 11-22 , 2018, https://doi.org/https://doi.org/10.1016/j.esd.2018.06.008 - ,
A case study of the ethanol CleanCook stove intervention and potential scale-up in Ethiopia ,Energy Sustain Dev , Vol. 46 ,pp 53-64 , 2018, https://doi.org/https://doi.org/10.1016/j.esd.2018.06.009 - ,
Renewable Energy for Rural Schools ,Report, National Renewable Energy Laboratory, Colorado , 2000 - ,
Who Benefits Most from Rural Electrification? Evidence in India ,Energy J., No. 35, 2 ,pp 40 , 2012, https://doi.org/https://doi.org/10.5547/01956574.35.2.4 - ,
Long-Term Impacts of Household Electrification in Rural India - Policy Research Working Paper ,Report, World Bank , 2013, https://doi.org/https://doi.org/10.1596/1813-9450-6527 - ,
Does energy access help women? Beyond anecdotes: a review of the evidence ,Report, Ashden , 2012 - ,
Bringing Education by Television to Rural Areas: Mexico´s Telesecundaria ,TechKnowLogia , Vol. 29 , 1999 - ,
Renewable Energy Projects under the Clean Development Mechanism (CDM) ,Doctor of Philosophy , 2010 - ,
From candles to light: The impact of rural electrification ,Report, in IDB Working Paper Series , 2015 - ,
Education and the electrification of rural schools ,Report, in Technical Report, Smart Villages , 2017 - ,
Impacts of Solar PV on Teacher Satisfaction ,Report, University of Strathclyde, Malawi Renewable Energy Acceleration Programme, Glasgow , 2015 - ,
Consequences of deforestation for women´s time allocation, agricultural production and nutrition in hill areas of Nepal ,Report, International Food Policy Research Institute , 1988 - ,
MNEs' Contribution to Sustainable Energy and Development: the case of ‘Light for All' Program in Brazil, in Multinational Enterprises and Sustainable Development ,International Business and Management ,pp 195-224 , 2017, https://doi.org/https://doi.org/10.1108/S1876-066X20170000033010 - ,
Impact of a rural solar electrification project on the level and structure of women's empowerment ,Environ. Res. Lett. , Vol. 12 , 2017, https://doi.org/https://doi.org/10.1088/1748-9326/aa7f38 - ,
Impact of infrastructures on paid work opportunities and unpaid work burdens on rural women in Bangladesh ,J. Int. Dev. , Vol. 22 (7),pp 997-1017 , 2010, https://doi.org/https://doi.org/10.1002/jid.1607 - ,
Literature review on modeling and simulation of energy infrastructures from a resilience perspective ,Reliab. Eng. Syst. Saf. , Vol. 183 ,pp 360-373 , 2019, https://doi.org/https://doi.org/10.1016/j.ress.2018.11.029 - ,
Energy and communication infrastructure for disaster resilience in rural and regional Australia ,Reg. Stud. , Vol. 51 (6),pp 933-944 , 2016, https://doi.org/https://doi.org/10.1080/00343404.2016.1146403 - ,
Energy optimization of hybrid off-grid system for remote telecommunication base station deployment in Malaysia ,EURASIP J. Wirel. Comm. , Vol. 64 ,pp 1-15 , 2015, https://doi.org/https://doi.org/10.1186/s13638-015-0284-7 - ,
Ethnographies of electricity scarcity: mobile phone charging spaces and the recrafting of energy poverty in Africa ,Energ Buildings , 2019, https://doi.org/https://doi.org/10.1016/j.enbuild.2019.01.038 - ,
The nexus across water, energy, land and food (WELF): potential for improved resource use efficiency? ,Curr. Opin. Env. Sust. , Vol. 5 (6),pp 617-624 , 2013, https://doi.org/https://doi.org/10.1016/j.cosust.2013.11.002 - ,
Climate, land, energy and water (CLEW) interlinkages in Burkina Faso: An analysis of agricultural intensification and bioenergy production ,Nat. Resour. Forum , Vol. 36 , 2012, https://doi.org/https://doi.org/10.1111/j.1477-8947.2012.01463.x - ,
, International Energy Agency, Water-Energy Nexus, Report, IEA, Paris , 2017 - ,
Application of solar energy for water supply and sanitation in Arsenic affected rural areas: a study for Kaudikasa village, India ,J. Clean. Prod. , Vol. 60 ,pp 102-106 , 2013, https://doi.org/https://doi.org/10.1016/j.jclepro.2012.10.034 - ,
Exploitation of solar energy collected by solar stills for desalination by membrane distillatio ,Renew. Energy , Vol. 25 ,pp 293-305 , 2002, https://doi.org/https://doi.org/10.1016/S0960-1481(01)00058-1 - ,
Clean water using solar and wind: Outside the power grid ,IWA Publishing Knowledge Unlatched, London; Berlin , 2018, https://doi.org/https://doi.org/10.2166/9781780409443 - ,
Wastewater treatment high rate algal ponds for biofuel production ,Bioresour. Technol. , Vol. 102 ,pp 35-42 , 2011, https://doi.org/https://doi.org/10.1016/j.biortech.2010.06.158 - ,
Modern Energy: Impacts on Microenterprises ,Report, UK Department for International Development , 2003 - ,
Rural Electrification and Employment in Poor Countries: Evidence from Nicaragua ,World Development , Vol. 43 ,pp 252-265 , 2013, https://doi.org/https://doi.org/10.1016/j.worlddev.2012.09.002 - ,
, US AID, Powering tourism: Electrification and efficiency options for rural tourism facilities, Report , 2009 - ,
The impact of renewable energy structures on tourism ,Report, University of Stellenbosch, South Africa , 2013 - ,
Electronic banking for the poor – panacea, potential and pitfalls ,Small Enterprise Development , Vol. 15 (2004), , https://doi.org/https://doi.org/10.3362/0957-1329.2004.044 - ,
Grid Extension in Rural Benin: Micro-Manufacturers and the Electrification Trap ,World Development , Vol. 39 (5),pp 773-783 , 2011, https://doi.org/https://doi.org/10.1016/j.worlddev.2010.09.015 - ,
Does electrification cause industrial development? Grid expansion and firm turnover in Indonesia ,Report, International Growth Care , 2018 - ,
The relationship between energy and production: Evidence from Turkish manufacturing industry ,Energ Econ , Vol. 29 ,pp 1151-1165 , 2007, https://doi.org/https://doi.org/10.1016/j.eneco.2006.05.019 - ,
Causes and Effects of Frequent and Unannounced Electricity Blackouts on the Operations of Micro and Small Scale Industries in Kumasi ,J. Sustain. Dev. , 2012, https://doi.org/https://doi.org/10.5539/jsd.v5n2p17 - ,
Electricity consumption and industrial production in Nigeria ,J. Pol and Dev. Stud. , Vol. 10 (2), 2016, https://doi.org/https://doi.org/10.12816/0028342 - ,
Electricity provision and industrial development: Evidence from India ,J. Dev. Econ. , Vol. 97 (2),pp 352-367 , 2012, https://doi.org/https://doi.org/10.1016/j.jdeveco.2011.06.010 - ,
Impacts of Electricity Access to Rural Enterprises in Bolivia, Tanzania and Vietnam ,Energy Sustain Dev , Vol. 14 (1),pp 14-21 , 2010, https://doi.org/https://doi.org/10.1016/j.esd.2009.12.004 - ,
Eco-Industrial Park (EIP) Development in Viet Nam: Results and Key Insights from UNIDO's EIP Project (2014–2019) ,Sustainability , Vol. 11 (17), 2019, https://doi.org/https://doi.org/10.3390/su11174667 - ,
Alessandro Flammini, and Leisa Burrell, Eco-Industrial Parks: Achievements And Key Insights From The Global RECP Programme 2012 – 2018 ,Report, UNIDO , 2019 - ,
Analysis Of Telecom Base Stations Powered By Solar Energy ,IJSTR , Vol. 3 (4), 2014 - ,
Information and Communication Technology for Rural Development ,J. Comput. Inf. Sci. Eng. , Vol. 4 (5), 2012 - ,
Imroving rural mobility: Options for developing motorized and nonmotorized transport in rural areas ,Report, The World Bank, Washington DC, 2002 , , https://doi.org/https://doi.org/10.1596/0-8213-5185-0, World Bank Technical Paper 525 - ,
Public Transport in Developing Countries ,Emerald Group Publishing Limited , 2005, https://doi.org/https://doi.org/10.1108/9780080456812 - ,
Delivering on sustainable infrastructure for better development and better climate ,Report , 2016 - ,
Transport in Developing Countries: Renewable Energy versus Energy Reduction? ,Transp. Rev. , Vol. 25 (6),pp 719-738 , 2005, https://doi.org/https://doi.org/10.1080/01441640500361066 - ,
, Food and Agriculture Organization of the United Nations, How access to energy can influence food losses: A brief overview, Report, Food and Agriculture Organization of the United Nations, Rome , 2016 - ,
, WISIONS of sustainability, Powering milk chilling units with biogas , https://www.wisions.net/projects/powering-milk-chilling-units-with-biogas, Accessed: 13-Mar-2020 - ,
Returns to Investment in Reducing Postharvest Food Losses and Increasing Agricultural Productivity Growth ,Report, Copenhagen Consensus Centre , 2015 - ,
, HLPE, Food losses and waste in the context of sustainable food systems A report by the High Level Panel of Experts on Food Security and Nutrition, Report, High Level Panel of Experts on Food Security and Nutrition of the Committee on World Food Security, Rome , 2014 - ,
Postharvest technology for developing countries: challenges and opportunities in research, outreach and advocacy ,J. Sci. Food Agric. , Vol. 91 ,pp 597-603 , 2011, https://doi.org/https://doi.org/10.1002/jsfa.4295 - ,
The Impact of Rural Electric Access on Deforestation Rates ,World Development , 2017, https://doi.org/https://doi.org/10.1016/j.worlddev.2016.12.046 - ,
Role of renewable energy technologies in rural communities' adaptation to climate change in Nepal ,Renew. Energy , Vol. 68 ,pp 793-800 , 2014, https://doi.org/https://doi.org/10.1016/j.renene.2014.03.003 - ,
Changing energy profiles and consumption patterns following electrification in five rural villages ,South Africa, Energ Policy , Vol. 34 ,pp 4081-4092 , 2006, https://doi.org/https://doi.org/10.1016/j.enpol.2005.10.011 - ,
Integrating bioenergy and food production on degraded landscapes in Indonesia for improved socioeconomic and environmental outcomes ,Food Energy Secur. , 2019, https://doi.org/https://doi.org/10.1002/fes3.165 - ,
Electrification and Deforestation ,5th FAERE Annual Conference , 2018 - ,
Working paper: Agricultural productivity and deforestation in Brazil ,Report, INPUT, Climate Policy Initiative , 2016 - ,
Sustainable urban infrastructure for all: Lessons on solar-powered street lights from Kampala and Jinja, Uganda ,Report, Coalition for Urban Transitions, Washington DC , 2019 - ,
Estimating the Value of Improved Street Lighting: A Factor Analytical Discrete Choice Approach ,Urban Stud. , Vol. 42 (12),pp 2289-2303 , 2005, https://doi.org/https://doi.org/10.1080/00420980500332106 - ,
Urban Infrastructure Design and Pedestrian Safety in the Kumasi Central Business District ,Ghana, J. Transp. Saf. Secur. , Vol. 6 (3),pp 235-256 , 2014, https://doi.org/https://doi.org/10.1080/19439962.2013.861887 - ,
Prioritising redundant network component for HOWBAN survivability using FMEA ,Wirel. Commun. Mob. Comput. , 2017, https://doi.org/https://doi.org/10.1155/2017/6250893