


COVID-19 (coronavirus disease of 2019) is a highly infectious virus that, in rare cases, causes serious respiratory illness. As of September 26, 2021, there had been 230.42 million confirmed cases of infection and 4.72 million deaths worldwide [1]. In Japan, there had been 1.69 million confirmed cases and 17,375 deaths [1]. The initial outbreak of COVID-19 in Japan followed the first confirmed case on January 14, 2020. The national government issued a state of emergency from April 7 to May 25, 2020, to slow down the infection spreading. The state of emergency was first issued locally, targeting specific areas with large numbers of infected people, before gradually becoming a nationwide measure. During the state of emergency, non-essential activities were limited, and city functions were shut down to achieve the national goal of "reducing persons’ contact opportunities by 80%" [2]. The national government also proposed lifestyle changes to prevent the spread of infection, such as avoiding the “three Cs” (crowded places, close-contact settings, and confined and enclosed spaces) [2]. Strong promotion of remote working and rotational shifts was required to achieve the national goal of "reducing the number of employees working physically at workplaces by 70%" [2]. Under these circumstances, the number of infected people has decreased thanks to the efforts of the government, businesses, and the public. Finally, the state of emergency was lifted until May 25, 2020. The country experienced a second COVID-19 outbreak in August 2020 and a third wave of cases in November 2020, which was ongoing as of February 9, 2021, at the time of writing. The number of infected people is expected to reduce gradually while continuing to fluctuate incrementally.
The time spent at home increased significantly with the state of emergency, largely due to remote working. According to a questionnaire survey conducted by Values Inc. [3] in August 2020, approximately 70% of respondents answered that their time at home increased after the first COVID-19 outbreak compared to their situation in February 2020. In another questionnaire survey conducted by Persol Research and Consulting Co. [4] in November 2020, many respondents answered that they continued to work remotely even after the end of the initial state of emergency. The reports suggest that the lifestyle changes brought about by the state of emergency persist even after its declared end. The national government had promoted remote working as part of measures for climate change mitigation even before the COVID-19 pandemic; introducing remote working might reduce electric power consumption by 14% per person [5]. However, working in an office setting was common in Japan, and remote working was not widespread in most companies.
Remote working may increase working hours and time spent conducting various home activities, e.g., cooking or watching television, due to eliminating commuting time. These activities often involve the use of consumer durables, including computers, television sets, and room lighting leading to an increase in energy consumption. Considering these factors, examining how increased time spent at home through remote working affects energy consumption is difficult unless one also accounts for changes to the population's home lifestyle. However, the estimation mentioned above by the Japan Ministry of the Environment [5] only estimates work-related power-consumption changes and does not consider changes in other home activities.
This study aims to clarify the impact of the increase in time spent at home on energy consumption at home as a result of the COVID-19 pandemic. This study takes Kobe city as a case study, estimating daily household energy consumption rates based on changes in lifestyle and daily routine before and after the initial state of emergency. Kobe’s population was approximately 1.52 million in 2020 [6]. In Kobe city, there had been 26,725 confirmed cases and 607 deaths [7] as of September 26, 2021. The city’s first state of emergency was enforced between April 7 and May 14. At the beginning of the state of emergency, there were about 68 confirmed cases, and the increase rate of confirmed cases was 21% [7]. Near the end of the state of emergency, the number of confirmed cases was around 280, while the rate of increase in such cases dropped to 0.7% [7]. Ideally, data that directly measure household energy consumption, e.g., power consumption, would be useful for a study of this nature. However, sufficient actual measurement data were unavailable as of February 2021 when this paper was written. This study created household models considering the age of the head of household, the number of household members, the total floor area, the number of consumer durables possessed, and their usage time to estimate the energy consumption.
To date, there have been several studies on COVID-19 and energy consumption. Bahmanyar et al. [8] indicated that different lockdown measures in European countries and their effects on population activities have considerably changed the consumption profiles. Javier and Sungmin [9] reported that the cumulative decline in electricity consumption within the 5 months following the stay-home orders ranges between 3% and 12% in the most affected EU countries and USA states, except Florida. Kawka and Cetin [10] indicated increased electricity use during periods when occupants would usually be away from home during the COVID-19 pandemic in the United States. Abdeen et al. [11] found that average household daily electricity consumption increased by about 12% in 2020 relative to 2019 in Ottawa, Canada. Rouleau and Gosselin [12] confirmed that overall household energy consumption increased according to the COVID-19 lockdown measures in Quebec City, Canada. Wang et al. [13] conducted a simulation approach to investigate electricity consumption according to the COVID-19 outbreak in China. Kang et al. [14] indicated that the energy consumption in most facilities has tended to decrease while energy consumption in residential facilities increased during COVID-19 in South Korea. Jiang et al. [15] discussed that the pandemic situation offers five energy opportunities for better future development related to energy: enhancement of digitalisation, new lifestyles with lower energy usage, resilience enhancement with Circular Economy, opportunities for renewables and energy storage, and fighting infectious diseases and saving energy. Beyer et al. [16] also discussed that without effectively reducing the risk of a COVID-19 infection, voluntary mobility reductions would hence prevent a return to full economic potential even when restrictions are relaxed. Santiago et al. [17] conducted a detailed analysis of how confinement measures for the COVID-19 have modified the electricity consumption in Spain. Bienvenido-Huertas [18] also analysed the effectiveness of unemployment benefits and social measures for the unemployed according to the serious economic crisis induced by the COVID-19 in Spain. Mokhtari and Jahangir [19] built a model of a university building that minimizes population density (energy consumption) and the infection risk of COVID-19. Jiang et al. [15] provided an overview of COVID-19 pandemic-induced changes in energy supply and demand worldwide and proposed how to utilize energy after its conclusion. Cihan [20] examined how the lockdowns during the COVID-19 pandemic affected the amount of electricity and natural gas consumption in four organized industrial zones in Turkey. Hartono et al. [21] assessed how the COVID-19 and its stimulus policy will affect the macroeconomic indicator, energy consumption, and emissions at the national and regional levels in Indonesia using a computable general equilibrium model.
The present study focused on a smaller scale, estimating the impacts of changes in working and lifestyle behaviors at home associated with COVID-19 on energy consumption. The study provides a novel perspective by clarifying the impacts of COVID-19-related measures such as remote working on household energy consumption.
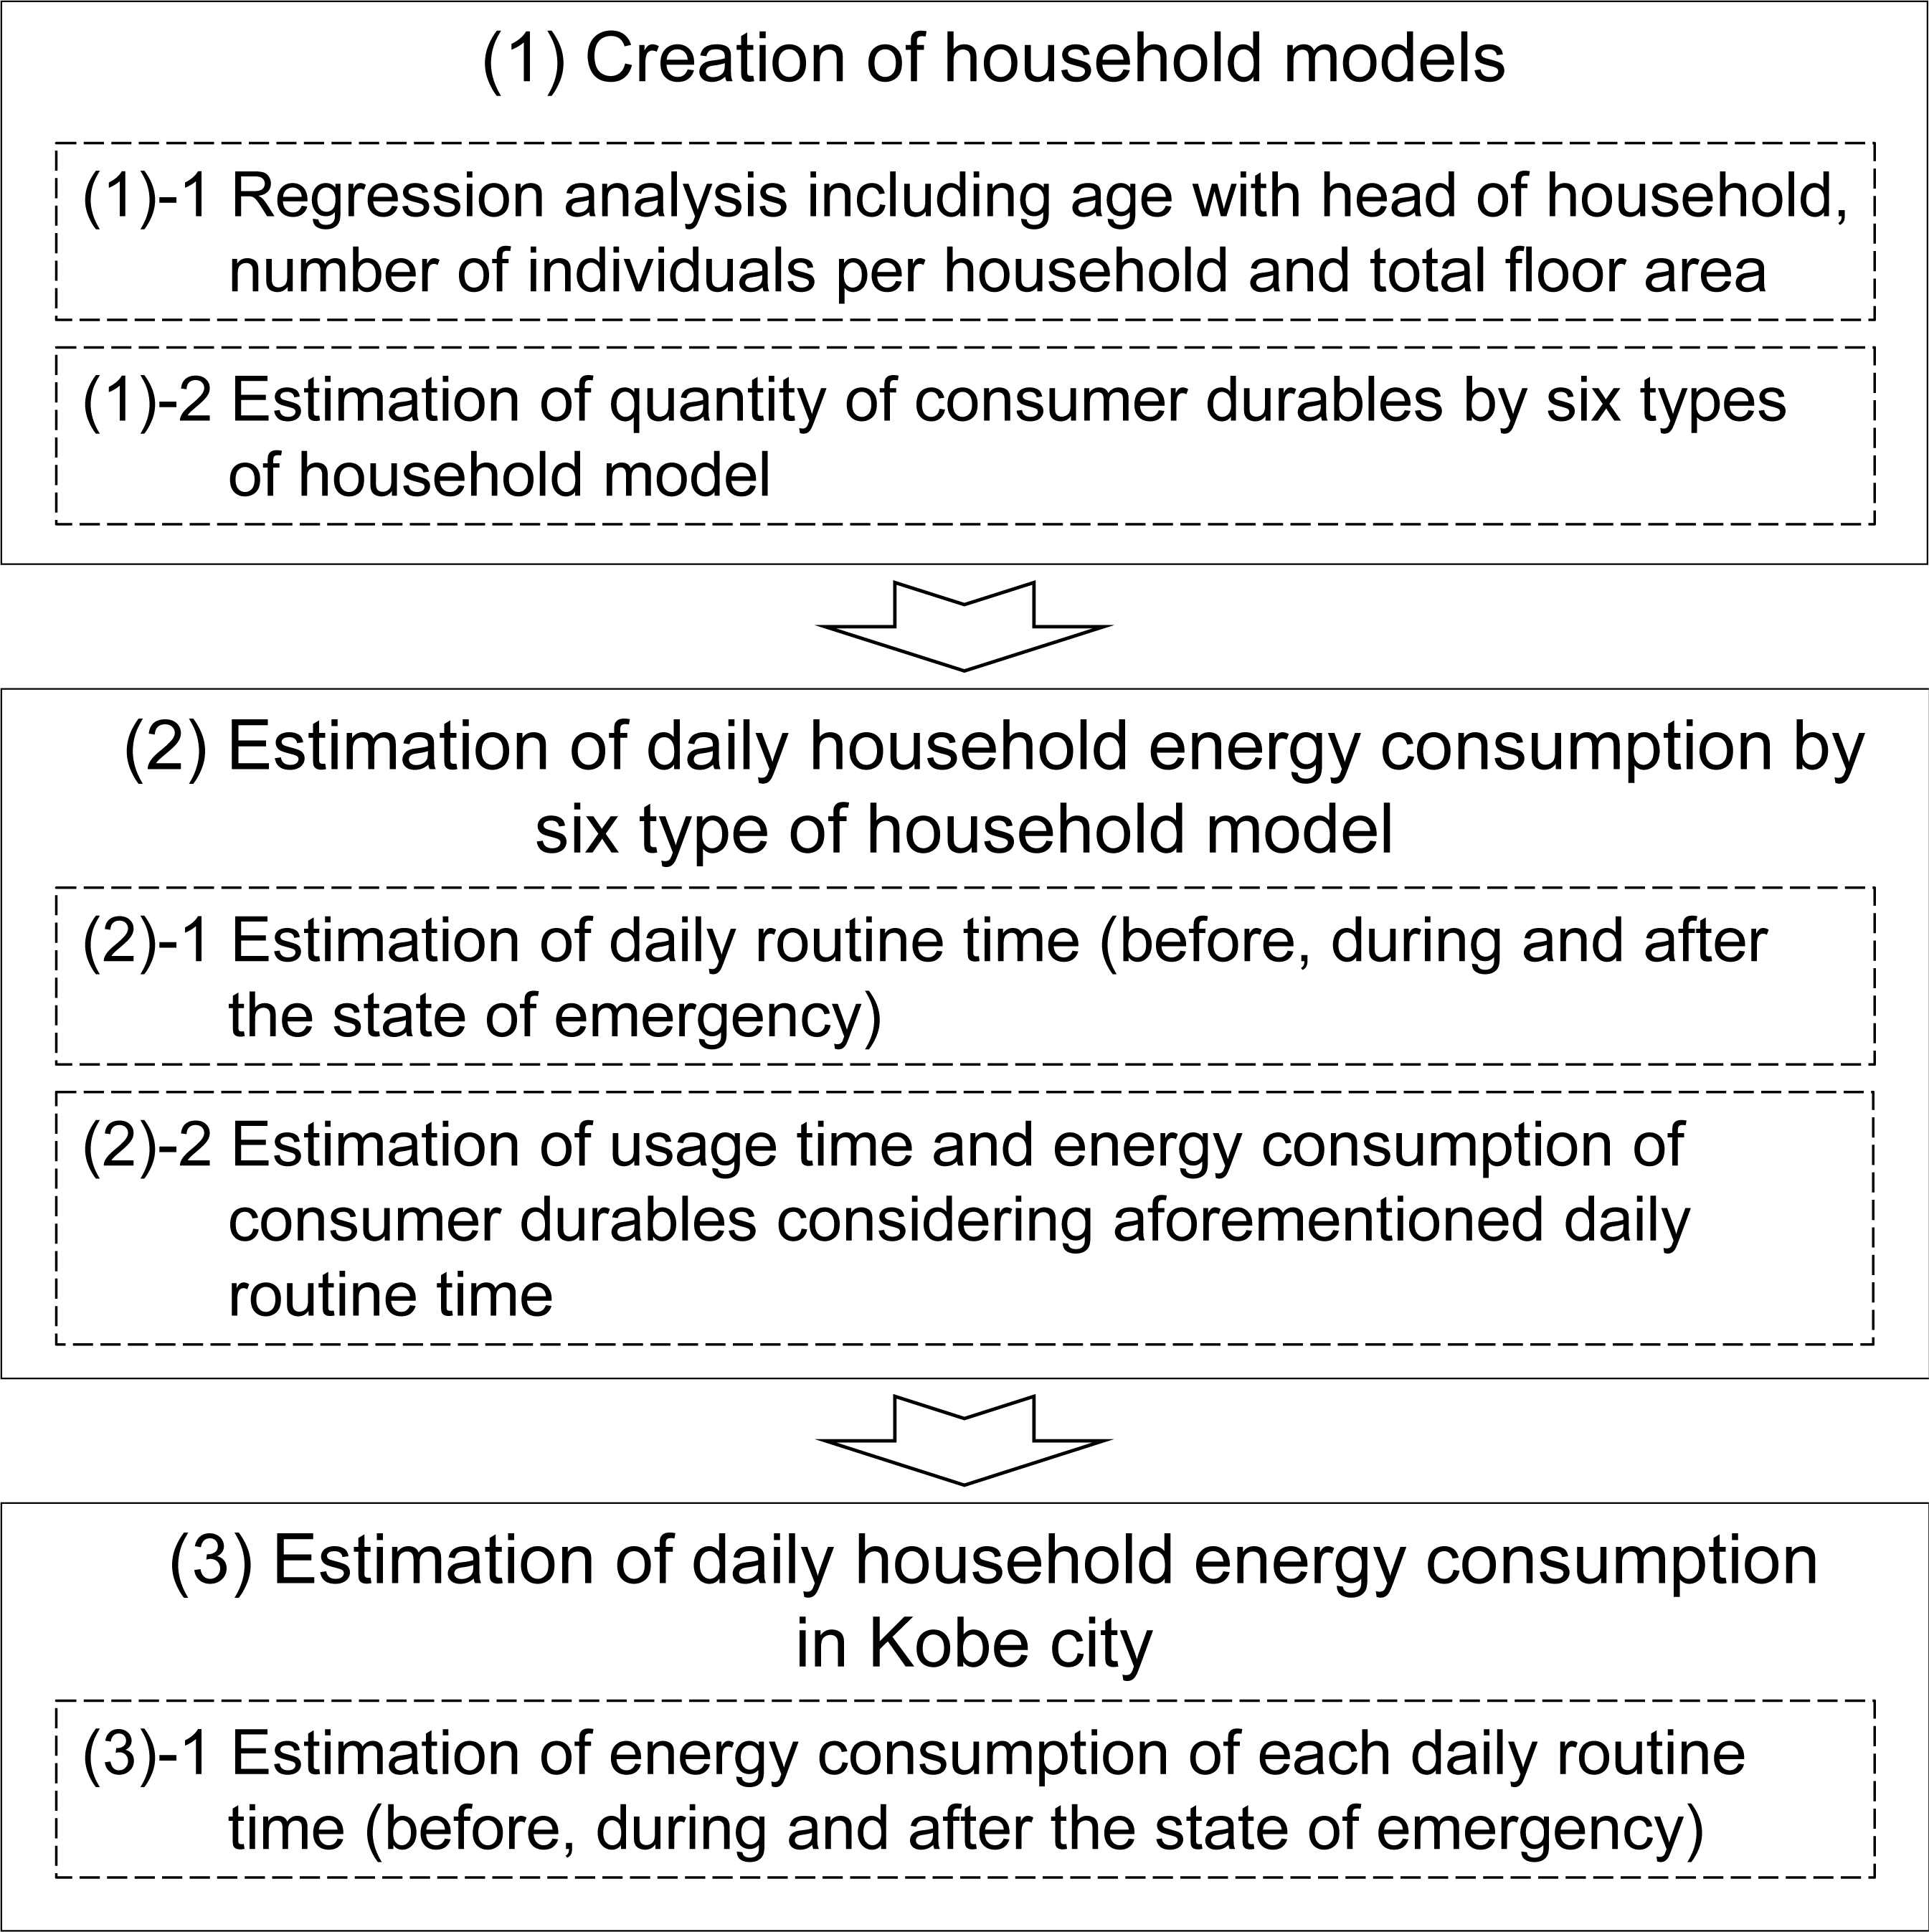
Figure 1 shows the steps used in this study to estimate household energy consumption. First, six types of household models were created by relating the number of consumer durables to the age group of the head of household, household floor area, and the number of individuals. Second, an estimated daily household energy consumption for each household model type was obtained using estimated daily routine time at home and, with it, estimated usage time of consumer durables, both before and after the state of emergency. Finally, the daily household energy consumption of Kobe was estimated as a whole.
This study assumed that factors for the household models consisted of the number of individuals per household, the age of the head of household, and the total floor area. These factors contribute to estimations of the number of consumer durables possessed by each household model and their usage time necessary for estimating household energy consumption. The numbers of individuals per household, considering the age group of heads of household and total floor area, were adopted from the data listed in the national statistics [22]. This study classified the household models into six types based on the age of the head of household (24 years and under, 25‒34 years, 35‒44 years, 45‒54 years, 55‒64 years, and 65 years and over).
Study methodology
A regression analysis was conducted to estimate the number of consumer durables possessed by each household model. Then the total floor area was set as the objective variable. The age and number of individuals per household and the age of each head of household were set as explanatory variables.
Table 1, targeting consumer durables, contains 35 different types of durable consumer products selected based on Inaba et al. [23]. The number of consumer durables possessed by total floor area was also estimated based on results from the questionnaire on energy use conducted by Inaba et al. [23].
Target consumer durables
Household equipment(10 types) |
Induction heat (IH) cooking heater, toilet with warm flushing water, floor heater (electric, electric hot water, and gas hot water), electric water boiler, gas water boiler, oil water boiler, central heating and cooling, built-in stovetop |
Household durables(18 types) |
Microwave oven, rice cooker, refrigerator (<300 L and ≥300 L), clothes washer (combination washer/dryer, drum type, automatic, twin tub, etc.), vacuum cleaner, dishwasher, air conditioner (<21.9 m2 and ≥21.9 m2), heater (electric, city gas, liquid petroleum gas (LPG), oil burning, etc.), kotatsu (under-the-table heater), air purifier, central air conditioner |
Indoor devices and decorative items (4 types) |
Fluorescent lighting, light-emitting diode (LED) ceiling lighting, incandescent lighting, fluorescent light bulb |
Educational and recreational durables (3 types) |
Television, personal computer (PC), video recorder |
The daily household energy consumption of the six types of household models was estimated using the following formula:
(1)
where E is household energy consumption per household [MJ/household], C is the power consumption of the consumer durables [kW/unit], P is the number of consumer durables [unit/household], U is the usage time of the consumer durables in the household [h], J is the secondary energy conversion [MJ/kWh], and subscript x identifies the type of consumer durable.
The unit power consumption of consumer durables was adopted from the results of Inaba et al. [23]. The amount of time spent at home before and after the state of emergency was specified as explained below.
The amount of time spent at home for each age group before the state of emergency was adopted from a NHK Broadcasting Culture Research Institute [24] survey report. This questionnaire survey divided one day into 15-minute intervals, categorized how each time interval was spent into one of 28 categories, and measured the findings against respondents’ age groups.
The rate of change of daily routine time at home before and during the state of emergency was calculated based on a questionnaire survey conducted by the Japan Ministry of Land, Infrastructure, Transport and Tourism [25].
The survey was conducted in August 2020; its results are shown in Table 2. It asked respondents about changes in their daily routine time that occurred as the state of emergency came into effect. Respondents into remote workers and non-workers were also classified. The total daily routine time did not reach 24 hours because some daily routines, such as going outside, were excluded. The daily routine time under the state of emergency was calculated by multiplying the daily routine time before the state of emergency by the rate of change from Table 2. In the survey, workers and students were classified as remote workers and homemakers − as non-workers.
Daily routine time at home before and during the state of emergency; source: [15]
Remote workers |
Non-workers (homemakers, etc.) |
|||||
|---|---|---|---|---|---|---|
(1) Before the state of emergency [h] |
(2) During the state of emergency [h] |
Rate of change ((2)/(1)) [‒] |
(3) Before the state of emergency [h] |
(4) During the state of emergency [h] |
Rate of change ((4)/(3)) [‒] |
|
Sleep |
7.5 |
7.9 |
1.05 |
8 |
8.2 |
1.02 |
Eating |
1.3 |
1.6 |
1.24 |
1.6 |
1.8 |
1.07 |
Work and education |
3.1 |
6.6 |
2.12 |
0.4 |
0.6 |
1.48 |
Cooking, cleaning |
1.6 |
1.9 |
1.16 |
3.5 |
3.7 |
1.05 |
Relaxing |
3.2 |
4.2 |
1.29 |
7.8 |
8.4 |
1.08 |
Miscell-aneous |
0.15 |
0.20 |
1.27 |
0.280 |
0.282 |
1.01 |
Total |
16.9 |
22.3 |
1.32 |
21.6 |
22.9 |
1.06 |
Next, the consumer durables used for each routine were classified and daily usage time for each consumer durables was specified based on the daily routine time. For example, the routine “work and education” was set for remote working and online lessons with PCs and lighting listed as consumer durables. This study assumed that no remote working and online lessons were conducted at home before the state of emergency, setting the usage time as 0 hours. This study assumed that daily routine time for working and education determined the usage time of the PCs. In the case of a multi-person household, this study was assumed that there were several PCs present: a PC used by one parent for remote working and by one child for online lessons.
This study assumed that no heating equipment was used during the emergency. This is because the average daily temperature in Kobe city during this period never fell below 10°C and the number of days heating was used was set to 0 days. Based on this assumption, this study also assumed that no heating was used both before and after the state of emergency.
The daily household energy consumption in Kobe as a whole was estimated by multiplying the daily household energy consumption in each household model by the number of households in Kobe city. Table 3 shows the number of households in Kobe city, segregated by the age of the head of household. The households were divided into remote-working households and non-remote-working households, considering that not all households work remotely. The daily routine time before the state of emergency was applied for the remote-working households and the daily routine time during the state of emergency was applied for the non-remote-working households. Criteria for remote-working and non-remote-working households were obtained from the results of a Persol Research Institute [4] survey. According to this survey, the national average remote working implementation rate was 27.9% in April and 24.7% in November 2020. The November rate was considered in the estimation of household energy consumption after the state of emergency. This study additionally assumed that heating was not used after the state of emergency.
Number of households; source: [6]
Age group of head of household |
Number of households |
Age group of head of household |
Number of households |
|---|---|---|---|
24 years or under |
32,364 |
45‒54 years |
113,841 |
25‒34 years |
70,324 |
55‒64 years |
111,113 |
35‒44 years |
108,207 |
65 years and above |
253,818 |
The following equation was obtained by the multiple regression analysis:
(2)
where Y is the total floor area [m2], x1 is the age of the household head [years], and x2 is the number of individuals per household [persons].
The modified multiple correlation coefficient, which represents how well the objective variable can be predicted from the equation, was 0.997. The modified coefficient of determination, by which the objective variable is predictable from explanatory variables, was 0.994. The Durbin-Watson statistic indicating whether the error term has autocorrelation was 2.247. If this index is close to 2, the result is judged to have no autocorrelation. This result indicated that there was no autocorrelation. The t-value, which measures the size of the difference relative to the variation, was 2 or more for all variables, which was a significant result. Significance was observed at a level of 5% with p-values, which investigate the result of hypothesis testing, of less than 0.05 for all variables. The tolerance, which is an index for detecting multicollinearity between explanatory variables, was 0.1 or more. This result indicated that there was no multicollinearity between explanatory variables. Based on the above results, the regression equation was considered to be valid.
Table 4 shows the six household model types that were created. The number of individuals per household was rounded to the nearest integer. As there was, on average, only one person present where the head of the household was aged 24 years or under, this type was set as a single-person household. As there were, on average, two people present for those aged 25‒34 years, 55‒64 years, and 65 years and above, these types were set as two-person households consisting of a couple, both the same age. Households with their heads aged 35‒44 years and 45‒54 years had three members, with these types set as three-person households consisting of a couple of the same age and a teenaged child. In each household model, both the number of consumer durables possessed and their usage time were estimated. Table 5 shows an example of the results regarding the quantity and usage time of the main consumer durables. The usage time of PCs during the state of emergency was considerably long, reflecting an increase in remote working and online lessons.
The six types of household models
Age group of head of household |
Number of individuals per household |
Total floor area [m2] |
|---|---|---|
24 years or under |
1 |
27.01 |
25‒34 years |
2 |
50.05 |
35‒44 years |
3 |
77.11 |
45‒54 years |
3 |
83.91 |
55‒64 years |
2 |
87.44 |
65 years and above |
2 |
86.34 |
Quantity and usage time of main consumer durables
Electric water boiler |
Vacuum cleaner |
Television |
Personal computer |
|||
|---|---|---|---|---|---|---|
Rated power consumption [W] |
3,422 |
550 |
90 |
16.84 |
||
24 years or under |
Quantity (mean) [items] |
0.33 |
1.12 |
1.10 |
1.33 |
|
Daily usage time |
Before the state of emergency |
22 min |
1 min |
1 h 37 min |
0 min |
|
During the state of emergency |
25 min |
1 min |
2 h 5 min |
6 h 1 min |
||
25‒34 years |
Quantity (mean) [items] |
0.26 |
1.32 |
1.57 |
1.69 |
|
Daily usage time |
Before the state of emergency |
51 min |
4 min |
2 h 11 min |
0 min |
|
During the state of emergency |
58 min |
4 min |
2 h 48 min |
11 h 41 min |
||
35‒44 years |
Quantity (mean) [items] |
0.22 |
1.36 |
1.73 |
1.90 |
|
Daily usage time |
Before the state of emergency |
1 h 17 min |
11 min |
2 h 37 min |
0 min |
|
During the state of emergency |
1 h 28 min |
12 min |
3 h 22 min |
17 h 39 min |
||
45‒54 years |
Quantity (mean) [items] |
0.34 |
1.41 |
1.90 |
1.80 |
|
Daily usage time |
Before the state of emergency |
1 h 17 min |
16 min |
3 h |
0 min |
|
During the state of emergency |
1 h 28 min |
18 min |
3 h 52 min |
17 h 34 min |
||
55‒64 years |
Quantity (mean) [items] |
0.34 |
1.41 |
1.90 |
1.80 |
|
Daily usage time |
Before the state of emergency |
1 h 17 min |
16 min |
3 h |
0 min |
|
During the state of emergency |
1 h 28 min |
18 min |
3 h 52 min |
17 h 34 min |
||
65 years and above |
Quantity (mean) [items] |
0.34 |
1.41 |
1.90 |
1.80 |
|
Daily usage time |
Before the state of emergency |
47 min |
20 min |
4 h 21 min |
0 min |
|
During the state of emergency |
54 min |
23 min |
5 h 36 min |
5 h 27 min |
||
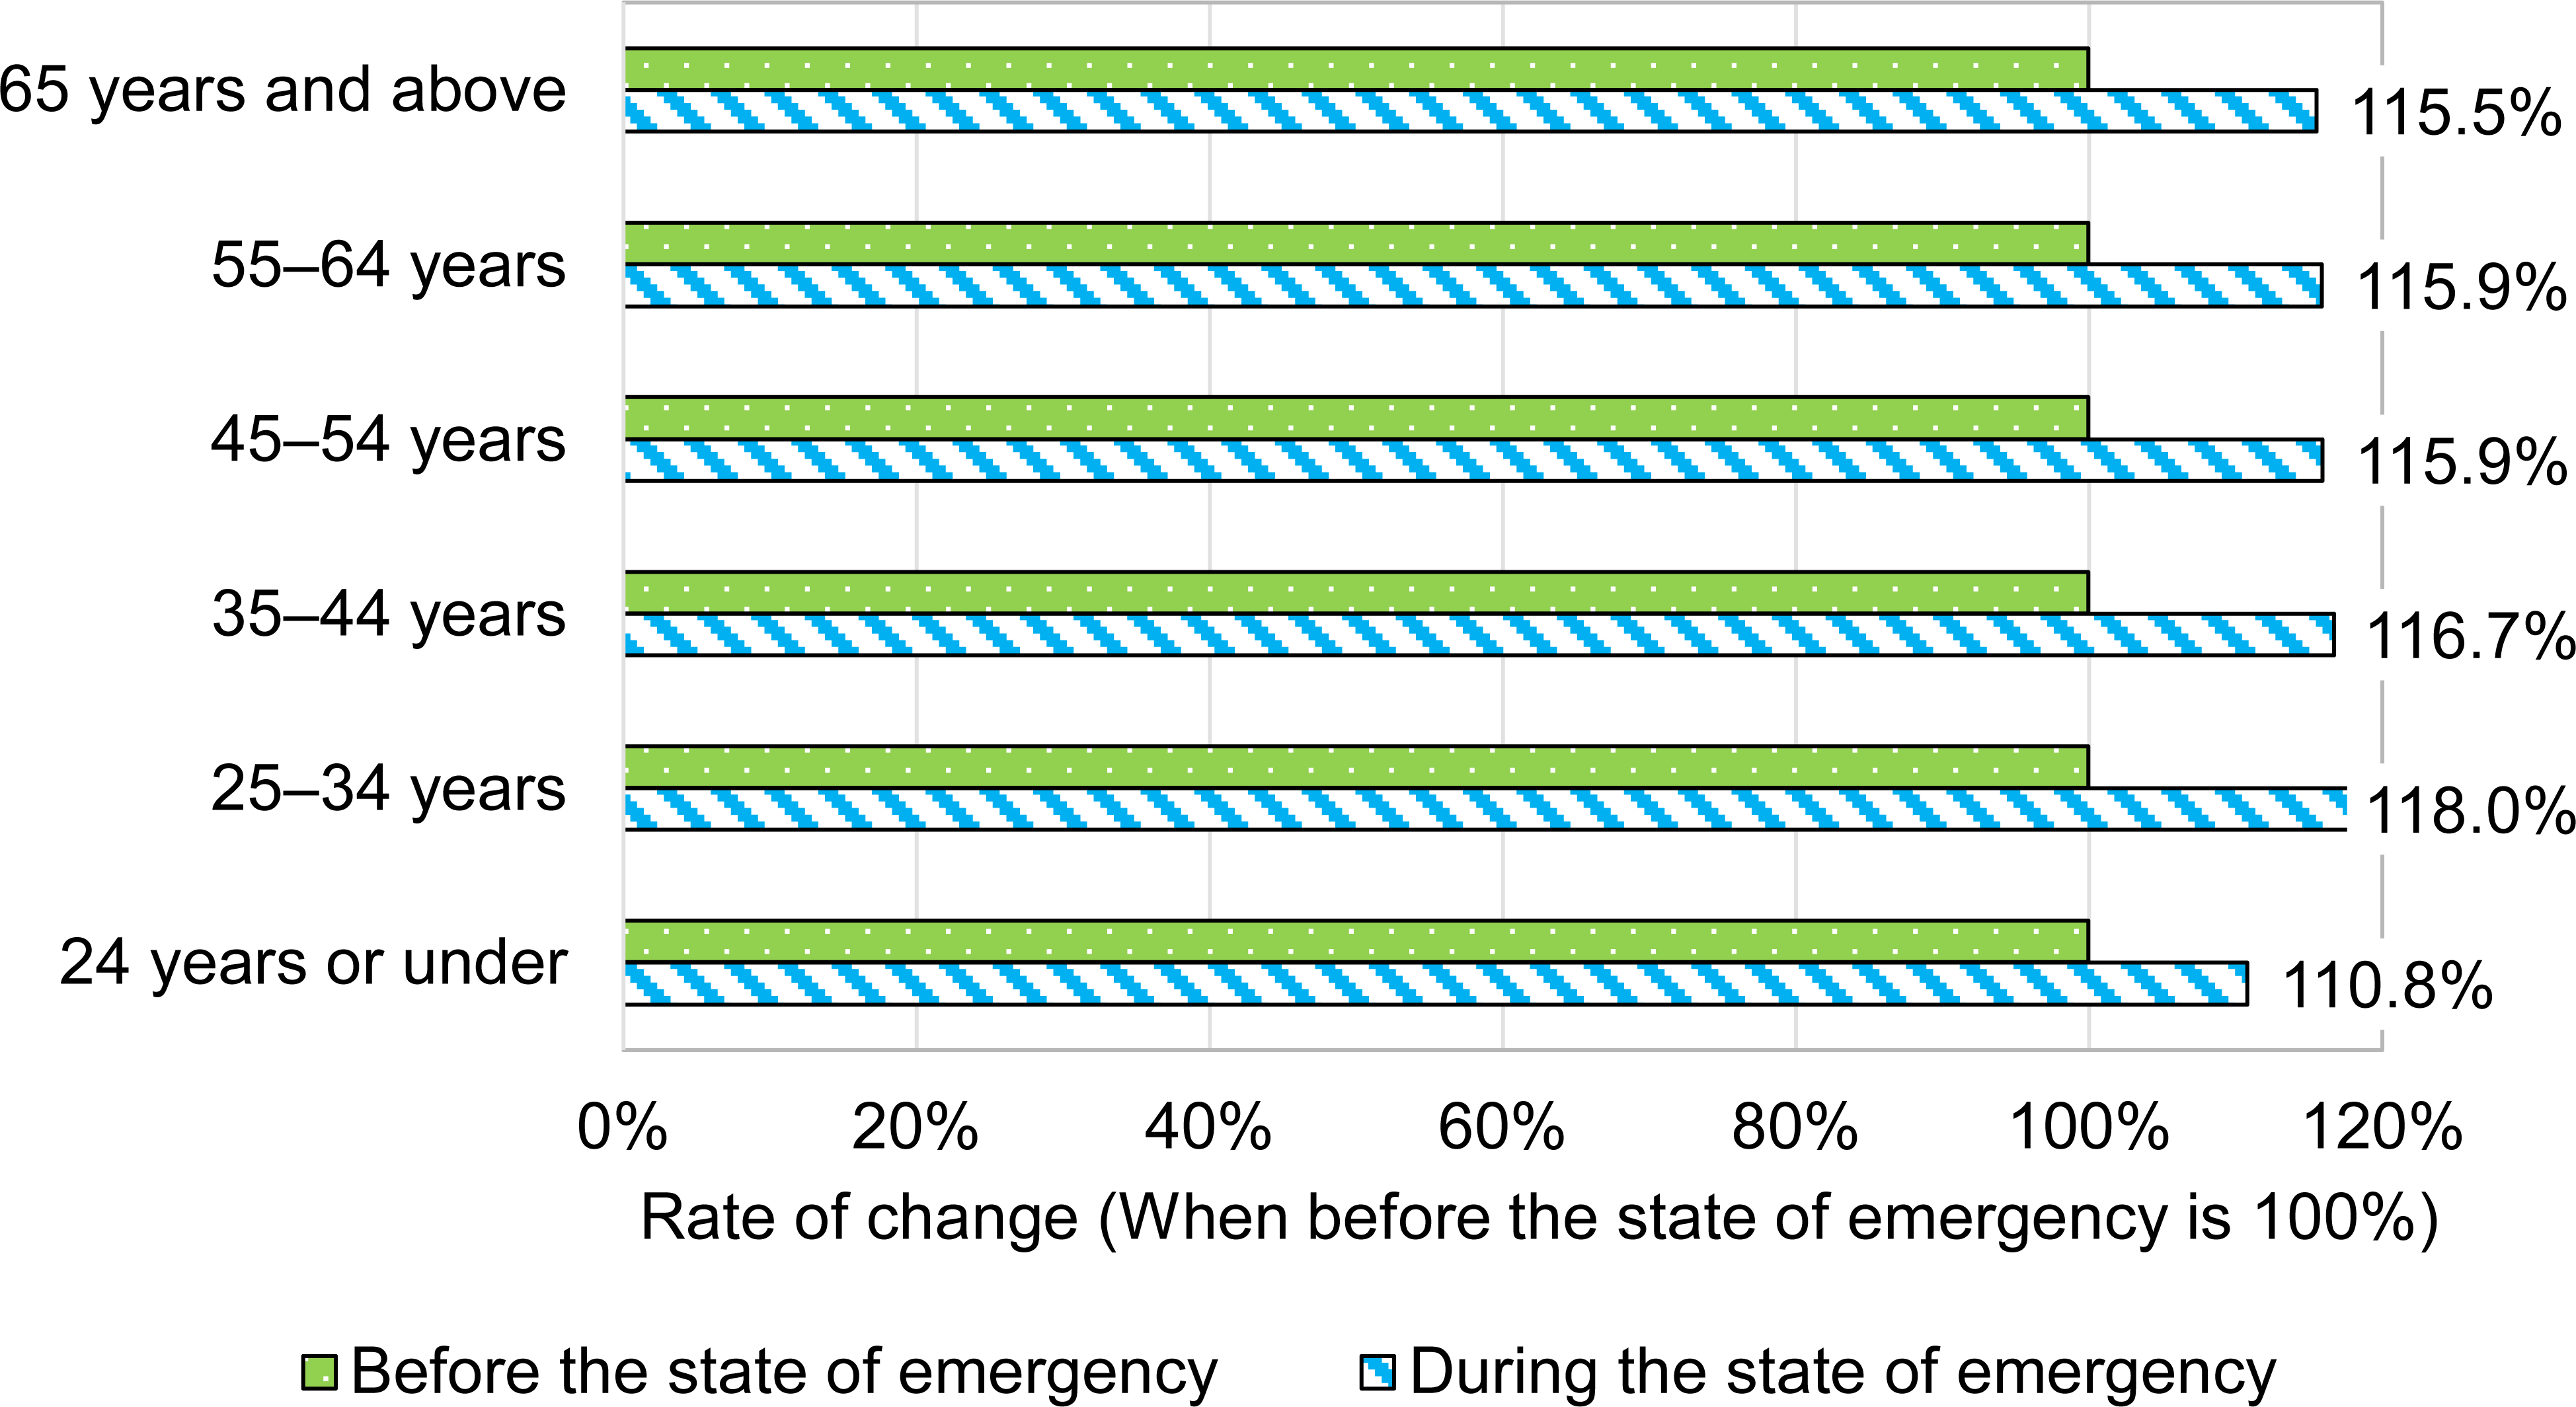
Figure 2 and Table 6 show the results of daily household energy consumption for each household model. This graph expresses the rate of change after the state of emergency, with consumption before the state of emergency set at 100%. The results revealed that daily household energy consumption increased with changes in daily routine time for all age groups. According to the results, the age groups with a larger number of individuals per household consumed more energy, excepting the result of 25‒34 years. The lowest rate of change for 24 years or under age group is presumed that they have only one resident and spend less time using PC and lighting. The highest rate of change for 25‒34 years age group is presumed that they have two residents using PCs and lights for extended periods for teleworking. The rate of change in the 65-and-above age group was slightly lower than that of the 55‒64 group. This may be because residents in the former age group are likely to be retired and thus may have had a higher level of home activity before the state of emergency than other age groups. However, the aforementioned rate of change in daily household energy consumption between before the state of emergency and during the state of emergency was 14 to 17% in all age groups, which was not a big change.
Daily household energy consumption by each household model
Daily household energy consumption by each household model
Age group of head of household |
Before the state of emergency [MJ/household] |
During the state of emergency [MJ/household] |
Rate of change |
|---|---|---|---|
24 years or under |
1 |
27.01 |
110.8 % |
25‒34 years |
2 |
50.05 |
118.0 % |
35‒44 years |
3 |
77.11 |
116.7 % |
45‒54 years |
3 |
83.91 |
115.9 % |
55‒64 years |
2 |
87.44 |
115.9 % |
65 years and above |
2 |
86.34 |
115.5 % |
The reason for this result is the assumption of no energy consumption for cooling or heating because the first state of emergency was implemented in the spring season. The second and subsequent emergency declarations were implemented during the winter and summer seasons, and analysing the impact of stay homes in these seasons is the future task.
Figure 3 shows the results of the breakdown of daily household energy consumption by dividing it into domestic hot water, kitchen use, appliances, and lighting. In all age groups, the energy consumption associated with domestic hot water exceeded 80% of the total, with no significant change in this figure once the state of emergency was declared. The major changes in consumption were related to appliances and lighting, which may have been due to an increase in remote working. Another possible reason is that the excess time spent watching television and cleaning rooms using vacuum cleaners contributed to increased consumption.
Breakdown of daily household energy consumption by household models
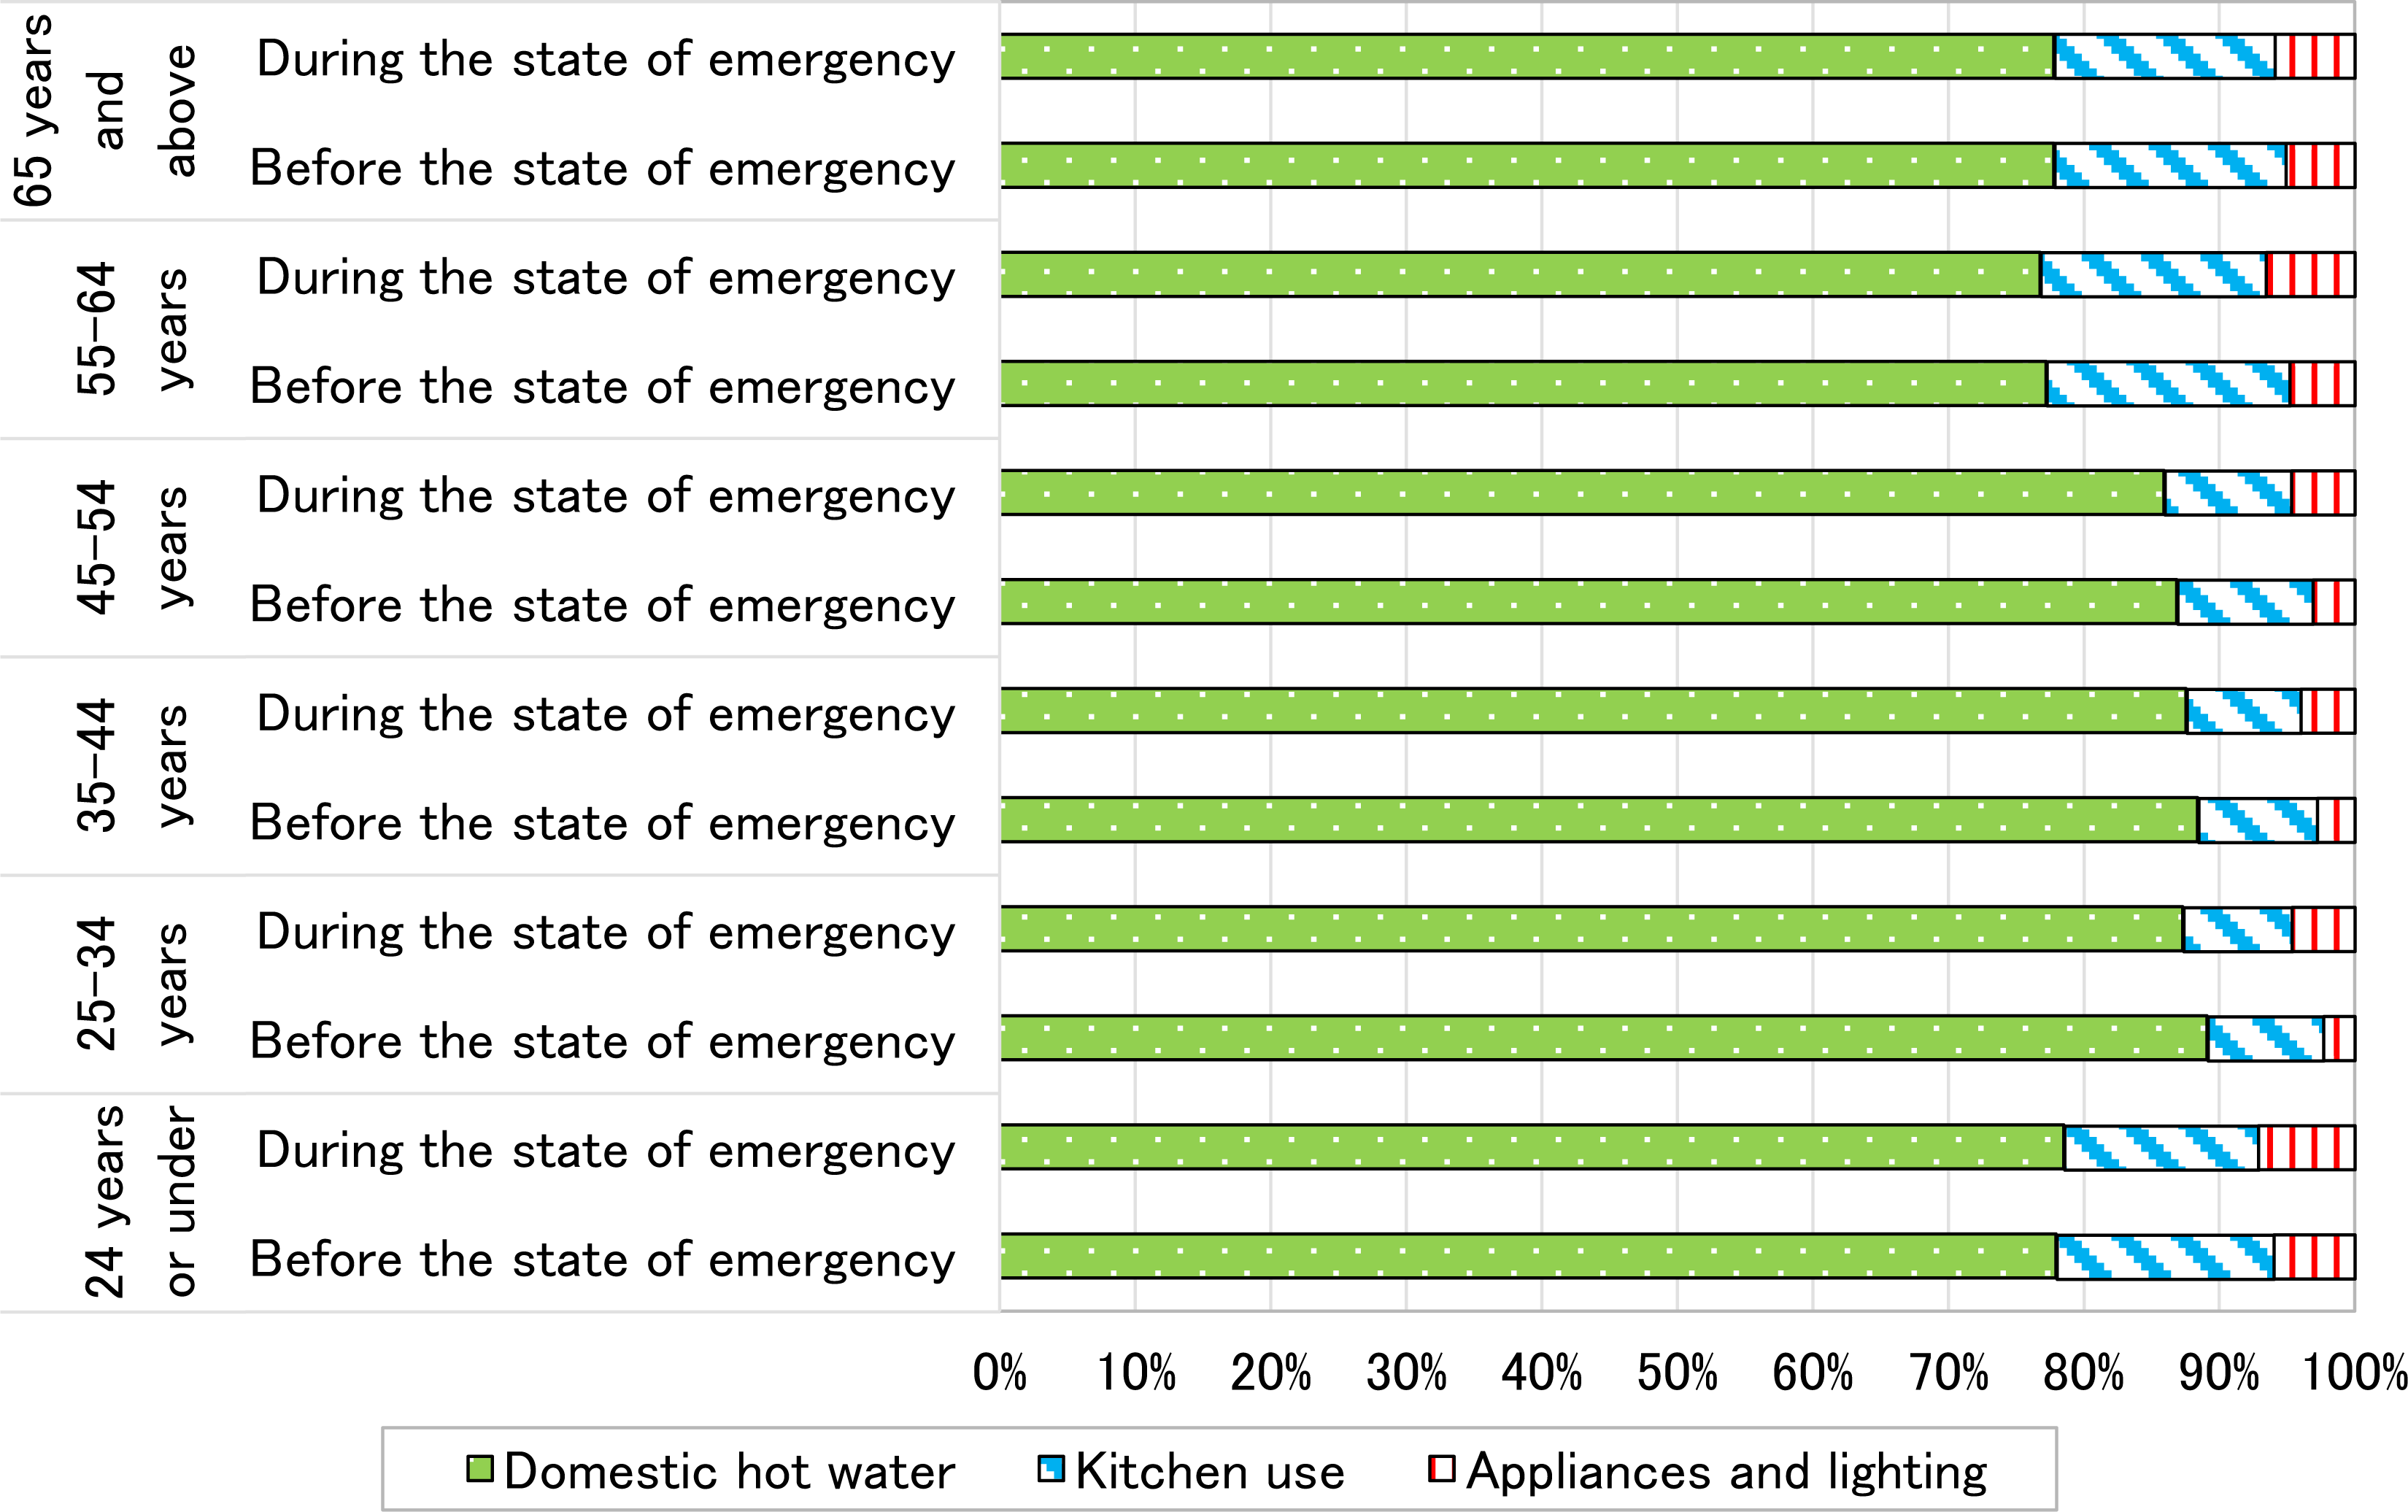
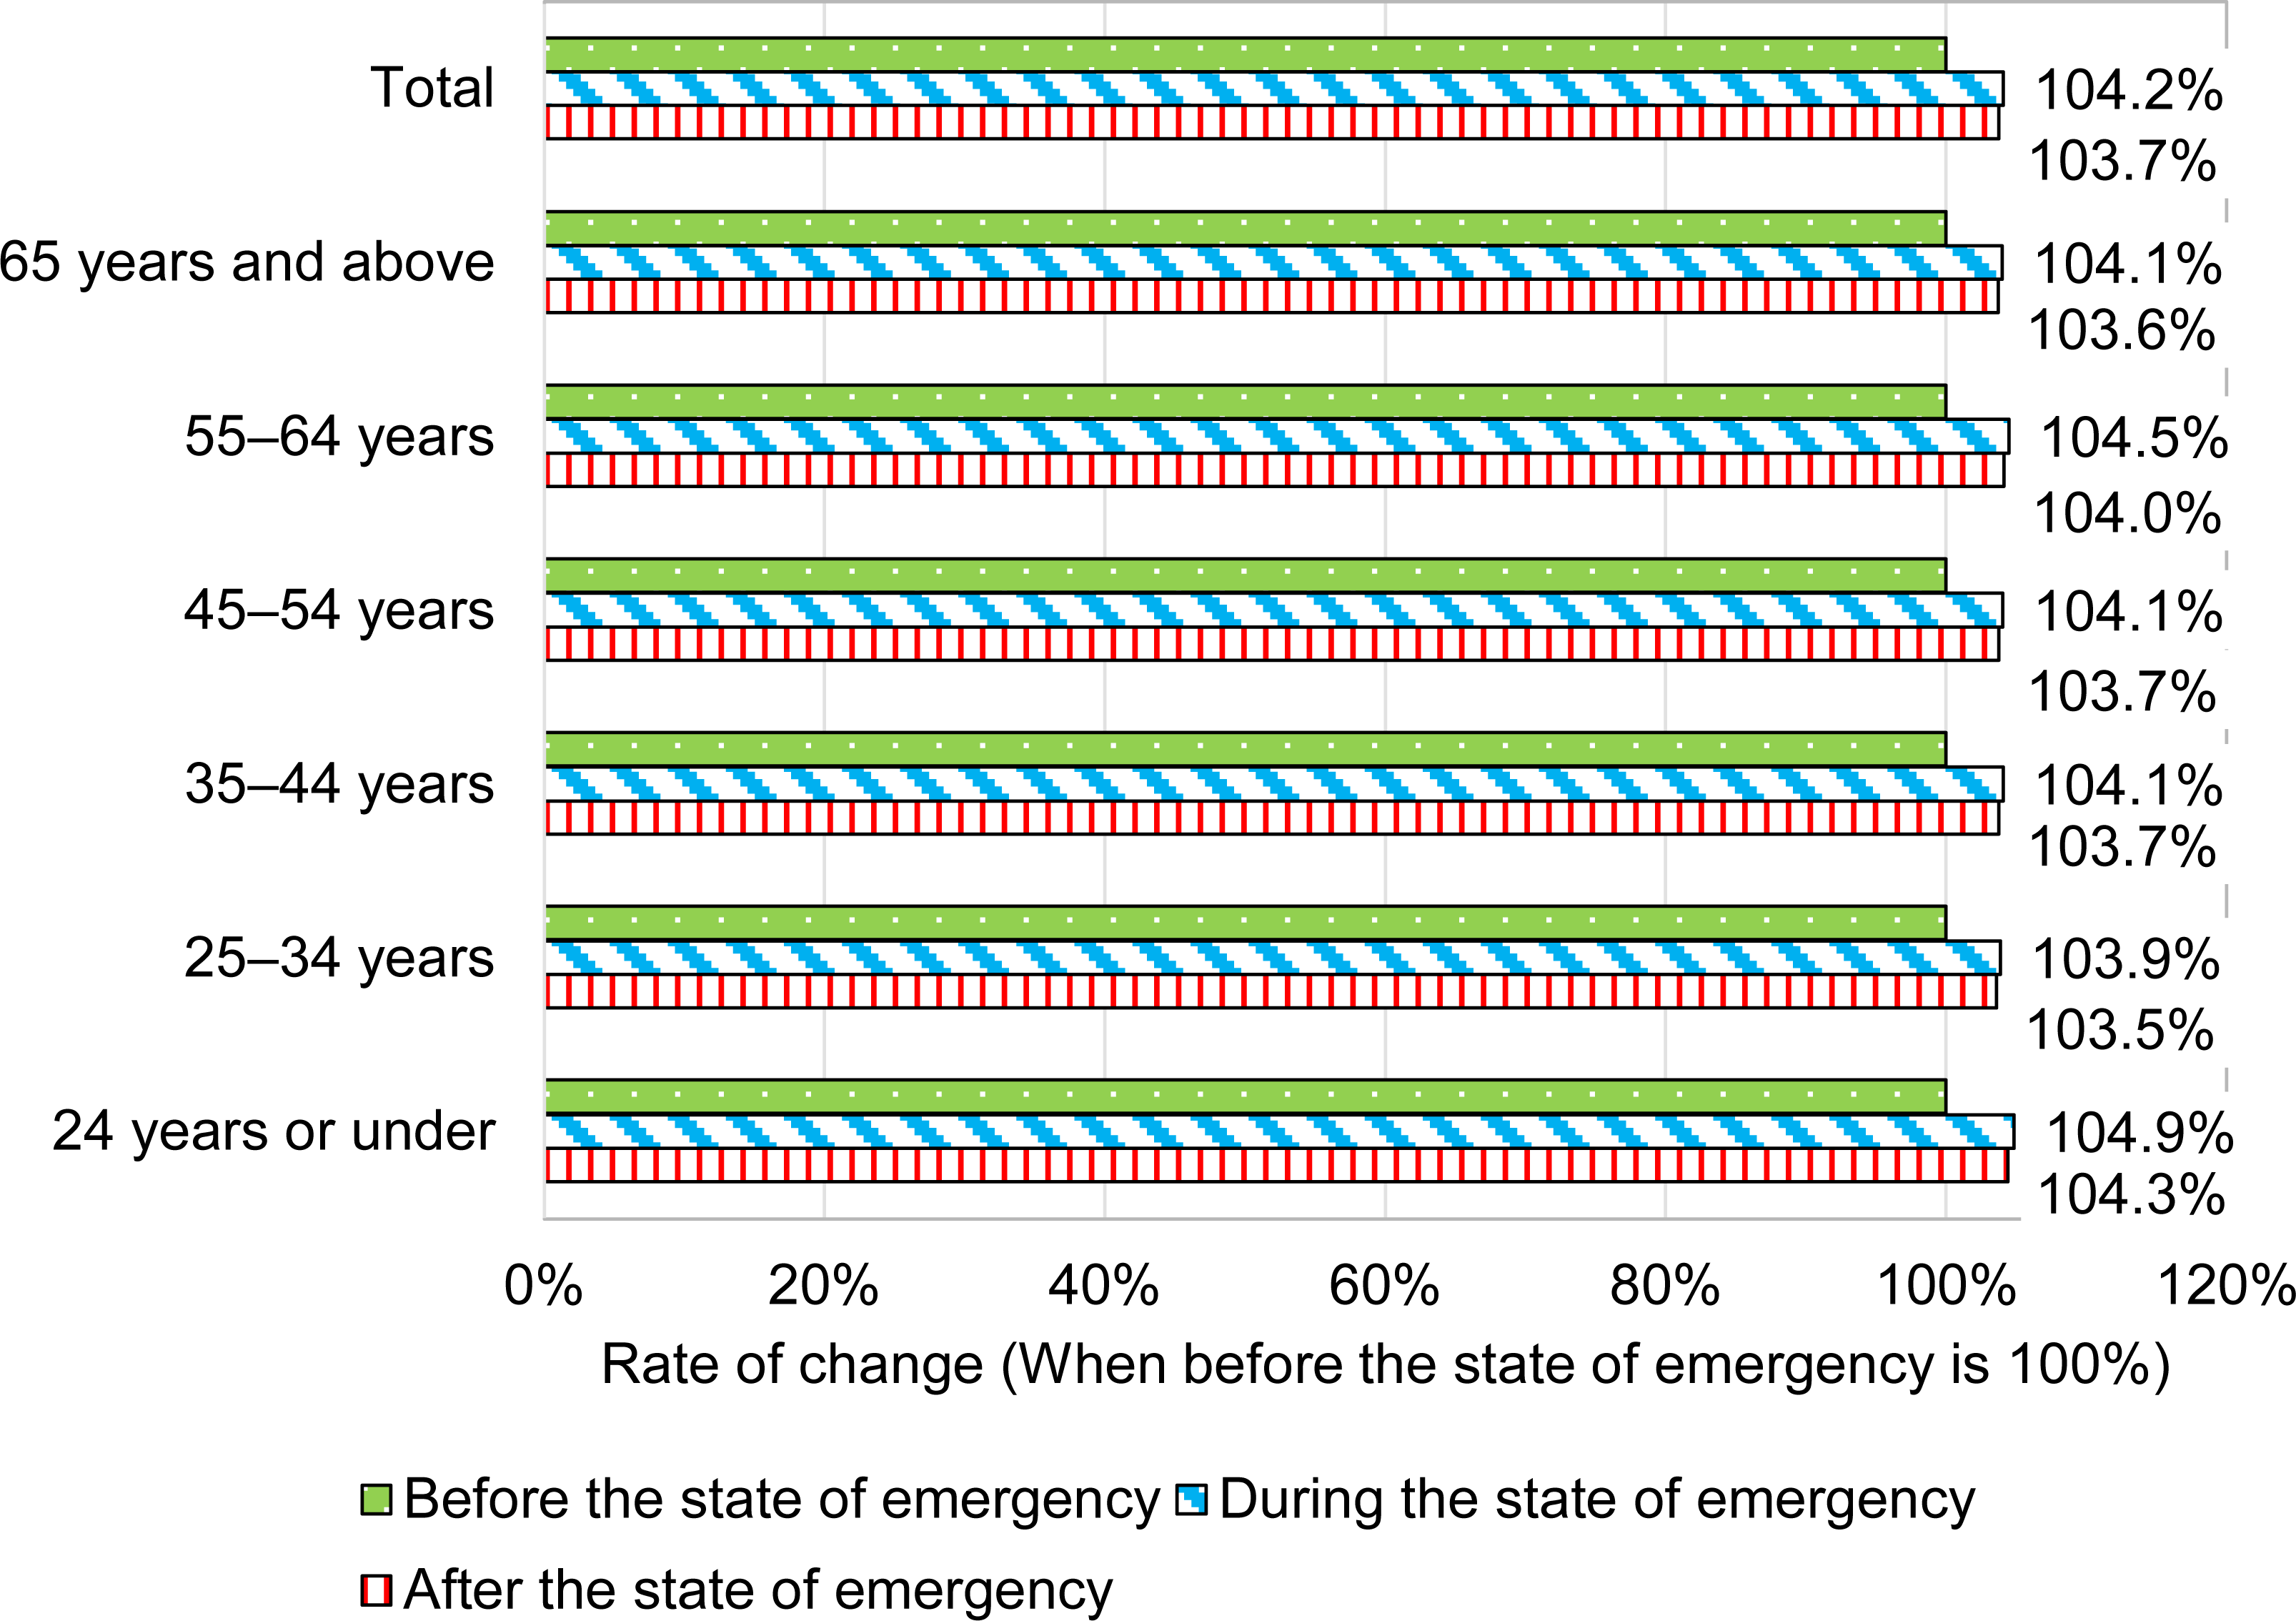
Figure 4 shows the results of the total daily household energy consumption in Kobe city using the household models. Considering that Kobe citizens keep the same activity during the different seasons, the results revealed that the total household energy consumption increased by 4.2% during the state of emergency when compared with consumption before the state of emergency. Even after the state of emergency ended, the total household energy consumption was 3.7% higher than that before the state of emergency. The same results were obtained for each age group. Following the implementation of remote working, office use decreased; thus, a decrease in energy consumption in offices would be expected. However, even though the number of office workers decreased, offices were not completely unused as some office functions could not completely shut down. Nakanishi [26] supposed that, during and after the state of emergency, office lighting and air conditioning were often left on, leading to only a small decrease in the energy consumption of the office, based on survey results for household energy consumption of teleworking. The results of this study also indicated that household energy consumption increased due to the lifestyle changes derived from more time spent at home. In addition to remote working, other activities may also have contributed to the increase in household energy consumption. In some cases, the implementation of remote working during a state of emergency might increase energy consumption in society as a whole.
Daily household energy consumption by household models in Kobe city
The validity of the results was discussed. The daily household energy consumption of Kobe city [27] was 51.84 TJ in 2018. The result obtained from this study was 82.22 TJ, which is 1.6 times larger than the result of Kobe city. One of the reasons for this overestimation is that there are overlapping times in living time and usage time of consumer durables depending on the number of residents. According to the report for the amount of time spent at home for each age group that this study adopted, this time has overlapping time in the form of eating while watching TV. The time might be duplicated due to the simultaneous use of consumer durables and sharing within the home. And the calculation result might become excessive. Another reason is that the household models created in this study simplify the age group into six categories. However, the actual home structure is complicated, and the models might not fully express the actual structure. Improvement of the models is required. According to the results released by Jyukankyo Research Institute, Inc. [28] in November 2020, the national household energy consumption from July to September 2020 increased by 3.7% compared with the previous year. Although overall household energy consumption was overestimated, the present study’s increasing rate of household energy consumption was similar to that in the aforementioned report. Therefore, this study assumes that household models make it possible to obtain appropriate results.
This study clarified the impact of changes in lifestyle at home due to the state of emergency implemented against the COVID-19 outbreak on household energy consumption in Kobe city. The results revealed that household energy consumption increased by 4.2% due to increases in daily household routines, including remote working, cooking, and relaxing. This study also revealed that household energy consumption did not return to normal even after the state of emergency had ended.
The national government had issued three states of emergency in the target area, including Kobe City, after the first state of emergency as of September 26, 2021. The national government has been planning subsidies to promote remote working as part of measures against COVID-19 described in [29]. These measures make remote working mandatory for not only large companies but also small and medium-sized companies. However, such subsidies only guarantee the introduction of Internet communication technology equipment. This study does not assume a reduction in energy consumption in offices and homes through remote working. Continuing to live in an environment influenced by COVID-19 might require long-term efforts, not only to prevent the spread of infection but also to control energy consumption in offices and homes.
C |
power consumption of the consumer durables |
[kW/unit] |
E |
household energy consumption |
[MJ/household] |
J |
secondary energy conversion |
[MJ/kWh] |
P |
quantity of consumer durables |
[unit/household] |
U |
usage time of the consumer durables |
[h] |
x1 |
age of the household head |
[years] |
x2 |
number of individuals per household |
[-] |
Y |
total floor area |
[m2] |
Subscript |
|
x |
type of consumer durable |
Abbreviation |
|
PC |
Personal Computer |
- WHO (World Health Organization), https://covid19.who.int, [Accessed: 29-November-2021]
- Japan Cabinet secretariat, https://corona.go.jp/en/, [Accessed: 29-November-2021]
- Values Inc., https://www.valuesccg.com/news/20200908-1906/, [Accessed: 29-November-2021]
- Persol Research and Consulting Co., https://rc.persol-group.co.jp/news/202012160001.html, [Accessed: 29-November-2021]
- Japan Ministry of Environment, https://www.env.go.jp/en/wpaper/2018/, [Accessed: 29-November-2021]
- Kobe city, https://www.city.kobe.lg.jp/a47946/shise/toke/toukei/jinkou/jinkouugoki/jinkouugoki2.html, [Accessed: 29-November-2021]
- Kobe city, https://www.city.kobe.lg.jp/a73576/kenko/health/infection/protection/covid_19.html, [Accessed: 29-November-2021]
- ,
The impact of different COVID-19 containment measures on electricity consumption in Europe ,Energy Research & Social Science , Vol. 68 ,pp 101683 , 2020, https://doi.org/https://doi.org/10.1016/j.erss.2020.101683 - ,
Impact of COVID-19 Measures on Short-Term Electricity Consumption in the Most Affected EU Countries and USA States ,iScience , Vol. 23 (10),pp 101639 , 2020, https://doi.org/https://doi.org/10.1016/j.isci.2020.101639 - ,
Impacts of COVID-19 on residential building energy use and performance ,Building and Environment , Vol. 205 ,pp 108200 , 2021, https://doi.org/https://doi.org/10.1016/j.buildenv.2021.108200 - ,
The impact of the COVID-19 on households' hourly electricity consumption in Canada ,Energy and Buildings , Vol. 250 ,pp 111280 , 2021, https://doi.org/https://doi.org/10.1016/j.enbuild.2021.111280 - ,
Impacts of the COVID-19 lockdown on energy consumption in a Canadian social housing building ,Applied Energy , Vol. 287 ,pp 116565 , 2021, https://doi.org/https://doi.org/10.1016/j.apenergy.2021.116565 - ,
Uncovering the impact of the COVID-19 pandemic on energy consumption: New insight from difference between pandemic-free scenario and actual electricity consumption in China ,Journal of Cleaner Production , Vol. 313 ,pp 127897 , 2021, https://doi.org/https://doi.org/10.1016/j.jclepro.2021.127897 - ,
Changes in energy consumption according to building use type under COVID-19 pandemic in South Korea ,Renewable and Sustainable Energy Reviews , Vol. 148 ,pp 111294 , 2021, https://doi.org/https://doi.org/10.1016/j.rser.2021.111294 - ,
Impacts of COVID-19 on energy demand and consumption: Challenges, lessons and emerging opportunities ,Applied Energy , Vol. 285 ,pp 116441 , 2021, https://doi.org/https://doi.org/10.1016/j.apenergy.2021.116441 - ,
Examining the economic impact of COVID-19 in India through daily electricity consumption and nighttime light intensity ,World Development , Vol. 140 ,pp 105287 , 2021, https://doi.org/https://doi.org/10.1016/j.worlddev.2020.105287 - ,
Electricity demand during pandemic times: The case of the COVID-19 in Spain ,Energy Policy , Vol. 148 ,pp 111964 , 2021, https://doi.org/https://doi.org/10.1016/j.enpol.2020.111964 - ,
Do unemployment benefits and economic aids to pay electricity bills remove the energy poverty risk of Spanish family units during lockdown? A study of COVID-19-induced lockdown ,Energy Policy , Vol. 150 ,pp 112117 , 2021, https://doi.org/https://doi.org/10.1016/j.enpol.2020.112117 - ,
The effect of occupant distribution on energy consumption and COVID-19 infection in buildings: A case study of university building ,Building and Environment , Vol. 190 ,pp 107561 , 2021, https://doi.org/https://doi.org/10.1016/j.buildenv.2020.107561 - ,
Impact of the COVID-19 lockdowns on electricity and natural gas consumption in the different industrial zones and forecasting consumption amounts: Turkey case study ,International Journal of Electrical Power & Energy Systems , Vol. 134 ,pp 107369 , 2022, https://doi.org/https://doi.org/10.1016/j.ijepes.2021.107369 - ,
Effect of COVID-19 on energy consumption and carbon dioxide emissions in Indonesia ,Sustainable Production and Consumption , Vol. 28 ,pp 391-404 , 2021, https://doi.org/https://doi.org/10.1016/j.spc.2021.06.003 - Japan Ministry of Internal Affairs and Communications, https://www.stat.go.jp/data/jyutaku/index.html, [Accessed: 29-November-2021]
- ,
Development of a Basic Rate of Household Energy Consumption Considering Usage Time and Quantity of Consumer Durables ,Journal of Sustainable Development of Energy, Water and Environment Systems , Vol. 5 (4),pp 533-545 , 2017, https://doi.org/https://doi.org/10.13044/j.sdewes.d5.0159 - NHK Broadcasting Culture Research Institute, https://www.nhk.or.jp/bunken/yoron-jikan/, [Accessed: 29-November-2021]
- Japan Ministry of Land, https://www.mlit.go.jp/report/press/toshi07_hh_000162.html, [Accessed: 29-November-2021]
- , The possibility of increase of energy at home by telework (in Japanese), Proc. 16th Annu. Conf. Jpn. Telework Soc, 2014
- Kobe city, https://www.city.kobe.lg.jp/a66324/20200925190501.html, [Accessed: 29-November-2021]
- Inc. Jyukankyo Research Institute, http://www.jyuri.co.jp/3375, [Accessed: 29-November-2021]
- Japan Ministry of Health, Labour and Welfare, https://www.mhlw.go.jp/content/11601000/000635288.pdf, [Accessed: 29-November-2021]