


When moving towards high shares of fluctuating, decentralized renewable energy units in an electricity system, there are some problems to overcome in the next decades. Two of the main challenges are the local and the seasonal compensation.
A major portion of electrical energy will not be generated in close distance to big urban load centres or suitable grid connection points anymore. Instead it will be located in regions where the best natural resources are, e.g. offshore wind farms, which can be far away from the big load consuming areas. For this problem of regional balancing of energy, grid extension as well as reinforcement will be essential. The other challenge will be that these units produce energy when there are the right weather conditions (e.g. wind or sun) and not exactly when the energy is consumed. Energy storage will sooner or later be needed to seasonally balance out the fluctuations of the energy output of renewable energies (RE) to adapt the production to the demand. There are some interesting and promising solutions, like Demand Side Management (DSM) or Demand Side Response (DSR), to adapt the demand to a mainly volatile electricity production. These solutions can help reducing the energy storage needs but will not have the right capacity to avoid the need of additional energy storage. There is a broad agreement amongst experts that energy storage will be needed to a high extent, only the point in time and the amount sometimes still differs widely, e.g. [1]-[4].
When taking a look at energy storage systems (ESS) that are operating up to date, the only technology that is available concretely and in a relevant scale for bulk energy storage is the pumped hydro energy storage system (PHES). PHES normally requires adequate geological surrounding and resources. These natural resources do not appear in all countries. In Germany, e.g. adequate sites for PHES installations are rare and sometimes difficult to access due to environmental concerns and public opposition. There are some new and innovative approaches using artificial structures for the construction of PHES facilities. Two very interesting possibilities are the use of former open cast mining structures [5] or of the locks and canal lifts of the national waterways with the already existing pumps and reservoirs [6]. Nevertheless, even when taking the potentials of these approaches into account, there is still a very high need for energy storage until the year 2050. Austria on the other side still has a very high, unused potential for natural sites for PHES systems. Furthermore, the storage reservoirs of Seasonal Hydro Power Plants (SHPP) in Austria gather a very high potential when retrofitting it with pumps. Austrian PHES systems already participate on the German electricity market and, due to lower grid fees, are often economically more viable than the systems in Germany.
This paper carries out an approach of using the potentials in the Austrian Alps to overcome the energy storage needs not only of Austria but also to help overcome the ones of Germany.
In this chapter the methodology of the computation algorithm will be explained and the scenarios under investigation are defined. The time resolution for this investigation is in hourly values and for the period of one year.
For the modelling of the different renewable energy sources, weather data from national weather services as well as from the software Meteonorm¯ are used together with detailed technical models of photovoltaic (PV), concentrated solar power (CSP) and wind turbines. The models have been validated with real feed-in data of the particular renewable energy. With the generated feed-in curves from renewable sources, the residual load and the surpluses of energy can be calculated. The residual load is here defined as the load demand minus the non-controllable production of renewable energies. This includes wind (PWind) and solar power (PPV) but also a part of hydropower (PHP), mostly small non-controllable run-of-the-river plants. κHP represents the non-controllable factor for hydropower reaching from 0 (all hydropower plants are fully controllable) to 1 (none are controllable). Equation 1 is showing how the RL is calculated for each time step t.
After the calculation of the residual load the operational strategy of the ESS has to be defined. The operational strategy of an ESS can influence the outcomes of the final energy storage needs [7], [8]. In this paper the operational strategy is to integrate as much renewable energy as possible. To achieve this goal the ESS follows in general a simple peak-shaving valley-filling strategy, but with an important modification. If the residual load is expected to be negative, the ESS plans its operation before in a way, that enough or at least the maximum capacity is available to integrate the surplus of renewable energies. The operation planning is done with weather forecast models. To estimate the total energy storage needs, two ESS are integrated in the algorithm. ESS 1 contains the existing and planned facilities, in Germany it consists of 8 GW/60 GWh of PHES capacity and 321 MW/2.4 GWh Compressed Air Energy Storage (CAES) capacity. ESS 2 has an unlimited capacity and power and is not connected to a specific technology. Due to its unlimited nature and the optimization strategy of the algorithm, it is ensured that all energy from renewable sources can be integrated with minimum energy storage capacity. The finally used power and capacity of ESS 2 is then an indicator for the energy storage needs to fulfil the desired optimization target. In a next step, the total energy storage needs are separated into short and long term energy storage needs. This is done either with a discrete Fourier Transformation or with a floating average [9],[10]. Short term means in this case full load hours of up to 24 hours and long term of multiple days to weeks. A detailed description of the modelling of the particular renewable energy sources and the energy storage needs, short as well as long term, can be found in previous work [9], [11].
Different development scenarios for renewable energies have been investigated for Austria as well as for Germany. The year of interest is 2050. The German government set the goal of renewable energy source electricity generation (RES-E) to 80% of the gross electricity consumption. To achieve this goal, the development of wind and solar power (mainly PV) will be a key element. For these two technologies 3 different cases representing 3 different development scenarios were defined, see Table 1. In scenario A, an equal development of both, wind and solar power, is assumed with the expected installed capacities of the particular National Renewable Energy Action Plan (NREAP) [12], scaled accordingly to reach 80%. Scenario B and C then represent a favoured development of wind and solar power respectively, see Table 1. The overall installed power of RES is highest in scenario C. This is due to the lower full load hours of PV compared to wind power. Thus a higher capacity is needed to produce the same amount of energy. For Austria only 2 scenarios are investigated for the year 2050, a Business As Usual (BAU) scenario and a GREEN scenario, named B and C respectively. The BAU scenario expects a low growth in RES-E but a strong increase in electricity consumption. The GREEN scenario expects just a low growth in electricity consumption and very strong development of PV. These two scenarios were derived with the GREEN-X model of the Energy Economics Group of the Technical University of Vienna [13].
Overview of the scenario assumptions for Germany in the years 2020 and 2050 [14], [4]
| [MW] | DE - 2050 Scenarios | AT - 2050 Scenarios | Total AT-DE | ||||
|---|---|---|---|---|---|---|---|
| A | B | C | B | C | BC | CC | |
| Wind (onshore) | 60,000 | 63,000 | 55,000 | 4,240 | 4,710 | 67,710 | 59,710 |
| Wind (offshore) | 26,000 | 30,000 | 21,000 | 0 | 0 | 30,000 | 21,000 |
| PV | 70,000 | 45,000 | 100,000 | 7,880 | 26,000 | 71,960 | 126,960 |
| Hydropower | |||||||
| Run-of-River | 5,700 | 7,200 | 12,900 | ||||
| PHES | 8,000 | 3,600 | 3,600 | ||||
| HES | 9,200 | 17,200 | |||||
| Small Hydropower | 250 | 250 | |||||
| Other RES-E | 4,200 | 4,200 | 4,200 | 2,430 | 2,000 | 7,000 | |
| Yearly Peak Load | 79.1 GW | 20.7 GW | 13.6 GW | 92.5 GW | 92.5 GW | ||
| Energy Consumption [TWh] | ~500 | 126 | 83 | ~583 | ~583 | ||
| RES-E Generation [TWh] | ~400 | 75 | 94 | ~494 | ~494 | ||
| RES-E Share † | ~80% | ~80% | ~80% | ~60% | ~110% | ||
For the combined system the GREEN scenario of Austria was combined with the 2 RE development scenario B and C of the German model. The installed capacities of the different RE-technologies in all scenarios are summarized in Table 1. In all scenarios the installed power of renewable energies exceeds the yearly peak load. Except of the Austrian scenario B, the installed amount of viable, non-controllable RE sources wind and photovoltaic (PV) even exceed the peak load more than twice. In the combined system of Germany and Austria (scenario CC), just the installed PV power is more than 30 GW higher than the highest load. The total installed power of RES in the combined system ranges from 182.5 GW to 220.6 GW.
Nowadays (winter 2010/11) Germany and Austria have 2 grid connection points on high voltage level with a total transmission capacity of 2,200 MW. To be able to store the surplus of renewable electricity produced in Germany in the Austrian Alps, the transmission capacity would have to be increased. The influence of the transmission capacity can be seen in the next chapter.
Furthermore technical limitations and constrains will have to be set for the transmission capacities as well as the short and long term energy storage systems. For the energy storage systems, the power in charging as well as in discharging mode, the capacity factor and the cycle efficiencies can be adapted.
The theoretical capacity of the Austrian reservoirs with connection to hydropower plants has been estimated to 2 TWh. This has been done by summing up the theoretical potential calculated with the elevation energy of the water in the storage reservoirs [15], [16]. In reality, the total capacity will probably be smaller because of constrains regarding minimum water height in the reservoirs, maximum outflow per day, natural inflow, rain, etc.
The capacity of the German PHES system has been set to 60 GWh with an installed pump and turbine power of 8 GW.
The rejected energy and the maximum power surplus that appears in each scenario for Germany, Austria and the combined system are listed in Table 2. The total rejected power and energy in Germany is the highest in scenario C. This is due to a higher installed power of PV compared to the other scenarios. It can be observed that the rejected energy in the maximum RE-scenario (CC) for both countries is lower than just in scenario C for Germany. On the other side the maximum power surplus is slightly higher.
Rejected power and energy from renewable sources in all scenarios investigated
| 2050 Scenario | Max. rejected power [GW] | Rejected Energy [TWh] |
|---|---|---|
| DE – A | 51.15 | 21.72 |
| DE – B | 38.85 | 15.85 |
| DE – C | 69.09 | 29.04 |
| AT – B | 0 | 0 |
| AT – C | 12.18 | 7.69 |
| BC | 43.07 | 11.34 |
| CC | 70.54 | 24.96 |
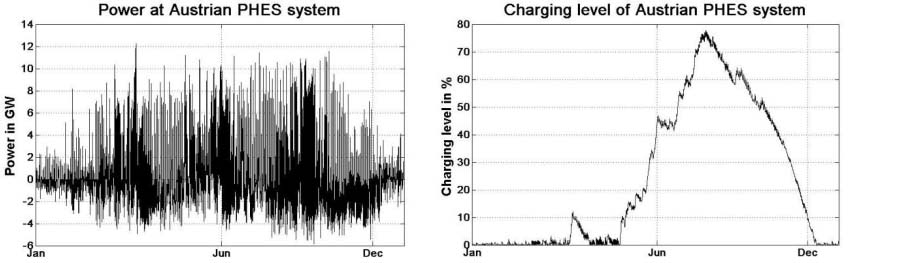
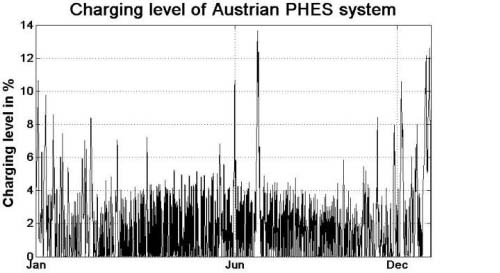
The results of the energy storage needs calculation for Germany and Austria as isolated systems are shown in Table 3. As can be seen, there is no need for additional energy storage capacity just for the Austrian system. As there is no surplus of renewable energy in scenario AT-B the energy storage system (ESS) is operating only to smoothen the residual load and thus there is no need for any expansion. Only in scenario AT-C there is an additionally needed power in charging mode of 3 GW to fully integrate all energy from RES, see Figure 1. The charging level of the Austrian PHES system is very high and reaches almost 80% of its total capacity, which is an equivalent of around 1,600 GWh. This is due to the very high surplus of PV power in summer, which cannot be discharged during this period of the year and thus the ESS is almost continuously in charging mode. As can be seen in Figure 1, the reservoir is discharged again during autumn and beginning of winter when there is lower feed-in from PV. Another problem that could arise when trying to store all this surplus is that the reservoirs probably will not be empty at the beginning of the year and thus will not have enough capacity so store all the surplus of energy from PV.
Additionally needed storage power and capacity for all scenarios
| 2050 Scenario | Additionally needed power [GW] | Additionally needed capacity [GWh] | |
|---|---|---|---|
| Charing | Discharging | ||
| DE – A | 38.79 | 25.17 | 1,308 |
| DE – B | 31.85 | 25.74 | 1,534 |
| DE – C | 55.16 | 29.04 | 950 |
| AT – B | 0 | 0 | 0 |
| AT – C | 3 | 0 | 0 |
Used power and charging level of expanded Austrian PHES system in scenario AT-C
On the other side, when looking at the results in Table 3, there is an enormous need of new storage installations in Germany in all scenarios. The highest capacity is needed in the scenario with a favoured development of wind energy (1,534 GWh). The surplus produced by wind energy appears mainly during autumn, winter and spring. At this point the Austrian system could be used to store the surpluses of wind power during winter when there is a low feed-in from PV in the Austrian system.
For the German system the storage needs can further be divided into short and long term energy storage needs. This should be done because the German system will probably have to handle short term energy storage needs with different technologies with different efficiencies and capacities, whereas Austria will be able to rely on the PHES potentials in their own country. For the separation, maximum full load hours of 24 h, a maximum power of 12 GW in charging and discharging mode and a cycle efficiency of 85% was set as technical constraints for the short term energy storage facilities (SES), see also [11]. At this point, no constraints were set for the long term energy storage (LES). The results of this separation for Germany are shown in Tables 4 and 5. Due to the power limitations, the peaks of the RE feed-in are cut off and the overall needed power for the ESS decreases. Especially the needed power for LES is in a range of the already installed PHES facilities in Austria.
Needed power and capacity for the long term energy storage system (LES)
| Germany - LES | |||
|---|---|---|---|
| A | B | C | |
| Pcharging [GW] | 13.43 | 14.91 | 12.80 |
| Pdischarging [GW] | 6.43 | 6.43 | 7.44 |
| Capacity [GWh] | 1,106 | 1,206 | 861 |
Capacity factor of short term energy storage system (SES) and long term energy storage system (LES) for all scenarios in Germany
| Germany | ||||||
|---|---|---|---|---|---|---|
| A | B | C | ||||
| SES | LES | SES | LES | SES | LES | |
| Charging | 14.20% | 6.65% | 10.78% | 5.25% | 18.30% | 5.95% |
| Discharging | 14.11% | 12.95% | 10.68% | 13.37% | 18.22% | 10.16% |
| Total | 28.31% | 19.60% | 21.46% | 18.62% | 36.52% | 16.11% |
| Rejected energy | 2.91 TWh | 1.72 TWh | 6.64 TWh | |||
When looking at the capacity factor (CF) of SES and LES in Table 5, it can be observed that the CF especially for LES is very low. The same can be observed for the Austrian ESS. When integrating all surpluses of renewable energies, the capacity factor of the PHES system is at 20.03%. Taking this into account it seems obvious to take a look at the combined system of Austria and Germany to see if there are synergies that could be used to optimise the operational strategy of both countries' energy storage systems.
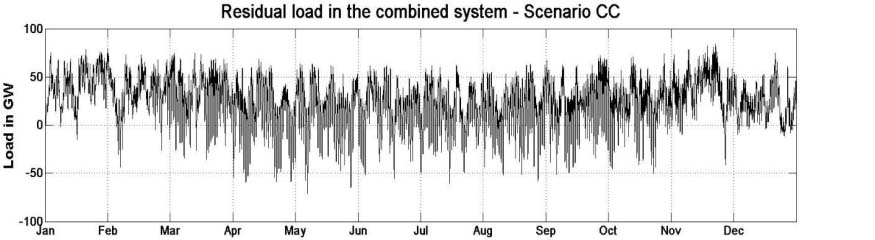
The residual load of the combined system of Germany and Austria can be seen in Figure 2 for scenario CC. The strong influence of the PV can be observed in the appearance of almost daily negative peaks in the period from April to end of October. Due to low feed-in from wind in the Austrian system the surplus of wind during winter in Germany is mostly compensated by the Austrian load demand. This can already be seen as first positive effect of the combined system. Nevertheless the negative peaks of the residual load often reach more than 50 GW, which exceeds the, up to date, installed ESS-power by far. As the transmission capacities between Austria and Germany will probably not reach 50 GW, two scenarios are investigated to show a theoretical and a realistic example. First, no limitations are set to the transmission capacities. As a second, more realistic, scenario the transmission capacity is limited to 9.2 GW – the rated power of the expected Austrian PHES system.
Residual load in the combined system of Germany and Austria, scenario CC
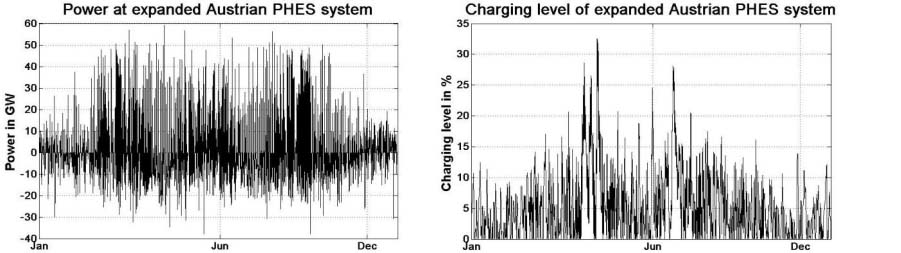
Used power and charging level of expanded Austrian PHES system in the combined system scenario CC
Overview of the storage operation in Germany and Austria with no transmission system limitations
| 2050 Scenario | Country | Stored Energy [GWh] | Provided Energy [GWh] | Max. used power [GW] | |
|---|---|---|---|---|---|
| Charge | Discharge | ||||
| BC | DE | 17,111.39 | 13,837.93 | 8.0 | 8.0 |
| AT | 27,005.47 | 21,398.66 | 36.4 | 37.2 | |
| CC | DE | 20,174.01 | 16,321.21 | 8.0 | 8.0 |
| AT | 44,102.49 | 35,671.96 | 59.2 | 37.7 | |
In scenario BC the synergy effect is less significant. The maximum charging level decreases to 39%, which is still almost half of the needed capacity of the single Austrian system. The highest charging level appears in August and is due to a stronger feed-in from wind compared to scenario CC. The additionally needed power is around 37 GW in charging and discharging mode, which is slightly lower than in the single German system.
As can be seen in Table 7, the capacity factor of the German PHES system is very high in all scenarios compared to the one of the Austrian ESS. The low CF of the Austrian system is due to the fact that it has to take all the surplus of renewable energies. The maximum power of the PHES system is only used once per year which is not an economical solution. The high capacity factor of the German system is due to the daily fluctuations of PV. This ensures that the reservoir can be filled and emptied almost daily.
Capacity factor of the German and Austrian PHES facilities in the scenarios of the combined system
| German PHES | Austrian PHES | |||||
|---|---|---|---|---|---|---|
| Charge | Disch. | Total | Charge | Disch. | Total | |
| BC | 24.42% | 19.75% | 44.17% | 8.47% | 6.57% | 15.04% |
| CC | 28.79% | 23.29% | 52.08% | 8.50% | 10.80% | 19.30% |
However, it should be kept in mind that the transmission capacity from Germany to Austria is today only 2.2 GW, which is normally already used by the existing PHES system of Austria. In this scenario transmission lines of 20 GW to 57 GW would have to be built.
Residual load in scenario CC after the use of the German and Austrian PHES system without any power extensions
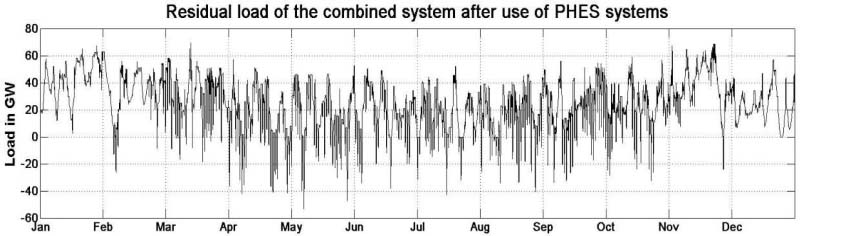
The rejected energy from renewables due to these limitations would be 9.02 TWh, which is less than 2% of the total possible production from RES-E. So, already with no further than the expected expansion of the PHES system and by increasing the transmission capacity from 2.2 GW to 9.2 GW, the rejected energy from renewable sources can be reduced from 24.96 TWh to 9.02 TWh. The outcome of the simulation regarding the energy storage system operation is shown in Figure 5 and Table 8. Due to the power limitations the maximal used power in charging and discharging mode is 9.2 GW for the Austrian and 8 GW for the German system.
Charging level of expected Austrian PHES system in scenario CC with a limited transmission capacity of 9.2 GW
Overview of the storage operation in Germany and Austria with a transmission capacity limited to 9.2 GW
| 2050 Scenario | Country | Stored Energy [GWh] | Provided Energy [GWh] | Max. used power [GW] | |
|---|---|---|---|---|---|
| Charge | Discharge | ||||
| BC | DE | 20,228.96 | 16,365.63 | 8.0 | 8.0 |
| AT | 20,859.28 | 16,762.69 | 9.2 | 9.2 | |
| CC | DE | 17,161.74 | 13,878.71 | 8.0 | 8.0 |
| AT | 20,326.55 | 16,020.09 | 9.2 | 9.2 | |
The most significant difference to the unlimited system can be observed in Figure 5. It can be seen that the maximum charging level of the Austrian PHES system is less than 14% of the total capacity. This is less than half of the fluctuation that appeared in the unlimited system. This could also be in a justifiable range for the big reservoirs in the Austrian Alps that are nowadays only used for seasonal energy storage with relatively low fluctuations.
Taking a look at the capacity factors of the PHES systems in both countries in Table 9, it can be observed that the CF is at more than 40% in all scenarios. For the German system this represents only a marginal difference but the CF of the Austrian system more than doubled for scenario BC and even tripled for scenario CC. This ensures that the ESS is used to a high extend and that it could be operated economically feasible
Capacity factor of the German and Austrian PHES facilities in the scenarios of the combined system
| German PHES | Austrian PHES | |||||
|---|---|---|---|---|---|---|
| Charge | Disch. | Total | Charge | Disch. | Total | |
| BC | 24.49% | 19.80% | 44.29% | 25.22% | 19.88% | 45.10% |
| CC | 28.87% | 23.35% | 52.22% | 25.88% | 20.80% | 46.68% |
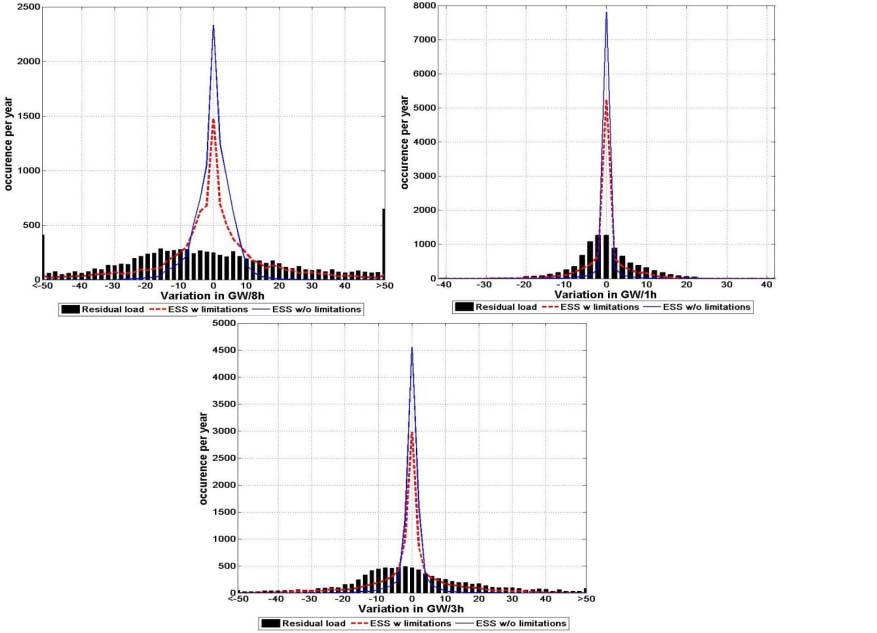
Load variations in scenario CC of residual load without ESS (black bars) and with the use of limited (red line) and unlimited (blue line) ESS with variations in GW per 1 hour (a); in GW per 3 hours (b); and in GW per 8 hours (c)
It has been shown that the connection of the Austrian and the German electricity system gathers a very high potential. Especially the better exploitation of the Austrian PHES system is a big advantage for both countries. The capacity of the existing reservoirs is big enough to cover even the total storage needs of Germany. The needed transmission capacity will most probably be too high. But, even with lower capacities a very high surplus of RES-E can be stored. When building new transmission lines also the Austrian energy system becomes more flexible and the total energy storage needs in both countries decrease. All outcomes are again summarized in Table 10.
Summary of results for all scenarios investigated within this paper
| 2050 Scenario | Rejected Energy | Add. needed power | Add. needed capacity | Max. fluctuation | ||
|---|---|---|---|---|---|---|
| Before ESS | After ESS | Charging | Discharging | |||
| DE – A | 21.72 TWh | 0 | 38.79 GW | 25.17 GW | 1,308 GWh | 100% |
| DE – B | 15.85 TWh | 0 | 31.85 GW | 25.74 GW | 1,534 GWh | 100% |
| DE – C | 29.04 TWh | 0 | 55.16 GW | 29.04 GW | 950 GWh | 100% |
| AT – B | 0 | 0 | 0 | 0 | 0 | <1.5% |
| AT – C | 7.69 TWh | 0 | 3 GW | 0 | 0 | 78% |
| BC | 11.34 TWh | 0 | 27.2 GW | 28 GW | 0 | DE: 100% |
| CC | 24.96 TWh | 0 | 50 GW | 28.5 GW | 0 | DE: 100% |
| BC w TC limitations | 11.34 TWh | 2.29 TWh | 0 | 0 | 0 | DE: 100% |
| CC w TC limitations | 24.96 TWh | 9.02 TWh | 0 | 0 | 0 | DE: 100% |
In the stand alone German system the additionally needed power reaches from 31.85 GW to 55.16 GW in charging mode and 25.17 GW to 29.04 GW in discharging mode depending on the particular scenario. The additionally needed storage capacity reaches, depending on the scenario, from 950 GWh to 1,534 GWh. First advantages of the combined system could already be observed in Table 2. In each scenario the rejected power and energy of the combined system is lower than the sum of each value in both islanded systems. In scenario AT-B no surpluses of renewable energies occur and thus no additional capacity is needed. The ESS is used anyway to a small extend to balance out daily RL fluctuations. In scenario AT-C the high installed power of PV causes high surpluses during summer which leads to an additionally needed power in charging mode of 3 GW. Although the overall rejected energy is low compared to the capacity of the Austrian PHES system, the reservoirs are filled up to 80% (see Figure 1) due to the strong feed-in of PV during summer. The positive impact of the combined system regarding the fluctuation of the water level in the Austrian reservoirs is clearly visible, see Figures 3 and 5. In none of the scenarios of the combined system the maximum fluctuation reaches more than 40%. In scenario CC with transmission system limitations the maximum fluctuation could even be reduced to 14%. This could still be in a justifiable range compared to almost 80% in the islanded system scenario AT-C. Nonetheless without any limitations and to fully access the potential of the Austrian PHES system, new transmission capacities from Germany to Austria and vice versa in a range of 34 GW to 57 GW would have to be built. This will hardly be justifiable economically and towards the public. But, just with an expansion from nowadays 2.2 GW to 9.2 GW, only 2% of the energy from renewable sources would get lost. This percentage would be higher when using less efficient storage technologies like power-to-gas instead of building transmission lines.
However, besides the advantages of a combined system shown in this paper, there are still some investigations to be made, e.g.:
Public opinion/opposition;
Determining the actual usable potential in the Austrian Alps;
Taking into account the natural inflow in the reservoirs due to rivers and rain and hence the must run moments of Austrian hydropower plants, e.g. see [2].
Furthermore, the expansion of this investigation to a European scale is planned to see what kind of influences a wider area of load consumers can have on the storage needs on the one side, and on the business models for energy storage systems on the other side. Price building concepts for the services provided by energy storage facilities will be evaluated. In this context the participation of Austrian and German PHES systems on the balancing energy markets as well as on an internal European electricity market will be investigated.
The results presented in this paper were mainly produced within the work on the EU founded project store (
- ,
Long Term Scenarios for the Development of Renewable Energies in Germany Taking into Account the Development in Europe and Worldwide ,Final Report (BMU - FKZ 03MAP146) , 2012, in German - ,
Super-4-Micro-Grid, Sustainable Energy Supply Within the Climate Change, Konsortium aus TU Wien, Zentralanstalt für Meteorologie und Geodynamik TIWAG, Voralberger Illwerke AG, Verbund Hydro Power AG ,Final Report , 2011, in German - ,
Energy Storage for the Energy Turnaround, ETG Task Force Energiespeicherung ,VDE Studie, Final Report , 2012, in German - ,
Overview of the Current Status and the Future Development Scenarios of the Electricity Supply System and an Estimation of Future Energy Storage needs ,Deliverable 5.1 of the Store Project , 2013 - ,
Concepts for Pumped Hydro Storage Facilities in Former Open Cast Mining Locations ,5th International Renewable Energy Conference IRES 2010 , 2010 - ,
The Federal Waterways as Energy Storage System - Potentials and Challenges ,WasserWirtschaft 7/8 2013 , , in German - ,
Optimizing Storages for Transmission System Operation ,Energy Procedia , Vol. Vol. 46 , :13-212014, https://doi.org/10.1016/j.egypro.2014.01.153, pp - ,
Effects of Operational Strategies on Performance and Costs of Electric Energy Storage Systems ,Energy Procedia , Vol. Vol. 46 , :271-2802014, https://doi.org/10.1016/j.egypro.2014.01.182, pp - ,
An Empirical approach to Calculate Short and Long Term Energy Storage needs of an Electricity System ,48th International Universities’ Power Engineering Conference , 2013 - ,
Sizing Energy Storage to Accomodate High Penetration of Variable Energy Resources ,IEEE Transactions on Sustainable Energy , Vol. Vol. 3 (No.1), 2012, https://doi.org/10.1109/TSTE.2011.2164101 - ,
Development of Fluctuating Renewable Energy Sources and its Influence on the Future Energy Storage needs of Selected European Countries ,4th International Youth Conference on Energy 2013 , 2013 - ,
Renewable Energy Projections as Published in the National Renewable Energy Action Plans of the European Member States ECN-E--10069 , , http://www.ecn.nl/docs/library/report/2010/e10069.pdf [Accessed: 16-July-2013] - ,
Action plan for a dynamic RES-E policy ,Report of the European Research Project Green-X - funded by the EC-DG Research , 2004 - ,
Assessment of the Future Energy Storage Needs of Austria for Integration of Variable RES-E Generation ,Deliverable 5.1 of the Store Project , 2013 - ,
AHPs Storage Power Plants in Kärnten ,Verbund-Austrian Hydropower AG , 2007, in German - ,
AHPs Hydro Power Plants in Tirol ,Verbund-Austrian Hydro Power AG , 2007, in German