


The United Nations has predicted the world's population to reach 9.7 billion by 2050 [1]. The rapid population growth, jointly with the global economic development, will accelerate the depletion of water and energy resources and the growth of the food demand. As a result, the human society must now make efforts to resolve such complex interdepended challenges that are characterized as fundamental threats to the human civilization and are directly related to the areas of the production, distribution, and use of energy, water, and food [2]. Currently, agriculture (as a food production sector) accounts for more than 70% of total global freshwater withdrawals, meanwhile, the agricultural productions and supply chains are responsible for about 30% of the total energy consumed globally [3]. Consequently, to have sustainable foods, humans must produce food more efficiently and consume less water and energy [4]. A solution to the water problem manifested itself in the water demand management and the changes in the agricultural and food production systems [5]. An innovative optimal solution to food production challenges can be identified when the water and energy nexus and the least required capital are considered. Although applying technologies and processes can overcome the challenges of water scarcity, one cannot avoid substituting water and material with capital and energy. The identification of sustainable linkage between water, energy, and capital is of the utmost importance to establishing a sustainable production process [6]. An integrated approach is required to show the interrelationship between production factors [7]. Hence, the term watergy has been introduced to indicate the integration of water and energy in an optimization process [8]. This term was applied in different projects in Europe and the United States of America to examine the potential of saving on water and energy [9], [10].
Another approach addressed the water-energy nexus modelling. However, it was shown that the water-energy nexus analysis could provide the appropriate means for planning and identifying potential policies and technology development [11]. Die et al. [12] reviewed such WEN (water-energy nexus) models on the macro-level as WEAP-LEAP (Water Evaluation And Planning system and Long-Range Energy Alternatives Planning), TIAM-FR (TIMES Integrated Assessment Model), CLEW (Climate, Land, Energy, and Water), UWOT (Urban Water Optioneering Tool), WEEN (water, energy, and emission nexus), SPATNEX-WE (SPAtial and Temporal NEXus-Water Energy), GLEW (Great Lakes Energy Water model), WESTWeb (Water-Energy Sustainability Tool Web), etc. Some research at the micro-level was also addressed, as exemplified by the research on greenhouses. The agricultural production system was shifted to more protected cultivation with the help of greenhouses to increase crop yields and decrease water consumption [13]. Less water consumption and the cultivation throughout the year are merits of the greenhouse cultivation that can provide appropriate means for establishing sustainable agriculture [14]. The greenhouse is one of the most energy-intensive and cost-intensive sectors in the horticulture industry due to the use of various technologies [15]-[18]. The water and energy analysis in the greenhouse has been based usually on maintaining an appropriate operational mode where the microclimate condition inside the greenhouse is fixed at a set point. Analytical tools based on microclimate conditions are focused on the technology assessment [19], [20]. Vanthoor et al. [21] introduced an economic greenhouse model to scrutinize the greenhouse design based on a range of climate changes and economic circumstances. Vadiee and Martin [22] studied different energy supply and management systems models in closed greenhouses. Speetjens et al. [23] also used a morphological diagram to study the optimal configuration of the greenhouse technology for a region in Taiwan. Table 1 summarizes important water and energy models and studies.
Some studies on the water-energy nexus and models in different case studies
| Reference | Model | Key features | Technology Assessment/ Morphology Diagram | Resource Allocation Analysis | Nonconventional water Resource | Description | |||||
|---|---|---|---|---|---|---|---|---|---|---|---|
| Watergy Approach | Macro | Micro (System level) | Micro (Technology Level) | Optimization | DSS During Time | ||||||
| Bazilian et al., 2011 [2] and Annex, 2009 [31] | CLEW (based on the WEAP and LEAP integrated model) | * | * | * | * | * | An integrated model that analyses the interlinkage between different resources of water, energy, and land and the external stresses such as climate change is applied for designing strategies in support of the decision making and policy assessment. (KTH) | ||||
| Fricko et al., 2016 [32] | MESSAGE | * | * | * | * | * | They showed the water usage of the energy sector in the MASSAGE model, developed by (IIASA) | ||||
| Dubreuil et al., 2013 [30], and Bouckaert et al., 2011 [37] | TIAM-FR (based on ETSAP-TIAM) | * | * | * | * | * | * | Developing a water module in the energy optimization framework – The water-scarce Middle East context. (MINES ParisTech Centre of Applied Mathematics) | |||
| Strzepek et al., 2012 [39] and Sokolov et al., 2005 [38] | IGSM-WRS Global Integrated Model of the water resource system | * | * | * | * | Included in the set of modules to estimate the effect of climate changes on the water resource management model for allocating water and energy resources (MIT) | |||||
| Irabien and Darton, 2016 [40] | Energy, water, food nexus (E-W-F model) | * | * | * | The process system analysis method connecting the input to demand based on the life cycle sustainability analysis of the W-E-F Almeria´s tomato supply chains and greenhouse production. | ||||||
| Wang et al., 2017 [41] | WEEN | * | * | * | * | * | The Water-Energy and Emission Nexus model for the steel-making plant analysis that shows the optimal combination of technologies to decrease the consumption of resources and reduce the CO2 emission | ||||
| Vadiee and Martin, 2012 [22], Vadiee and Martin, 2014 [42] | Closed greenhouse concept | * | * | * | * | The energy management in the closed greenhouse, the optimal combination of technologies, analyses the integration between Thermal Energy Storage (TES) and the closed greenhouse | |||||
| Vant Ooster et al., 2007 [43] | Zero fossil energy greenhouse | * | * | * | * | The combination of technologies for the zero-fossil energy consumption in greenhouses | |||||
| Speetjens et al., 2012 [23] | KASPRO model | * | * | * | * | The optimal combination of greenhouse technologies for a region in Taiwan | |||||
| Vanthoor et al., 2012 [21] | Financial Model | * | * | Investigated ten predefined greenhouse alternatives with different technology levels to identify configurations with the highest Net Financier Result (NFR) | |||||||
| Speetjens et al., 2008 [7], Zaragoza et al., 2007 [35], Buchholz et al., 2004 [9], Janssen et al., 2004 [33], Jochum et al., 2006 [34], Zaragoza et al., 2008 [8], Van Straten et al., 2004 [36] | Watergy Greenhouse | * | * | * | * | Developed an adaptive control concept for reducing water consumption by using new technology to provide cooling or heating by generating water with a tower, as a Watergy greenhouse. (Technical University in Berlin, research station Las Palmerillas, Almeria, Wageningen University). | |||||
| Barry, 2007 [45], James et al., 2002 [44], Johnson et al., 2008 [10] | Watergy: Cost-effective solution for water system | * | * | * | * | * | Analysis of the municipal water supply and wastewater treatment systems (The Alliance to Save Energy, international program) | ||||
| deMonsabert and Liner, 1998 [46], Barry, 2007 [45] | Watergy model: water conservation practices on energy consumption | * | * | * | * | The model explicitly details the relationships between the direct and indirect water and energy savings under the FEMP (Federal Energy Management Program) requirement | |||||
Based on water-energy nexus studies, the researchers have increasingly begun investigations in the areas of minimizing the water consumption [11], minimizing the energy consumption [24], [25], and minimizing the economic costs [26]. Technology has played an essential role as the confluence point of water and energy flows in the nexus analysis [27]. The system analysis methods and life cycle analysis (LCA) have been successfully used to simulate the process of the complex industrial and greenhouse systems [28], [29]. In the agriculture sector, the greenhouses are important in utilizing water and energy resources and investing in their economy. Despite that, in almost none of the previous research works, comprehensive studies were done involving the mix of water, energy, and technology along with the supply of watergy services with the objective function of minimizing the total cost.
Most analytical models have only focused on the detail of flow analysis of a single resource or a specific issue of water and energy. In the macro-level water-energy nexus models based on bottom-up technology, the water demand or energy demand is considered an exogenous variable [30]-[32].
It is rarely observed that water-energy nexus modelling has intended to provide water-energy services (watergy services) or the final product of the system. Water and energy studies conducted as watergy greenhouses have not been pretty comprehensive or have only analysed technology modelling [7], [9] and applications [33]-[36] in the greenhouse more from the microscopic point of view. These reasons have motivated the development of an analytical tool that would enable identifying the optimal point of all water and energy flows and the technology mix for providing services. In the present study, energy conversion and economic cost are considered as technology assessments. Technology assessment is an interactive process that refers to the fundamental identifications and evaluations of technological changes aimed at contributing to the decision-making process. Supplying watergy services (the product) based on the developed model, according to the watergy system concept, and minimizing the total cost leads to productions with the least destruction of resources. Applying the concept of watergy and optimizing the water and energy flow for supplying watergy services (water-energy services) based on the minimum total cost is the objective of the present paper.
In the rest of this study, in the subsection on the watergy system, the six principles were proposed for that system. Then, it was followed by a drawing of a Watergy Reference System (WERS) as a conceptual model. An optimization model based on the concept of WERS was developed to obtain the optimal system structure. The developed model was used for a greenhouse as the case study in the next section. Finally, the sensitivity analysis of the proposed model was carried out in six scenarios for the case study on the hydroponic rose greenhouse in Iran.
Figure A.1 in Appendix A shows a schematic of the overall watergy system that contains two water (B) and energy (A) subsystems and their overlapping, interaction, and common space (C; watergy). The conceptual model based on the watergy concept indicates that energy flows in the energy subsystem (A), and water flows in the water subsystem (B). Two subsystems are an integral part of the overall watergy system.
In the present research, to define the concept of the water-energy nexus, the paradigm of the watergy system has been presented. It stems from the previous studies, such as the watergy project [33], [34] and watergy greenhouse [45], [46], and the expression of the water-energy nexus [12] in macro models [30-32] and micro models [41]. In this research, the comprehensive form of this water and energy overlap (water-energy nexus) has been taken into account as watergy. The general integrated system, comprehensively considering the two water and energy subsystems and their interaction (watergy), is called the watergy system. The watergy has different forms that indicate the complementary and competitive relationships between water and energy. Water facilitates the energy flow and introduces negentropy (reverse entropy) into the cycle. Energy flows facilitate water flow and enhance the potential for changes in the production processes. The interlinkages between water and energy flows in a system can be based on the comprehensiveness of processes and cause-effect relationships. It is, therefore, intended to present principles based on a review of previous works that provide a foundation for developing an analytical tool. According to the developed literature, six principles have been presented as follows.
For necessary relationship: two streams of water and energy are flowing in the watergy system and through different technologies to fulfil the system's operation [12].
Energy for water and water for energy: Gleick originally presented this concept in 1990 [47]. It was then applied as the linkage between water and energy [41].
Direct relationship: in some watergy technologies, more water is consumed to increase the system capacity, which again leads to increased energy consumption (or vice versa) [44].
Substitution between water and energy: water and energy can substitute each other in a watergy system [30].
Complementation of water and energy: optimizing the energy flow could save water and vice versa [46].
Water and energy interaction in the final layer for supplying watergy services: in the last layer of the system, whose output is water and energy services, both water and energy are flowing [48].
Although there are overlaps between principles, these principles provide an appropriate means of developing a conceptual model that would be the basis for formulating the mathematical model representing the interaction between water and energy flows.
The Reference Energy System (RES) depicts only single energy flows from resources through the process, conversion, and other layers to meet the energy demand [49]. In contrast, the Watergy Reference System (WERS) has been developed to depict the integrated water and energy flow.
WERS illustrates the interactions between the water and energy flows, technologies, and system components with the system's output. The case study of this research is a greenhouse whose WERS is shown in Figure 1. WERS consists of several layers (the resources, process, conversion and treatment, distribution, and integrated layer with recycling) for supplying watergy services.
Conceptual model of the greenhouse watergy system the Watergy Reference System (WERS)
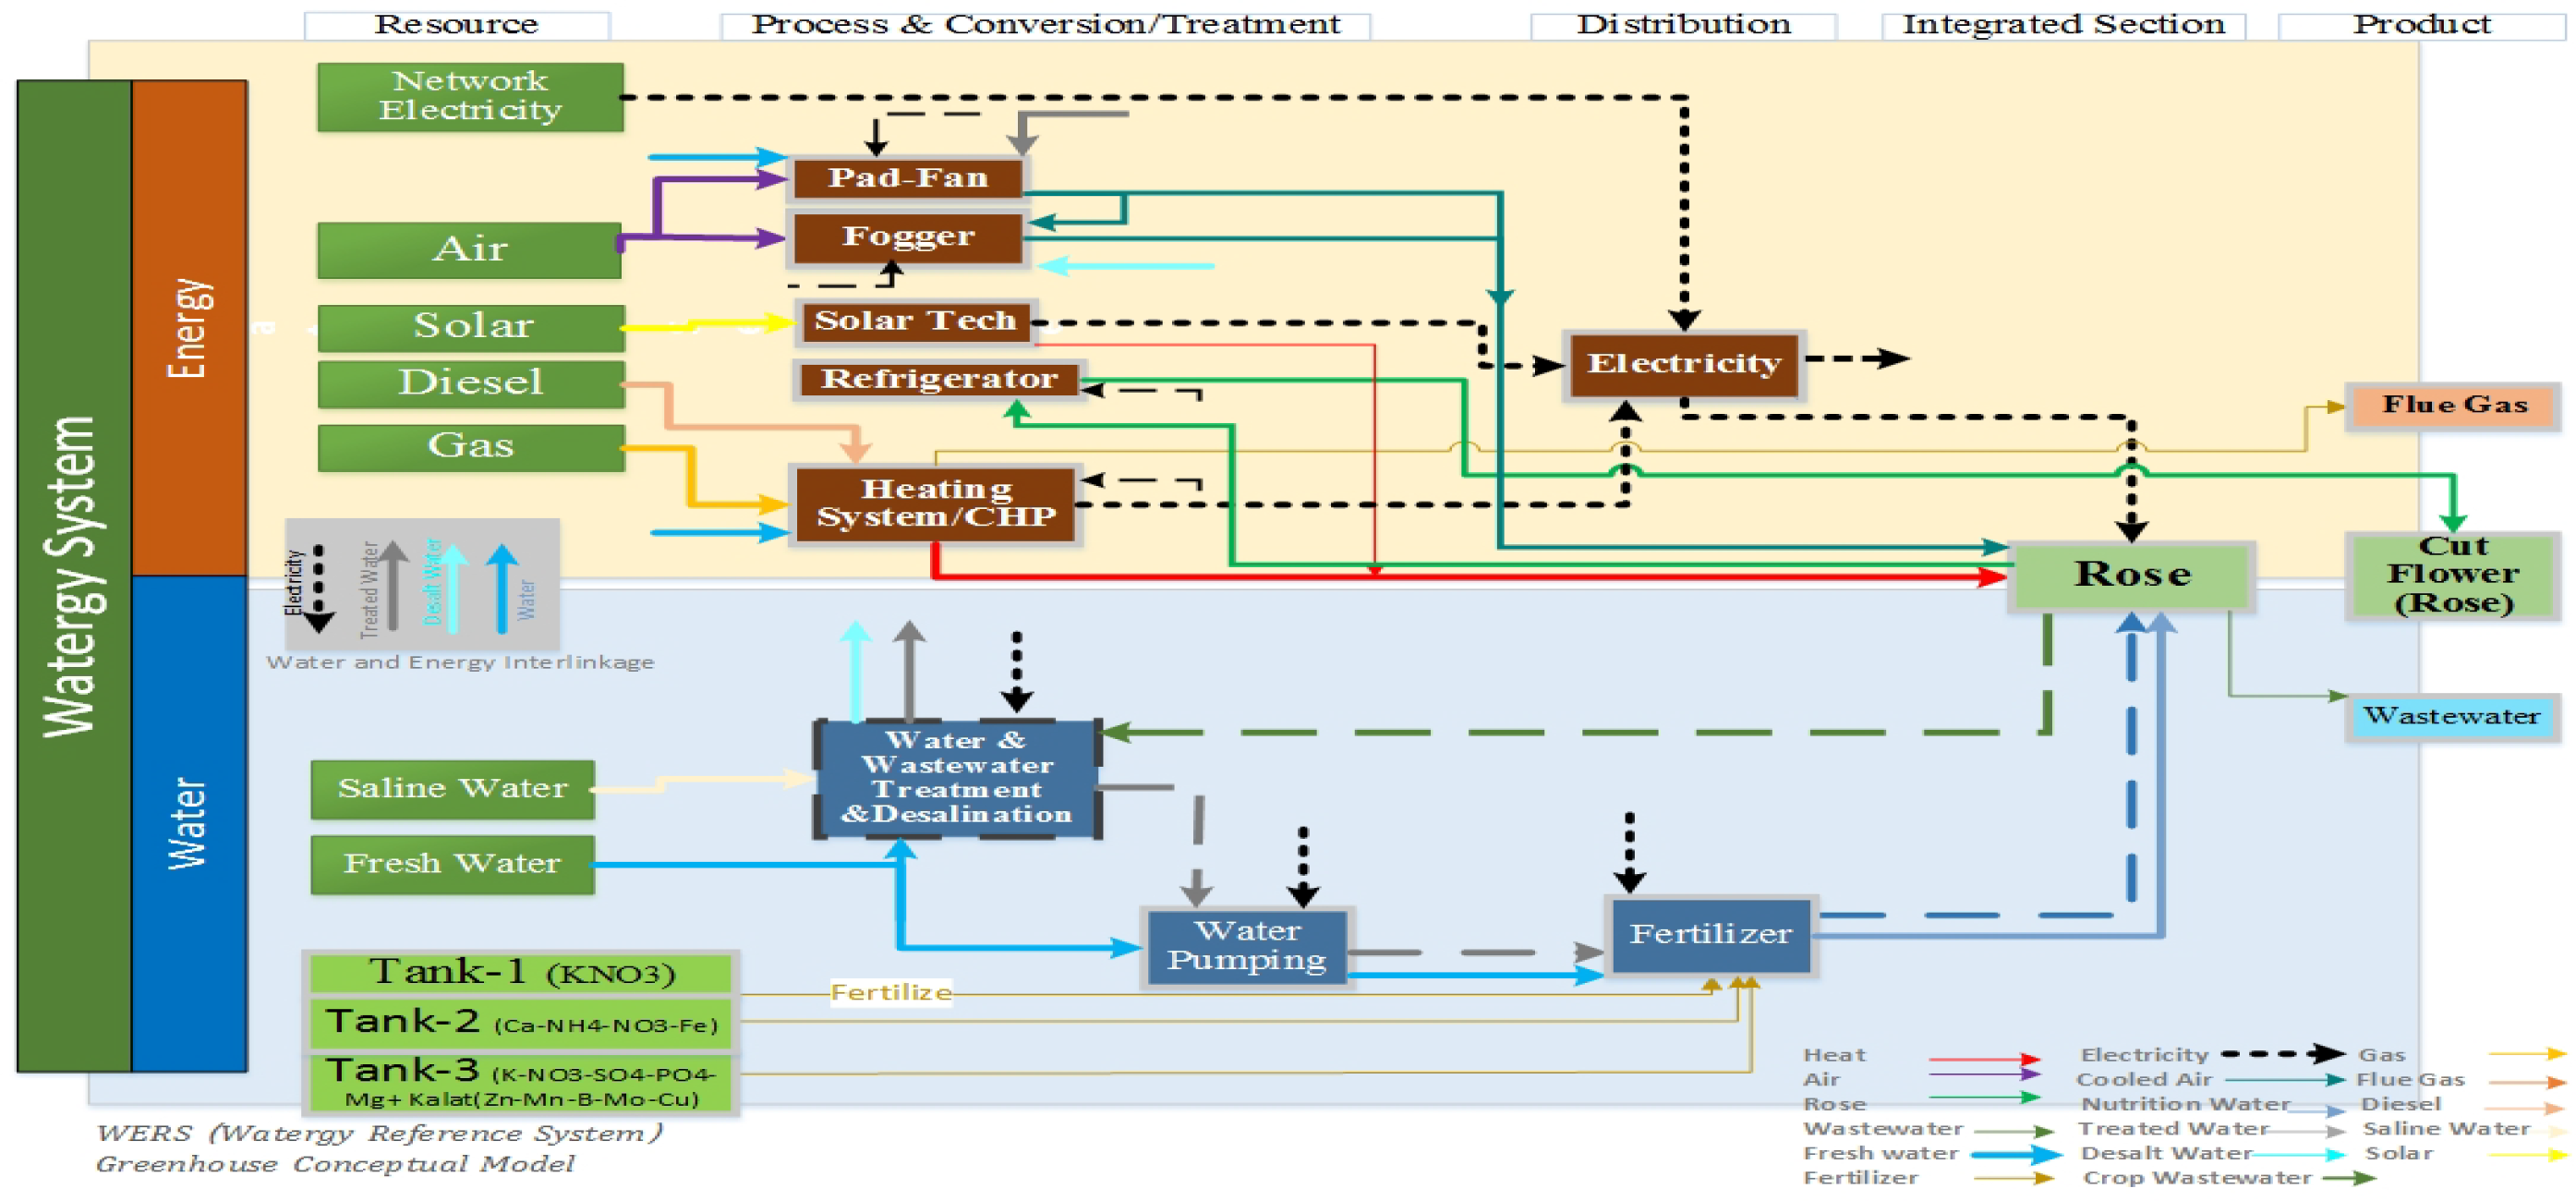
The proposed method for integrating the water and energy demands for watergy services being supplied (e.g., Rose product) is different from the previously developed methods (such as the CLEW model) that define individual demands for water and energy in the demand layer. System components have been identified as Control Volumes (CVs) that could represent one or a bundle of alternative technologies. In the WERS, alternative technologies are identified by a box in each greenhouse section. The concept of CV has been used as an open system [49] to show the system's input and output flows.
The WERS includes two subsystems indicated by two background colours (yellow for the energy and blue for the water subsystems). The outflow from each control volume represents a specific quality of water or energy. If the water quality changes in the CV, the CV will be part of the water subsystem. If the transformation of the energy carrier occurs in that CV, it will be identified as a flow in the energy subsystem. The recycling has also been included to reflect the retrieval of the drainage in the WERS diagram. The WERS of the greenhouse in the present case study considers watergy services (cut flowers of rose) in the output layer. Therefore, the proposed method couples the demands for water and energy to create endogenous synergies among the water and energy subsystems.
Mathematical Programming has been applied to implement the conceptual model. The mass and energy balances that connect different layers of the watergy system are attained using the bottom-up technology-based optimization model of the ESM model (for the historical background of ESM, see Appendix C) [50], [51]. The objective function is the system's total costs, which includes the cost of water and energy resources together with the features of the technology. The novelty of the present study is having added the coefficients of the water demand and energy demand to optimally supply watergy services to a set of the model's constraints related to the product type (resulted watergy services). This novelty results from endogenously considering the water demand and energy demand in the integration layer.
In this study, a new method is developed by adding an integration layer to the optimizing model with the objective function of the minimum total cost. In this layer, the demands for water and energy for supplying the water and energy services are endogenously calculated based on the considered equations related to the model according to the considered product of the system. Therefore, the total costs of capital, operation and maintenance, and resources form the main criterion for identifying the optimal configuration of the system for supplying services (the product). The end product has been assumed to be roses as the product of the greenhouse case study in the developed model. It is called "Watergy in Greenhouse Modelling for Analysis (WEGMA-1)". The model also includes water recycling technologies and the use of renewable energy resources (solar energy only was considered in this study) in the surrounding of the greenhouse. Being equivalent to considering the system's interaction with its environment, it enables analysing the impact of renewable resources on the sustainable production of food.
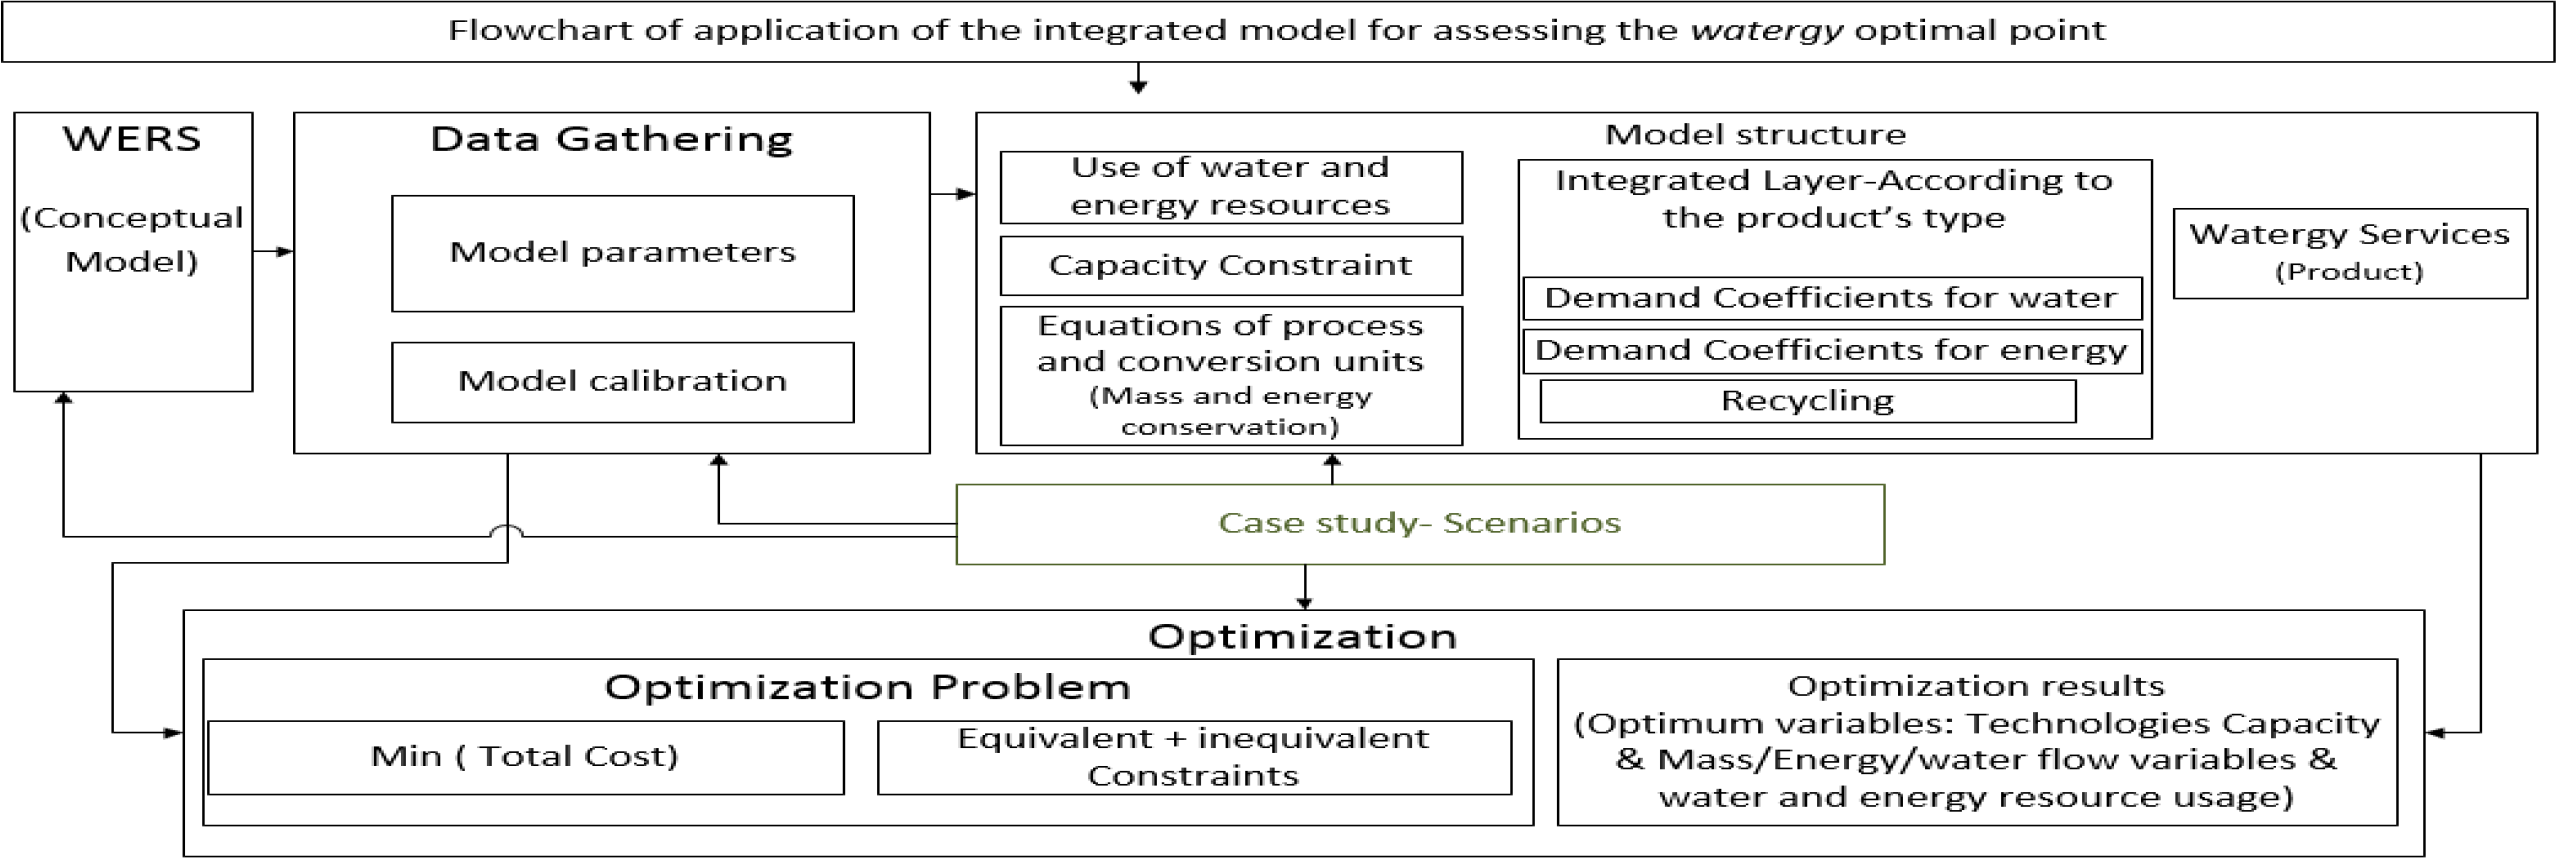
Figure 2 shows the steps of the proposed method for developing an integrated water and energy system model and the watergy optimality. This figure shows the structure of the relationships between the equations governing the integrated water and energy model. This procedure has five main steps.
Drawing a WERS as a conceptual model is the first step. In the second step, the data of the desired system are collected based on the WERS. These data enable calculating coefficients related to technologies and system demand, and model validation. The third section shows the structure of the mathematical model. Mathematical constraints are modelled in this section. These relations are divided into three levels. The first level includes the equations of resources, the capacity of technologies, and the equations of process and conversion. The second level is the integration layer (an innovation of the present study added to make the connection between water and energy flows at different rates). The third level is coefficients related to watergy service (product). The fourth step is defining the scenarios, and finally, the fifth step is the model optimization based on the total cost minimization objective function in different scenarios.
Framework of the presented model for the watergy system
The objective function is the minimum total cost to reflect the efficient use of resources and consider a total of water and energy subsystems to supply sustainable watergy services. The total cost function, as represented by Eq. (1), is the sum of the present value of the investment (), operation and maintenance (), costs of resources () including energy, water and material, and externalities (). An externality is a cost or benefit caused beside a production [52]. In the greenhouse model, emissions from combustion gas and sewage result in externalities of the system. However, considering the national environmental regulations, these externalities are zero in this case study. The cost data for various greenhouse technologies are given in Appendix B (Table B.1).
(1)
The constraints of the model are introduced below:
Watergy services are considered the end product of the system that the system should supply. Eq. (2) sets the watergy service into the model:
(2)
where F is the consumption of the input flow of the energy/water (product demand) k to the technology τ for producing the watergy service (system production) j in the time t; U is the value of the watergy service j, and α is the seasonal share of the service j; η is the efficiency function of converting inputs to the final output in the greenhouse system.
The equations for calculating the demand coefficients in the integration layer depend on the case study system. Based on the WERS of the greenhouse case study (Figure 1), heating (the air temperature), cooling (the air flow and temperature and humidity), and irrigation/fertigation are the main demands for crop production. The heating demand coefficient in cold seasons in the inner integrated layer of the model is represented by Eq. (3) [53]:
(3)
The heat demand Q is estimated by the overall heat transfer coefficient u, the surface of the greenhouse cover of Ac per the greenhouse floor area Ag, the design value of the inside temperature tid, the mean temperature increase at night by heat storage in the floor soil and bulk during the daytime tst, the mean night temperature tmn, the number of night hours nn and the number of days in cold months nd. Regarding the average night temperature, Appendix E shows the recorded outdoor temperatures of the greenhouse, which is the basis for calculating tmn for two months of the year. The air flow for the ventilation and cooling demand coefficient in the hot season is provided by the NGMA (National Greenhouse Manufacturing Associations) report from Eq. (4):
(4)
In this equation, AF stands for the air flow, L represents the greenhouse length, and W represents the greenhouse width. Felev is the elevation factor, Flight shows the light intensity factor, and Ftemp indicates the factor of the temperature increase at a distance. The coefficient of the yearly water necessary for the humidity demand coefficient for a greenhouse is estimated by Eq. (5), adapted from the studies of Golzar et al., 2018 [16] and Van Beveren et al. (2015) [18]:
(5)
where Gχ is the water needed to be injected into or rejected from the greenhouse for maintaining the desired water content in the greenhouse atmosphere, E is the crop transpiration rate, V is the moisture loss through ventilation, and C is the condensation on the indoor greenhouse cover. The evapotranspiration of plants is another main factor that has enabled the plant to estimate the water demand coefficient [53]. Eq. (6) indicates the amount of the plant's water requirement with CWR:
(6)
where kC represents the crop coefficient, ET0 stands for the amount of the reference evapotranspiration (the FAOPenman-Monteith equation), li is the loss factor for irrigation, and the ratio of the crop-covered area to the greenhouse floor area. The water requirements of roses were 700 ml and 400 ml per plant in a day in the hot and cold seasons, respectively, on the irrigation schedule in the pilot greenhouse. An important aspect of the model has been the addition of the integrated CV, forming the confluence of water and energy flows for supplying watergy services. This model integrates the two water and energy subsystems according to the water and energy demands of the case of the production of roses, i.e., heating, cooling, irrigation, and so on. This feature is based on the sixth principle of the watergy system. Eqs. (3)-(6) change according to the demands of the production type in other cases than the greenhouse.
Where the capacity of technologies is available, one can attain the amount of flow through technologies in each of the defined layers. For illustrating the capacity limitation in the model, Eq. (7) has been used:
(7)
In this equation, Y shows the new capacity of the technology τ for converting energy/water of k to j in the seasonal zone l. H is the historical technology capacity, and PF is the plant factor.
For energy/water, the input and output relationship in technologies is presented based on the principles of energy conservation (first law of thermodynamics) and mass conservation (Eq. (8)). The relations between technologies and the CVs are considered in different layers according to Eq (8). This constraint is extended to all middle layers and CVs in the WEGMA-1 model:
(8)
where P is energy/water flow from the input energy/water resource f to the technology τ for the production of the energy/water o in the time t. η is the efficiency of the technology τ, and A represents the input energy/water flow o to the level where the output technology for the production e in the time t in the greenhouse.
One of the most effective ways to reduce water consumption is to recycle drainage in irrigation systems and reuse it in greenhouses. Conrad [54] explains the recycling procedure in detail. Yearly recycling in the WEGMA-1 model is considered an independent layer, and Eqs. (9) and (10) describe the governing recycling relationship:
(9)
(10)
Eq. (9) shows the share of the produced wastewater in the technology τ in the time t, while it can be treated and recycled. The sewage water (W) in the greenhouse (Eq. (9)) either represents a byproduct of the technology transferred to wastewater treatment plants or gets discharged into the environment as a pollutant. Fnlτt is the product of the flow n in the technology τ from the flow l at the time t. βrlnτt is the coefficient of the wastewater r produced from the conversion of the flow l to the flow n in the technology τ at the time t. Mlnøτt is the input flow l from the technology ø to the technology τ at the time t.
The water/energy flow in the process and conversion technologies originate from various resources of water/energy. In Eq. (11), WE shows the flow o from the water/energy resource f in the time t. P indicates the input water/energy o to the technology from the resource f.
(11)
In addition to the various energy resources such as gas, electricity, diesel fuel, and solar energy, the water flows with various qualities are also considered. The solution strategy and brief schematic of the model process algorithm are demonstrated in Appendix D (Figure D.1).
The model has been applied to study the optimal point of the watergy performance in a greenhouse case study. The selected case is a commercial hydroponic greenhouse called Nikan (0.5 ha) and located at Tankaman village in Alborz province (38.9168°N, 45.5692°E) in Iran, a multi-span gothic type greenhouse with a plastic cover. The physical features of the pilot plant, related to one-year cultivation having started in September 2018 and ended in August 2019, are presented in Table 2. The product is the rose flower, and the average rose yield for hot and cold seasons was 160 and 80 cut flowers per square metre and year, respectively. The data on the water, electricity, and gas consumption were measured during the period of cultivation in the greenhouse.
Physical features, operating setpoints, and technical features in the pilot greenhouse
| Parameter | Unit | Value |
|---|---|---|
| Length–Width–Height | m | 125–40–7.1 |
| Greenhouse surface area | m2 | 8,000 |
| Plant density | Number of plants per 1 m2 | 8.4 |
| Day/night temperature set point | °C | 20/16 |
| Humidity setpoint | % | 50–70 |
| Pad area | m2 | 160 |
| Heating system | - | Boiler |
| Cooling and humidification system | - | Pad-fan and fogger |
| Fertigation | - | Existing |
| Irrigation system | - | Dripper |
| Wastewater recycling | - | Not existing |
The sensitivity analysis method of boundary conditions has been used to verify the functions of the model (presented in Appendix F). To validate the model, comparing the model's results with those of the empirical values is the most reliable way. The model was run with the supplied quantities of water and energy using the current pilot technologies (Nikan greenhouse). Table 3, Figure F.1, and Figure F.2 in Appendix F depict the observed data and the model prediction results for the consumption of resources in the pilot greenhouse in one year. As shown in Table 3, the Absolute Relative Error (ARE) is quite low, indicating the model's validity based on empirical data.
WEGMA-1 validation via comparing the measured data with the model prediction
| Index | Unit | Total season | ARE | Hot season | ARE | Cold season | A R E | |||
|---|---|---|---|---|---|---|---|---|---|---|
| Observed | WEGMA-1 Model | [%] | Observed | WEGMA-1 Model | [%] | Observed | WEGMA-1 Model | (%) | ||
| Total annual electricity consumption | kWh | 182,676 | 188,538 | 3 | 130,076 | 136,245 | 4.7 | 52,600 | 52293 | 0.6 |
| Total annual gas* consumption | m3 | 268,014 | 263,139 | 2 | ||||||
| Total annual water consumption | m3 | 17,542 | 17,029 | 3 | 13,772 | 13,443 | 2.4 | 3770 | 3587 | 4.9 |
| Fertilizer** | kg | 8,880 | 8,994 | 1 | ||||||
Major gas consumption is for the heating system in winter.
Fertilizer often consumed the same amount in the hot and cold season and just changed the amount of the micronutrition in fertigation.
The greenhouse owner intends to construct a new greenhouse (0.5 ha) in addition to the old one. The expansion of the greenhouse capacity is assumed to rely on the optimal combination of technologies according to the watergy optimal point. Such an expansion plan is motivated by policies on the greenhouse production in Iran, which supports the increase of the greenhouse cultivation from 14,000 ha to more than 48,000 ha in a 10-year time horizon (2018?2028) (Iran's Sixth and Seventh National Development Plan). The design of the extension of the greenhouse capacity has been studied with the sensitivity analysis of the WEGMA-1 model.
Table 4 shows the resources and technologies that have been included in the set of data. The new greenhouse's product (watergy services) was assumed to be 725,000 cut flowers per year for a 0.5-ha greenhouse (a constant production yield is considered in the sensitivity analysis). Also, in the humidifier technology, RO desalination (in treatment CV) was included along with the fogger system to prevent sedimentation on fogger nozzles.
Water and energy resources and technologies applied in WEGMA-1
| Control Volume (CV) | Resources & Technologies | Efficiency | Description |
|---|---|---|---|
| Energy Sources and Resources | Grid Electricity | - | - |
| Solar Energy | - | Renewable energy | |
| Natural Gas | - | Fossil fuel | |
| Diesel | - | Fossil fuel | |
| Water Resources | Fresh Water | - | Conventional water |
| Saline Water | - | Nonconventional water | |
| Heating | Boiler | 85% | The boiler generates hot water from fossil fuel combustion. The hot water supplies the greenhouse heat demand. |
| Solar Collector | 55% | A solar thermal collector collects heat by absorbing solar radiation, which supplies greenhouse hot water demand. | |
| CHP | 40% Heat | CHP (Combined Heat and Power) generates high-efficiency electricity by using heat recovery to supply hot water as a byproduct. | |
| Electricity Supply | PV | 17% | PV (Photovoltaics) converts the radiation into electricity. |
| CHP | 40%Power | CHP generates high-efficiency electricity while also supplying hot water as a byproduct. | |
| Cooling and Humidification | Pad-Fan | 75% | A “pad-fan” system uses fans to pull air through evaporative cooling pads. The cooling effect is produced when water evaporates and cools the air as it is pulled through the pad. |
| Fogger | 50% | It is a set of nozzles in the greenhouse. It creates the moisture needed by the greenhouse and is desirable for plant growth by spraying very small drops (fog) due to high-pressure water. | |
| Hybrid of fogger and pad-fan | - | Two cooling technologies are used together. | |
| Irrigation system | Open cycle (fertilizer) | - | The equipment set (includes pipe, pump, valve, and tank) supplies nutrition water to the plant. Fertilizer equipment stabilizes the formulation of nutrition water and manages irrigation. |
| Closed cycle (fertilizer addition to Drainage recycling) | - | It is an irrigation system that includes drainage treatment technology. | |
| Wastewater treatment and disinfection | RO | 65% | RO (Reverse Osmosis) is a water purification process that uses a partially permeable membrane to separate ions, unwanted molecules, and larger particles from drinking water. |
| UV | - | A disinfection method that uses UV (ultraviolet light) to kill or inactivate microorganisms | |
| Wastewater treatment and reuse | 98% | A process that converts low-quality water to high-quality water for use in a greenhouse. |
The total implementation period of the model is 15 years, and each period of the model run is 5 years. Although technologies can have different lifespans, the lifetime of all of the technologies are assumed 20 years in this research work. Also, it is assumed that the technical performance of the installed technologies will not degrade during their utilization at the cost of annual operational and maintenance services. Six scenarios, which relate to reducing subsidies on water and energy and changes in the prices of fertilizers, have been considered for sensitivity analysis. The results obtained in each scenario have been compared with the base case. The base case is a combination of technologies in the actual greenhouse and is not optimal in the current situation. But BAU (Business-as-Usual), scenario A, is the optimal combination of technologies to continue the current boundary conditions in the Base Case. The modelled scenarios at different boundary conditions are explained in the following paragraphs.
The first scenario is identified as scenario A, representing the business as usual. The prices of energies are subsidized, and they are 0.25 Ȼ/ kWh for electricity, 0.75 Ȼ/m3 for natural gas, and 1.7 Ȼ/L for diesel oil, but solar and water resources are considered free due to current unlimited resources.
Scenario B has been presented to examine the impact of fertilizer price, assuming that other conditions are constant and similar to those of scenario A. The fertilizer price has been reduced by 90%, and an abundance of water resources has been assumed.
Scenario C presents the reduction of energy subsidies and the increase of electricity price to 6 ?/kWh (the price of electricity in the low capacity solar PV in Iran), while other conditions are considered the same as in scenario A.
In scenario D, the subsidies on gas and diesel are reduced, and the electricity price increases. Prices of gas and diesel oil are assumed to rise to 6 Ȼ/m3. This selection is based on the prices of gas feed used in the Iran petrochemical industry and the FOB prices over the planned time horizon.
Water scarcity is an important issue in Iran, and overcoming this problem has dominated policies in the agricultural sector. In the fifth scenario (E), in addition to reducing subsidies on water, it is assumed that the water shortage shall be conveyed to the consumers through rationing the access to water. Therefore, a limit on the water flow has been included. In addition to all items assumed in scenario D, scenario E includes the limitation on access to water. The Iranian government plans to reduce the greenhouse water rights from 0.7 to 0.5 L/s per hectare.
In this regard, scenario E is considered to reach a maximum reduction of water consumption during the mentioned time horizon. Consequently, in the sixth scenario (F), it has been assumed that besides the conditions having ruled scenario D, fresh water resources have become out of reach, and nonconventional water resources (saline water) would be available in the greenhouse.
The system arrangements in different operation scenarios are examined and defined in Table 5.
Description of scenarios A to F in the sensitivity analysis
| Scenario | Description |
|---|---|
| Base Case | the actual situation of the pilot greenhouse |
| Scenario A | business as usual |
| Scenario B | higher fertilizer price |
| Scenario C | reduction of the electricity subsidies and increase in the electricity price |
| Scenario D | subsidies on gas and diesel are reduced in addition to an increase in the price of electricity |
| Scenario E | scenario D + a limited fresh water availability |
| Scenario F | scenario D + no fresh water availability |
Results of the model in scenario A indicate that using electricity from the power grid and heating the greenhouse with a boiler are preferred. Moreover, the pad-fan technology for cooling and drainage recovery systems (closed irrigation) has been selected. The first item of the six principles of watergy is observed in the first scenario. Water and energy are the main sources and necessary inputs to the greenhouse system. In scenario A, a 25% reduction in the fertilizer consumption is observed (due to wastewater recycling) compared to the pilot case (Base Case), and 8% and 13% reductions are obtained in the electricity and water consumption at the watergy optimal point. Simultaneous water and energy savings have occurred in the greenhouse system based on the fifth item of the six principles mentioned for the watergy system concept.
The total cost of the combination of technologies in the base case was gained 69,992 $. Compared to the base case, the system's total cost decreased by 15% in scenario A. Scenario B selects an open irrigation system (without the wastewater recovery system), and the pad-fan system provides cooling. The total cost decreases by 31% compared to the base case in scenario B.
In scenario C, the electricity price is increased. At the watergy optimal point, CHP (Combined Heat and Power) is selected to supply heat that would cover 7% of the total heat demand, and a fogger replaces the pad-fans to cool down and humidify the greenhouse. Furthermore, the RO (desalination) system is selected to provide the fogger with solute-free inlet water. As the fans consume too much energy in the pad-fan cooling system, choosing a fogger will reduce the greenhouse energy consumption. Due to this replacement, the water consumption of the cooling system in this scenario increased, given the use of RO. Ultimately, the power consumption was decreased by 31%, the water consumption was decreased by just 7%, but the gas consumption was increased by 3.5%. Also, the closed irrigation system is preferred to save on fertilizer. Unsubsidized electricity price in scenario C results in a 5% reduction in the system's total cost compared to the base case.
The results obtained in scenario D indicate that PV (photovoltaics) and the gas-using boiler are selected. Foggers and the closed irrigation system are chosen similarly to the case in scenario C. The reduction in the power consumption is like in scenario C; however, due to the use of PV instead of CHP, a slight reduction in the water consumption was observed at the watergy optimal point compared to that in scenario C (Figure H.1). The comparison of two scenarios, C and D, based on the second of the six principles of watergy, shows that a little more water is used for the CHP cycle (in scenario C) to supply heat and electricity. In scenario D, the increased gas price, together with electricity and the use of new energy supply technologies, results in a 17% increase in total costs for the production of greenhouse products compared to the base case.
At the watergy optimal point in scenario E, it is observed that the fogger was replaced with the pad-fan technology, resulting in lesser water consumption in pad-fans than in foggers (along with RO). Furthermore, a closed irrigation system was used. With the utilization of a decentralized small wastewater treatment system, the residual greenhouse wastewater is also processed. It has reached acceptable specifications for the pad-fan cooling system, leading to reduced fresh water consumption. The freshwater is replaced with wastewater to supply the system's non-irrigation water demand (Figure 5). Overall, the largest reduction of up to 18% in the fresh water consumption has been achieved in scenario E. Implementation of the new wastewater treatment technologies together with the increased energy prices results in a 21% increase in the total cost of the system in scenario E, as compared with the base case.
In scenario F, the RO technology is selected for water desalination. Using RO technology to desalinate all the water entering the greenhouse, the same desalinized water has been used by foggers. Hence, in this scenario, the application of foggers instead of pad-fans has been economically justified. The analysis indicates a 19% increase in the electricity consumption compared to scenario D. Using nonconventional water resource results in a 28% increase in the total cost of scenario F compared to the base case.
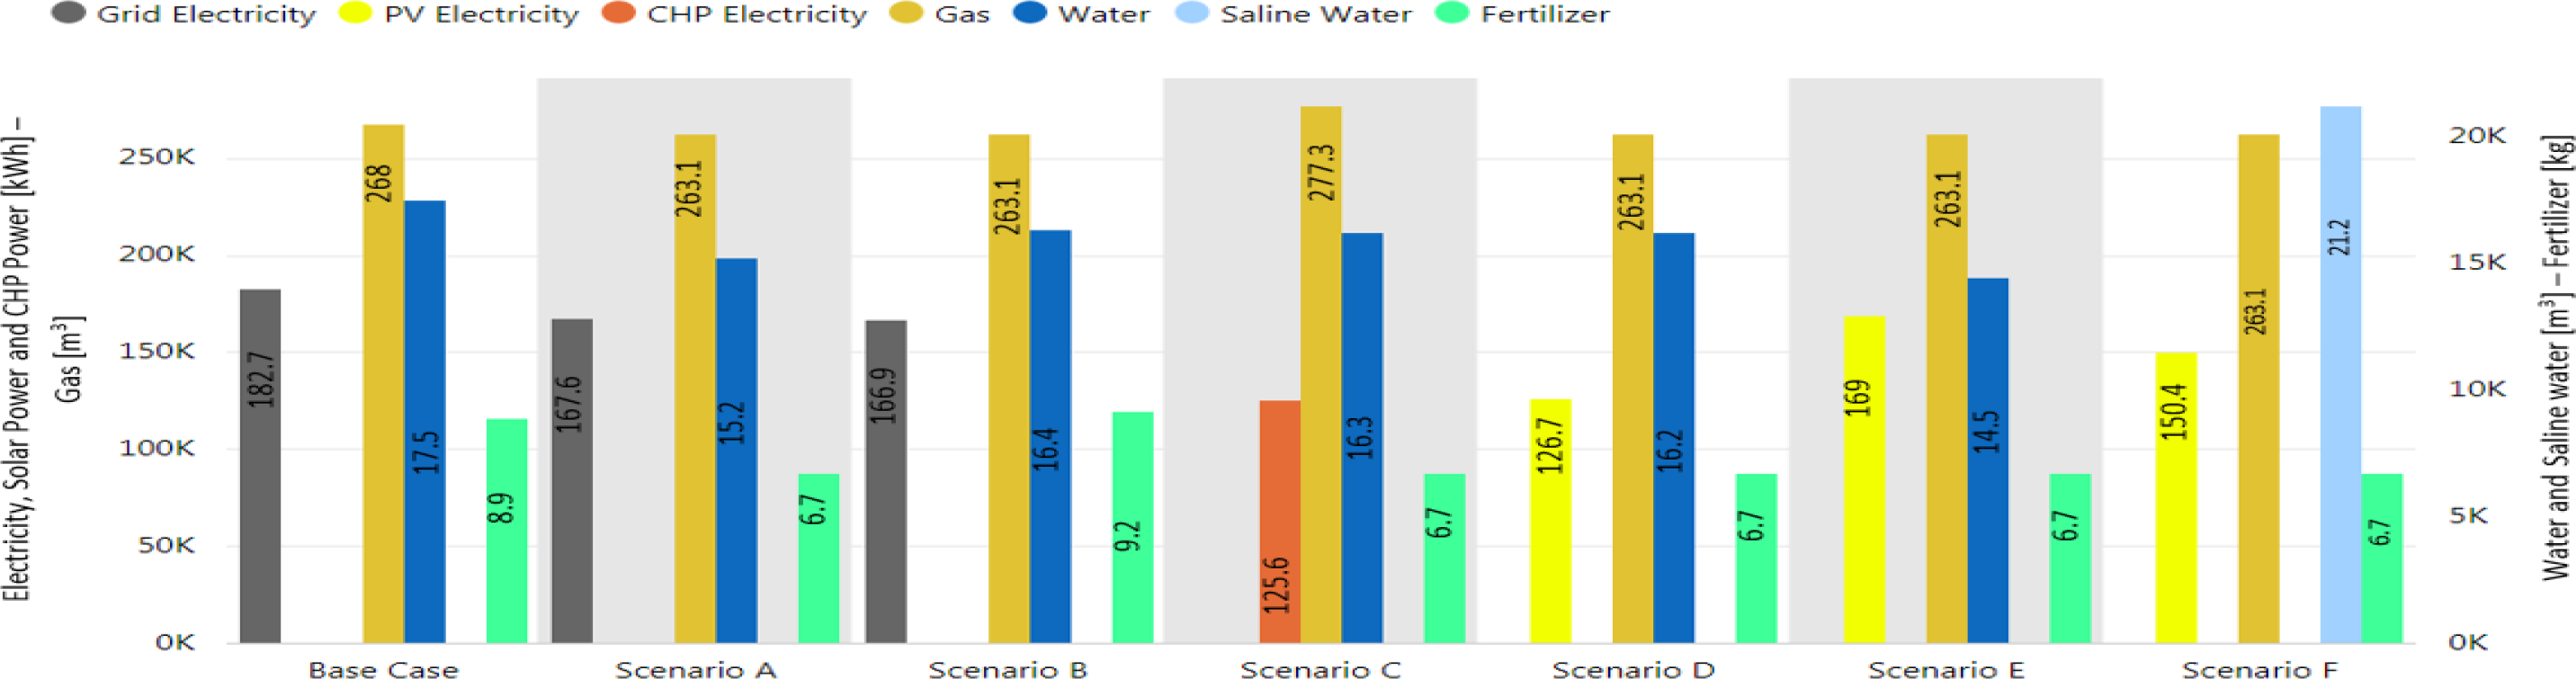
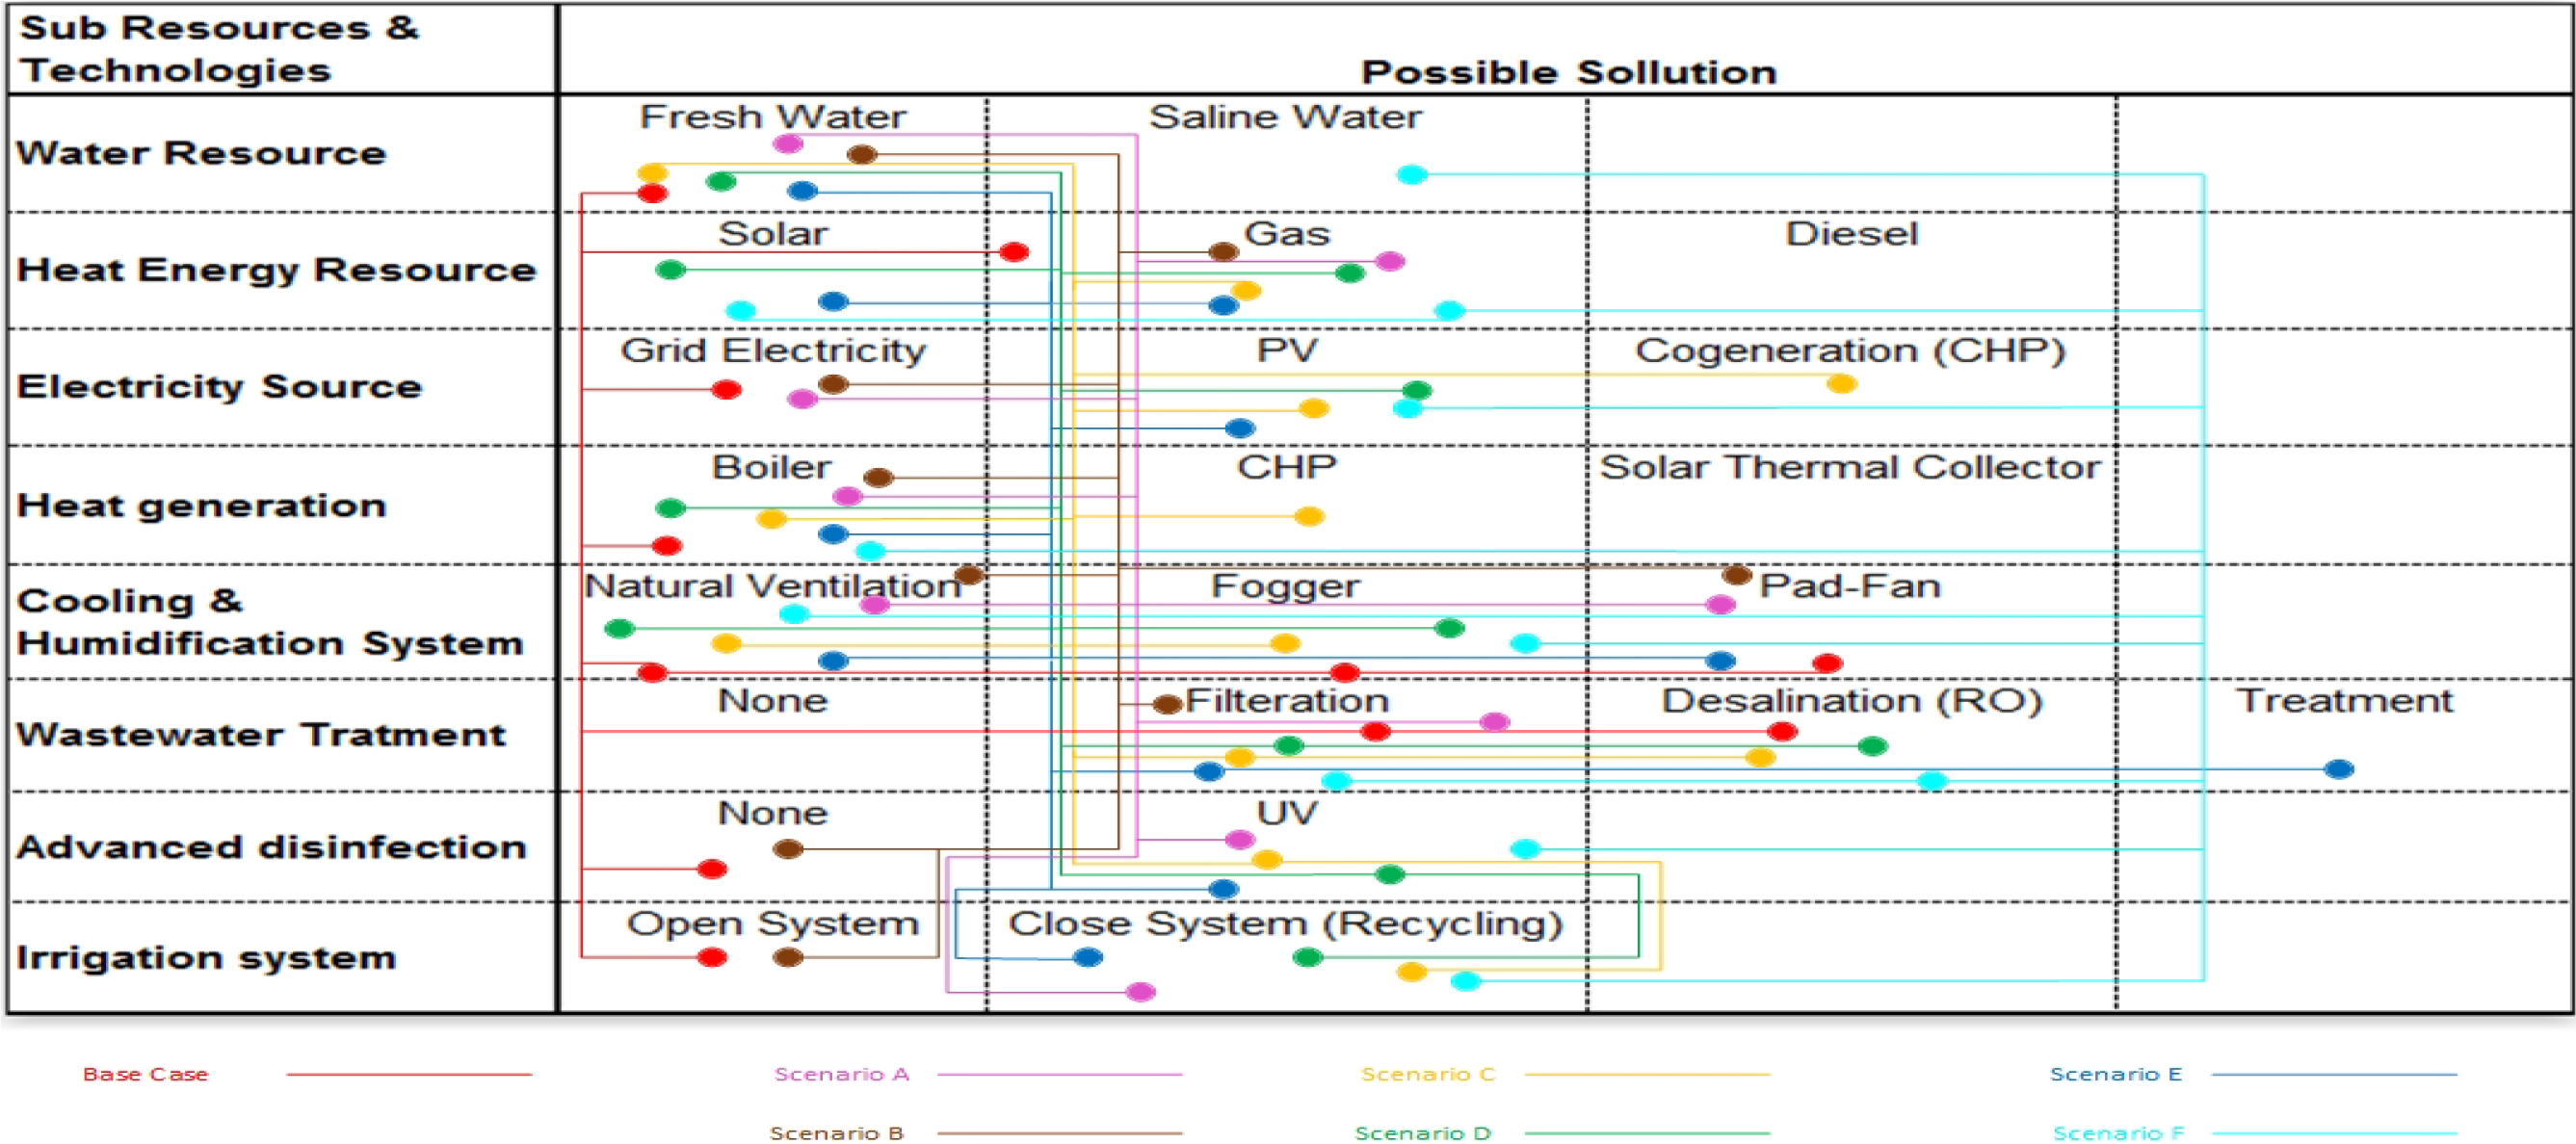
Figure 3 illustrates the trend of changes in the water and energy consumption and other greenhouse inputs in all scenarios. Results of the optimal combination of various greenhouse technologies used in six scenarios are illustrated in the morphology diagram (Figure 4).
Combined use of various sources in scenarios A to F; the vertical axis on the right shows the values of resources for the water volume [m3] and the amount of fertilizer [kg], and the vertical axis on the left indicates the amount of the electricity supplied by different technologies [kWh] and natural gas [m3]
Morphology diagram of a combination of technologies in the greenhouse for scenarios A to F
Developing an integrated model of the water-energy nexus with an integrated watergy approach leads to a more comprehensive understanding of the nexus, which is one of the needs to reduce the degradation of these resources. Unlike other studies, this article has presented the watergy reference system based on the six principles of watergy by studying different forms of the water-energy nexus introduced in previous research. For instance, Wang et al. [41] surveyed the second principle of watergy in their integrated model of the water-energy nexus, whereas deMonsabert and Liner [46] investigated only the fifth principle. The results related to the greenhouse case study reveal the advantages of an integrated watergy approach towards the water-energy nexus compared to that of a single flow of water or energy. The advantages of this model compared to others are as follow:
The technology combination has been selected by considering the consumption of water and energy resources, so the effect of energy on the selection of water subsystem technologies (e.g., treatment and recycling or desalination) has also been analysed. Whereas previous researchers, such as Vadiee and Martin [42] and Vant Ooster et al. [43], have provided greenhouse morphology diagrams only based on the optimal combination of the resources and technologies of energy. Also, in the energy subsystem, the effect of water consumption on the composition of technologies has been seen.
Unlike previous models, such as the TIAM-Fr [30] or CLEW [31] that considered the demand for water and demand for energy separately and as the final layer, this study considering the integration layer has caused to supply of watergy services calculated based on the water demand and energy demand endogenously.
In previous research, Al-Ismaili [29] presented the thermodynamic simulation of technologies in greenhouses but did not consider the optimal technology assessment based on the watergy optimal point.
In addition to the merits of the new integrated watergy approach and technology assessment in the present model, the discussion on the analysis of the scenarios of the greenhouse case study reveals the following points: a closed irrigation/fertigation system together with the recycling of fertilizer proves to be economical. Castro et al. [55] demonstrated the economics of metal recycling using the ExLCA (Exergy Life Cycle Analysis) method. With the reduction of subsidies, the power supplied by PV and CHP technologies is selected instead of the grid electricity. The sensitivity analysis results of various scenarios show that installing pad-fans is more economical than the fogger system in the face of water scarcity when the price of electricity is low.
Meanwhile, reverse osmosis technology (RO with 65% efficiency) ensures the quality of water entering the fogger technology. In previous literature on the analysis of evaporative systems in greenhouses, different results were presented compared to these two technologies [56]-[60]. The disagreement in previous research is the lack of an integrated and systematic analysis of water and energy flows, the cost of capital, and various related technologies simultaneously for both Pad-Fan and fogger technologies (taking RO into account).
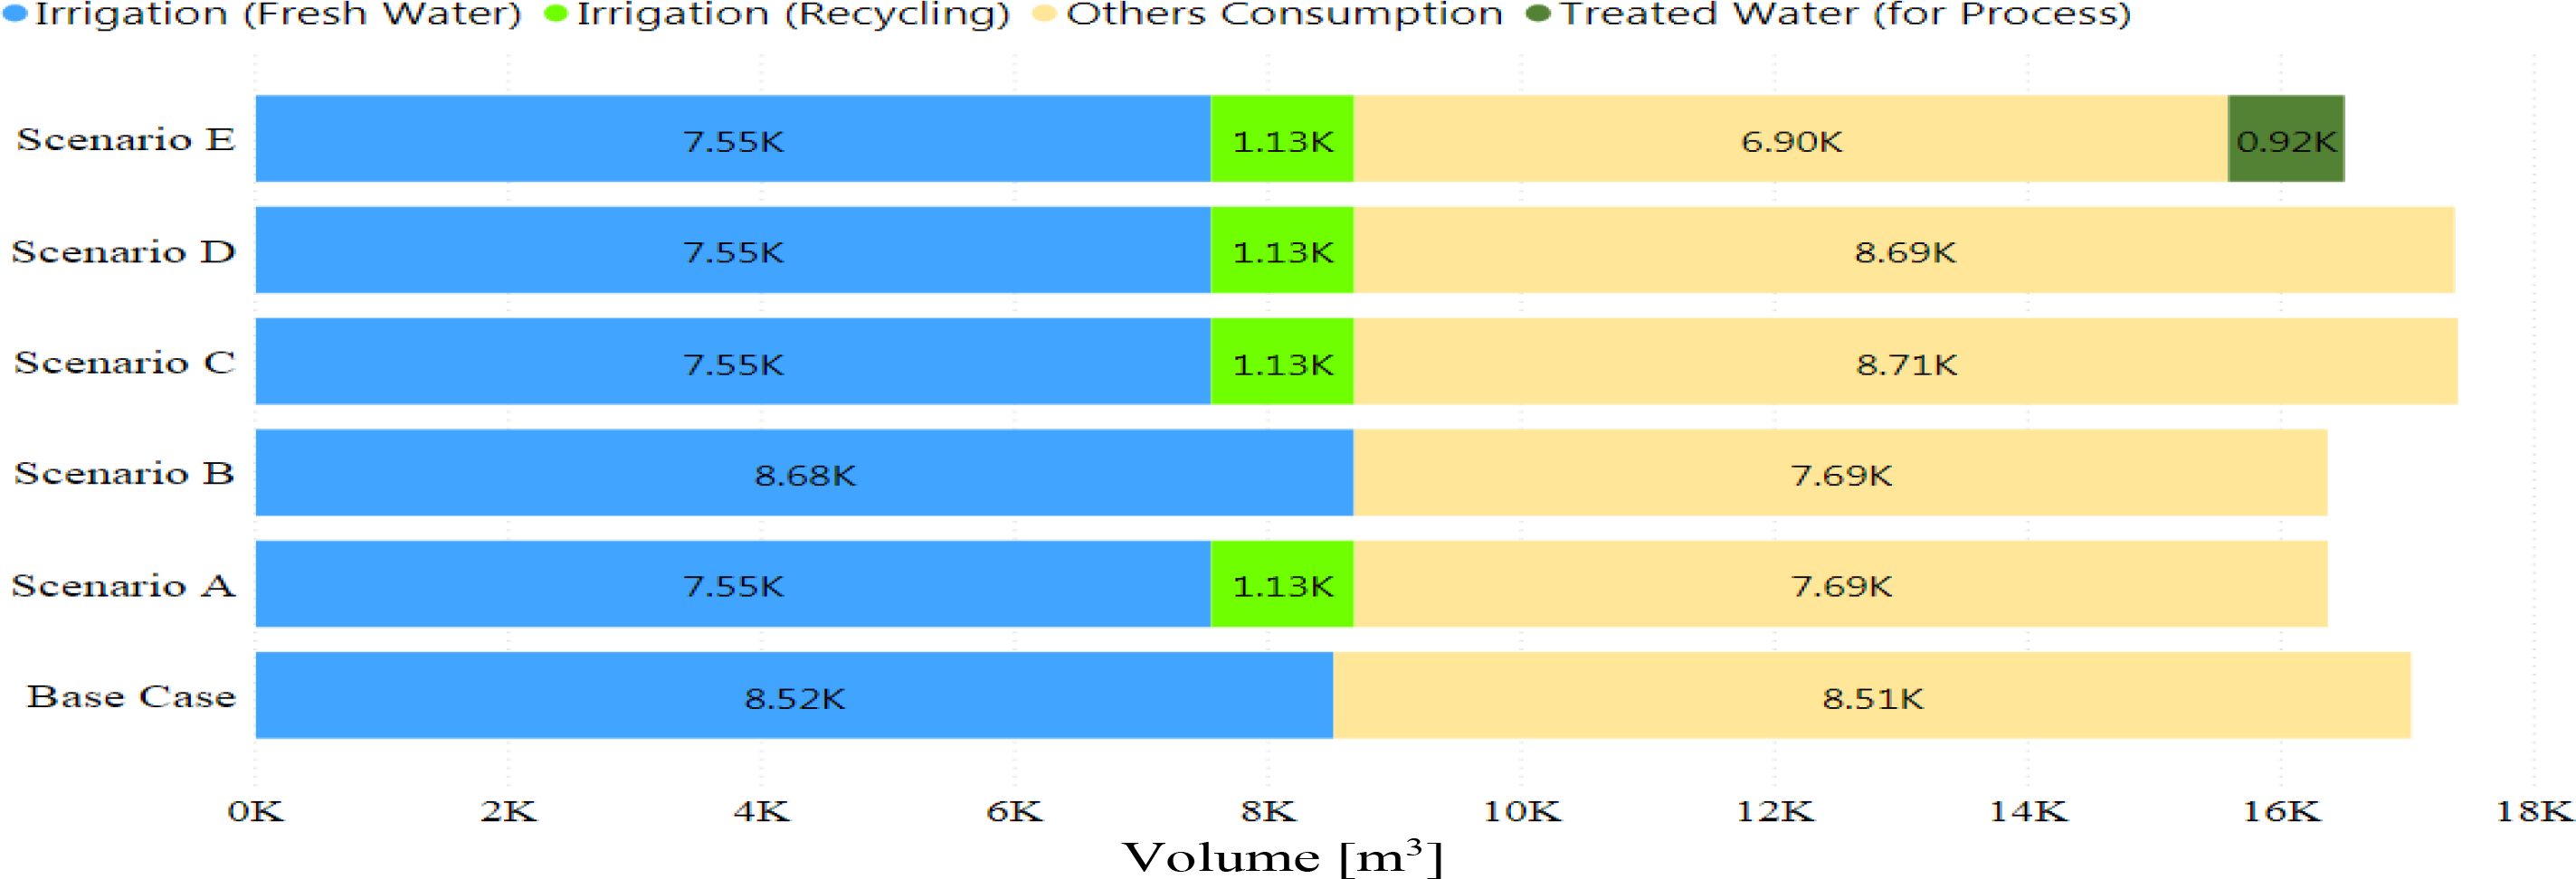
Also, the scenario analysis shows that tackling water resource constraints is possible by using nonconventional water resources and consuming more energy. Figure 5 presents the water consumption change with different qualities in different scenarios. Eventually, itis observed that changes in water quality are associated with changes in the technology mix.
Fresh water inputs to all scenarios are shown in Figure 5. In Scenario F, since saline water is used as the primary source of water, so it differs from other scenarios.
Contribution of various grades of water qualities in the greenhouse [m3/y] (contains fresh water for irrigation, fresh water for non-irrigation and treated water for irrigation, treated water for non-irrigation (cooling))
The comparison of scenarios E and D reveals that the growth of water scarcity and the selection of the drainage recirculation system has led to the selection of small-scale wastewater treatment systems for recycling part of the greenhouse wastewater into the cooling section, increasing the electricity consumption. This replacement of water and energy (the growth of energy consumption to supply water from nonconventional sources), also based on the fourth item of the six principles of watergy, is emphasized in previous literature as stated by Dubreuil et al. [30]. The radar diagram in Figure 6 compares the relative alternatives of the water-electricity-gas consumption for different scenarios with the base case (that is considered in the diagram with a value of 100). Figure 6 and Appendix H (Figure H.1) depict the water and energy substitution in different scenarios based on the fourth principle of watergy.
Percentage of water and energy consumption in different scenarios (with changes in water and energy boundary conditions) compared with the base case [%]
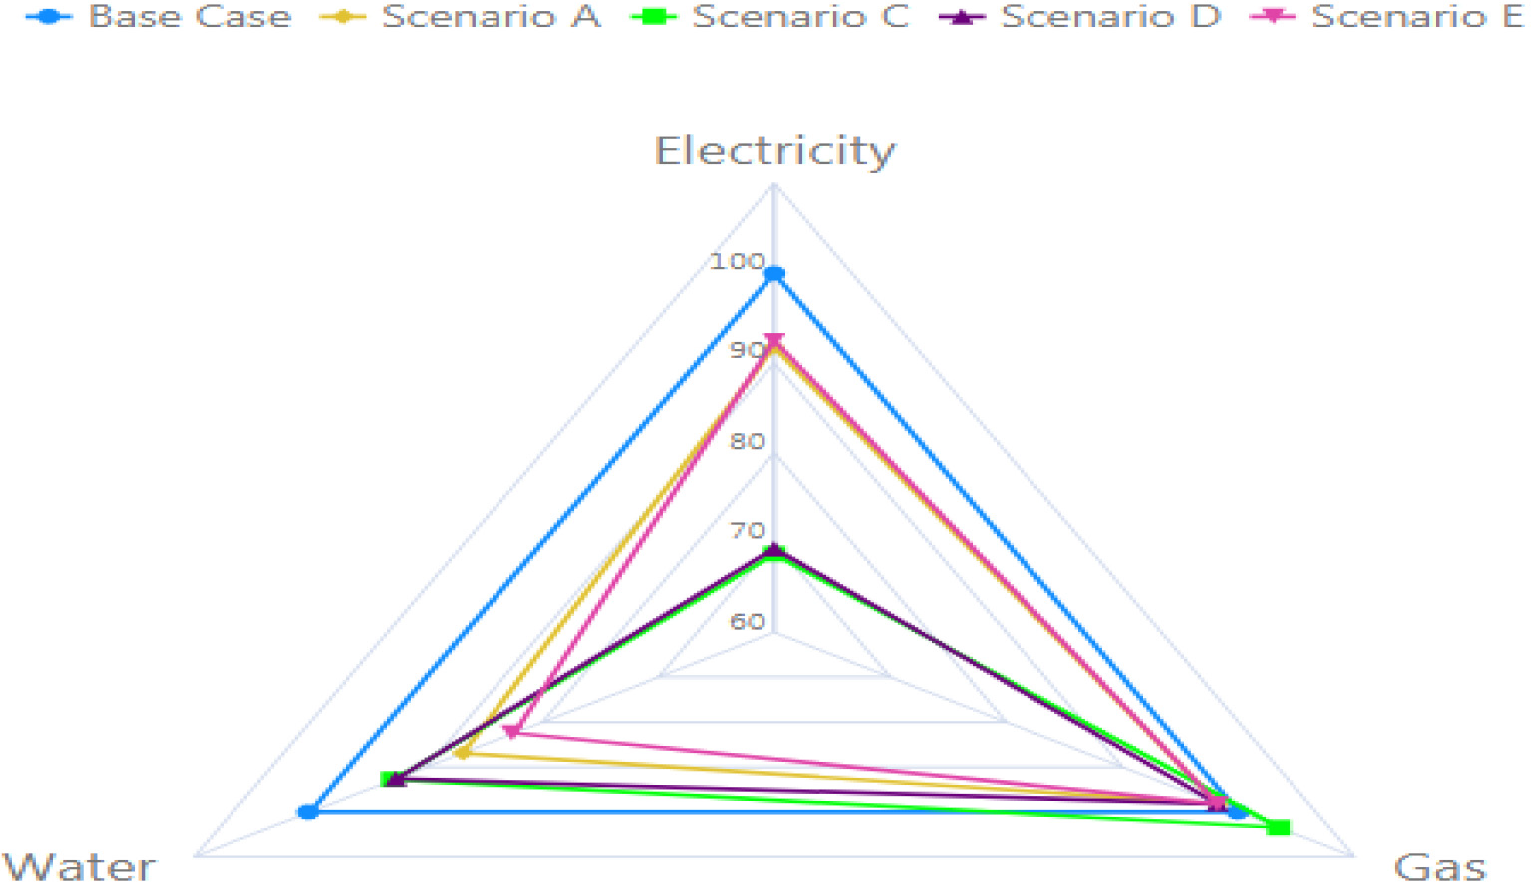
Figure 6 shows scenarios where water and energy boundary conditions are changed. Six scenarios represent the model's results based on watergy optimal points for the sensitivity analysis of different boundary conditions. The quantity of rose production as watergy services is constant in scenarios. Results show that the substitution of resources happens besides the change of technologies for supplying watergy services. The above sections presented the results of using watergy approaches in the greenhouse case study that reflected six principles of watergy systems. The developed approach is also applicable to similar watergy cases with high water and energy systems interactions. Similarly, the developed model may be utilized for other greenhouse products by adjusting the technical coefficients.
One may use the comprehensiveness of the developed watergy approach to provide the optimal watergy point for the efficient use of water and energy resources simultaneously. However, a proper definition of the integration layer (watergy layer) is necessary for using the proposed approach in other systems. In the integration layer of the systems, the demand coefficients must be determined based on the equations and interactions of water and energy flows in the system under study.
The interaction between various flows in a system does have a considerable impact on the technology combination and the efficiency of using resources. The scarcity of water resources, a high share of energy, and other main inputs in production costs have necessitated radical changes in the technology mix and the innovation in the system. The trend of changes in systems indicates that the analysis of each flow, independent of its interaction with other flows, shall not be sufficient to understand the mechanism of the process of changes. A literature review indicates that the focus has been on either water flow or energy flow in the previous models. And utilizing other resources has been reflected as exogenous parameters in the operational cost of such models. Such approaches can hardly provide an appropriate means for analysing changes in production. Hence, the integrated representation of water, energy, and material in the analytical tools is a step forward which has been the subject of the present research work. This study aims to provide an integrated watergy model to present a watergy service based on the optimal technology combination and resource consumption by assessing the optimal watergy point.
Integrated water and energy flow model was developed and applied in a greenhouse case study based on the new method. The results of the application of the model indicated that changes in the technical configuration of a system are influenced by the scarcity of resources, prices of input, substitution, and complementary production factors. Such a complex interaction was represented in the developed model, which has considered the flows of water, energy, and material simultaneously, and the final watergy service (e.g., the rose production). The novel distinction in the present study is the optimal combination of technologies to provide watergy services, unlike in previous models, which have selected the optimal combination of technology to meet different water demands and energy demands separately. Another advantage of the present model is providing an optimal combination of technologies based on the watergy optimal point for production. Previous research presented the consumption of resources and the thermodynamic simulation of technologies in greenhouses without discussing the choice of technology.
The results obtained by applying the model in a case study indicated that the scarcity of resources and prices of input resources had had considerable impacts on the technological mix of greenhouse production and resource efficiency. The summary of the main findings based on the watergy optimal point in the studied scenarios are:
The crop drainage recovery and recycling technology (the closed irrigation system) are recommended, which result in the reduction of water and fertilizer usage and ease environmental issues. Also, in the face of limited water resources, the use of wastewater recycling technologies and small-scale treatment systems has led to the use of nonconventional water resources. Recycling and treatment technologies reduced the fresh water consumption by up to 12% and have led to an increase in the electricity consumption of up to 1.2%.
In areas with water scarcity, the pad-fan system is preferred to the fogging system (including the RO) for cooling. Appendix G (Figures G.1 and G.2) compares the two technologies based on the three indicators of the water and energy consumption and the investment cost required.
With the electricity price increase, CHP is used for the heat (7% of the total heat demand) and power demand. With the simultaneous increase in natural gas and electricity prices, the installation of PV panels is preferred.
The RO technology has been recommended as a strategy to treat saline water for being utilized in greenhouses. However, electricity consumption has increased (up to 19%) when using this technology to improve water quality.
The sensitivity analysis results show that using the WEGMA-1 model with the watergy concept, a reduction of 31% in electricity consumption and a decrease in the water consumption of up to 18% are possible. These achievements are also accompanied by up to 25% lesser fertilizer usage related to the business as usual case. In the present study, unlike in previous models, the inherent consideration of the watergy service supply from the system reflects the demand for water and energy endogenously. This feature improves the efficiency of using resources in the optimal design based on the watergy concept as it reflects the complete interaction between the water and energy subsystem. The policymakers and investors will find it helpful to consider macro and long-run changes in the boundary conditions of the water and energy subsystem for developing sustainable systems to supply sustainable products. The price increase, the scarcity of resources, and the assessment of new technologies are considered. Finally, to complete the research objectives of the present study, the consideration of a transition state for the water resources, its storage, and its recycling systems in the watergy model is suggested to improve the application of the proposed model in future studies. Also, decreasing technical performance of the installed technologies through their lifetime and increasing efficiency due to research and development are suggested to be included in the system modelling in future research.
The authors would like to thank Mr. Kamran Ranjbar Kohan and his brothers, the owners of Nikan Greenhouse, Alborz province of Iran, for providing us with data on the greenhouse that included the water, energy, and material consumption. Data provided by Nikan Greenhouse have enabled us to validate the model by the actual performance of the greenhouse cultivation.
- , , Department of Economic and Social Affairs. Population Division. World population prospects: the 2017 revision: key findings and advance tables., 2017
- ,
Considering the energy, water and food nexus: Towards an integrated modelling approach ,Energy Policy , Vol. 39 (12),pp 78967906 , , https://doi.org/https://doi.org/10.1016/j.enpol.2011.09.039 - ,
The water-food-energy nexus optimization approach to combat agricultural drought: a case study in the United States ,Appl. Energy , Vol. 227 ,pp 449-464 , 2018, https://doi.org/https://doi.org/10.1016/j.apenergy.2017.07.036 - ,
Toward sustainable crop production in China: An emergy-based evaluation ,J. Clean. Prod. , Vol. 206 ,pp 11-26 , 2019, https://doi.org/https://doi.org/10.1016/j.jclepro.2018.09.183 - ,
Environmental sustainability issues in the foodenergywater nexus: Breakfast cereals and snacks ,Sustain. Prod. Consum. , Vol. 2 ,pp 1728 , , https://doi.org/https://doi.org/10.1016/j.spc.2015.08.001 - ,
Determining strategies for water, energy, and food-related sectors in local economic development ,Sustain. Prod. Consum. , Vol. 16 ,pp 162175 , , https://doi.org/https://doi.org/10.1016/j.spc.2018.08.005 - ,
, Towards model based adaptive control for the Watergy greenhouse: design and implementation , 2008 - ,
Closed greenhouses for semi-arid climates: critical discussion following the results of the Watergy prototype ,International Workshop on Greenhouse Environmental Control and Crop Production in Semi-Arid Regions , Vol. 797 ,pp 37 , 2008, https://doi.org/https://doi.org/10.17660/ActaHortic.2008.797.2 - ,
Concept for water, heat and food supply from a closed greenhouse-the watergy project ,International Conference on Sustainable Greenhouse Systems-Greensys2004 , Vol. 691 ,pp 509 , 2004, https://doi.org/https://doi.org/10.17660/ActaHortic.2005.691.60 - , , World Bank/ESMAP Report, 2008
- ,
The role of water-energy nexus in optimising water supply systemsReview of techniques and approaches ,Renew. Sustain. Energy Rev. , Vol. 82 ,pp 14241432 , , https://doi.org/https://doi.org/10.1016/j.rser.2017.05.125 - ,
Water-energy nexus: A review of methods and tools for macro-assessment ,Appl. Energy , Vol. 210 ,pp 393408 , , https://doi.org/https://doi.org/10.1016/j.apenergy.2017.08.243 - ,
Towards sustainable farming systems: Effectiveness and deficiency of the French procedure of sustainable agriculture ,Agric. Syst. , Vol. 90 (1),pp 226242 , , https://doi.org/https://doi.org/10.1016/j.agsy.2006.01.002 - , , Sustainable greenhouse systems, 2010
- ,
Convex parameter estimator for grey-box models, applied to characterise heat flows in greenhouses ,Biosyst. Eng. , Vol. 191 ,pp 1326 , , https://doi.org/https://doi.org/10.1016/j.biosystemseng.2019.12.009 - ,
A novel integrated framework to evaluate greenhouse energy demand and crop yield production ,Renew. Sustain. Energy Rev. , , https://doi.org/https://doi.org/10.1016/j.rser.2018.06.046 - ,
Dynamic photovoltaic greenhouse: Energy efficiency in clear sky conditions ,Appl. Energy , Vol. 170 ,pp 362376 , , https://doi.org/https://doi.org/10.1016/j.apenergy.2016.02.138 - ,
Minimal heating and cooling in a modern rose greenhouse ,Appl. Energy , Vol. 137 ,pp 97-109 , , https://doi.org/https://doi.org/10.1016/j.apenergy.2014.09.083 - ,
Agricultural greenhouse CO2 utilization in anaerobic-digestion-based biomethane production plants: A techno-economic and environmental assessment and comparison with CO2 geological storage ,Appl. Energy , Vol. 242 ,pp 1753-1766 , 2019, https://doi.org/https://doi.org/10.1016/j.apenergy.2019.03.045 - ,
Optimal thermal energy management of a distributed energy system comprising a solar membrane distillation plant and a greenhouse ,Energy Convers. Manag. , Vol. 198 ,pp 111791 , 2019, https://doi.org/https://doi.org/10.1016/j.enconman.2019.111791 - ,
A methodology for model-based greenhouse design: Part 4, economic evaluation of different greenhouse designs: A Spanish case ,Biosyst. Eng. , Vol. 111 (4),pp 336-349 , 2012, https://doi.org/https://doi.org/10.1016/j.biosystemseng.2011.12.008 - ,
Energy management in horticultural applications through the closed greenhouse concept, state of the art ,Renew. Sustain. Energy Rev. , Vol. 16 (7),pp 5087-5100 , 2012, https://doi.org/https://doi.org/10.1016/j.rser.2012.04.022 - ,
Design of a vegetable greenhouse system for subtropical conditions in Taiwan ,Wageningen UR Greenhouse Horticulture , 2012 - ,
Irrigation water and energy saving in well irrigation district from a water-energy nexus perspective ,J. Clean. Prod. , Vol. 267 ,pp 122058 , , https://doi.org/https://doi.org/10.1016/j.jclepro.2020.122058 - ,
Membrane distillation at the water-energy nexus: limits, opportunities, and challenges ,Energy Environ. Sci. , Vol. 11 (5),pp 11771196 , 2018, https://doi.org/https://doi.org/10.1039/C8EE00291F - ,
Chinas waterenergy nexus ,Water Policy , Vol. 10 (S1),pp 5165 , , https://doi.org/https://doi.org/10.2166/wp.2008.052 - ,
The energy-water-food nexus: Strategic analysis of technologies for transforming the urban metabolism ,J. Environ. Manage. , Vol. 141 ,pp 104-115 , 2014, https://doi.org/https://doi.org/10.1016/j.jenvman.2014.01.054 - ,
Life-cycle energy use and greenhouse gas emissions inventory for water treatment systems ,J. Infrastruct. Syst. , Vol. 13 (4),pp 261270 , , https://doi.org/https://doi.org/10.1061/(ASCE)1076-0342(2007)13:4(261) - ,
, Modelling of a humidification-dehumidification greenhouse in Oman , 2009 - ,
Water modeling in an energy optimization frameworkThe water-scarce middle east context ,Appl. Energy , Vol. 101 ,pp 268279 , , https://doi.org/https://doi.org/10.1016/j.apenergy.2012.06.032 - ,
Seeking Sustainable Climate Land Energy and Water (CLEW) Strategies ,Nucl. Technol. Rev. , 2009 - ,
Energy sector water use implications of a 2 C climate policy ,Environ. Res. Lett. , Vol. 11 (3),pp 34011 , , https://doi.org/https://doi.org/10.1088/1748-9326/11/3/034011 - ,
Watergy: infrastructure for process control in a closed greenhouse in semi-arid regions ,International Conference on Sustainable Greenhouse Systems-Greensys2004 , Vol. 691 ,pp 821 , 2004, https://doi.org/https://doi.org/10.17660/ActaHortic.2005.691.10 - ,
Temperature and humidity control in the watergy greenhouse ,International Symposium on Greenhouse Cooling , Vol. 719 ,pp 401 , 2006, https://doi.org/https://doi.org/10.17660/ActaHortic.2006.719.45 - ,
Watergy project: Towards a rational use of water in greenhouse agriculture and sustainable architecture ,Desalination , Vol. 211 (13),pp 296303 , , https://doi.org/https://doi.org/10.1016/j.apenergy.2017.07.036 - ,
Watergy, towards a closed greenhouse in semi-arid regions-experiment with a Heat Exchanger ,International Conference on Sustainable Greenhouse Systems-Greensys2004 , Vol. 691 ,pp 845 , 2004, https://doi.org/https://doi.org/10.17660/ActaHortic.2005.691.104 - ,
Analyzing water supply in future energy systems using the TIMES Integrated Assessment Model (TIAM-FR) ,3rd International Symposium on Energy Engineering, Economics and Policy: EEEP 2011 ,pp 6 , 2011 - ,
MIT integrated global system model (IGSM) version 2: model description and baseline evaluation ,MIT Joint Program on the Science and Policy of Global Change , 2005 - ,
Modeling water resource systems under climate change: IGSM-WRS ,MIT Joint Program on the Science and Policy of Global Change , 2012 - ,
Energywaterfood nexus in the Spanish greenhouse tomato production ,Clean Technol. Environ. Policy , Vol. 18 (5),pp 13071316 , , https://doi.org/https://doi.org/10.1007/s10098-015-1076-9 - ,
A technology-based analysis of the water-energy-emission nexus of Chinas steel industry ,Resour. Conserv. Recycl. , Vol. 124 ,pp 116128 , 2017, https://doi.org/https://doi.org/10.1016/j.resconrec.2017.04.014 - ,
Energy management strategies for commercial greenhouses ,Appl. Energy , Vol. 114 ,pp 880888 , , https://doi.org/https://doi.org/10.1016/j.rser.2012.04.022 - ,
Development of concepts for a zero-fossil-energy greenhouse ,International Symposium on High Technology for Greenhouse System Management: Greensys2007 , Vol. 801 ,pp 725 , 2007, https://doi.org/https://doi.org/10.17660/ActaHortic.2008.801.84 - ,
Watergy: Taking advantage of untapped energy and water efficiency opportunities in municipal water systems ,Watergy: taking advantage of untapped energy and water efficiency opportunities in municipal water systems, Alliance to Save Energy , 2002 - , , Alliance to Save Energy, 2007
- ,
Integrated energy and water conservation modeling ,J. energy Eng. , Vol. 124 (1),pp 119 , , https://doi.org/https://doi.org/10.1039/C8EE00291F - , , Pacific Inst. Stud. Dev., 1993
- , , Water and energy nexus: A literature review, 2013
- , , Energy Supply Model: ESM 84, 2005
- ,
Model of sustainable development of energy system, case of Hamedan ,Energy Policy , Vol. 104 ,pp 6679 , , https://doi.org/https://doi.org/10.1016/j.enpol.2017.01.039 - ,
Stochastic modeling of the energy supply system with uncertain fuel price-A case of emerging technologies for distributed power generation ,Appl. Energy , 2012, https://doi.org/https://doi.org/10.1016/j.apenergy.2011.12.099 - , , Foundations of Economics, 2013
- , , Integrated Greenhouse Systems for Mild Climates: Climate Conditions, Design, Construction, Maintenance, Climate Control, 2011
- ,
A Theory of Production with Waste and Recycling ,Discuss. Pap. für Volkswirtschaftslehre und Stat. Dep. Econ. Univ. Mannheim , Vol. 550 , 1997 - ,
Exergy losses during recycling and the resource efficiency of product systems ,Resour. Conserv. Recycl. , Vol. 52 (2),pp 219-233 , 2007, https://doi.org/https://doi.org/10.1016/j.resconrec.2007.01.014 - ,
A comprative study on two different evaporative cooling systems for producting cucumber crop under hot-humid summer conditions ,Soil Sci. Agric. Eng , Vol. 1 , 2010, https://doi.org/https://doi.org/10.21608/jssae.2010.75499 - ,
Energy efficiency in greenhouse evaporative cooling techniques: cooling boxes versus cellulose pads ,Energies , Vol. 7 (3),pp 1427-1447 , 2014, https://doi.org/https://doi.org/10.3390/en7031427 - , , Water Resources in Arid Areas: The Way Forward, 2017
- ,
Sonic anemometry to evaluate airflow characteristics and temperature distribution in empty Mediterranean greenhouses equipped with pad-fan and fog systems ,Biosyst. Eng. , Vol. 113 (4),pp 334-350 , 2012, https://doi.org/https://doi.org/10.1016/j.biosystemseng.2012.09.006 - ,
Improving Performance of the Evaporative Cooling System inside the Greenhouses and Its Effect on Tomato Productivity ,ALEXANDRIA Sci. Exch. JOURNAL , Vol. 36 (1), 2015, https://doi.org/https://doi.org/10.21608/asejaiqjsae.2015.2742, JANUARY-MARCH2015 - ,
Cost estimation and economical evaluation of three configurations of activated sludge process for a wastewater treatment plant (WWTP) using simulation ,Appl. Water Sci. , Vol. 7 (5),pp 2513-2521 , 2017, https://doi.org/https://doi.org/10.1007/s13201-016-0446-8 - ,
Assessing Decentralized Wastewater Treatment Options in Santa Barbara County ,Gr. Proj. Rep. , 2012 - ,
Exergy costs analysis of groundwater use and water transfers ,Energy Convers. Manag. , Vol. 110 ,pp 419-427 , 2016, https://doi.org/https://doi.org/10.1016/j.enconman.2015.12.022 - ,
Techno-economic analysis of a solar photovoltaic/thermal (PV/T) concentrator for building application in Sweden using Monte Carlo method ,Energy Convers. Manag. , Vol. 165 ,pp 8-24 , 2018, https://doi.org/https://doi.org/10.1016/j.enconman.2018.03.043 - ,
Assessment of small-scale solar PV systems in Iran: Regions priority, potentials and financial feasibility ,Renew. Sustain. Energy Rev. , Vol. 94 ,pp 267-274 , 2018, https://doi.org/https://doi.org/10.1016/j.rser.2018.06.002 - ,
Analyzing a self-managed CHP system for greenhouse cultivation as a profitable way to reduce CO2-emissions ,Energy , Vol. 36 (4),pp 1940-1947 , 2011, https://doi.org/https://doi.org/10.1016/j.energy.2010.02.045 - , , Exergy: energy, environment and sustainable development, 2012