


The world's energy sources have evolved over time in terms of source type and technique of usage. Wood was the primary source of energy until the middle of the nineteenth century, when coal took over at the end of the same century. Petroleum and natural gas became one of the world's primary energy sources in the mid-twentieth century. Fossil fuels (oil, gas, and coal) have had a significant part in shaping our civilization during the previous 100-150 years. On the other hand, it causes severe environmental concerns throughout the phases of production, manufacture, and consumption, affecting all living species on our planet. More than 800 different chemicals are created as a result of pollution caused by the use of fossil fuels, along with other environmental consequences such as global warming, acid rain, poor water quality, and groundwater pollution [1]. The majority of the fossil fuels we use today are derived from nonrenewable sources, and there is a finite supply of them on Earth. On the basis of the present yearly use, oil and natural gas reserves are sufficient for about the next fifty years. For this reason, the world requires alternate energy sources [2]. However, solar energy, a renewable resource derived from the sun, may substitute fossil fuels. This technology, although, is regarded as having various drawbacks, including low efficiency and high cost [3].
The performance of photovoltaic modules is affected by a wide variety of factors, some of which are related to the materials from which they are constructed (particularly electrical and optical properties) and many of which are related to the operating environment, such as solar radiation, temperature, shading, dust, tilt angle, site characteristics (such as close to roads, industrial waste, urban/agricultural/desert areas, etc.), and many more (wind and rain, the orientation of the PV panel, cleaning mechanism and period, etc.) [4]–[6]. Dust and shadowing impacts are among the most significant issues in the solar sector. Occasionally, shady situations are to be expected since some portions of the photovoltaic system receive less sunlight due to multiple reasons, including clouds, time of day, season, shadows cast by surrounding objects [7], or even environmental factors such as dust accumulation [8]. There are two types of shading; soft shading happens when the intensity of solar radiation is reduced owing to dust, haze, or fog, causing the current to decrease according to the intensity of the radiation. This form of shadowing has a significant impact on the PV system's output. Hard shading occurs when an object completely prevents light from reaching a specific area. When a solar cell is entirely shaded, no current is produced; however, when it is partially shaded, just the partially shaded portion of the cell is affected, and the current output decreases proportionally. When a cell is partially shaded, the voltage across the cell remains constant; however, when a cell is totally shaded, no current or voltage is produced, and the output power vanishes. In any place where solar PV systems are to be installed, it is vital to quantify the impact of pollution, and it is preferable to undertake on-site, long-term experiments. In fact, experts from all over the globe have studied the effect of shadowing and dust (or soiling) deposition on the output power of PV modules, and a number of review articles [9]–[19] have been published in the topic. For instance, Sarver et al. [13] and Bessa [17] have published comprehensive reviews on the influence of dust on solar power generation. Numerous exceptional studies reveal that the dust impact varies significantly as a function of exposure time and location. Maghami et al. [19] developed a globe map that categorized the planet into four basic zones depending on dust intensity. According to the map, the Middle East and North Africa are the dustiest places in the globe. Studies and measurements have confirmed the map's supplied information. A great number of experiments have been undertaken in various parts of the world to measure the influence of dust on solar cells. Under moderate dust conditions, PV system performance losses due to dust deposition might range from 10% to 30% [20]–[23]. It has been reported to be 40% and 32% in a few months in Saudi Arabia [24]. The monthly power loss in arid areas is around 30% or higher. In the United States, soiling losses were found to be 0.21% per day [25] , and 17% to 65%, depending on the angle of inclination, in 38 days in Kuwait [26], and 33.5% to 65.8% in a period of exposure from one to six months in Egypt [27]. The influence of long-term dust formation on a solar PV system at Sultan Qaboos University in Oman was explored by Alawasa, K.M. et al [28]. The average percentage of energy loss due to soiling were 9.5%, 18.2%, 31.13%, and 45.6%, respectively, for 29-day, 32-day, 72-day, and 98-day cleaning cycles. According to the findings of another study conducted in northern Oman by Kazem H. A. et al. [29] , PV module power generation is reduced by 35–40%, indicating that cleaning should be done every three months. While the findings of research conducted in Iraq by Chaichan M. T. et al. [30] verified the requirement for two-day cleaning in the FAO zone and every two weeks in other regions. In Bagdad, Iraq, Al-Ammri et al. [31] found annual energy losses of around 58.9%. In China, the efficiency of PV panels has dropped by 26% [32]. The monthly reduction in PV efficiency in Mexico was 13.0 %. [33]. Kazem H. A. et al. [16] produced a graph showing the monthly drop in PV efficiency caused by dust collection in various countries. Some regions saw significant reductions, such as 80% for Iran, 75% for India, 65% for Egypt, and 60% for Saudi Arabia. Sulaiman [34] conducted research on the effect of dust on horizontal and tilted panels. He discovered that dust accumulates twice as much on horizontal panels as it does on tilted panels, emphasizing the need for cleaning modules, particularly the horizontal ones. Garg [35] discovered that after 30 days of exposure, the transmittance of a glass sheet was decreased from 90% to around 45% tilted at 15o and to about 8% tilted at 45o. Thus noticed that horizontal glass collects more dust than vertical glass, and he established a dust correction factor (DC) as the ratio of the transmittance of an uncleaned cover (τu) to that of a cleaned cover (τc). El Chaar [36] found that PV modules lose nearly 68% of their power during dust storms, decreasing from 40 W (when clean) to 13 W (during dust storms). After 38 days of exposure, Sayigh et al. [26] studied the effect of dust deposition on tilted glass plates installed in Kuwait and reported a drop in plate transmittance ranging from 64% to 17% for tilt angles ranging from 0° to 60°, respectively.
In Jordan, just a few studies on the effect of dust deposition on the output of solar PV modules have been undertaken, and all of these studies have been conducted in the south and east of the country. For example, in the southern city of Ma'an, Ahmed et al. [37] evaluated the effect of soiling and the periodic cleaning process of solar cells. Based on a monthly cleaning process, the worst-case scenario generates a 2.99% decrease in power, with an average of 2.22 % during the entire study period. Al-Shabaan et al. [38] did another study in the same city to investigate the effect of dust mass density (g/m2) and particle size (fine size < 0.05 µm, middle size 0.05-2 µm, and large size 2-19 µm) on the output energy when mixed with varied ratios utilizing polysilicon module. The results showed that the output reduced by roughly 13% to 25% depending on the dust mixture ratio, with a larger decline when the ratios of "fine" and "medium" sizes were greater. Another study conducted by the same group [39] in the same city examines the effect of deposited dust on polysilicon and Cd-Te PV panels. They observed that the monthly output power reduction differs between the two panels, with around 16% for the silicon panel and around 11.5% for the Cd-Te panel. Saidan et al. [40] conducted an experimental study on the effect of dust deposition on solar photovoltaic panels in desert environment (eastern regions of Jordan). They found that the average degradation rate of the efficiencies of the solar modules exposed to dust are; 6.24%, 11.8% and 18.74% calculated for exposure periods of one day, one week and one month. Also, they found that there is a difference between normal days and storm events in the size of dust particles deposited on the PV panels. Under normal settings, the size distribution is dominated by small particles (0.4-0.5) µm, while the largest particles (1.1-1.2) µm are scarce. During dust storms, however, the size of the dust particles accumulating on the surface of solar panels is significantly different, with particles measuring (1.1-1.2) µm being the most abundant.Al-Kouz et al. [41] used an experimental measurement to propose a computational model to investigate the effects of dust and ambient temperature on the performance of a photovoltaic system built at Eastern Jordan. Due to its location inside the solar belt, Jordan has a substantial solar energy potential; the average daily solar energy intensity in Jordan is between 5 and 7 kW/m2. Oil products dominate Jordan's energy industry, with natural gas coming in second. Since the enactment of Law No. 13 of 2012 on Renewable Energy and Energy Efficiency, the contribution of renewable energy to the primary energy mix has increased exponentially, from 2% in 2013 [42] to 13% of total primary energy supply in 2019, making Jordan a regional leader in renewable energy.
The country has established the rules and regulations essential to enable renewable energy development, including solar photovoltaic (PV) and onshore wind. The updated Master Strategy for the Energy Sector 2020-2030, developed by the Ministry of Energy and Mineral Resources (MEMR), calls for a sustainable future energy supply, diversification of the national energy mix, increased dependence on the proportion of domestic energy resources, improved energy security, and decreased energy dependence and cost of electricity supply. The policy aims for a 31% share of overall power generating capacity and 14% of the entire energy mix from renewable sources by 2030 [43]. In light of these laws, Numerous sectors in Jordan employ photovoltaic (PV) systems, including residences, schools, universities, hospitals, hotels, mosques, as well as the commercial, industrial, and agricultural sectors. The Net Metering System connects all of these systems to the power network. More than twenty-five colleges in Jordan have built solar energy systems to satisfy all or a portion of their electrical energy requirements. At the institution where I work, Jordan University of Science and Technology, a 5-megawatt system has been installed, which is comparable to one-fifth of the entire energy demand, and the university is proposing to add a 20-megawatt system in the near future. The collection of dust on solar panels poses the greatest challenge to PV systems in the Middle East and North Africa (MINA).
The goal of this work is to explore the influence of dust on the performance of solar PV modules in order to estimate pollution losses at the solar power plant site. This research will assist planners, engineers, technicians, and solar project owners in including an accurate pollution adjustment factor into photovoltaic systems when developing a solar project. The measurement of pollutant losses may also be used to improve the estimation of a solar power plant's energy production, allowing for better solar power plant design and helping to predict how the performance of a solar array or field will be affected as well as the economic implications of financial return. Furthermore, the study is critical because it may lead to additional research concentrating on improved technology that might assist avoid or successfully fixing the problem.
The efficiency (ɳ) of a solar system is described as the ratio of energy production from solar cells to the energy received from the sun:
(1)
where G is the incident radiation density (W/m2), A is an area of solar cell or module (m2). Equation (1) can be given in terms of fill factor:
(2)
where FF is the fill factor.
Some PV modules, particularly those using crystalline silicon technology, include bypass diodes to allow current to flow through the module and bypass shaded cells. Ideally, bypass diodes should be connected across every cell in the module to guarantee the greatest shading tolerance; however, for manufacturing reasons, it is only coupled to a subset of cells.
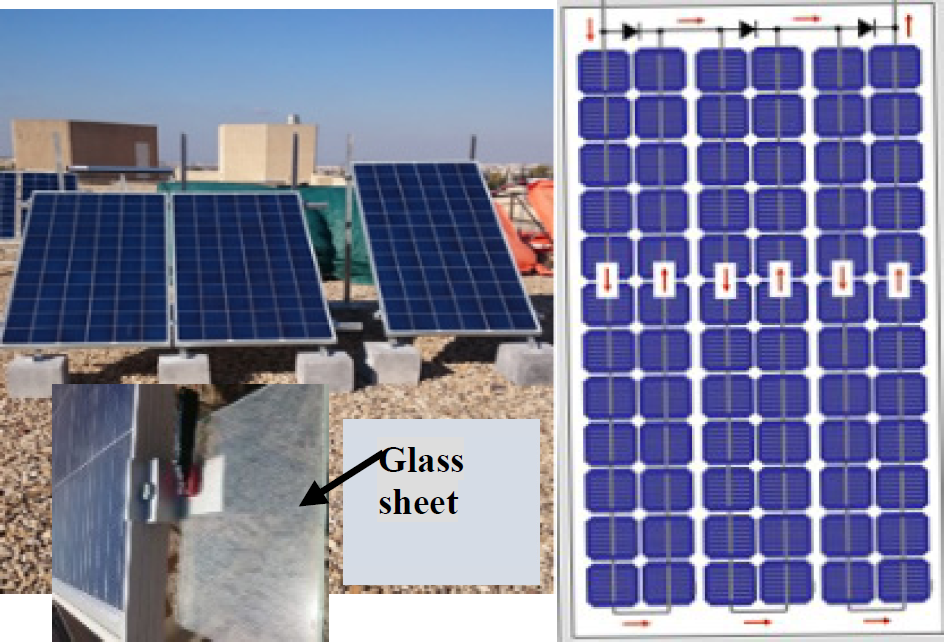
Three similar prototype solar modules are used to investigate the impact of dust and shade on module performance. In each scenario, the current, voltage, ambient temperature, solar module temperature, solar irradiance, or, density, and output power are measured, under different environmental variables. The modules were mounted on a rack of adjustable tilt angle (20o, 30o, 40o), from the ground, and installed on a flat roof of a building at Jordan University of Science and Technology campus. (In fact, the experiments were carried out with a fixed-tilt angle equal to the site's latitude). No obstacle exists nearby that can make any shadow on the modules for all times of the day. The experiment was carried out using three Trina Solar TSM-320pc14 PV modules, which included three bypass diodes and 72 (6 x 12) 156 mm x 156 mm polycrystalline silicon solar cells connected in series as shown in Figure 1. Table 1 shows the module's specifications under standard test conditions. One module is maintained clean and is cleaned shortly before the measurements, one is left unclean, and one is cleaned just when the conditions of the experiment necessitate it. The variable resistor technique is used to measure the current and the voltage of the solar panel. Data collection starts with measuring the short-circuit current (ISC) and open-circuit voltage (VOC) by connecting the terminals of the digital ammeter and voltmeter, respectively, to the output terminals of solar panels. Then, a heavy-duty variable resistor is connected to the PV module, and 2 digital multimeters are connected to the resistor (one in series to measure the current and one across the resistor to measure voltage). The resistance of the resistor is slowly increased, from zero to higher value, while recording the ammeter and voltmeter`s readings. During measurements of the current and the voltage, the ambient temperature and solar panel surface temperature are measured by digital thermometers. While the solar radiation is measured by a digital solar-meter and by a Pyranometer. The collected data were recorded every hour starting at 8 am up to 4 pm. The experiments lasted around five months, began in the winter (February) and ended in the summer (July) to obtain a data set that represents the majority of environmental fluctuations throughout the year. As a consequence, replicating the same conditions in terms of temperature, wind, solar radiation, sun position in the sky, and so on were impossible. These values might fluctuate from day to day or even hour to hour. Data collected, during the experiment, is typically processed and organized in a way that makes it easy to understand and analyse. This can include creating figures and tables to visualize the data. The data is then analysed to identify patterns and trends, and any relevant statistics are calculated. Finally, the results of the analysis are discussed in relation to the research hypothesis being tested. As a result, for reasons stated, the results are not presented in a way that allows for quantitative comparison.
PV system used in this study
Specifications for the PV-module.
TSM-320pc14 |
Model |
|---|---|
Maximum Power |
320 Watts |
Maximum Power Voltage |
37.1 Volts |
Maximum Power Current |
8.63 Amps |
Open Circuit Voltage |
45.8 Volts |
Short-Circuit Current |
9.1 Amps |
Length |
1.956 mm |
Width |
992 mm |
Depth |
40 mm |
Weight |
22.5 kg |
Jordan is situated in the Eastern Mediterranean region between 29.2o and 32.6o N and 35o to 39o E. The north-western regions of Jordan have a Mediterranean climate, while the southern and eastern regions, which comprise approximately 80% of Jordan's land area, have a semi-desert and arid desert climate. Therefore, Jordan is highly susceptible to dust storms, which occur when the wind speed increases sufficiently to transport dust materials from Sinai desert as an extension of the Sahara and Arabian desert. The bulk of dust storms occurred in the south regions (about 102 days per year) and in the east regions (approximately 154 days per year) due to a lack of soil moisture, little precipitation, and limited vegetation cover. They occur less frequently in the northwestern region (about 13 days per year) because of the high rainfall levels and humidity, as well as the forest and plantation cover [44]. The system under consideration (PV modules) is installed at the Jordan University of Science and Technology campus (Long. 35.8 E and Lat. 32.6 N). The outcomes of the experimental study are shown and discussed. This is divided into three subsections.
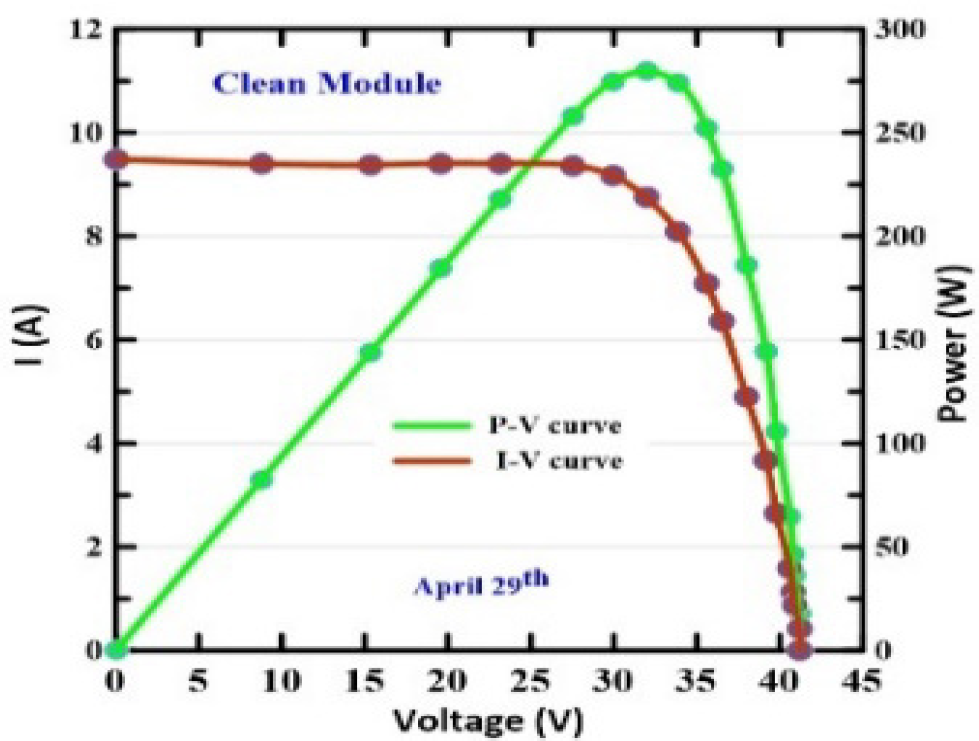
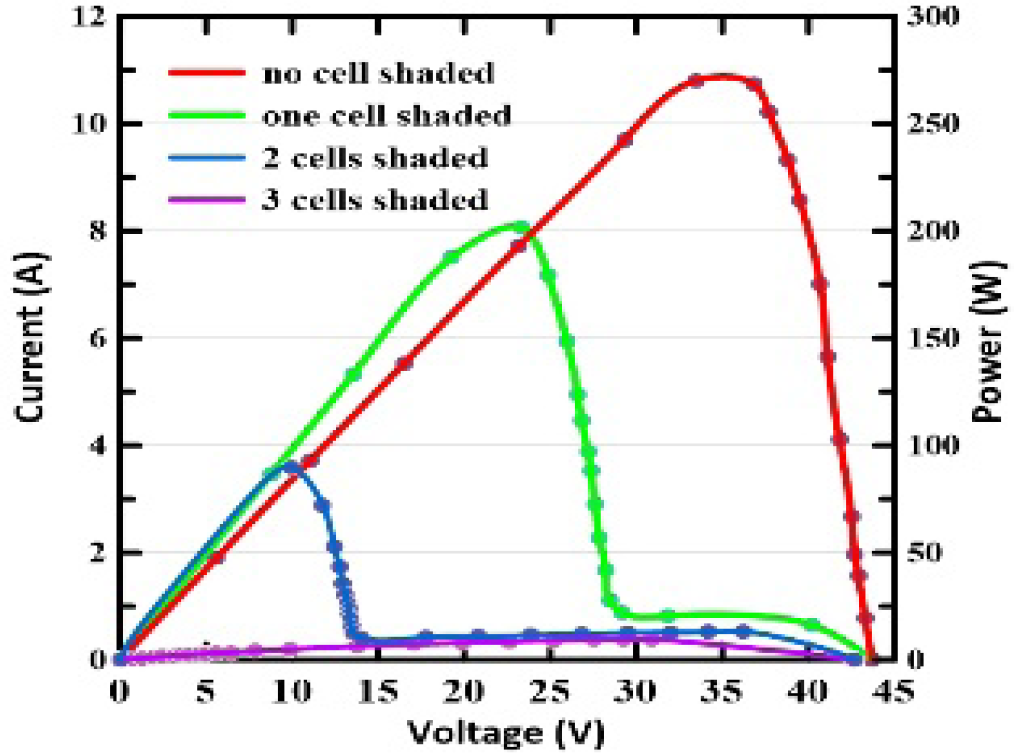
Its general knowledge that totally shading one solar cell reduces the output power of the entire string to zero, regardless of how many cells are in the string. When the half portion of a cell is darkened (covered by thick black paper), the string's output power is halved. In fact, shaded cells waste the energy generated by un-shaded cells. It's considerably worse at the system level when panels are linked in series to increase the system voltage to 600 V or 1000 V, and shading a single cell has an influence on the entire chain. The I-V and P-V curves for the recorded data set are shown in Figure 2. It was recorded on April 29th at a certain time. The solar irradiance ranged from 775 to 860 W/m2. The curves are similar to any other solar PV module' s typical curves. The shunt and series resistances are determined from the curves and found to be approximately 626 Ω.cm2 and 0.62 Ω.cm2, respectively. The values found here are within the range of what is often seen for commercial solar cells. When one cell (in any string) is totally shaded, the module's current drops, and the I-V curve shifts, resulting in a smaller area under the curve, as seen in Figure 4 (green curve). Figure 3 shows how the output power is dramatically decreased as a result of this (green curve). The percentage of power lost might be roughly 1/3 of its original value. The solar intensity was measured to be between 1040 and 1050 W/m2 at the time of this section of the experiment. When two cells in two distinct strings are completely darkened, the current in the module drops because the current from both strings is zero, blue curve. The output power is decreased to 1/3 of its initial value. When three cells; one from each module string is shaded, the module will not produce any current and no power is generated. The I scvalues in are not equal because the experimental data of the I-V, P-V, and other related graphs for all examined samples were, in general, conducted at varying solar intensity.
The I-V curve for a clean module, data recorded on April 29t
P-V curves for a module when no shade, 1 cell, 2 cells, or 3 cells are shaded.
I-V curves for a module when no shade, 1 cell, 2 cells, or 3 cells are shaded.
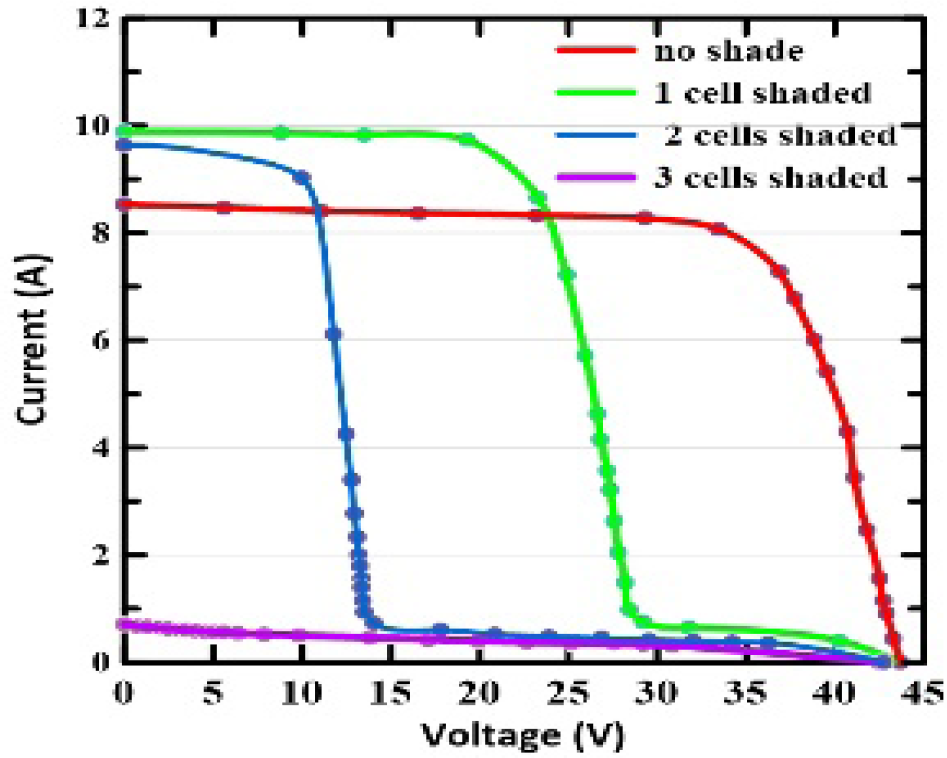
Figure 5 shows the apparent natural dust collection on the surface of one PV module, while the other is kept clean. This image does not depict the dustiest instance that has developed on the panels; There may be more dust in some circumstances, especially after dust storms and when there is a strong breeze.
Image of clean and naturally dusted modules.
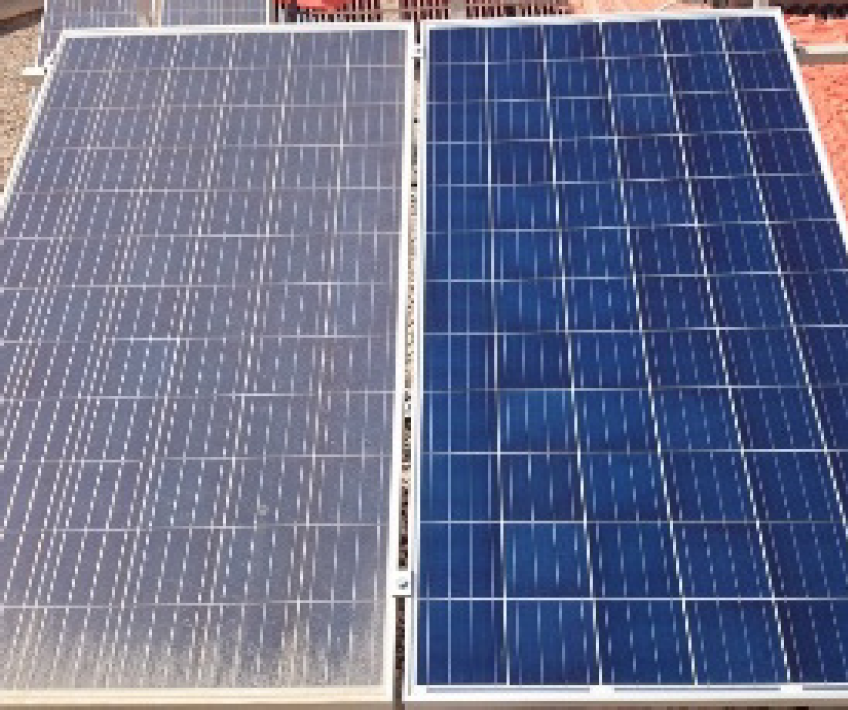
It`s worth noting that the experiments for this study took place between February and July of the year. As a result, rainfall may have occurred during this time, helping to clear the dust from the panels. Rains tended to remove the dust layer that had accumulated on the surface of the modules. Wind, unlike rain, would be unable to remove the dust layer that has accumulated on the surface of the PV system (especially sticky type films). In fact, the wind carries more dust particles to the site, which helps in the formation of a thicker dust layer on the module's surface. Rainfall during the winter months, on the other hand, assists in the improvement of PV module efficiency by wiping away dust from their surfaces. As a consequence, the dust on the panel does not always indicate that it has accumulated during the whole period. Northern Jordan's rainy season normally ends in late April or early May. It should be mentioned that the evenings in northern Jordan may be so humid that droplets of water form on the solar panels' glass, and their flow removes some of the dust that has accumulated. As a result, even if the solar panels have never been cleaned, we might occasionally get non-progressive data for the influence of dust on their efficiency.
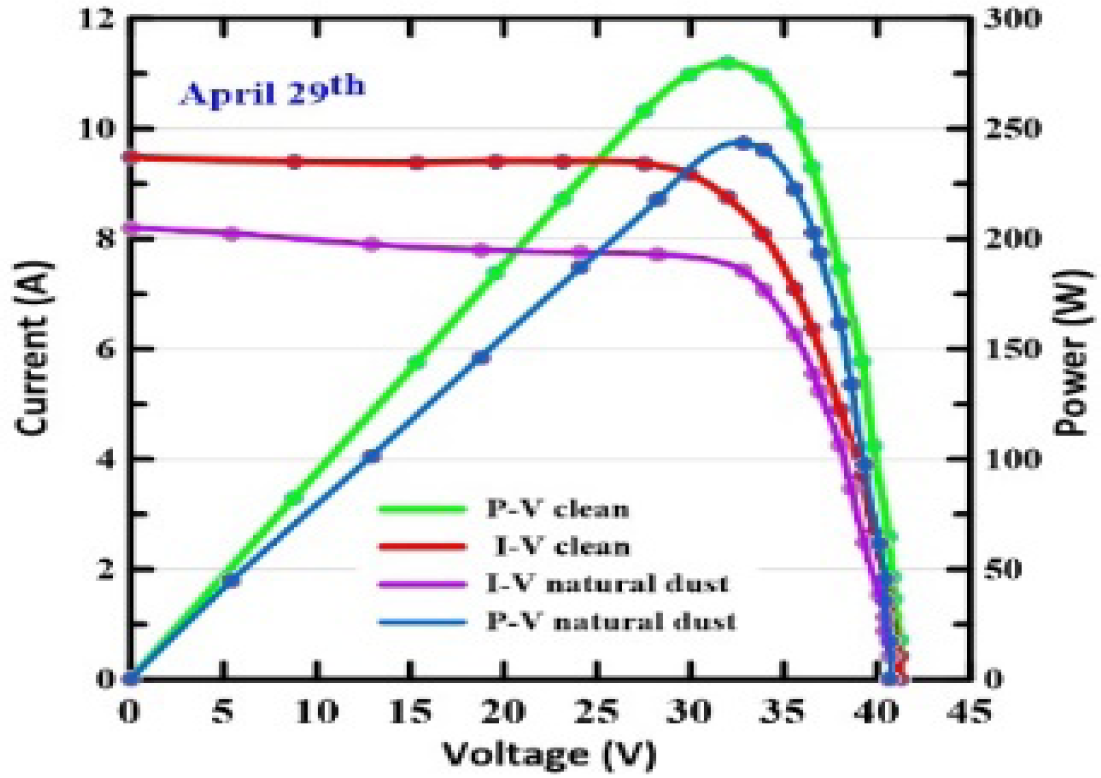
Figure 6 shows the experimental I-V and P-V characteristics of measured data for clean and dusty PV modules. The dust accumulated on the solar panel's surface reduces its efficiency by lowering the current generated by the panel. The effect of dust on the voltage is minimal, and it nearly has no effect. The figure clearly shows that the reduction in solar panel performance, caused by dust, is actually caused by the decrease in current of the module. Knowing that, dust layer on the panel's surface decreases the amount of radiation that penetrates into the solar cells inside the panel by absorbing or scattering the rays. When the values of Pmp, Isc, Imp, Vmp, and Voc for both clean and dusty modules are examined, it can be seen that the decrease in their ratio values due to dust collection is 10.7%, 11.8%, 11.2%, 1%, and 0.5%, respectively. This demonstrates that the decrease in output power is approximately equivalent to the decrease in short circuit current. Instead of collecting data for the I-V and the P-V graphs to see the influence of dust on module performance, we proposed monitoring simply the short circuit current and using it as an indication, repeating these measurements multiple times during the day to cover varying solar irradiance values. The short circuit current (Isc) for clean and dusty modules is measured many times throughout the day.
I-V and P-V curves for clean and polluted module with natural dust.
The drop in Isc value due to dust based on data collected on May 6th (after 3 weeks of dust accumulation) is shown in Figure 7. The daily average relative change was around 7.5%, with the highest absolute change occurring around solar noon. Measurements were done repeatedly to cover dust accumulation durations ranging from one day to three months. During Isc measurements, two glass sheets (clear float glass) with the same area as a PV cell module (15.6x15.6) cm2 were positioned directly behind the modules, (see Figure 1). One glass sheet and one PV module from each pair were cleaned on a regular basis right before measurements, while the others were left uncleaned throughout the experiment. The glass sheets were used to measure the transmitted radiation through the glass sheets (both clean and dusty) and see how dust collection affected the transmittance of solar radiation.
Variation of the short circuit current throughout the day for clean and dusty module.
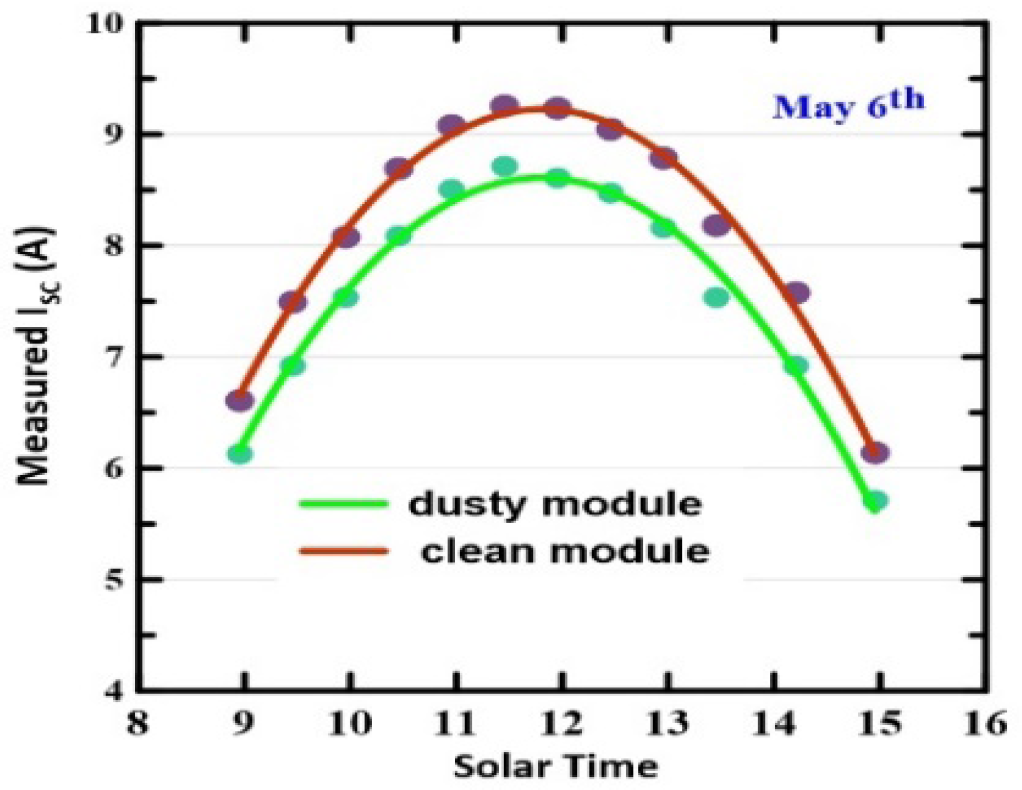
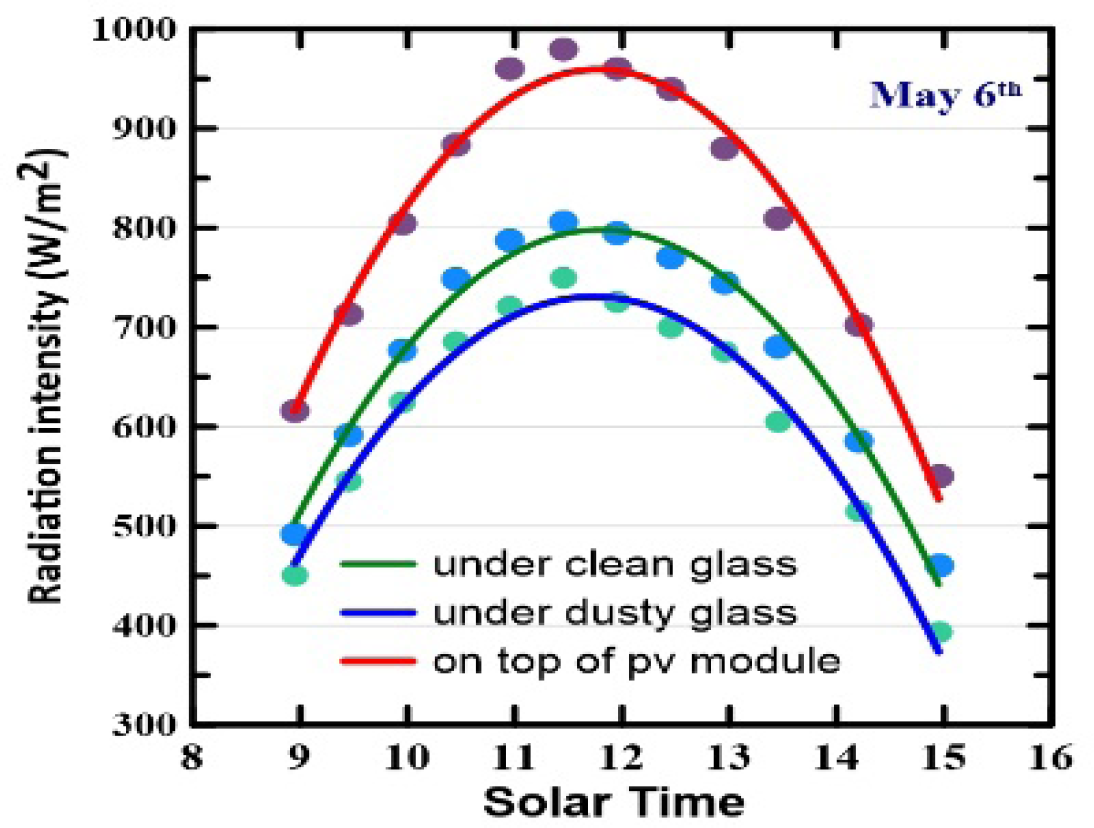
Figure 8 displays the observed solar radiation values on top of the PV panel, under clean and dirty glass sheets during the day. As predicted, dust deposition has lowered the intensity of the radiation under glass. This reduction is qualitatively similar to that of short circuit current (Isc), where the reduction was greatest around solar noon, and the daily average relative change was roughly 10%. The figure also shows that when measured through clean glass, solar radiation is decreased by 17%.
Variation of solar radiation intensity underneath clean and dusty glass sheet during the day
As explained previously, measurements of the short circuit current and intensity of solar radiation, under glass sheets, were done in a variety of dust accumulation durations ranging from one day to three months, and the daily average relative change in the two quantities are shown in Table 2. It is obvious that the longer the accumulation time, the larger the influence on the two measured values. When the accumulation duration was one day, the daily average relative change on the current was 1%, while the influence on solar radiation was around 3%. This relative change in the two quantities increases until, after three months, the change in current is 12% and the change in solar radiation is around 16%. When the relative changes in the two quantities are compared, the relative change in solar radiation is around 3.6% larger than the relative change in current. We believe this is because the relative change in current was caused by the effect of dust on scattered solar rays that could be absorbed by the solar cell, which has a photon energy of more than 1.1 eV, whereas the change in solar radiation is a measure of the scattering of the entire solar spectrum at all wavelengths. This also means that photons with longer wavelengths are more likely to be scattered by dust. These findings, which show that the impacts of dust on current and solar radiation under glass are quite comparable, provide researchers with an opportunity to utilize glass sheets to study the influence of dust on the efficiency of solar panels everywhere, at any time, and under any installation conditions. As a result, one can employ a simple and low-cost method to form a first impression of the subject. Of course, this does not mean that assessing the influence of dust on the efficiency of solar panels is unnecessary.
Relative change in short circuit current and in the solar radiation underneath glass sheets for various periods of dust accumulation.
Dust Accumulation period (days) |
1 |
8 |
18 |
22 |
29 |
36 |
90 |
|---|---|---|---|---|---|---|---|
Relative change in short circuit current |
0.6% |
3.6% |
5% |
6.5% |
7.6% |
9.7% |
13% |
Relative change in solar radiation |
3.1% |
7.9% |
10% |
10.4% |
10.4% |
13.2% |
16% |
The temperature of the solar panels increases as a result of various factors, the most important of which are the optical properties of the module and the solar cells, as well as the ambient temperature. The surface temperature of the panels and the ambient temperature were monitored to determine the influence of dust accumulation on the increase in temperature. The recorded data revealed that dust causes only a minor change in the temperature of the solar panels.
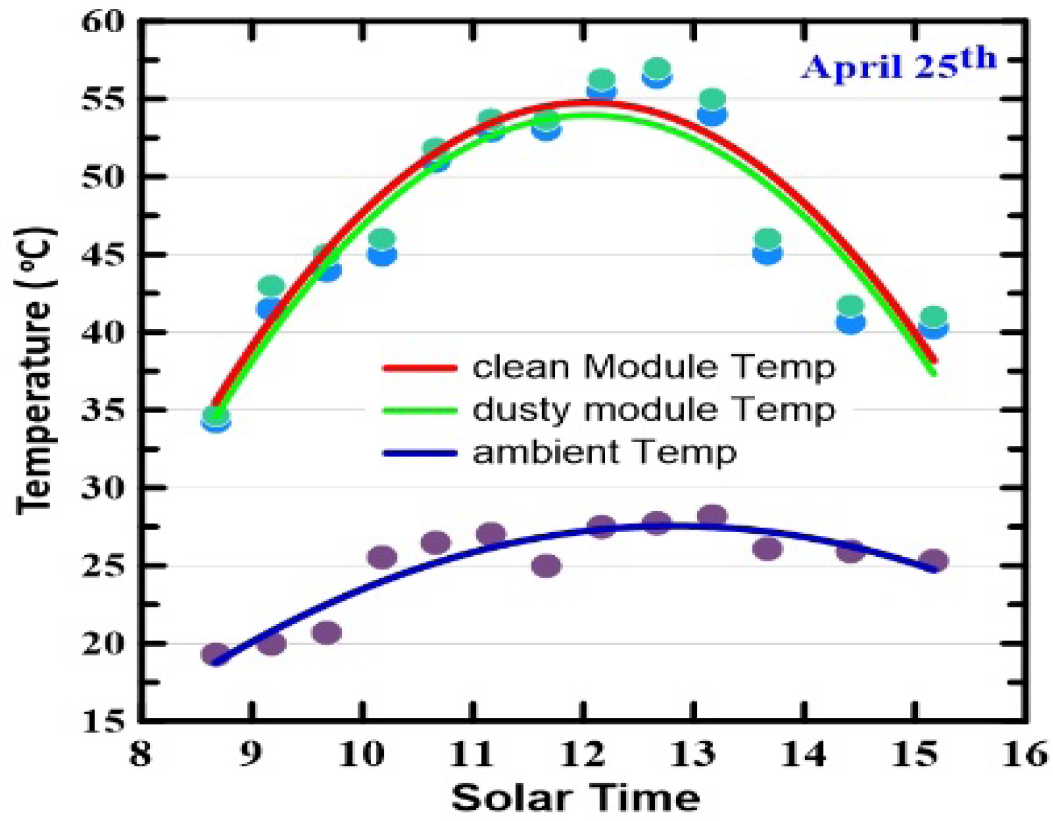
Figure 9 illustrates the temperatures recorded on April 25th, which are comparable to the impact in the other days. It is noticeable that the module temperature rises as the intensity of solar radiation rises during the day, and it could reach more than 55 oC even when the ambient temperature is less than 28 oC. When the results of this study are compared to those from other areas in Jordan and the region as a whole (MENA and Middle East), it is found that the decline in solar panel efficiency is highly dependent on the local weather conditions. While the decline in this study (in northern Jordan) was approximately 13% in three months, it was approximately 0.6% per day in the centre region [41] and between 5% and 16% per month in the southern region [39]. Recent publication of a review paper demonstrates this decline in some countries of the region, where it might exceed 80% as the case in Qatar [45].
Variation of module temperature and ambient temperature throughout the day for clean module and dusty module.
A comprehensive investigation of the effects of shadowing and dust accumulation on a photovoltaic module was performed, providing the following conclusions:
Both hard shadowing and dust accumulation have a significant effect on the performance of photovoltaic modules.
Rain has a significant effect on the cleaning of module surfaces, with increased precipitation resulting in a more thorough cleaning. This impact is more pronounced when modules are tilted, whereas non-tilted modules exhibit inconsistent behaviour.
Measuring and comparing solar radiation intensity beneath clean and dusty glass sheets can provide insight into the influence of dust collection on the performance of solar photovoltaic systems placed in any location.
Accumulation of dust on photovoltaic modules has no significant impact on the module's temperature.
A |
area |
[m2] |
Greek letters |
||
η |
efficiency |
|
Abbreviations |
||
A |
area of solar cell /panel |
|
E |
east |
|
FF |
fill factor |
|
G |
incident radiation density |
|
Imp |
current at maximum power |
|
Isc |
short circuit current |
|
I-V |
current vs voltage plot |
|
N |
north |
|
PV |
photovoltaic |
|
Vmp |
voltage at maximum power |
|
Voc |
open circuit voltage |
|
- Environmental impacts of the oil industry. LAP Lambert Academic Publishing Sunnyvale, CA, USA, 2017, http://www.eolss.net/SampleChapters/C08/E6-185-18.pdf., [Available: 24.03.2023]
- BP statistical review of world energy 2016, 2019, http://oilproduction.net/files/especial-BP/bp-statistical-review-of-world-energy-2016-full-report.pdf., [Available: 24.03.2023]
- Chris dohan, Aaron sikora, Stephan J. bitar, John A. MC Neill, Solar panel peak power tracking system, A major qualifying project of Worcester polytechnic institute, project no, https://digital.wpi.edu/show/vt150n42r., [Available: 24.03.2023]
- ,
Performance stability of photovoltaic modules in different climates ,Progress in Photovoltaics: research and applications , Vol. 25 (12),pp 968-981 , 2017, https://doi.org/https://doi.org/10.1002/pip.2904 - ,
An innovative solution to the overheating problem of PV panels ,Energy conversion and management , Vol. 157 ,pp 452-459 , 2018, https://doi.org/https://doi.org/10.1016/j.enconman.2017.12.017 - An overview of factors affecting the performance of solar PV systems, 2017, https://www.researchgate.net/publication/319165448., [Available: 24.03.2023]
- ,
Study on maximum power point tracking of photovoltaic array in irregular shadow ,International Journal of Electrical Power & Energy Systems , Vol. 66 ,pp 227-234 , 2015, https://doi.org/https://doi.org/10.1016/j.ijepes.2014.10.030 - ,
Effect of dust on the transparent cover of solar collectors ,Energy conversion and management , Vol. 47 (18-19),pp 3192-3203 , 2006, https://doi.org/https://doi.org/10.1016/j.enconman.2006.02.014 - ,
Effect of dust, humidity and air velocity on efficiency of photovoltaic cells ,Renewable and sustainable energy reviews , Vol. 16 (5),pp 2920-2925 , 2012, https://doi.org/https://doi.org/10.1016/j.rser.2012.02.012. - Impact of some environmental variables with dust on solar photovoltaic (PV) performance: review and research status, 2013, https://www.researchgate.net/profile/Zeki-Darwish/publication/263275124_Impact_of_Some_Environmental_Variables_with_Dust_on_Solar_Photovoltaic_PV_Performance_Review_and_Research_Status/links/0c96053a5878cd37c8000000/Impact-of-Some-Environmental-Variables-with-Dust-on-Solar-Photovoltaic-PV-Performance-Review-and-Research-Status.pdf., [Available: 24.03.2023]
- ,
Review on dust depositing on PV module and cleaning techniques ,Journal of Mechanical & Electrical Engineering , Vol. 30 (8),pp 909-913 , 2013, https://doi.org/https://doi.org/10.3390/coatings13010049 - ,
Performance and degradation analysis for long term reliability of solar photovoltaic systems: A review ,Renewable and sustainable energy reviews , Vol. 27 ,pp 753-767 , 2013, https://doi.org/https://doi.org/10.1016/j.rser.2013.07.046 - ,
A comprehensive review of the impact of dust on the use of solar energy: History, investigations, results, literature, and mitigation approaches ,Renewable and sustainable energy Reviews , Vol. 22 ,pp 698-733 , 2013, https://doi.org/https://doi.org/10.1016/j.rser.2012.12.065. - ,
Dust effect on flat surfaces-A review paper ,Renewable and Sustainable Energy Reviews , Vol. 33 ,pp 742-751 , 2014, https://doi.org/https://doi.org/10.1016/j.rser.2014.02.016 - , A review on impacts from dust deposition on photovoltaic modules, in 2018 13th IEEE International Conference on Industry Applications (INDUSCON), 2018: IEEE
- ,
A review of dust accumulation and cleaning methods for solar photovoltaic systems ,Journal of Cleaner Production , Vol. 276 ,pp 123187 , 2020, https://doi.org/https://doi.org/10.1016/j.jclepro.2020.123187 - ,
Monitoring photovoltaic soiling: assessment, challenges, and perspectives of current and potential strategies ,Iscience , Vol. 24 (3),pp 102165 , 2021, https://doi.org/https://doi.org/10.1016/j.isci.2021.102165 - ,
Updated review on soiling of solar photovoltaic systems Morocco and India contributions ,Journal of Cleaner Production , Vol. 311 ,pp 127608 , 2021, https://doi.org/https://doi.org/10.1016/j.jclepro.2021.127608 - ,
Power loss due to soiling on solar panel: A review ,Renewable and Sustainable Energy Reviews , Vol. 59 ,pp 1307-1316 , 2016, https://doi.org/https://doi.org/10.1016/j.rser.2016.01.044 - , Interrelationships Among Non-Uniform Soiling Distributions and PV Module Performance Parameters, Climate Conditions, and Soiling Particle and Module Surface Properties, in 2017 IEEE 44th Photovoltaic Specialist Conference (PVSC), 2017: IEEE
- Avaliação da sujidade em módulos fotovoltaicos em Minas Gerais, Brasil, 2018, www.pvreliability.org/Avaliacao%20da%20sujidade(CBENS).pdf., [Available: 24.03.2023]
- , Effect of dust and weather conditions on photovoltaic performance in Doha, Qatar, in 2015 First Workshop on Smart Grid and Renewable Energy (SGRE), 2015: IEEE
- ,
Performance of flat-plate solar-heat exchangers ,Trans. ASME , Vol. 14 ,pp 91 , 1942, https://doi.org/https://doi.org/10.1115/1.4018980 - ,
Effects of dust on the performance of thermal and photovoltaic flat plate collectors in Saudi Arabia: preliminary results ,Altern. Energy Sources;(United States) , Vol. 1 (CONF-791204-), 1981, https://doi.org/https://doi.org/10.1016/0306-2619(90)90019-A, [Available: 24.03.2023] - ,
The effect of dust on solar photovoltaic systems ,Energy Procedia , Vol. 49 ,pp 2370-2376 , 2014, https://doi.org/https://doi.org/10.1016/j.egypro.2014.03.251 - Dust effect on solar flat surfaces devices in Kuwait, www.scopus.com/record/display.uri?eid=2-s2.0-0344978317&origin=inward&txGid=b081c4fb43321f135a1bcb38fed82274., [Available: 24.03.2023]
- Effect of airborne dust concentration on the performance of PV modules, 2005, www.researchgate.net/publication/278386495., [Available: 24.03.2023]
- ,
Experimental Study on the Effect of Dust Deposition on a Car Park Photovoltaic System with Different Cleaning Cycles ,Sustainability , Vol. 13 (14),pp 7636 , 2021, https://doi.org/https://doi.org/10.3390/su13147636 - ,
Experimental analysis of the effect of dust's physical properties on photovoltaic modules in Northern Oman ,Solar Energy , Vol. 139 ,pp 68-80 , 2016, https://doi.org/https://doi.org/10.1016/j.solener.2016.09.019 - ,
The effect of dust components and contaminants on the performance of photovoltaic for the four regions in Iraq: a practical study ,Renewable Energy and Environmental Sustainability , Vol. 5 ,pp 3 , 2020, https://doi.org/https://doi.org/10.1051/rees/2019009 - , Dust effects on the performance of PV street light in Baghdad city, in 2013 International Renewable and Sustainable Energy Conference (IRSEC), 2013: IEEE
- ,
Experimental investigation of the impact of airborne dust deposition on the performance of solar photovoltaic (PV) modules ,Atmospheric environment , Vol. 45 (25),pp 4299-4304 , 2011, https://doi.org/https://doi.org/10.1016/j.atmosenv.2011.04.084 - ,
Dust accumulation effect on efficiency of Si photovoltaic modules ,Journal of Renewable and Sustainable Energy , Vol. 3 (4),pp 043114 , 2011, https://doi.org/https://doi.org/10.1063/1.3622609 - ,
Influence of dirt accumulation on performance of PV panels ,Energy Procedia , Vol. 50 ,pp 50-56 , 2014, https://doi.org/https://doi.org/10.1016/j.egypro.2014.06.006 - ,
Effect of dirt on transparent covers in flat-plate solar energy collectors ,Solar Energy , Vol. 15 (4),pp 299-302 , 1974, https://doi.org/https://doi.org/10.1016/0038-092X(74)90019-X - ,
Review of photovoltaic technologies ,Renewable and sustainable energy reviews , Vol. 15 (5),pp 2165-2175 , 2011, https://doi.org/https://doi.org/10.1016/j.rser.2011.01.004 - The effect of soiling and periodic cleaning on the performance of solar power plants in Ma'an, Jordan, 2018, https://core.ac.uk/download/pdf/234644061.pdf., [Available: 24.03.2023]
- Effects of dust grain size and density on the monocrystalline PV output power, 2016, www.ijastnet.com/journals/Vol_6_No_1_February_2016/12.pdf., [Available: 24.03.2023]
- ,
Impact of Accumulated Dust on Performance of Two Types of Photovoltaic Cells: Evidence from the South of Jordan ,International Journal of Renewable Energy Development , Vol. 11 (2), 2022, https://doi.org/https://doi.org/10.14710/ijred.2022.42625 - ,
Experimental study on the effect of dust deposition on solar photovoltaic panels in desert environment ,Renewable Energy , Vol. 92 ,pp 499-505 , 2016, https://doi.org/https://doi.org/10.1016/j.renene.2016.02.031 - ,
Modeling and analysis framework for investigating the impact of dust and temperature on PV systems' performance and optimum cleaning frequency ,Applied Sciences , Vol. 9 (7),pp 1397 , 2019, https://doi.org/https://doi.org/10.3390/app9071397 - , Solar Photovoltaic (PV) Power Systems in Jordan: The Past, the Present and the Future?, in Advanced Studies in Energy Efficiency and Built Environment for Developing Countries: Springer, 2019
- ,
A new index for assessing the contribution of energy efficiency in LEED 2009 certified green buildings to achieving UN sustainable development goals in Jordan ,International Journal of Green Energy , Vol. 16 (6),pp 490-499 , 2019, https://doi.org/https://doi.org/10.1080/15435075.2019.1584104 - ,
Climatic Characteristics of Dust Storms in Jordan ,American Journal of Climate Change , Vol. 9 (2),pp 136-146 , 2020, https://doi.org/https://doi.org/10.4236/ajcc.2020.92010 - ,
A review of dust accumulation on PV panels in the MENA and the Far East regions ,Journal of Engineering and Applied Science , Vol. 69 (1),pp 1-29 , 2022, https://doi.org/https://doi.org/10.1186/s44147-021-00052-6